• Cat-intel
  • MedIntelliX
  • Resources
  • About Us
  • Hero Background
    English
    Chinese
    French
    Japanese
    Korean
    German
    Spanish

    Global & US Sodium Tungstate Market Share

    ID: MRFR/CnM/0294-HCR
    115 Pages
    Priya Nagrale
    October 2025

    Global & US Sodium Tungstate Market Research Report, by Application (Catalyst, Permanent Chemical Modifier, Anti-obesity agent, Anti-diabetic Agent) Channel Participants (Metal industry, Research Laboratories, Textile Industry) - Forecast 2030

    Share:
    Download PDF ×

    We do not share your information with anyone. However, we may send you emails based on your report interest from time to time. You may contact us at any time to opt-out.

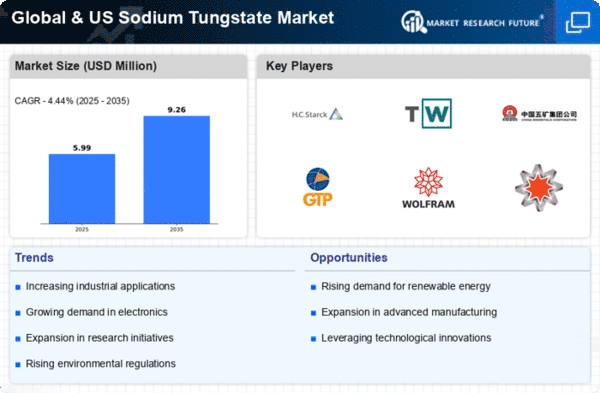
    Global & US Sodium Tungstate Market Infographic
    $ 4,950.0
    $ 5,950.0
    $ 7,250.0

    Market Share

    Global & US Sodium Tungstate Market Share Analysis

    Market share positioning strategies play a pivotal role in the competitiveness of the Global and US Sodium Tungstate Market. In this highly specialized sector, companies deploy various approaches to carve out their share of the market. One prevalent strategy involves differentiation through product quality and purity. By ensuring their sodium tungstate products meet or exceed industry standards, companies can attract discerning customers who prioritize reliability and performance. Moreover, branding and marketing efforts play a crucial role in establishing a distinct identity in the market. Companies invest in building strong brand equity, highlighting their unique selling propositions, and conveying a sense of trustworthiness to potential customers.

    Additionally, pricing strategies serve as a key determinant of market positioning. Some companies opt for a premium pricing strategy, positioning their sodium tungstate products as high-quality, premium offerings targeted at customers willing to pay a premium for superior quality. On the other hand, other companies may adopt a cost leadership strategy, focusing on cost efficiency and offering competitive pricing to capture market share. This approach appeals to price-sensitive customers and enables companies to gain a foothold in the market by offering value for money.

    Furthermore, distribution channels play a crucial role in market share positioning. Companies strategically select distribution channels that enable them to reach their target customers effectively. Whether through direct sales channels, distributors, or online platforms, companies devise distribution strategies that optimize their reach and accessibility to customers. By ensuring widespread availability of their sodium tungstate products, companies can increase their market penetration and capture a larger share of the market.

    Moreover, innovation and product development are instrumental in maintaining a competitive edge in the sodium tungstate market. Companies invest in research and development to introduce innovative products that meet evolving customer needs and preferences. Whether through the development of new formulations, improved manufacturing processes, or enhanced product features, innovation enables companies to differentiate their offerings and stay ahead of the competition.

    Additionally, strategic partnerships and collaborations can significantly impact market share positioning. By forming alliances with complementary businesses, companies can leverage synergies to expand their market reach and access new customer segments. Collaborations with research institutions or academic partners can also facilitate technology transfer and innovation, enabling companies to develop cutting-edge products and maintain their competitive position in the market.

    Furthermore, customer relationship management plays a crucial role in market share positioning. Companies focus on building strong relationships with their customers through personalized service, efficient customer support, and after-sales assistance. By understanding customer needs and preferences, companies can tailor their offerings to better meet customer requirements, enhancing customer satisfaction and loyalty.

    Market Summary

    The Global Sodium Tungstate Market is projected to grow significantly from 450 USD Million in 2024 to 1200 USD Million by 2035.

    Key Market Trends & Highlights

    Sodium Tungstate Key Trends and Highlights

    • The market is expected to experience a compound annual growth rate of 9.33 percent from 2025 to 2035.
    • By 2035, the market valuation is anticipated to reach 1200 USD Million, indicating robust growth potential.
    • In 2024, the market is valued at 450 USD Million, reflecting a solid foundation for future expansion.
    • Growing adoption of sodium tungstate in various applications due to its unique properties is a major market driver.

    Market Size & Forecast

    2024 Market Size 450 (USD Million)
    2035 Market Size 1200 (USD Million)
    CAGR (2025 - 2035) 9.33%
    Largest Regional Market Share in 2024 -)

    Major Players

    Apple Inc (US), Microsoft Corp (US), Amazon.com Inc (US), Alphabet Inc (US), Berkshire Hathaway Inc (US), Tesla Inc (US), Meta Platforms Inc (US), Johnson & Johnson (US), Visa Inc (US), Procter & Gamble Co (US)

    Market Trends

    The global sodium tungstate market appears to be experiencing a steady demand due to its applications in various industries, including electronics and metallurgy, suggesting a potential for growth in the coming years.

    U.S. Geological Survey

    Global & US Sodium Tungstate Market Market Drivers

    Rising Demand in Metallurgy

    The Global Sodium Tungstate Market Industry is witnessing increased demand from the metallurgy sector, where sodium tungstate is utilized in the production of tungsten metal and alloys. Tungsten's unique properties, such as high melting point and density, make it essential for various applications, including aerospace and defense. As global infrastructure projects expand, the need for durable materials is likely to drive the demand for tungsten, thereby benefiting the sodium tungstate market. The anticipated compound annual growth rate of 9.33% from 2025 to 2035 indicates a robust growth trajectory, reflecting the increasing reliance on tungsten-based materials in critical industries.

    Growing Demand in Electronics

    The Global Sodium Tungstate Market Industry is experiencing a surge in demand driven by the electronics sector. Sodium tungstate is utilized in the production of various electronic components, including semiconductors and capacitors. As technology advances, the need for high-performance materials increases, leading to a projected market value of 450 USD Million in 2024. This growth is indicative of the broader trend towards miniaturization and efficiency in electronic devices, which require materials that can withstand high temperatures and provide excellent conductivity. The electronics industry's expansion is expected to significantly contribute to the sodium tungstate market's growth in the coming years.

    Market Trends and Projections

    The Global Sodium Tungstate Market Industry is characterized by a dynamic landscape influenced by various factors. The market is projected to grow from 450 USD Million in 2024 to 1200 USD Million by 2035, reflecting a compound annual growth rate of 9.33% from 2025 to 2035. This growth trajectory is driven by increasing applications in electronics, metallurgy, and chemical industries. Additionally, the rising awareness of environmental sustainability is likely to propel the demand for sodium tungstate as a safer alternative to other materials. The interplay of these trends suggests a robust future for the sodium tungstate market.

    Advancements in Chemical Applications

    The Global Sodium Tungstate Market Industry is benefiting from advancements in chemical applications, particularly in the production of catalysts and reagents. Sodium tungstate is recognized for its effectiveness in various chemical reactions, including those in the pharmaceutical and agricultural sectors. As industries seek more efficient and environmentally friendly processes, the demand for sodium tungstate as a catalyst is likely to increase. This trend aligns with the projected growth of the market, which is expected to reach 1200 USD Million by 2035. The versatility of sodium tungstate in chemical applications positions it as a critical component in the evolving landscape of industrial chemistry.

    Emerging Markets and Industrial Growth

    The Global Sodium Tungstate Market Industry is poised for expansion, particularly in emerging markets where industrial growth is accelerating. Countries in Asia-Pacific and Latin America are increasingly investing in infrastructure and manufacturing, leading to a higher demand for materials like sodium tungstate. This trend is expected to contribute to the market's growth, with projections indicating a market value of 450 USD Million in 2024. As these regions develop their industrial capabilities, the demand for sodium tungstate in various applications, including electronics and metallurgy, is likely to rise, further solidifying its position in the global market.

    Environmental Regulations Favoring Tungsten Use

    The Global Sodium Tungstate Market Industry is positively influenced by stringent environmental regulations that favor the use of tungsten-based materials. Sodium tungstate is often seen as a more environmentally friendly alternative to other heavy metals in various applications. As industries strive to comply with regulations aimed at reducing toxic substances, the demand for sodium tungstate is likely to increase. This shift not only supports the market's growth but also aligns with global sustainability goals. The anticipated growth in market value to 1200 USD Million by 2035 underscores the potential of sodium tungstate to meet both industrial needs and environmental standards.

    Market Segment Insights

    Regional Insights

    Key Companies in the Global & US Sodium Tungstate Market market include

    Industry Developments

    Future Outlook

    Global & US Sodium Tungstate Market Future Outlook

    The Sodium Tungstate Market is projected to grow at a 9.33% CAGR from 2024 to 2035, driven by increasing demand in electronics and renewable energy sectors.

    New opportunities lie in:

    • Develop advanced applications in electronics for enhanced performance.
    • Invest in sustainable production methods to meet regulatory standards.
    • Explore partnerships with renewable energy firms for innovative solutions.

    By 2035, the Sodium Tungstate Market is expected to achieve robust growth, positioning itself as a key player in various industries.

    Market Segmentation

    Market Segmentation

    Europe
    • Western Europe (Germany, France, Italy, Spain, U.K, Rest of Western Europe)
    • Eastern Europe (Poland, Russia)
    Americas
    • North America (US, Canada)
    • Latin America (Argentina, Brazil, Mexico, Rest of LATAM)
    Asia – Pacific
    • Asia (China, India, Japan, South Korea, Rest of Asia)
    • Pacific Countries (Australia, New Zealand)
    Middle East & Africa
    • Middle East (Saudi, Qatar, UAE)
    • Rest of Middle East (Africa, South Africa, Rest of Africa)

    Report Scope

    Attribute/Metric Details
      Market Size   2030 : Significant value
      CAGR   2019–2027: Substantial CAGR
      Base Year   2021
      Forecast Period   2030
      Historical Data   2019 & 2020
      Forecast Units   Value (USD Million)
      Report Coverage    Revenue Forecast, Competitive Landscape, Growth Factors, and Trends
      Segments Covered   Application, Channel Participants
      Geographies Covered   US
      Key Vendors   Kat-Chem Ltd, Ganzhou Grand Sea W& Mo Group Co., Ltd, Yuanhang Tungsten, HCstarck, Taizhou BangDe, Ningxiang Changyi
      Key Market Opportunities   High growing rate for chemical industries
      Key Market Drivers Trend of re-industrialization High productivity and innovation The growth and development of large scale industry and small scale industry

    Market Highlights

    Author

    Priya Nagrale
    Senior Research Analyst

    She holds an experience of about 6+ years in market research and business consulting, working under the spectrum of information communication technology, telecommunications and semiconductor domains. aarti conceptualizes and implements a scalable business strategy and provides strategic leadership to the clients. her expertise lies in market estimation, competitive intelligence, pipeline analysis, customer assessment, etc.

    Leave a Comment

    Latest Comments

    John Doe
    john@example.com

    This is a great article! Really helped me understand the topic better.

    Posted on July 23, 2025, 10:15 AM
    Jane Smith
    jane@domain.com

    Thanks for sharing this. I’ve bookmarked it for later reference.

    Posted on July 22, 2025, 7:45 PM

    FAQs

    Why global & US sodium tungstate market is gaining space in the healthcare industry?

    Global & US sodium tungstate market is getting traction from the healthcare sector as anti-diabetic and anti-obesity agent.

    Mention the players included in the global & US sodium tungstate market report.

    Global & US sodium tungstate market report has players like Yuanhang Tungsten, HCstarck, Kat-Chem Ltd, Taizhou BangDe, Ganzhou Grand Sea W& Mo Group Co., Ltd, Ningxiang Changyi etc.

    Which region is boosting the global & US sodium tungstate market?

    Global & US sodium tungstate market is getting boosted by North America.

    What would trigger the global & US sodium tungstate market in North America?

    Global & US sodium tungstate market would gain leverage from reindustrialization.

    Which country would dominate the global & US sodium tungstate market?

    Global & US sodium tungstate market will be dominated by the US.

    1. . EXECUTIVE’S HANDBOOK
    2. . The Top Performing Segments
    3. . Key Trends Summarized
    4. . Pricing Outlook
    5. . Strategic Insights
    6. . Who are the Key Players in the Market? SECTION II: SCOPING, METHODOLOGY AND MARKET STRUCTURE
    7. . MARKET INTRODUCTION
    8. . Definition
    9. . Report Segmentation & Scope
    10. . Regional & Country Level Coverage
    11. . Why you need this report?
    12. . RESEARCH METHODOLOGY
    13. . Research Process
    14. . Secondary Research
    15. . Data Mining & Condensation
    16. . Sources (Associations, Organizations, Magazines, Paid Databases)
    17. . Primary Research
    18. . Sample Size (Demand-Supply, Company Type, Designations, Region)
    19. . Sources
    20. . Factorial Analysis & Approach Setting
    21. . Estimation & Forecast Models
    22. . Pricing Baskets
    23. . Analyst Hours & Team   SECTION III: QUALITATIVE ANALYSIS
    24. . MARKET DYNAMICS
    25. . Introduction
    26. . Growth Parameters Mapped - Drivers
    27. . Growing demand from global infrastructure projects
    28. . Advances in material science
    29. . What are the challenges faced by Industry Participants?
    30. . Environment safety concerns
    31. . Opportunities
    32. . High growing rate for chemical industries
    33. . Regulatory Update
    34. . Impact Analysis of COVID-19
    35. . Impact on Supply Chain of Sodium Tungstate
    36. . Impact on Market Demand of Sodium Tungstate
    37. . MARKET FACTOR ANALYSIS
    38. . Supply/Value Chain Analysis
    39. . Participants
    40. . Value Percolation Across the Chain
    41. . Integration Levels
    42. . Key Issues Addressed
    43. . Porter’s Five Forces Model
    44. . Bargaining Power of Suppliers
    45. . Bargaining Power of Buyers
    46. . Threat of New Entrants
    47. . Threat of Substitutes
    48. . Intensity of Rivalry
    49. . Pricing Scenario, By Region, 2018 - 2032 SECTION IV: QUANTITATIVE ANALYSIS
    50. . GLOBAL SODIUM TUNGSTATE MARKET, BY APPLICATION (USD MILLION & KILOTONS)
    51. . Introduction
    52. . Catalyst
    53. . Global Sodium Tungstate Market Size: Market Estimates & Forecast, By Catalyst, 2018-2032
    54. . Anti-Diabetes Agent
    55. . Global Sodium Tungstate Market Size: Market Estimates & Forecast, By Anti-Diabetes Agent, 2018-2032
    56. . Anti-Obesity Agent
    57. . Global Sodium Tungstate Market Size: Market Estimates & Forecast, By Anti-Obesity Agent, 2018-2032
    58. . Permanent Chemical Modifiers
    59. . Global Sodium Tungstate Market Size: Market Estimates & Forecast, By Permanent Chemical Modifiers, 2018-2032
    60. . Others
    61. . Global Sodium Tungstate Market Size: Market Estimates & Forecast, By Others, 2018-2032
    62. . GLOBAL SODIUM TUNGSTATE MARKET, BY END-USER (USD MILLION & KILOTONS)
    63. . Introduction
    64. . Textile Industry
    65. . Global Sodium Tungstate Market Size: Market Estimates & Forecast, By Textile Industry, 2018-2032
    66. . Chemical Industry
    67. . Global Sodium Tungstate Market Size: Market Estimates & Forecast, By Chemical Industry, 2018-2032
    68. . Metal Industry
    69. . Global Sodium Tungstate Market Size: Market Estimates & Forecast, By Metal Industry, 2018-2032
    70. . Glass Industry
    71. . Global Sodium Tungstate Market Size: Market Estimates & Forecast, By Glass Industry, 2018-2032
    72. . Healthcare Industry
    73. . Global Sodium Tungstate Market Size: Market Estimates & Forecast, By Healthcare Industry, 2018-2032
    74. . Others
    75. . Global Sodium Tungstate Market Size: Market Estimates & Forecast, By Others, 2018-2032
    76. . GLOBAL SODIUM TUNGSTATE MARKET, BY REGION (USD MILLION & KILOTONS)
    77. . Introduction
    78. . North America
    79. . North America Sodium Tungstate Market Size: Market Estimates & Forecast, By Country, 2018-2032
    80. . North America Sodium Tungstate Market Size: Market Estimates & Forecast, By Application, 2018-2032
    81. . North America Sodium Tungstate Market Size: Market Estimates & Forecast, By End-User, 2018-2032
    82. . US
    83. . US Sodium Tungstate Market Size: Market Estimates & Forecast, By Application, 2018-2032
    84. . US Sodium Tungstate Market Size: Market Estimates & Forecast, By End-User, 2018-2032
    85. . Canada
    86. . Canada Sodium Tungstate Market Size: Market Estimates & Forecast, By Application, 2018-2032
    87. . Canada Sodium Tungstate Market Size: Market Estimates & Forecast, By End-User, 2018-2032
    88. . Mexico
    89. . Mexico Sodium Tungstate Market Size: Market Estimates & Forecast, By Application, 2018-2032
    90. . Mexico Sodium Tungstate Market Size: Market Estimates & Forecast, By End-User, 2018-2032
    91. . Europe
    92. . Europe Sodium Tungstate Market Size: Market Estimates & Forecast, By Country, 2018-2032
    93. . Europe Sodium Tungstate Market Size: Market Estimates & Forecast, By Application, 2018-2032
    94. . Europe Sodium Tungstate Market Size: Market Estimates & Forecast, By End-User, 2018-2032
    95. . Germany
    96. . Germany Sodium Tungstate Market Size: Market Estimates & Forecast, By Application, 2018-2032
    97. . Germany Sodium Tungstate Market Size: Market Estimates & Forecast, By End-User, 2018-2032
    98. . France
    99. . France Sodium Tungstate Market Size: Market Estimates & Forecast, By Application, 2018-2032
    100. . France Sodium Tungstate Market Size: Market Estimates & Forecast, By End-User, 2018-2032
    101. . UK
    102. . UK Sodium Tungstate Market Size: Market Estimates & Forecast, By Application, 2018-2032
    103. . UK Sodium Tungstate Market Size: Market Estimates & Forecast, By End-User, 2018-2032
    104. . Spain
    105. . Spain Sodium Tungstate Market Size: Market Estimates & Forecast, By Application, 2018-2032
    106. . Spain Sodium Tungstate Market Size: Market Estimates & Forecast, By End-User, 2018-2032
    107. . Italy
    108. . Italy Sodium Tungstate Market Size: Market Estimates & Forecast, By Application, 2018-2032
    109. . Italy Sodium Tungstate Market Size: Market Estimates & Forecast, By End-User, 2018-2032
    110. . Rest of Europe
    111. . Rest of Europe Sodium Tungstate Market Size: Market Estimates & Forecast, By Application, 2018-2032
    112. . Rest of Europe Sodium Tungstate Market Size: Market Estimates & Forecast, By End-User, 2018-2032
    113. . Asia-Pacific
    114. . Asia-Pacific Sodium Tungstate Market Size: Market Estimates & Forecast, By Country, 2018-2032
    115. . Asia-Pacific Sodium Tungstate Market Size: Market Estimates & Forecast, By Application, 2018-2032
    116. . Asia-Pacific Sodium Tungstate Market Size: Market Estimates & Forecast, By End-User, 2018-2032
    117. . China
    118. . China Sodium Tungstate Market Size: Market Estimates & Forecast, By Application, 2018-2032
    119. . China Sodium Tungstate Market Size: Market Estimates & Forecast, By End-User, 2018-2032
    120. . India
    121. . India Sodium Tungstate Market Size: Market Estimates & Forecast, By Application, 2018-2032
    122. . India Sodium Tungstate Market Size: Market Estimates & Forecast, By End-User, 2018-2032
    123. . Japan
    124. . Japan Sodium Tungstate Market Size: Market Estimates & Forecast, By Application, 2018-2032
    125. . Japan Sodium Tungstate Market Size: Market Estimates & Forecast, By End-User, 2018-2032
    126. . South Korea
    127. . South Korea Sodium Tungstate Market Size: Market Estimates & Forecast, By Application, 2018-2032
    128. . South Korea Sodium Tungstate Market Size: Market Estimates & Forecast, By End-User, 2018-2032
    129. . Rest of Asia-Pacific
    130. . Rest of Asia-Pacific Sodium Tungstate Market Size: Market Estimates & Forecast, By Application, 2018-2032
    131. . Rest of Asia-Pacific Sodium Tungstate Market Size: Market Estimates & Forecast, By End-User, 2018-2032
    132. . Middle East & Africa
    133. . Middle East & Africa Sodium Tungstate Market Size: Market Estimates & Forecast, By Country, 2018-2032
    134. . Middle East & Africa Sodium Tungstate Market Size: Market Estimates & Forecast, By Application, 2018-2032
    135. . Middle East & Africa Sodium Tungstate Market Size: Market Estimates & Forecast, By End-User, 2018-2032
    136. . Saudi Arabia
    137. . Saudi Arabia Sodium Tungstate Market Size: Market Estimates & Forecast, By Application, 2018-2032
    138. . Saudi Arabia Sodium Tungstate Market Size: Market Estimates & Forecast, By End-User, 2018-2032
    139. . UAE
    140. . UAE Sodium Tungstate Market Size: Market Estimates & Forecast, By Application, 2018-2032
    141. . UAE Sodium Tungstate Market Size: Market Estimates & Forecast, By End-User, 2018-2032
    142. . South Africa
    143. . South Africa Sodium Tungstate Market Size: Market Estimates & Forecast, By Application, 2018-2032
    144. . South Africa Sodium Tungstate Market Size: Market Estimates & Forecast, By End-User, 2018-2032
    145. . Rest of Middle East & Africa
    146. . Rest of Middle East & Africa Sodium Tungstate Market Size: Market Estimates & Forecast, By Country, 2018-2032
    147. . Rest of Middle East & Africa Sodium Tungstate Market Size: Market Estimates & Forecast, By Application, 2018-2032
    148. . Rest of Middle East & Africa Sodium Tungstate Market Size: Market Estimates & Forecast, By End-User, 2018-2032
    149. . South America
    150. . South America Sodium Tungstate Market Size: Market Estimates & Forecast, By Country, 2018-2032
    151. . South America Sodium Tungstate Market Size: Market Estimates & Forecast, By Application, 2018-2032
    152. . South America Sodium Tungstate Market Size: Market Estimates & Forecast, By End-User, 2018-2032
    153. . Brazil
    154. . Brazil Sodium Tungstate Market Size: Market Estimates & Forecast, By Application, 2018-2032
    155. . Brazil Sodium Tungstate Market Size: Market Estimates & Forecast, By End-User, 2018-2032
    156. . Argentina
    157. . Argentina Sodium Tungstate Market Size: Market Estimates & Forecast, By Application, 2018-2032
    158. . Argentina Sodium Tungstate Market Size: Market Estimates & Forecast, By End-User, 2018-2032
    159. . Rest of South America
    160. . Rest of South America Sodium Tungstate Market Size: Market Estimates & Forecast, By Application, 2018-2032
    161. . Rest of South America Sodium Tungstate Market Size: Market Estimates & Forecast, By End-User, 2018-2032 SECTION V: COMPETITIVE ANALYSIS
    162. . COMPETITIVE LANDSCAPE
    163. . Introduction
    164. . Competition Dashboard
    165. . Company Market Share Analysis, 2022
    166. . Who are the market disruptors & innovators?
    167. . What strategies are being adopted by market leaders?
    168. . Competitive Benchmarking
    169. . The Leading Player in terms of Number of Developments in the Global Sodium Tungstate Market
    170. . List of Key Players, By Region
    171. . Comparative Analysis: Key Players Financial
    172. . Key Developments & Growth Strategies
    173. . New Product Launch/Service Deployment
    174. . Merger & Acquisition
    175. . Joint Ventures
    176. . COMPANY PROFILES
    177. . Chem-Met
    178. . Company Overview
    179. . Financial Overview
    180. . Product Offered
    181. . Key Developments
    182. . SWOT Analysis
    183. . Key Strategies
    184. . Nova Oleochem
    185. . Company Overview
    186. . Financial Overview
    187. . Product Offered
    188. . Key Developments
    189. . SWOT Analysis
    190. . Key Strategies
    191. . Ningxiang Changyi
    192. . Company Overview
    193. . Financial Overview
    194. . Product Offered
    195. . Key Developments
    196. . SWOT Analysis
    197. . Key Strategies
    198. . Anchor Chemicals
    199. . Company Overview
    200. . Financial Overview
    201. . Product Offered
    202. . Key Developments
    203. . SWOT Analysis
    204. . Key Strategies
    205. . Alpha Chem
    206. . Company Overview
    207. . Financial Overview
    208. . Product Offered
    209. . Key Developments
    210. . SWOT Analysis
    211. . Key Strategies
    212. . Taizhou BangDe
    213. . Company Overview
    214. . Financial Overview
    215. . Product Offered
    216. . Key Developments
    217. . SWOT Analysis
    218. . Key Strategies
    219. . Kat-Chem Ltd.
    220. . Company Overview
    221. . Financial Overview
    222. . Product Offered
    223. . Key Developments
    224. . SWOT Analysis
    225. . Key Strategies
    226. . Yuanhang Tungsten
    227. . Company Overview
    228. . Financial Overview
    229. . Product Offered
    230. . Key Developments
    231. . SWOT Analysis
    232. . Key Strategies
    233. . Ganzhou Grand Sea W& Mo Group Co.
    234. . Company Overview
    235. . Financial Overview
    236. . Product Offered
    237. . Key Developments
    238. . SWOT Analysis
    239. . Key Strategies
    240. . HCstarck
    241. . Company Overview
    242. . Financial Overview
    243. . Product Offered
    244. . Key Developments
    245. . SWOT Analysis
    246. . Key Strategies
    247. . RECOMMENDATIONS & EXPERT INSIGHTS
    248. . What is the short-term vs long-term outlook for Sodium Tungstate Market?
    249. . Who are the players to look out for?
    250. . What will the product mix look in coming years?
    251. . MRFR OFFERINGS & TEAM
    252. . Citations & Media
    253. . Our Regional Representatives
    254. . Related Reports
    255. . Our Domain Coverage   LIST OF TABLES TABLE
    256. . LIST OF ASSUMPTIONS TABLE
    257. . SODIUM TUNGSTATE MARKET ESTIMATES & FORECAST, BY APPLICATION, 2018-2032 (USD MILLION) TABLE
    258. . SODIUM TUNGSTATE MARKET ESTIMATES & FORECAST, BY END-USER, 2018-2032 (USD MILLION) TABLE
    259. . GLOBAL SODIUM TUNGSTATE MARKET, BY REGION, 2018-2032 (USD MILLION) TABLE
    260. . NORTH AMERICA: SODIUM TUNGSTATE MARKET, BY COUNTRY, 2018-2032 (USD MILLION) TABLE
    261. . NORTH AMERICA: SODIUM TUNGSTATE MARKET, BY COUNTRY, 2018-2032 (IN KILOTONS) TABLE
    262. . NORTH AMERICA: SODIUM TUNGSTATE MARKET, BY APPLICATION, 2018-2032 (USD MILLION) TABLE
    263. . NORTH AMERICA: SODIUM TUNGSTATE MARKET, BY APPLICATION, 2018-2032 (IN KILOTONS) TABLE
    264. . NORTH AMERICA: SODIUM TUNGSTATE MARKET, BY END-USER, 2018-2032 (USD MILLION) TABLE
    265. . NORTH AMERICA: SODIUM TUNGSTATE MARKET, BY END-USER, 2018-2032 (IN KILOTONS) TABLE
    266. . U.S.: SODIUM TUNGSTATE MARKET, BY APPLICATION, 2018-2032 (USD MILLION) TABLE
    267. . U.S.: SODIUM TUNGSTATE MARKET, BY APPLICATION, 2018-2032 (IN KILOTONS) TABLE
    268. . U.S.: SODIUM TUNGSTATE MARKET, BY END-USER, 2018-2032 (USD MILLION) TABLE
    269. . U.S.: SODIUM TUNGSTATE MARKET, BY END-USER, 2018-2032 (IN KILOTONS) TABLE
    270. . CANADA: SODIUM TUNGSTATE MARKET, BY APPLICATION, 2018-2032 (USD MILLION) TABLE
    271. . CANADA: SODIUM TUNGSTATE MARKET, BY APPLICATION, 2018-2032 (IN KILOTONS) TABLE
    272. . CANADA: SODIUM TUNGSTATE MARKET, BY END-USER, 2018-2032 (USD MILLION) TABLE
    273. . CANADA: SODIUM TUNGSTATE MARKET, BY END-USER, 2018-2032 (IN KILOTONS) TABLE
    274. . MEXICO: SODIUM TUNGSTATE MARKET, BY APPLICATION, 2018-2032 (USD MILLION) TABLE
    275. . MEXICO: SODIUM TUNGSTATE MARKET, BY APPLICATION, 2018-2032 (IN KILOTONS) TABLE
    276. . MEXICO: SODIUM TUNGSTATE MARKET, BY END-USER, 2018-2032 (USD MILLION) TABLE
    277. . MEXICO: SODIUM TUNGSTATE MARKET, BY END-USER, 2018-2032 (IN KILOTONS) TABLE
    278. . EUROPE: SODIUM TUNGSTATE MARKET, BY COUNTRY, 2018-2032 (USD MILLION) TABLE
    279. . EUROPE: SODIUM TUNGSTATE MARKET, BY COUNTRY, 2018-2032 (IN KILOTONS) TABLE
    280. . EUROPE: SODIUM TUNGSTATE MARKET, BY APPLICATION, 2018-2032 (USD MILLION) TABLE
    281. . EUROPE: SODIUM TUNGSTATE MARKET, BY APPLICATION, 2018-2032 (IN KILOTONS) TABLE
    282. . EUROPE: SODIUM TUNGSTATE MARKET, BY END-USER, 2018-2032 (USD MILLION) TABLE
    283. . EUROPE: SODIUM TUNGSTATE MARKET, BY END-USER, 2018-2032 (IN KILOTONS) TABLE
    284. . GERMANY: SODIUM TUNGSTATE MARKET, BY APPLICATION, 2018-2032 (USD MILLION) TABLE
    285. . GERMANY: SODIUM TUNGSTATE MARKET, BY APPLICATION, 2018-2032 (IN KILOTONS) TABLE
    286. . GERMANY: SODIUM TUNGSTATE MARKET, BY END-USER, 2018-2032 (USD MILLION) TABLE
    287. . GERMANY: SODIUM TUNGSTATE MARKET, BY END-USER, 2018-2032 (IN KILOTONS) TABLE
    288. . FRANCE: SODIUM TUNGSTATE MARKET, BY APPLICATION, 2018-2032 (USD MILLION) TABLE
    289. . FRANCE: SODIUM TUNGSTATE MARKET, BY APPLICATION, 2018-2032 (IN KILOTONS) TABLE
    290. . FRANCE: SODIUM TUNGSTATE MARKET, BY END-USER, 2018-2032 (USD MILLION) TABLE
    291. . FRANCE: SODIUM TUNGSTATE MARKET, BY END-USER, 2018-2032 (IN KILOTONS) TABLE
    292. . UK: SODIUM TUNGSTATE MARKET, BY APPLICATION, 2018-2032 (USD MILLION) TABLE
    293. . UK: SODIUM TUNGSTATE MARKET, BY APPLICATION, 2018-2032 (IN KILOTONS) TABLE
    294. . UK: SODIUM TUNGSTATE MARKET, BY END-USER, 2018-2032 (USD MILLION) TABLE
    295. . UK: SODIUM TUNGSTATE MARKET, BY END-USER, 2018-2032 (IN KILOTONS) TABLE
    296. . SPAIN: SODIUM TUNGSTATE MARKET, BY APPLICATION, 2018-2032 (USD MILLION) TABLE
    297. . SPAIN: SODIUM TUNGSTATE MARKET, BY APPLICATION, 2018-2032 (IN KILOTONS) TABLE
    298. . SPAIN: SODIUM TUNGSTATE MARKET, BY END-USER, 2018-2032 (USD MILLION) TABLE
    299. . SPAIN: SODIUM TUNGSTATE MARKET, BY END-USER, 2018-2032 (IN KILOTONS) TABLE
    300. . ITALY: SODIUM TUNGSTATE MARKET, BY APPLICATION, 2018-2032 (USD MILLION) TABLE
    301. . ITALY: SODIUM TUNGSTATE MARKET, BY APPLICATION, 2018-2032 (IN KILOTONS) TABLE
    302. . ITALY: SODIUM TUNGSTATE MARKET, BY END-USER, 2018-2032 (USD MILLION) TABLE
    303. . ITALY: SODIUM TUNGSTATE MARKET, BY END-USER, 2018-2032 (IN KILOTONS) TABLE
    304. . REST OF EUROPE: SODIUM TUNGSTATE MARKET, BY COUNTRY, 2018-2032 (USD MILLION) TABLE
    305. . REST OF EUROPE: SODIUM TUNGSTATE MARKET, BY COUNTRY, 2018-2032 (IN KILOTONS) TABLE
    306. . REST OF EUROPE: SODIUM TUNGSTATE MARKET, BY APPLICATION, 2018-2032 (USD MILLION) TABLE
    307. . REST OF EUROPE: SODIUM TUNGSTATE MARKET, BY APPLICATION, 2018-2032 (IN KILOTONS) TABLE
    308. . REST OF EUROPE: SODIUM TUNGSTATE MARKET, BY END-USER, 2018-2032 (USD MILLION) TABLE
    309. . REST OF EUROPE: SODIUM TUNGSTATE MARKET, BY END-USER, 2018-2032 (IN KILOTONS) TABLE
    310. . ASIA PACIFIC: SODIUM TUNGSTATE MARKET, BY COUNTRY, 2018-2032 (USD MILLION) TABLE
    311. . ASIA PACIFIC: SODIUM TUNGSTATE MARKET, BY COUNTRY, 2018-2032 (IN KILOTONS) TABLE
    312. . ASIA PACIFIC: SODIUM TUNGSTATE MARKET, BY APPLICATION, 2018-2032 (USD MILLION) TABLE
    313. . ASIA PACIFIC: SODIUM TUNGSTATE MARKET, BY APPLICATION, 2018-2032 (IN KILOTONS) TABLE
    314. . ASIA PACIFIC: SODIUM TUNGSTATE MARKET, BY END-USER, 2018-2032 (USD MILLION) TABLE
    315. . ASIA PACIFIC: SODIUM TUNGSTATE MARKET, BY END-USER, 2018-2032 (IN KILOTONS) TABLE
    316. . CHINA: SODIUM TUNGSTATE MARKET, BY APPLICATION, 2018-2032 (USD MILLION) TABLE
    317. . CHINA: SODIUM TUNGSTATE MARKET, BY APPLICATION, 2018-2032 (IN KILOTONS) TABLE
    318. . CHINA: SODIUM TUNGSTATE MARKET, BY END-USER, 2018-2032 (USD MILLION) TABLE
    319. . CHINA: SODIUM TUNGSTATE MARKET, BY END-USER, 2018-2032 (IN KILOTONS) TABLE
    320. . INDIA: SODIUM TUNGSTATE MARKET, BY APPLICATION, 2018-2032 (USD MILLION) TABLE
    321. . INDIA: SODIUM TUNGSTATE MARKET, BY APPLICATION, 2018-2032 (IN KILOTONS) TABLE
    322. . INDIA: SODIUM TUNGSTATE MARKET, BY END-USER, 2018-2032 (USD MILLION) TABLE
    323. . INDIA: SODIUM TUNGSTATE MARKET, BY END-USER, 2018-2032 (IN KILOTONS) TABLE
    324. . JAPAN: SODIUM TUNGSTATE MARKET, BY APPLICATION, 2018-2032 (USD MILLION) TABLE
    325. . JAPAN: SODIUM TUNGSTATE MARKET, BY APPLICATION, 2018-2032 (IN KILOTONS) TABLE
    326. . JAPAN: SODIUM TUNGSTATE MARKET, BY END-USER, 2018-2032 (USD MILLION) TABLE
    327. . JAPAN: SODIUM TUNGSTATE MARKET, BY END-USER, 2018-2032 (IN KILOTONS) TABLE
    328. . SOUTH KOREA: SODIUM TUNGSTATE MARKET, BY APPLICATION, 2018-2032 (USD MILLION) TABLE
    329. . SOUTH KOREA: SODIUM TUNGSTATE MARKET, BY APPLICATION, 2018-2032 (IN KILOTONS) TABLE
    330. . SOUTH KOREA: SODIUM TUNGSTATE MARKET, BY END-USER, 2018-2032 (USD MILLION) TABLE
    331. . SOUTH KOREA: SODIUM TUNGSTATE MARKET, BY END-USER, 2018-2032 (IN KILOTONS) TABLE
    332. . REST OF ASIA PACIFIC: SODIUM TUNGSTATE MARKET, BY COUNTRY, 2018-2032 (USD MILLION) TABLE
    333. . REST OF ASIA PACIFIC: SODIUM TUNGSTATE MARKET, BY COUNTRY, 2018-2032 (IN KILOTONS) TABLE
    334. . REST OF ASIA PACIFIC: SODIUM TUNGSTATE MARKET, BY APPLICATION, 2018-2032 (USD MILLION) TABLE
    335. . REST OF ASIA PACIFIC: SODIUM TUNGSTATE MARKET, BY APPLICATION, 2018-2032 (IN KILOTONS) TABLE
    336. . REST OF ASIA PACIFIC: SODIUM TUNGSTATE MARKET, BY END-USER, 2018-2032 (USD MILLION) TABLE
    337. . REST OF ASIA PACIFIC: SODIUM TUNGSTATE MARKET, BY END-USER, 2018-2032 (IN KILOTONS) TABLE
    338. . MIDDLE EAST & AFRICA: SODIUM TUNGSTATE MARKET, BY COUNTRY, 2018-2032 (USD MILLION) TABLE
    339. . MIDDLE EAST & AFRICA: SODIUM TUNGSTATE MARKET, BY COUNTRY, 2018-2032 (IN KILOTONS) TABLE
    340. . MIDDLE EAST & AFRICA: SODIUM TUNGSTATE MARKET, BY APPLICATION, 2018-2032 (USD MILLION) TABLE
    341. . MIDDLE EAST & AFRICA: SODIUM TUNGSTATE MARKET, BY APPLICATION, 2018-2032 (IN KILOTONS) TABLE
    342. . MIDDLE EAST & AFRICA: SODIUM TUNGSTATE MARKET, BY END-USER, 2018-2032 (USD MILLION) TABLE
    343. . MIDDLE EAST & AFRICA: SODIUM TUNGSTATE MARKET, BY END-USER, 2018-2032 (IN KILOTONS) TABLE
    344. . SAUDI ARABIA: SODIUM TUNGSTATE MARKET, BY APPLICATION, 2018-2032 (USD MILLION) TABLE
    345. . SAUDI ARABIA: SODIUM TUNGSTATE MARKET, BY APPLICATION, 2018-2032 (IN KILOTONS) TABLE
    346. . SAUDI ARABIA: SODIUM TUNGSTATE MARKET, BY END-USER, 2018-2032 (USD MILLION) TABLE
    347. . SAUDI ARABIA: SODIUM TUNGSTATE MARKET, BY END-USER, 2018-2032 (IN KILOTONS) TABLE
    348. . UAE: SODIUM TUNGSTATE MARKET, BY APPLICATION, 2018-2032 (USD MILLION) TABLE
    349. . UAE: SODIUM TUNGSTATE MARKET, BY APPLICATION, 2018-2032 (IN KILOTONS) TABLE
    350. . UAE: SODIUM TUNGSTATE MARKET, BY END-USER, 2018-2032 (USD MILLION) TABLE
    351. . UAE: SODIUM TUNGSTATE MARKET, BY END-USER, 2018-2032 (IN KILOTONS) TABLE
    352. . SOUTH AFRICA: SODIUM TUNGSTATE MARKET, BY APPLICATION, 2018-2032 (USD MILLION) TABLE
    353. . SOUTH AFRICA: SODIUM TUNGSTATE MARKET, BY APPLICATION, 2018-2032 (IN KILOTONS) TABLE
    354. . SOUTH AFRICA: SODIUM TUNGSTATE MARKET, BY END-USER, 2018-2032 (USD MILLION) TABLE
    355. . SOUTH AFRICA: SODIUM TUNGSTATE MARKET, BY END-USER, 2018-2032 (IN KILOTONS) TABLE
    356. . REST OF MIDDLE EAST & AFRICA: SODIUM TUNGSTATE MARKET, BY COUNTRY, 2018-2032 (USD MILLION) TABLE
    357. . REST OF MIDDLE EAST & AFRICA: SODIUM TUNGSTATE MARKET, BY COUNTRY, 2018-2032 (IN KILOTONS) TABLE
    358. . REST OF MIDDLE EAST & AFRICA: SODIUM TUNGSTATE MARKET, BY APPLICATION, 2018-2032 (USD MILLION) TABLE
    359. . REST OF MIDDLE EAST & AFRICA: SODIUM TUNGSTATE MARKET, BY APPLICATION, 2018-2032 (IN KILOTONS) TABLE
    360. . REST OF MIDDLE EAST & AFRICA: SODIUM TUNGSTATE MARKET, BY END-USER, 2018-2032 (USD MILLION) TABLE
    361. . REST OF MIDDLE EAST & AFRICA: SODIUM TUNGSTATE MARKET, BY END-USER, 2018-2032 (IN KILOTONS) TABLE
    362. . SOUTH AMERICA: SODIUM TUNGSTATE MARKET, BY COUNTRY, 2018-2032 (USD MILLION) TABLE
    363. . SOUTH AMERICA: SODIUM TUNGSTATE MARKET, BY COUNTRY, 2018-2032 (IN KILOTONS) TABLE
    364. . SOUTH AMERICA: SODIUM TUNGSTATE MARKET, BY APPLICATION, 2018-2032 (USD MILLION) TABLE
    365. . SOUTH AMERICA: SODIUM TUNGSTATE MARKET, BY APPLICATION, 2018-2032 (IN KILOTONS) TABLE
    366. . SOUTH AMERICA: SODIUM TUNGSTATE MARKET, BY END-USER, 2018-2032 (USD MILLION) TABLE
    367. . SOUTH AMERICA: SODIUM TUNGSTATE MARKET, BY END-USER, 2018-2032 (IN KILOTONS) TABLE
    368. . BRAZIL: SODIUM TUNGSTATE MARKET, BY APPLICATION, 2018-2032 (USD MILLION) TABLE
    369. . BRAZIL: SODIUM TUNGSTATE MARKET, BY APPLICATION, 2018-2032 (IN KILOTONS) TABLE
    370. . BRAZIL: SODIUM TUNGSTATE MARKET, BY END-USER, 2018-2032 (USD MILLION) TABLE
    371. . BRAZIL: SODIUM TUNGSTATE MARKET, BY END-USER, 2018-2032 (IN KILOTONS) TABLE
    372. . ARGENTINA: SODIUM TUNGSTATE MARKET, BY APPLICATION, 2018-2032 (USD MILLION) TABLE
    373. . ARGENTINA: SODIUM TUNGSTATE MARKET, BY APPLICATION, 2018-2032 (IN KILOTONS) TABLE
    374. . ARGENTINA: SODIUM TUNGSTATE MARKET, BY END-USER, 2018-2032 (USD MILLION) TABLE
    375. . ARGENTINA: SODIUM TUNGSTATE MARKET, BY END-USER, 2018-2032 (IN KILOTONS) TABLE
    376. . REST OF SOUTH AMERICA: SODIUM TUNGSTATE MARKET, BY COUNTRY, 2018-2032 (USD MILLION) TABLE
    377. . REST OF SOUTH AMERICA: SODIUM TUNGSTATE MARKET, BY COUNTRY, 2018-2032 (IN KILOTONS) TABLE
    378. . REST OF SOUTH AMERICA: SODIUM TUNGSTATE MARKET, BY APPLICATION, 2018-2032 (USD MILLION) TABLE
    379. . REST OF SOUTH AMERICA: SODIUM TUNGSTATE MARKET, BY APPLICATION, 2018-2032 (IN KILOTONS) TABLE
    380. . REST OF SOUTH AMERICA: SODIUM TUNGSTATE MARKET, BY END-USER, 2018-2032 (USD MILLION) TABLE
    381. . REST OF SOUTH AMERICA: SODIUM TUNGSTATE MARKET, BY END-USER, 2018-2032 (IN KILOTONS)   LIST OF FIGURES FIGURE
    382. . MARKET SYNOPSIS FIGURE
    383. . MARKET ATTRACTIVENESS ANALYSIS: GLOBAL SODIUM TUNGSTATE MARKET FIGURE
    384. . GLOBAL SODIUM TUNGSTATE MARKET ANALYSIS BY APPLICATION FIGURE
    385. . GLOBAL SODIUM TUNGSTATE MARKET ANALYSIS BY END-USER FIGURE
    386. . GLOBAL SODIUM TUNGSTATE MARKET ANALYSIS BY REGION FIGURE
    387. . GLOBAL SODIUM TUNGSTATE MARKET: MARKET STRUCTURE FIGURE
    388. . KEY BUYING CRITERIA OF SODIUM TUNGSTATE FIGURE
    389. . RESEARCH PROCESS OF MRFR FIGURE
    390. . NORTH AMERICA MARKET SIZE & MARKET SHARE BY COUNTRY (2023 VS 2032) FIGURE
    391. . EUROPE MARKET SIZE & MARKET SHARE BY COUNTRY (2023 VS 2032) FIGURE
    392. . ASIA-PACIFIC & MARKET SHARE BY COUNTRY (2023 VS 2032) FIGURE
    393. . MIDDLE EAST & AFRICA MARKET SIZE & MARKET SHARE BY COUNTRY (2023 VS 2032) FIGURE
    394. . SOUTH AMERICA MARKET SIZE & MARKET SHARE BY COUNTRY (2023 VS 2032) FIGURE
    395. . DROC ANALYSIS OF GLOBAL SODIUM TUNGSTATE MARKET FIGURE
    396. . DRIVERS IMPACT ANALYSIS: SODIUM TUNGSTATE MARKET FIGURE
    397. . RESTRAINTS IMPACT ANALYSIS: SODIUM TUNGSTATE MARKET FIGURE
    398. . SUPPLY / VALUE CHAIN: GLOBAL SODIUM TUNGSTATE MARKET FIGURE
    399. . GLOBAL SODIUM TUNGSTATE MARKET, BY APPLICATION, 2022 (% SHARE) FIGURE
    400. . GLOBAL SODIUM TUNGSTATE MARKET, BY APPLICATION, 2023 TO 2032 (USD MILLION) FIGURE
    401. . GLOBAL SODIUM TUNGSTATE MARKET, BY APPLICATION, 2023 TO 2032 (IN KILOTONS) FIGURE
    402. . GLOBAL SODIUM TUNGSTATE MARKET, BY END-USER, 2022 (% SHARE) FIGURE
    403. . GLOBAL SODIUM TUNGSTATE MARKET, BY END-USER, 2023 TO 2032 (USD MILLION) FIGURE
    404. . GLOBAL SODIUM TUNGSTATE MARKET, BY END-USER, 2023 TO 2032 (IN KILOTONS)
    405. List of Tables and Figures
      1. Table FIGURE 1. MARKET SYNOPSIS FIGURE 2. MARKET ATTRACTIVENESS ANALYSIS: GLOBAL SODIUM TUNGSTATE MARKET FIGURE 3. GLOBAL SODIUM TUNGSTATE MARKET ANALYSIS BY APPLICATION FIGURE 4. GLOBAL SODIUM TUNGSTATE MARKET ANALYSIS BY END-USER FIGURE 5. GLOBAL SODIUM TUNGSTATE MARKET ANALYSIS BY REGION FIGURE 6. GLOBAL SODIUM TUNGSTATE MARKET: MARKET STRUCTURE FIGURE 7. KEY BUYING CRITERIA OF SODIUM TUNGSTATE FIGURE 8. RESEARCH PROCESS OF MRFR FIGURE 9. NORTH AMERICA MARKET SIZE & MARKET SHARE BY COUNTRY (2023 VS 2032) FIGURE 10. EUROPE MARKET SIZE & MARKET SHARE BY COUNTRY (2023 VS 2032) FIGURE 11. ASIA-PACIFIC & MARKET SHARE BY COUNTRY (2023 VS 2032) FIGURE 12. MIDDLE EAST & AFRICA MARKET SIZE & MARKET SHARE BY COUNTRY (2023 VS 2032) FIGURE 13. SOUTH AMERICA MARKET SIZE & MARKET SHARE BY COUNTRY (2023 VS 2032) FIGURE 14. DROC ANALYSIS OF GLOBAL SODIUM TUNGSTATE MARKET FIGURE 15. DRIVERS IMPACT ANALYSIS: SODIUM TUNGSTATE MARKET FIGURE 16. RESTRAINTS IMPACT ANALYSIS: SODIUM TUNGSTATE MARKET FIGURE 17. SUPPLY / VALUE CHAIN: GLOBAL SODIUM TUNGSTATE MARKET FIGURE 18. GLOBAL SODIUM TUNGSTATE MARKET, BY APPLICATION, 2022 (% SHARE) FIGURE 19. GLOBAL SODIUM TUNGSTATE MARKET, BY APPLICATION, 2023 TO 2032 (USD MILLION) FIGURE 20. GLOBAL SODIUM TUNGSTATE MARKET, BY APPLICATION, 2023 TO 2032 (IN KILOTONS) FIGURE 21. GLOBAL SODIUM TUNGSTATE MARKET, BY END-USER, 2022 (% SHARE) FIGURE 22. GLOBAL SODIUM TUNGSTATE MARKET, BY END-USER, 2023 TO 2032 (USD MILLION) FIGURE 23. GLOBAL SODIUM TUNGSTATE MARKET, BY END-USER, 2023 TO 2032 (IN KILOTONS)
    406. Table FIGURE 1. MARKET SYNOPSIS FIGURE 2. MARKET ATTRACTIVENESS ANALYSIS: GLOBAL SODIUM TUNGSTATE MARKET FIGURE 3. GLOBAL SODIUM TUNGSTATE MARKET ANALYSIS BY APPLICATION FIGURE 4. GLOBAL SODIUM TUNGSTATE MARKET ANALYSIS BY END-USER FIGURE 5. GLOBAL SODIUM TUNGSTATE MARKET ANALYSIS BY REGION FIGURE 6. GLOBAL SODIUM TUNGSTATE MARKET: MARKET STRUCTURE FIGURE 7. KEY BUYING CRITERIA OF SODIUM TUNGSTATE FIGURE 8. RESEARCH PROCESS OF MRFR FIGURE 9. NORTH AMERICA MARKET SIZE & MARKET SHARE BY COUNTRY (2023 VS 2032) FIGURE 10. EUROPE MARKET SIZE & MARKET SHARE BY COUNTRY (2023 VS 2032) FIGURE 11. ASIA-PACIFIC & MARKET SHARE BY COUNTRY (2023 VS 2032) FIGURE 12. MIDDLE EAST & AFRICA MARKET SIZE & MARKET SHARE BY COUNTRY (2023 VS 2032) FIGURE 13. SOUTH AMERICA MARKET SIZE & MARKET SHARE BY COUNTRY (2023 VS 2032) FIGURE 14. DROC ANALYSIS OF GLOBAL SODIUM TUNGSTATE MARKET FIGURE 15. DRIVERS IMPACT ANALYSIS: SODIUM TUNGSTATE MARKET FIGURE 16. RESTRAINTS IMPACT ANALYSIS: SODIUM TUNGSTATE MARKET FIGURE 17. SUPPLY / VALUE CHAIN: GLOBAL SODIUM TUNGSTATE MARKET FIGURE 18. GLOBAL SODIUM TUNGSTATE MARKET, BY APPLICATION, 2022 (% SHARE) FIGURE 19. GLOBAL SODIUM TUNGSTATE MARKET, BY APPLICATION, 2023 TO 2032 (USD MILLION) FIGURE 20. GLOBAL SODIUM TUNGSTATE MARKET, BY APPLICATION, 2023 TO 2032 (IN KILOTONS) FIGURE 21. GLOBAL SODIUM TUNGSTATE MARKET, BY END-USER, 2022 (% SHARE) FIGURE 22. GLOBAL SODIUM TUNGSTATE MARKET, BY END-USER, 2023 TO 2032 (USD MILLION) FIGURE 23. GLOBAL SODIUM TUNGSTATE MARKET, BY END-USER, 2023 TO 2032 (IN KILOTONS)

    Global & US Sodium Tungstate Market Segmentation

    Market Segmentation Overview

    • Detailed segmentation data will be available in the full report
    • Comprehensive analysis by multiple parameters
    • Regional and country-level breakdowns
    • Market size forecasts by segment
    Infographic

    Free Sample Request

    Kindly complete the form below to receive a free sample of this Report

    Get Free Sample

    Customer Strories

    “I am very pleased with how market segments have been defined in a relevant way for my purposes (such as "Portable Freezers & refrigerators" and "last-mile"). In general the report is well structured. Thanks very much for your efforts.”

    Victoria Milne

    Founder
    Case Study
    Chemicals and Materials