• Cat-intel
  • MedIntelliX
  • Resources
  • About Us
  • Request Free Sample ×

    Kindly complete the form below to receive a free sample of this Report

    Leading companies partner with us for data-driven Insights

    clients tt-cursor

    Global Chemical Industry

    ID: MRFR/CnM/31733-HCR
    111 Pages
    Chitranshi Jaiswal
    September 2025

    Chemical Industry Market Research Report: By Product Type (Basic Chemicals, Specialty Chemicals, Agricultural Chemicals, Petrochemicals, Consumer Chemicals), By Application (Agriculture, Pharmaceuticals, Construction, Automotive, Food Beverage), By End Use Industry (Manufacturing, Packaging, Textiles, Food Processing, Healthcare), By Form (Liquid, Solid, Gas) and By Regional (North America, Europe, South America, Asia Pacific, Middle East and Africa) - Forecast to 2034.

    Share:
    Download PDF ×

    We do not share your information with anyone. However, we may send you emails based on your report interest from time to time. You may contact us at any time to opt-out.

    Global Chemical Industry Research Report - Global Forecast by 2034 Infographic
    Purchase Options
    $ 4,950.0
    $ 5,950.0
    $ 7,250.0
    Table of Contents

    Global Chemical Industry Summary

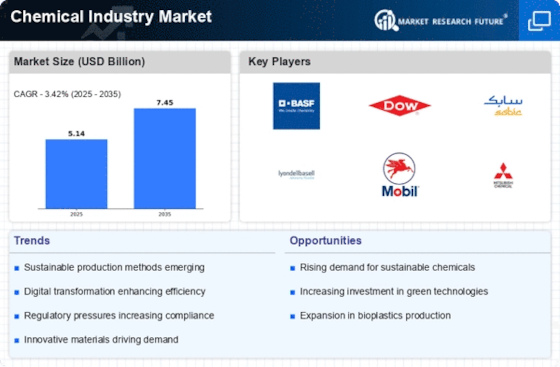
    The global chemical industry market is projected to grow from 5.14 USD billion in 2024 to 7.44 USD billion by 2035.

    Key Market Trends & Highlights

    Chemical Industry Key Trends and Highlights

    • The market is expected to experience a compound annual growth rate of 3.43 percent from 2025 to 2035.
    • By 2035, the market valuation is anticipated to reach 7.44 USD billion, indicating robust growth potential.
    • In 2024, the market is valued at 5.14 USD billion, laying a solid foundation for future expansion.
    • Growing adoption of sustainable practices due to increasing environmental regulations is a major market driver.

    Market Size & Forecast

    2024 Market Size 5.14 (USD Billion)
    2035 Market Size 7.44 (USD Billion)
    CAGR (2025-2035) 3.43%

    Major Players

    DuPont, Ineos, Mitsubishi Chemical, Formosa Plastics, Covestro, BASF, SABIC, Syngenta, Kemira, Huntsman Corporation, LyondellBasell, Dow, Eastman Chemical, Lanxess, ExxonMobil Chemical

    Global Chemical Industry Trends

    The landscape of the chemical industry is rapidly changing due to a number of emerging market drivers. This includes the rising demand for environmentally friendly and sustainable products which pushes companies to change and redesign their processes. Companies are also pressured by legislation targeted at decreasing carbon emissions and increasing safety which encourages the search for greener alternatives. Last but not least, technological progress has allowed for production efficiencies which have minimized costs and improved the quality of products.

    Collectively, these factors compel the industry to change to satisfy evolving consumer and regulatory expectations.It is clear that this changing environment offers many opportunities that can be harnessed. With the increasing trend in circular economies, businesses can successfully redefine their product lifecycles as well as minimize waste and increase resource utilization. There is also a huge opportunity in the investment of R&D targeted at finding new uses of chemicals in fields that include medicine, clean energy, and agriculture. Further, chemical companies’ growth into new regions allows them to expand their business and target new markets in search of alternative solutions.

    There are fresh changes in the chemical sector with transformation towards the digital space.Increasingly organizations began using digitalization and analytics to improve decision making and the efficiency of operations. In addition, the growth of e-commerce has transformed the dynamics of the supply chain processes which are now more customer oriented. Also, customers are changing, focusing more on health, safety, and sustainability in their purchases. As changes in these cultures occur in the world of the chemical industry, firms must be able to adjust to the changes and position themselves strategically to retain and create value.

    These trends should therefore be embraced for improved competitiveness and enhanced sustainability.

    Source: Primary Research, Secondary Research, Market Research Future Database and Analyst Review

    The global chemical industry is poised for robust growth, driven by increasing demand across various sectors, including automotive, construction, and consumer goods, which underscores its pivotal role in the global economy.

    U.S. Department of Commerce

    Global Chemical Industry Drivers

    Regulatory Compliance

    Regulatory compliance is a pivotal driver in the Global Chemical Industry Market. Governments worldwide are implementing stringent regulations to ensure safety and environmental protection. Compliance with these regulations often necessitates significant investment in technology and processes, which can drive innovation. For instance, the REACH regulation in Europe mandates the registration of chemical substances, prompting companies to enhance their product safety profiles. This regulatory landscape not only influences operational strategies but also shapes market dynamics, as companies strive to meet compliance while remaining competitive.

    Sustainable Practices

    The Global Chemical Industry Market is increasingly driven by the adoption of sustainable practices. Companies are focusing on reducing their carbon footprint and enhancing resource efficiency. For instance, many chemical manufacturers are investing in green chemistry and renewable feedstocks. This shift not only aligns with global environmental regulations but also caters to the rising consumer demand for eco-friendly products. As a result, the market is projected to reach 5.14 USD Billion in 2024, reflecting a growing emphasis on sustainability in production processes.

    Market Growth Projections

    The Global Chemical Industry Market is poised for substantial growth, with projections indicating a market size of 5.14 USD Billion in 2024 and an anticipated increase to 7.44 USD Billion by 2035. This growth trajectory suggests a compound annual growth rate of 3.43% from 2025 to 2035, reflecting the industry's resilience and adaptability. Factors such as technological advancements, sustainable practices, and increasing demand from emerging markets are likely to contribute to this positive outlook, positioning the Global Chemical Industry Market as a key player in the global economy.

    Technological Advancements

    Technological advancements play a crucial role in shaping the Global Chemical Industry Market. Innovations in process engineering, automation, and digitalization are enhancing operational efficiency and reducing costs. For example, the implementation of artificial intelligence in chemical manufacturing is streamlining production and improving quality control. These advancements are expected to contribute to a compound annual growth rate of 3.43% from 2025 to 2035, indicating a robust future for the industry as it embraces new technologies to meet evolving market demands.

    Innovation in Product Development

    Innovation in product development is a vital aspect of the Global Chemical Industry Market. Companies are increasingly investing in research and development to create advanced materials and specialty chemicals that meet specific customer needs. For example, the development of high-performance polymers and biodegradable plastics is gaining traction as industries seek sustainable alternatives. This focus on innovation is expected to sustain market growth, with the industry adapting to changing consumer preferences and technological advancements, thereby enhancing its competitive edge.

    Growing Demand in Emerging Markets

    Emerging markets are significantly influencing the Global Chemical Industry Market. Rapid industrialization and urbanization in regions such as Asia-Pacific and Latin America are driving the demand for chemicals across various sectors, including construction, automotive, and consumer goods. This trend is expected to bolster the market, with projections indicating growth to 7.44 USD Billion by 2035. The increasing population and rising disposable incomes in these regions further amplify the demand for chemical products, making them key players in the global landscape.

    Market Segment Insights

    Chemical Industry Market Product Type Insights

    In 2023, the Chemical Industry Market revenue reached a total of 4.8 USD Billion, reflecting a diverse range of product types that compose this industry. Among these, Basic Chemicals displayed a valuation of 1.2 USD Billion, expanding to 1.6 USD Billion by 2032, establishing itself as a dominant player, likely fueled by its essential role in manufacturing and industrial applications.

    Specialty Chemicals also represent a significant portion of the market, valued at 1.5 USD Billion in 2023 and projected to rise to 2.0 USD Billion by 2032; this segment encompasses a variety of highly specialized products that cater to various end-use industries, driven by innovation and evolving customer needs.Agricultural Chemicals, which are crucial for enhancing crop yields and pest management, stood at 0.9 USD Billion in 2023, with a growth trajectory taking it to 1.2 USD Billion by 2032.

    Petrochemicals, the backbone of many chemical products, held a valuation of 0.9 USD Billion in the same year and is expected to reach 1.3 USD Billion as demand for fuels and polymer products persists.

    Finally, Consumer Chemicals, though smaller, valued at 0.3 USD Billion in 2023 and anticipated to grow to 0.4 USD Billion, play an essential role in everyday consumer products, representing a growing sector within the market.This balanced valuation across different product types illustrates the intricate and interconnected dynamics of the Chemical Industry Market data, emphasizing the ongoing trends toward sustainability and innovation while also addressing key challenges such as regulatory compliance and raw material costs in the industry.

    Source: Primary Research, Secondary Research, Market Research Future Database and Analyst Review

    Chemical Industry Market Application Insights

    The Chemical Industry Market is a dynamic sector projected to be valued at 4.8 USD Billion in 2023. Within this landscape, the Application segment plays a crucial role, driven by diverse fields like Agriculture, Pharmaceuticals, Construction, Automotive, and Food Beverage. Agriculture holds a significant position due to its reliance on chemical products for enhancing crop yield and sustainability, while the Pharmaceuticals sector is critical for developing life-saving drugs and therapies, thus shaping health outcomes globally.The Construction application benefits from robust chemical innovations that enhance building materials, improving durability and efficiency.

    The Automotive industry is also pivotal, leveraging chemical advancements in lightweight materials and fuel efficiency technologies to meet rising environmental standards. Lastly, the Food Beverage sector depends on chemical applications for food preservation, safety, and flavor enhancement, highlighting its importance in daily consumer choices. Overall, the Chemical Industry Market segmentation reflects a broad spectrum of opportunities and challenges, emphasizing the essentiality of chemicals in modern-day industries.Market growth is further influenced by factors such as technological advancement, regulatory changes, and consumer demand shifts, reinforcing the industry's complexity and adaptability.

    Chemical Industry Market End Use Industry Insights

    In 2023, the Chemical Industry Market revenue is expected to reach 4.8 USD Billion, driven by various End Use Industries that play a vital role in market dynamics. Manufacturing remains a cornerstone of growth, as it relies heavily on chemicals for production processes, while the Packaging segment is witnessing considerable expansion due to increasing consumer demand for versatile and sustainable packaging solutions.

    Textiles also contribute significantly to the market, benefiting from innovations in chemical processes that enhance fabric quality and durability.Food Processing is another critical area, where chemicals are essential for preservation and flavor enhancement, reflecting the industry's reliance on innovative chemical applications. The Healthcare sector, significant for its ongoing advancement, underscores the importance of chemicals in pharmaceuticals and medical devices.

    Together, these industries illustrate the diverse applications and growing significance of the , with opportunities emerging from trends in sustainability and technological advancement, while challenges persist in regulation compliance and environmental concerns.As the market continues to evolve, ongoing efforts to improve market statistics and optimize production processes remain crucial for sustained growth. .

    Chemical Industry Market Form Insights

    The Chemical Industry Market has shown significant growth in the Form segment, which encompasses Liquid, Solid, and Gas categories. In 2023, the market was valued at 4.8 billion USD, showcasing the compound development in the industry. The Liquid form is vital for various applications, particularly in pharmaceuticals and agrochemicals, contributing substantially to market dynamics. Solid forms are also critical due to their stability and ease of handling, especially in bulk production processes.

    Furthermore, the Gas segment plays an essential role in the energy sector and chemical manufacturing, often serving as reactants or carriers in various processes.The diverse application of these forms drives the demand and shapes the Chemical Industry Market segmentation, pointing to the evolving needs of industries changing towards more sustainable solutions. As companies adapt to regulatory pressures and environmental considerations, opportunities arise to innovate within these forms, leading to potential growth in market revenue. Understanding the relevance of each category enables businesses to devise strategies that leverage their inherent advantages while addressing challenges in production and supply chain management.

    Get more detailed insights about Global Chemical Industry Research Report - Global Forecast by 2034

    Regional Insights

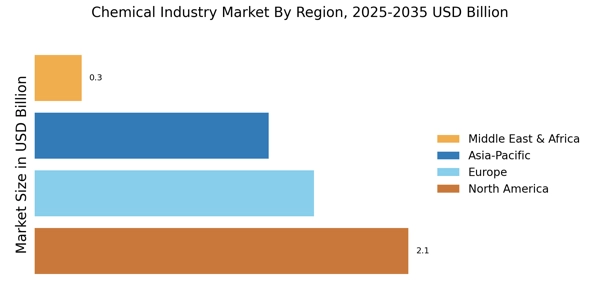
    The Chemical Industry Market displays a diverse regional segmentation that significantly impacts its overall revenue. In 2023, North America leads the charge with a valuation of 2.0 USD Billion, showcasing a majority holding of the market share, driven by strong demand in chemicals for industrial applications.

    Europe follows with a valuation of 1.4 USD Billion, benefiting from robust regulatory frameworks promoting sustainable chemicals, while APAC stands at 1.1 USD Billion, supported by rapid industrialization and economic expansion in countries like China and India.South America and MEA, with valuations of 0.1 USD Billion and 0.2 USD Billion in 2023 respectively, represent emerging markets but are growing slowly due to infrastructural challenges and limited investment. By 2032, North America is projected to reach 2.7 USD Billion, reinforcing its dominant role.

    The Chemical Industry Market data reflects that increased production capabilities and evolving consumer preferences are key growth drivers across these regions, amid challenges such as regulatory hurdles and fluctuating raw material prices.This landscape presents significant opportunities for investment and innovation as the market evolves. 

    Source: Primary Research, Secondary Research, Market Research Future Database and Analyst Review

    Key Players and Competitive Insights

    The Chemical Industry Market is characterized by a complex interplay of competitiveness, innovation, and sustainability-driven approaches. As the market evolves, technology advancements and regulatory changes shape the landscape, prompting companies to adopt strategic methodologies to maintain their relevancy and strengthen their market position. Companies in this sector are increasingly focusing on product differentiation, sustainability practices, and development of advanced materials to cater to diverse consumer demands, while also addressing environmental concerns.

    Competitive insights into this market reveal a continuous drive for innovation and the necessity for businesses to leverage their capabilities in operational efficiency, supply chain management, and customer-centric solutions.DuPont is well-situated within the , with a strong reputation for innovation and commitment to sustainability. The company's diverse range of specialty products allows it to address various sectors, from agriculture to electronics, enhancing its market presence. DuPont's extensive research and development investments enable the company to pioneer new technologies that refine performance and reduce environmental impacts, positioning it as a leader in sustainable practices.

    Additionally, its deep understanding of customer needs and strong relationships within the industry ensures that DuPont is able to adapt and forecast market trends effectively. This agility, combined with robust supply chain networks, allows DuPont to excel in operational excellence, giving it a competitive edge in the dynamic marketplace.Ineos stands out in the Chemical Industry Market due to its comprehensive product portfolio and strategic positioning across different chemical sectors. The company's strength lies in its capacity to deliver a wide array of chemical intermediates, polymers, and specialty chemicals, which are integral to various end-use applications.

    Ineos has made significant investments in technology and infrastructure, ensuring efficient production processes that are both cost-effective and environmentally conscious. With a strong focus on customer partnerships, Ineos leverages its innovative capabilities to address specific client requirements, thus enhancing customer loyalty and satisfaction. Its presence in multiple regions further empowers Ineos to capture market opportunities while maintaining flexibility in operations, solidifying its competitive stance in the chemical landscape.

    Key Companies in the Global Chemical Industry market include

    Industry Developments

    • Q3 2025: Borealis, Nova Chemicals, and Borouge to combine into Borouge Group International Austria-based Borealis, Canada's Nova Chemicals, and Abu Dhabi–based Borouge will merge to form Borouge Group International, creating the world’s fourth-largest polyolefin maker with annual revenues of about $18 billion. OMV and ADNOC will each own 47% of the new entity.
    • Q3 2025: Westlake names Jean-Marc Gilson as CEO, announces shutdown of bisphenol A and liquid epoxy capacity in Pernis, Netherlands Westlake appointed Jean-Marc Gilson as CEO, replacing Albert Chao, and announced the closure of its bisphenol A and liquid epoxy production facilities in Pernis, Netherlands, as part of a strategic shift.

    Future Outlook

    Global Chemical Industry Future Outlook

    The Global Chemical Industry Market is projected to grow at a 3.43% CAGR from 2024 to 2035, driven by sustainability initiatives, technological advancements, and increasing demand for specialty chemicals.

    New opportunities lie in:

    • Invest in green chemistry technologies to meet regulatory demands and consumer preferences.
    • Develop advanced materials for electronics and renewable energy applications.
    • Expand into emerging markets with tailored chemical solutions for local industries.

    By 2035, the market is expected to exhibit robust growth, positioning itself as a leader in innovation and sustainability.

    Market Segmentation

    Chemical Industry Market Segmentation Insights

    Chemical Industry Market Form
    • Liquid
    • Solid
    • Gas
    Chemical Industry Market Regional
    • North America
    • Europe
    • South America
    • Asia Pacific
    • Middle East and Africa
    Chemical Industry Market Application
    • Agriculture
    • Pharmaceuticals
    • Construction
    • Automotive
    • Food Beverage
    Chemical Industry Market Product Type
    • Basic Chemicals
    • Specialty Chemicals
    • Agricultural Chemicals
    • Petrochemicals
    • Consumer Chemicals
    Chemical Industry Market End Use Industry
    • Manufacturing
    • Packaging
    • Textiles
    • Food Processing
    • Healthcare

    Report Scope

    Report Attribute/Metric Details
    Market Size 2024 5.14(USD Billion)
    Market Size 2025 5.32 (USD Billion)
    Market Size 2034 7.20 (USD Billion)
    Compound Annual Growth Rate (CAGR) 3.4% (2025 - 2034)
    Report Coverage Revenue Forecast, Competitive Landscape, Growth Factors, and Trends
    Base Year 2024
    Market Forecast Period 2025 - 2034
    Historical Data 2020 - 2024
    Market Forecast Units USD Billion
    Key Companies Profiled DuPont, Ineos, Mitsubishi Chemical, Formosa Plastics, Covestro, BASF, SABIC, Syngenta, Kemira, Huntsman Corporation, LyondellBasell, Dow, Eastman Chemical, Lanxess, ExxonMobil Chemical
    Segments Covered Product Type, Application, End Use Industry, Form, Regional
    Key Market Opportunities Sustainable chemical production technologies, Circular economy initiatives, Digital transformation in operations, Expansion in emerging markets, Investment in renewable feedstocks
    Key Market Dynamics sustainable manufacturing practices, regulatory compliance pressures, fluctuating raw material costs, technological innovations, increasing demand
    Countries Covered North America, Europe, APAC, South America, MEA

    Market Highlights

    Author
    Chitranshi Jaiswal
    Research Analyst Level I

    In her 3 years of experience in the market research field, she has handled critical cross-domain projects. She has an in-depth knowledge of market estimation & analysis, problem-solving, primary as well as secondary research, and team management.She holds an engineering degree and is an MBA professional from a well-known university, capable of evaluating the market and competitive conditions. An exceptional strategist with excellent communication skills and a passion for delivering cutting-edge & practical insights for the market. Proficient in multi-tasking, and can successfully deal with competing demands, while maintaining complete confidentiality. Generated business through active client and project development, networking, and high-quality responses. Her knowledge and skills have helped in making solid business decisions, securing funding from investors, and avoiding business failures.

    Leave a Comment

    FAQs

    What is the expected market size of the Chemical Industry Market in 2034?

    The market is expected to be valued at 7.20 USD Billion in 2034.

    What was the market size of the Chemical Industry Market in 2024?

    In 2024, the market was valued at 5.14 USD Billion.

    What is the expected CAGR for the Chemical Industry Market from 2025 to 2034?

    The expected CAGR for the market from 2025 to 2034 is 3.4%.

    Which region is expected to be the largest market for the Chemical Industry Market by 2032?

    North America is expected to be the largest market valued at 2.7 USD Billion in 2032.

    What will be the market value of Specialty Chemicals in 2032?

    Specialty Chemicals are projected to be valued at 2.0 USD Billion in 2032.

    Who are the major players in the Chemical Industry Market ?

    Key players include DuPont, Ineos, Mitsubishi Chemical, and BASF among others.

    What is the projected market value for Basic Chemicals in 2024?

    Basic Chemicals are expected to reach a value of 1.4 USD Billion by 2024.

    Which region is anticipated to experience the highest growth in the ?

    The APAC region is anticipated to show significant growth, with a market value of 1.5 USD Billion in 2032.

    What will the market value of Agricultural Chemicals be in 2032?

    Agricultural Chemicals are forecasted to reach a value of 1.2 USD Billion in 2032.

    What growth drivers are influencing the ?

    Growth drivers include increasing demand for specialty products and technological advancements in chemical processes.

    1.     1. EXECUTIVE SUMMARY   
      1. Market Overview     
    2.         1.2. Key Findings     
    3.         1.3. Market Segmentation 
    4.         1.4. Competitive Landscape 
    5.         1.5. Challenges and Opportunities 
    6.         1.6. Future Outlook   
    7.   2. MARKET INTRODUCTION   
    8. Definition     
    9.         2.2. Scope of the study   
    10.             2.2.1. Research
    11. Objective         
    12.   2.2.2. Assumption         
    13.       2.2.3. Limitations           
    14.     3. RESEARCH METHODOLOGY   
    15.       3.1. Overview     
    16.   3.2. Data Mining     
    17. Secondary Research     
    18.         3.4. Primary
    19. Research   
    20.             3.4.1. Primary
    21. Interviews and Information Gathering Process         
    22.             3.4.2. Breakdown of Primary Respondents 
    23.         3.5. Forecasting
    24. Model     
    25.         3.6. Market Size Estimation 
    26.             3.6.1. Bottom-Up Approach 
    27. Top-Down Approach           
    28.   3.7. Data Triangulation     
      1. Validation        
    29.     4. MARKET DYNAMICS   
    30.     4.1. Overview     
      1. Drivers     
    31.         4.3. Restraints 
    32.         4.4. Opportunities     
    33.     5. MARKET FACTOR ANALYSIS   
    34.       5.1. Value chain Analysis     
    35.     5.2. Porter's Five Forces Analysis   
    36.         5.2.1. Bargaining Power of Suppliers     
    37.             5.2.2. Bargaining Power
    38. of Buyers         
    39.   5.2.3. Threat of New Entrants         
    40.           5.2.4. Threat of Substitutes     
    41.             5.2.5. Intensity of
    42. Rivalry           
      1. COVID-19 Impact Analysis   
    43.   5.3.1. Market Impact Analysis         
    44.           5.3.2. Regional Impact       
    45.             5.3.3. Opportunity and Threat
    46. Analysis              
    47.     6. Chemical Industry Outlook 89294716
    48. Market, BY Product Type (USD Billion)   
      1. Basic Chemicals     
    49.         6.2. Specialty
    50. Chemicals     
    51.         6.3. Agricultural
    52. Chemicals     
    53.         6.4. Petrochemicals 
    54.         6.5. Consumer Chemicals   
    55.     7. Chemical Industry Outlook 89294716 Market,
    56. BY Application (USD Billion)   
    57. Agriculture     
    58.         7.2. Pharmaceuticals 
    59.         7.3. Construction     
    60.         7.4. Automotive     
    61.     7.5. Food  Beverage        
    62.   8. Chemical Industry Outlook 89294716 Market, BY End Use Industry (USD Billion) 
    63.         8.1. Manufacturing     
    64.         8.2. Packaging     
    65.     8.3. Textiles     
      1. Food Processing     
    66.         8.5. Healthcare 
    67.     9. Chemical Industry Outlook 89294716
    68. Market, BY Form (USD Billion)   
    69. Liquid     
    70.         9.2. Solid   
    71.         9.3. Gas        
    72.     10. Chemical Industry Outlook 89294716 Market, BY Regional (USD
    73. Billion)   
    74.         10.1. North America 
    75.             10.1.1. US     
    76.             10.1.2. Canada 
    77.         10.2. Europe 
    78.             10.2.1. Germany   
    79.             10.2.2. UK 
    80. France         
    81.   10.2.4. Russia         
    82.       10.2.5. Italy         
    83.           10.2.6. Spain         
    84.             10.2.7. Rest of Europe   
    85.         10.3. APAC   
    86.             10.3.1. China       
    87.             10.3.2. India   
    88.             10.3.3. Japan 
    89. South Korea         
    90.   10.3.5. Malaysia         
    91.       10.3.6. Thailand         
    92.           10.3.7. Indonesia       
    93.             10.3.8. Rest of APAC 
    94.         10.4. South
    95. America   
    96.             10.4.1. Brazil 
    97. Mexico         
    98.   10.4.3. Argentina         
    99.       10.4.4. Rest of South America         
    100.         10.5. MEA   
    101.         10.5.1. GCC Countries         
    102.             10.5.2. South Africa     
    103.             10.5.3. Rest of MEA 
    104.     11. Competitive Landscape   
    105.       11.1. Overview     
    106.   11.2. Competitive Analysis     
    107.   11.3. Market share Analysis     
    108.   11.4. Major Growth Strategy in the Chemical Industry Outlook 89294716 Market 
    109.         11.5. Competitive Benchmarking 
    110.         11.6. Leading Players in Terms of
    111. Number of Developments in the Chemical Industry Outlook 89294716 Market   
    112.         11.7. Key developments and growth strategies 
    113.             11.7.1. New Product Launch/Service
    114. Deployment         
    115.   11.7.2. Merger  Acquisitions         
    116.           11.7.3. Joint Ventures       
    117.         11.8. Major Players Financial Matrix 
    118.             11.8.1. Sales and Operating
    119. Income         
    120.   11.8.2. Major Players RD Expenditure. 2023         
    121.     12. Company Profiles   
    122.       12.1. DuPont   
    123.     12.1.1. Financial Overview         
    124.           12.1.2. Products Offered     
    125.             12.1.3. Key Developments 
    126. SWOT Analysis         
    127.     12.1.5. Key Strategies           
    128.         12.2. Ineos   
    129.       12.2.1. Financial Overview         
    130.             12.2.2. Products Offered   
    131.             12.2.3. Key
    132. Developments         
    133.     12.2.4. SWOT Analysis         
    134.           12.2.5. Key Strategies       
    135.         12.3. Mitsubishi Chemical   
    136.             12.3.1. Financial Overview   
    137.             12.3.2. Products
    138. Offered         
    139.   12.3.3. Key Developments         
    140.         12.3.4. SWOT Analysis         
    141.             12.3.5. Key Strategies   
    142.         12.4. Formosa Plastics 
    143.             12.4.1. Financial Overview 
    144. Products Offered         
    145.     12.4.3. Key Developments         
    146.           12.4.4. SWOT Analysis       
    147.             12.4.5. Key Strategies 
    148.         12.5. Covestro 
    149.             12.5.1. Financial Overview 
    150. Products Offered         
    151.     12.5.3. Key Developments         
    152.           12.5.4. SWOT Analysis       
    153.             12.5.5. Key Strategies 
    154.         12.6. BASF 
    155.             12.6.1. Financial Overview 
    156. Products Offered         
    157.     12.6.3. Key Developments         
    158.           12.6.4. SWOT Analysis       
    159.             12.6.5. Key Strategies 
    160.         12.7. SABIC 
    161.             12.7.1. Financial Overview 
    162. Products Offered         
    163.     12.7.3. Key Developments         
    164.           12.7.4. SWOT Analysis       
    165.             12.7.5. Key Strategies 
    166.         12.8. Syngenta 
    167.             12.8.1. Financial Overview 
    168. Products Offered         
    169.     12.8.3. Key Developments         
    170.           12.8.4. SWOT Analysis       
    171.             12.8.5. Key Strategies 
    172.         12.9. Kemira 
    173.             12.9.1. Financial Overview 
    174. Products Offered         
    175.     12.9.3. Key Developments         
    176.           12.9.4. SWOT Analysis       
    177.             12.9.5. Key Strategies 
    178.         12.10. Huntsman
    179. Corporation   
    180. Financial Overview         
    181.     12.10.2. Products Offered         
    182.           12.10.3. Key Developments     
    183.             12.10.4. SWOT Analysis 
    184. Key Strategies           
    185.   12.11. LyondellBasell   
    186.   12.11.1. Financial Overview         
    187.           12.11.2. Products Offered     
    188.             12.11.3. Key Developments 
    189. SWOT Analysis         
    190.     12.11.5. Key Strategies           
    191.         12.12. Dow   
    192.       12.12.1. Financial Overview         
    193.             12.12.2. Products Offered   
    194.             12.12.3. Key
    195. Developments         
    196.     12.12.4. SWOT Analysis         
    197.           12.12.5. Key Strategies       
    198.         12.13. Eastman Chemical   
    199.             12.13.1. Financial Overview   
    200.             12.13.2. Products
    201. Offered         
    202.   12.13.3. Key Developments         
    203.         12.13.4. SWOT Analysis         
    204.             12.13.5. Key Strategies   
    205.         12.14. Lanxess 
    206.             12.14.1. Financial Overview 
    207. Products Offered         
    208.     12.14.3. Key Developments         
    209.           12.14.4. SWOT Analysis       
    210.             12.14.5. Key Strategies 
    211.         12.15. ExxonMobil
    212. Chemical   
    213.             12.15.1. Financial
    214. Overview         
    215.   12.15.2. Products Offered         
    216.         12.15.3. Key Developments       
    217.             12.15.4. SWOT Analysis 
    218. Key Strategies              
    219.   13. Appendix   
    220.         13.1. References 
    221.         13.2. Related Reports   
    222.     Table 1.
    223.     Table 2. North America Chemical
    224. Industry Outlook 89294716 Market SIZE ESTIMATES & FORECAST, BY PRODUCT TYPE,
    225. 2034 (USD Billions)   
    226.     Table 3. North America
    227. Chemical Industry Outlook 89294716 Market SIZE ESTIMATES & FORECAST, BY APPLICATION,
    228. 2034 (USD Billions)   
    229.     Table 4. North America
    230. Chemical Industry Outlook 89294716 Market SIZE ESTIMATES & FORECAST, BY END
    231. USE INDUSTRY, 2025-2034 (USD Billions)   
    232.     Table 5.
    233. North America Chemical Industry Outlook 89294716 Market SIZE ESTIMATES & FORECAST,
    234. BY FORM, 2025-2034 (USD Billions)   
    235.     Table 6. North
    236. America Chemical Industry Outlook 89294716 Market SIZE ESTIMATES & FORECAST,
    237. BY REGIONAL, 2025-2034 (USD Billions)   
    238.     Table 7. US
    239. Chemical Industry Outlook 89294716 Market SIZE ESTIMATES & FORECAST, BY PRODUCT
    240. TYPE, 2025-2034 (USD Billions)   
    241.     Table 8. US Chemical
    242. Industry Outlook 89294716 Market SIZE ESTIMATES & FORECAST, BY APPLICATION,
    243. 2034 (USD Billions)   
    244.     Table 9. US Chemical Industry
    245. Outlook 89294716 Market SIZE ESTIMATES & FORECAST, BY END USE INDUSTRY, 2025-2034
    246. (USD Billions)   
    247.     Table 10. US Chemical Industry Outlook
    248. Market SIZE ESTIMATES & FORECAST, BY FORM, 2025-2034 (USD Billions) 
    249.     Table 11. US Chemical Industry Outlook 89294716 Market
    250. SIZE ESTIMATES & FORECAST, BY REGIONAL, 2025-2034 (USD Billions)   
    251.     Table 12. Canada Chemical Industry Outlook 89294716 Market SIZE
    252. ESTIMATES & FORECAST, BY PRODUCT TYPE, 2025-2034 (USD Billions)   
    253.     Table 13. Canada Chemical Industry Outlook 89294716 Market SIZE
    254. ESTIMATES & FORECAST, BY APPLICATION, 2025-2034 (USD Billions)   
    255.     Table 14. Canada Chemical Industry Outlook 89294716 Market SIZE
    256. ESTIMATES & FORECAST, BY END USE INDUSTRY, 2025-2034 (USD Billions)   
    257.     Table 15. Canada Chemical Industry Outlook 89294716 Market SIZE
    258. ESTIMATES & FORECAST, BY FORM, 2025-2034 (USD Billions)   
    259.   Table 16. Canada Chemical Industry Outlook 89294716 Market SIZE ESTIMATES
    260. & FORECAST, BY REGIONAL, 2025-2034 (USD Billions)   
    261. FORECAST, BY PRODUCT TYPE, 2025-2034 (USD Billions)   
    262. FORECAST, BY APPLICATION, 2025-2034 (USD Billions)   
    263. FORECAST, BY END USE INDUSTRY, 2025-2034 (USD Billions)   
    264.   Table 20. Europe Chemical Industry Outlook 89294716 Market SIZE ESTIMATES
    265. & FORECAST, BY FORM, 2025-2034 (USD Billions)   
    266. FORECAST, BY REGIONAL, 2025-2034 (USD Billions)   
    267. FORECAST, BY PRODUCT TYPE, 2025-2034 (USD Billions)   
    268. FORECAST, BY APPLICATION, 2025-2034 (USD Billions)   
    269. FORECAST, BY END USE INDUSTRY, 2025-2034 (USD Billions)   
    270.   Table 25. Germany Chemical Industry Outlook 89294716 Market SIZE ESTIMATES
    271. & FORECAST, BY FORM, 2025-2034 (USD Billions)   
    272. FORECAST, BY REGIONAL, 2025-2034 (USD Billions)   
    273. BY PRODUCT TYPE, 2025-2034 (USD Billions)   
    274.     Table
    275. UK Chemical Industry Outlook 89294716 Market SIZE ESTIMATES & FORECAST,
    276. BY APPLICATION, 2025-2034 (USD Billions)   
    277.     Table 29.
    278. UK Chemical Industry Outlook 89294716 Market SIZE ESTIMATES & FORECAST, BY END
    279. USE INDUSTRY, 2025-2034 (USD Billions)   
    280.     Table 30.
    281. UK Chemical Industry Outlook 89294716 Market SIZE ESTIMATES & FORECAST, BY FORM,
    282. 2034 (USD Billions)   
    283.     Table 31. UK Chemical Industry
    284. Outlook 89294716 Market SIZE ESTIMATES & FORECAST, BY REGIONAL, 2025-2034 (USD
    285. Billions)   
    286.     Table 32. France Chemical Industry Outlook
    287. Market SIZE ESTIMATES & FORECAST, BY PRODUCT TYPE, 2025-2034 (USD Billions) 
    288.     Table 33. France Chemical Industry Outlook 89294716 Market
    289. SIZE ESTIMATES & FORECAST, BY APPLICATION, 2025-2034 (USD Billions)   
    290.     Table 34. France Chemical Industry Outlook 89294716 Market SIZE
    291. ESTIMATES & FORECAST, BY END USE INDUSTRY, 2025-2034 (USD Billions)   
    292.     Table 35. France Chemical Industry Outlook 89294716 Market SIZE
    293. ESTIMATES & FORECAST, BY FORM, 2025-2034 (USD Billions)   
    294.   Table 36. France Chemical Industry Outlook 89294716 Market SIZE ESTIMATES
    295. & FORECAST, BY REGIONAL, 2025-2034 (USD Billions)   
    296. FORECAST, BY PRODUCT TYPE, 2025-2034 (USD Billions)   
    297. FORECAST, BY APPLICATION, 2025-2034 (USD Billions)   
    298. FORECAST, BY END USE INDUSTRY, 2025-2034 (USD Billions)   
    299.   Table 40. Russia Chemical Industry Outlook 89294716 Market SIZE ESTIMATES
    300. & FORECAST, BY FORM, 2025-2034 (USD Billions)   
    301. FORECAST, BY REGIONAL, 2025-2034 (USD Billions)   
    302. BY PRODUCT TYPE, 2025-2034 (USD Billions)   
    303.     Table
    304. Italy Chemical Industry Outlook 89294716 Market SIZE ESTIMATES & FORECAST,
    305. BY APPLICATION, 2025-2034 (USD Billions)   
    306.     Table 44.
    307. Italy Chemical Industry Outlook 89294716 Market SIZE ESTIMATES & FORECAST, BY
    308. END USE INDUSTRY, 2025-2034 (USD Billions)   
    309.     Table
    310. Italy Chemical Industry Outlook 89294716 Market SIZE ESTIMATES & FORECAST,
    311. BY FORM, 2025-2034 (USD Billions)   
    312.     Table 46. Italy
    313. Chemical Industry Outlook 89294716 Market SIZE ESTIMATES & FORECAST, BY REGIONAL,
    314. 2034 (USD Billions)   
    315.     Table 47. Spain Chemical
    316. Industry Outlook 89294716 Market SIZE ESTIMATES & FORECAST, BY PRODUCT TYPE,
    317. 2034 (USD Billions)   
    318.     Table 48. Spain Chemical
    319. Industry Outlook 89294716 Market SIZE ESTIMATES & FORECAST, BY APPLICATION,
    320. 2034 (USD Billions)   
    321.     Table 49. Spain Chemical
    322. Industry Outlook 89294716 Market SIZE ESTIMATES & FORECAST, BY END USE INDUSTRY,
    323. 2034 (USD Billions)   
    324.     Table 50. Spain Chemical
    325. Industry Outlook 89294716 Market SIZE ESTIMATES & FORECAST, BY FORM, 2025-2034
    326. (USD Billions)   
    327.     Table 51. Spain Chemical Industry
    328. Outlook 89294716 Market SIZE ESTIMATES & FORECAST, BY REGIONAL, 2025-2034 (USD
    329. Billions)   
    330.     Table 52. Rest of Europe Chemical Industry
    331. Outlook 89294716 Market SIZE ESTIMATES & FORECAST, BY PRODUCT TYPE, 2025-2034
    332. (USD Billions)   
    333.     Table 53. Rest of Europe Chemical
    334. Industry Outlook 89294716 Market SIZE ESTIMATES & FORECAST, BY APPLICATION,
    335. 2034 (USD Billions)   
    336.     Table 54. Rest of Europe
    337. Chemical Industry Outlook 89294716 Market SIZE ESTIMATES & FORECAST, BY END
    338. USE INDUSTRY, 2025-2034 (USD Billions)   
    339.     Table 55.
    340. Rest of Europe Chemical Industry Outlook 89294716 Market SIZE ESTIMATES & FORECAST,
    341. BY FORM, 2025-2034 (USD Billions)   
    342.     Table 56. Rest
    343. of Europe Chemical Industry Outlook 89294716 Market SIZE ESTIMATES & FORECAST,
    344. BY REGIONAL, 2025-2034 (USD Billions)   
    345.     Table 57.
    346. APAC Chemical Industry Outlook 89294716 Market SIZE ESTIMATES & FORECAST, BY
    347. PRODUCT TYPE, 2025-2034 (USD Billions)   
    348.     Table 58.
    349. APAC Chemical Industry Outlook 89294716 Market SIZE ESTIMATES & FORECAST, BY
    350. APPLICATION, 2025-2034 (USD Billions)   
    351.     Table 59.
    352. APAC Chemical Industry Outlook 89294716 Market SIZE ESTIMATES & FORECAST, BY
    353. END USE INDUSTRY, 2025-2034 (USD Billions)   
    354.     Table
    355. APAC Chemical Industry Outlook 89294716 Market SIZE ESTIMATES & FORECAST,
    356. BY FORM, 2025-2034 (USD Billions)   
    357.     Table 61. APAC
    358. Chemical Industry Outlook 89294716 Market SIZE ESTIMATES & FORECAST, BY REGIONAL,
    359. 2034 (USD Billions)   
    360.     Table 62. China Chemical
    361. Industry Outlook 89294716 Market SIZE ESTIMATES & FORECAST, BY PRODUCT TYPE,
    362. 2034 (USD Billions)   
    363.     Table 63. China Chemical
    364. Industry Outlook 89294716 Market SIZE ESTIMATES & FORECAST, BY APPLICATION,
    365. 2034 (USD Billions)   
    366.     Table 64. China Chemical
    367. Industry Outlook 89294716 Market SIZE ESTIMATES & FORECAST, BY END USE INDUSTRY,
    368. 2034 (USD Billions)   
    369.     Table 65. China Chemical
    370. Industry Outlook 89294716 Market SIZE ESTIMATES & FORECAST, BY FORM, 2025-2034
    371. (USD Billions)   
    372.     Table 66. China Chemical Industry
    373. Outlook 89294716 Market SIZE ESTIMATES & FORECAST, BY REGIONAL, 2025-2034 (USD
    374. Billions)   
    375.     Table 67. India Chemical Industry Outlook
    376. Market SIZE ESTIMATES & FORECAST, BY PRODUCT TYPE, 2025-2034 (USD Billions) 
    377.     Table 68. India Chemical Industry Outlook 89294716 Market
    378. SIZE ESTIMATES & FORECAST, BY APPLICATION, 2025-2034 (USD Billions)   
    379.     Table 69. India Chemical Industry Outlook 89294716 Market SIZE ESTIMATES
    380. & FORECAST, BY END USE INDUSTRY, 2025-2034 (USD Billions)   
    381.   Table 70. India Chemical Industry Outlook 89294716 Market SIZE ESTIMATES
    382. & FORECAST, BY FORM, 2025-2034 (USD Billions)   
    383. BY REGIONAL, 2025-2034 (USD Billions)   
    384.     Table 72.
    385. Japan Chemical Industry Outlook 89294716 Market SIZE ESTIMATES & FORECAST, BY
    386. PRODUCT TYPE, 2025-2034 (USD Billions)   
    387.     Table 73.
    388. Japan Chemical Industry Outlook 89294716 Market SIZE ESTIMATES & FORECAST, BY
    389. APPLICATION, 2025-2034 (USD Billions)   
    390.     Table 74.
    391. Japan Chemical Industry Outlook 89294716 Market SIZE ESTIMATES & FORECAST, BY
    392. END USE INDUSTRY, 2025-2034 (USD Billions)   
    393.     Table
    394. Japan Chemical Industry Outlook 89294716 Market SIZE ESTIMATES & FORECAST,
    395. BY FORM, 2025-2034 (USD Billions)   
    396.     Table 76. Japan
    397. Chemical Industry Outlook 89294716 Market SIZE ESTIMATES & FORECAST, BY REGIONAL,
    398. 2034 (USD Billions)   
    399.     Table 77. South Korea Chemical
    400. Industry Outlook 89294716 Market SIZE ESTIMATES & FORECAST, BY PRODUCT TYPE,
    401. 2034 (USD Billions)   
    402.     Table 78. South Korea Chemical
    403. Industry Outlook 89294716 Market SIZE ESTIMATES & FORECAST, BY APPLICATION,
    404. 2034 (USD Billions)   
    405.     Table 79. South Korea Chemical
    406. Industry Outlook 89294716 Market SIZE ESTIMATES & FORECAST, BY END USE INDUSTRY,
    407. 2034 (USD Billions)   
    408.     Table 80. South Korea Chemical
    409. Industry Outlook 89294716 Market SIZE ESTIMATES & FORECAST, BY FORM, 2025-2034
    410. (USD Billions)   
    411.     Table 81. South Korea Chemical Industry
    412. Outlook 89294716 Market SIZE ESTIMATES & FORECAST, BY REGIONAL, 2025-2034 (USD
    413. Billions)   
    414.     Table 82. Malaysia Chemical Industry Outlook
    415. Market SIZE ESTIMATES & FORECAST, BY PRODUCT TYPE, 2025-2034 (USD Billions) 
    416.     Table 83. Malaysia Chemical Industry Outlook 89294716
    417. Market SIZE ESTIMATES & FORECAST, BY APPLICATION, 2025-2034 (USD Billions) 
    418.     Table 84. Malaysia Chemical Industry Outlook 89294716
    419. Market SIZE ESTIMATES & FORECAST, BY END USE INDUSTRY, 2025-2034 (USD Billions) 
    420.     Table 85. Malaysia Chemical Industry Outlook 89294716
    421. Market SIZE ESTIMATES & FORECAST, BY FORM, 2025-2034 (USD Billions)   
    422.     Table 86. Malaysia Chemical Industry Outlook 89294716 Market SIZE
    423. ESTIMATES & FORECAST, BY REGIONAL, 2025-2034 (USD Billions)   
    424.     Table 87. Thailand Chemical Industry Outlook 89294716 Market SIZE
    425. ESTIMATES & FORECAST, BY PRODUCT TYPE, 2025-2034 (USD Billions)   
    426.     Table 88. Thailand Chemical Industry Outlook 89294716 Market SIZE
    427. ESTIMATES & FORECAST, BY APPLICATION, 2025-2034 (USD Billions)   
    428.     Table 89. Thailand Chemical Industry Outlook 89294716 Market SIZE
    429. ESTIMATES & FORECAST, BY END USE INDUSTRY, 2025-2034 (USD Billions)   
    430.     Table 90. Thailand Chemical Industry Outlook 89294716 Market SIZE
    431. ESTIMATES & FORECAST, BY FORM, 2025-2034 (USD Billions)   
    432.   Table 91. Thailand Chemical Industry Outlook 89294716 Market SIZE ESTIMATES
    433. & FORECAST, BY REGIONAL, 2025-2034 (USD Billions)   
    434. FORECAST, BY PRODUCT TYPE, 2025-2034 (USD Billions)   
    435. FORECAST, BY APPLICATION, 2025-2034 (USD Billions)   
    436. FORECAST, BY END USE INDUSTRY, 2025-2034 (USD Billions)   
    437.   Table 95. Indonesia Chemical Industry Outlook 89294716 Market SIZE ESTIMATES
    438. & FORECAST, BY FORM, 2025-2034 (USD Billions)   
    439. FORECAST, BY REGIONAL, 2025-2034 (USD Billions)   
    440. & FORECAST, BY PRODUCT TYPE, 2025-2034 (USD Billions)   
    441.   Table 98. Rest of APAC Chemical Industry Outlook 89294716 Market SIZE ESTIMATES
    442. & FORECAST, BY APPLICATION, 2025-2034 (USD Billions)   
    443.   Table 99. Rest of APAC Chemical Industry Outlook 89294716 Market SIZE ESTIMATES
    444. & FORECAST, BY END USE INDUSTRY, 2025-2034 (USD Billions)   
    445.   Table 100. Rest of APAC Chemical Industry Outlook 89294716 Market SIZE ESTIMATES
    446. & FORECAST, BY FORM, 2025-2034 (USD Billions)   
    447. & FORECAST, BY REGIONAL, 2025-2034 (USD Billions)   
    448. & FORECAST, BY PRODUCT TYPE, 2025-2034 (USD Billions)   
    449.   Table 103. South America Chemical Industry Outlook 89294716 Market SIZE ESTIMATES
    450. & FORECAST, BY APPLICATION, 2025-2034 (USD Billions)   
    451.   Table 104. South America Chemical Industry Outlook 89294716 Market SIZE ESTIMATES
    452. & FORECAST, BY END USE INDUSTRY, 2025-2034 (USD Billions)   
    453.   Table 105. South America Chemical Industry Outlook 89294716 Market SIZE ESTIMATES
    454. & FORECAST, BY FORM, 2025-2034 (USD Billions)   
    455. & FORECAST, BY REGIONAL, 2025-2034 (USD Billions)   
    456. FORECAST, BY PRODUCT TYPE, 2025-2034 (USD Billions)   
    457. FORECAST, BY APPLICATION, 2025-2034 (USD Billions)   
    458. FORECAST, BY END USE INDUSTRY, 2025-2034 (USD Billions)   
    459.   Table 110. Brazil Chemical Industry Outlook 89294716 Market SIZE ESTIMATES
    460. & FORECAST, BY FORM, 2025-2034 (USD Billions)   
    461. FORECAST, BY REGIONAL, 2025-2034 (USD Billions)   
    462. FORECAST, BY PRODUCT TYPE, 2025-2034 (USD Billions)   
    463. FORECAST, BY APPLICATION, 2025-2034 (USD Billions)   
    464. FORECAST, BY END USE INDUSTRY, 2025-2034 (USD Billions)   
    465.   Table 115. Mexico Chemical Industry Outlook 89294716 Market SIZE ESTIMATES
    466. & FORECAST, BY FORM, 2025-2034 (USD Billions)   
    467. FORECAST, BY REGIONAL, 2025-2034 (USD Billions)   
    468. FORECAST, BY PRODUCT TYPE, 2025-2034 (USD Billions)   
    469. FORECAST, BY APPLICATION, 2025-2034 (USD Billions)   
    470. FORECAST, BY END USE INDUSTRY, 2025-2034 (USD Billions)   
    471.   Table 120. Argentina Chemical Industry Outlook 89294716 Market SIZE ESTIMATES
    472. & FORECAST, BY FORM, 2025-2034 (USD Billions)   
    473. FORECAST, BY REGIONAL, 2025-2034 (USD Billions)   
    474. ESTIMATES & FORECAST, BY PRODUCT TYPE, 2025-2034 (USD Billions)   
    475.     Table 123. Rest of South America Chemical Industry Outlook 89294716
    476. Market SIZE ESTIMATES & FORECAST, BY APPLICATION, 2025-2034 (USD Billions) 
    477.     Table 124. Rest of South America Chemical Industry Outlook
    478. Market SIZE ESTIMATES & FORECAST, BY END USE INDUSTRY, 2025-2034 (USD
    479. Billions)   
    480.     Table 125. Rest of South America Chemical
    481. Industry Outlook 89294716 Market SIZE ESTIMATES & FORECAST, BY FORM, 2025-2034
    482. (USD Billions)   
    483.     Table 126. Rest of South America
    484. Chemical Industry Outlook 89294716 Market SIZE ESTIMATES & FORECAST, BY REGIONAL,
    485. 2034 (USD Billions)   
    486.     Table 127. MEA Chemical
    487. Industry Outlook 89294716 Market SIZE ESTIMATES & FORECAST, BY PRODUCT TYPE,
    488. 2034 (USD Billions)   
    489.     Table 128. MEA Chemical
    490. Industry Outlook 89294716 Market SIZE ESTIMATES & FORECAST, BY APPLICATION,
    491. 2034 (USD Billions)   
    492.     Table 129. MEA Chemical
    493. Industry Outlook 89294716 Market SIZE ESTIMATES & FORECAST, BY END USE INDUSTRY,
    494. 2034 (USD Billions)   
    495.     Table 130. MEA Chemical
    496. Industry Outlook 89294716 Market SIZE ESTIMATES & FORECAST, BY FORM, 2025-2034
    497. (USD Billions)   
    498.     Table 131. MEA Chemical Industry
    499. Outlook 89294716 Market SIZE ESTIMATES & FORECAST, BY REGIONAL, 2025-2034 (USD
    500. Billions)   
    501.     Table 132. GCC Countries Chemical Industry
    502. Outlook 89294716 Market SIZE ESTIMATES & FORECAST, BY PRODUCT TYPE, 2025-2034
    503. (USD Billions)   
    504.     Table 133. GCC Countries Chemical
    505. Industry Outlook 89294716 Market SIZE ESTIMATES & FORECAST, BY APPLICATION,
    506. 2034 (USD Billions)   
    507.     Table 134. GCC Countries
    508. Chemical Industry Outlook 89294716 Market SIZE ESTIMATES & FORECAST, BY END
    509. USE INDUSTRY, 2025-2034 (USD Billions)   
    510.     Table 135.
    511. GCC Countries Chemical Industry Outlook 89294716 Market SIZE ESTIMATES & FORECAST,
    512. BY FORM, 2025-2034 (USD Billions)   
    513.     Table 136. GCC
    514. Countries Chemical Industry Outlook 89294716 Market SIZE ESTIMATES & FORECAST,
    515. BY REGIONAL, 2025-2034 (USD Billions)   
    516.     Table 137.
    517. South Africa Chemical Industry Outlook 89294716 Market SIZE ESTIMATES & FORECAST,
    518. BY PRODUCT TYPE, 2025-2034 (USD Billions)   
    519.     Table
    520. South Africa Chemical Industry Outlook 89294716 Market SIZE ESTIMATES &
    521. FORECAST, BY APPLICATION, 2025-2034 (USD Billions)   
    522. & FORECAST, BY END USE INDUSTRY, 2025-2034 (USD Billions)   
    523.   Table 140. South Africa Chemical Industry Outlook 89294716 Market SIZE ESTIMATES
    524. & FORECAST, BY FORM, 2025-2034 (USD Billions)   
    525. & FORECAST, BY REGIONAL, 2025-2034 (USD Billions)   
    526. & FORECAST, BY PRODUCT TYPE, 2025-2034 (USD Billions)   
    527.   Table 143. Rest of MEA Chemical Industry Outlook 89294716 Market SIZE ESTIMATES
    528. & FORECAST, BY APPLICATION, 2025-2034 (USD Billions)   
    529.   Table 144. Rest of MEA Chemical Industry Outlook 89294716 Market SIZE ESTIMATES
    530. & FORECAST, BY END USE INDUSTRY, 2025-2034 (USD Billions)   
    531.   Table 145. Rest of MEA Chemical Industry Outlook 89294716 Market SIZE ESTIMATES
    532. & FORECAST, BY FORM, 2025-2034 (USD Billions)   
    533. & FORECAST, BY REGIONAL, 2025-2034 (USD Billions)   
    534.   Table 148. ACQUISITION/PARTNERSHIP   
    535.     Figure 1. MARKET SYNOPSIS 
    536.   Figure 2. NORTH AMERICA CHEMICAL INDUSTRY OUTLOOK 89294716 MARKET ANALYSIS 
    537.     Figure 3. US CHEMICAL INDUSTRY OUTLOOK 89294716 MARKET ANALYSIS
    538. BY PRODUCT TYPE 
    539.     Figure 4. US CHEMICAL INDUSTRY OUTLOOK
    540. MARKET ANALYSIS BY APPLICATION 
    541.     Figure 5. US CHEMICAL
    542. INDUSTRY OUTLOOK 89294716 MARKET ANALYSIS BY END USE INDUSTRY 
    543.   Figure 6. US CHEMICAL INDUSTRY OUTLOOK 89294716 MARKET ANALYSIS BY FORM 
    544.     Figure 7. US CHEMICAL INDUSTRY OUTLOOK 89294716 MARKET ANALYSIS
    545. BY REGIONAL 
    546.     Figure 8. CANADA CHEMICAL INDUSTRY OUTLOOK
    547. MARKET ANALYSIS BY PRODUCT TYPE 
    548.     Figure 9. CANADA
    549. CHEMICAL INDUSTRY OUTLOOK 89294716 MARKET ANALYSIS BY APPLICATION 
    550.   Figure 10. CANADA CHEMICAL INDUSTRY OUTLOOK 89294716 MARKET ANALYSIS BY END
    551. USE INDUSTRY 
    552.     Figure 11. CANADA CHEMICAL INDUSTRY OUTLOOK
    553. MARKET ANALYSIS BY FORM 
    554.     Figure 12. CANADA CHEMICAL
    555. INDUSTRY OUTLOOK 89294716 MARKET ANALYSIS BY REGIONAL 
    556.     Figure
    557. EUROPE CHEMICAL INDUSTRY OUTLOOK 89294716 MARKET ANALYSIS 
    558.   Figure 14. GERMANY CHEMICAL INDUSTRY OUTLOOK 89294716 MARKET ANALYSIS BY
    559. PRODUCT TYPE 
    560.     Figure 15. GERMANY CHEMICAL INDUSTRY OUTLOOK
    561. MARKET ANALYSIS BY APPLICATION 
    562.     Figure 16. GERMANY
    563. CHEMICAL INDUSTRY OUTLOOK 89294716 MARKET ANALYSIS BY END USE INDUSTRY 
    564.     Figure 17. GERMANY CHEMICAL INDUSTRY OUTLOOK 89294716 MARKET ANALYSIS
    565. BY FORM 
    566.     Figure 18. GERMANY CHEMICAL INDUSTRY OUTLOOK 89294716
    567. MARKET ANALYSIS BY REGIONAL 
    568.     Figure 19. UK CHEMICAL INDUSTRY
    569. OUTLOOK 89294716 MARKET ANALYSIS BY PRODUCT TYPE 
    570.     Figure
    571. UK CHEMICAL INDUSTRY OUTLOOK 89294716 MARKET ANALYSIS BY APPLICATION 
    572.     Figure 21. UK CHEMICAL INDUSTRY OUTLOOK 89294716 MARKET ANALYSIS
    573. BY END USE INDUSTRY 
    574.     Figure 22. UK CHEMICAL INDUSTRY OUTLOOK
    575. MARKET ANALYSIS BY FORM 
    576.     Figure 23. UK CHEMICAL
    577. INDUSTRY OUTLOOK 89294716 MARKET ANALYSIS BY REGIONAL 
    578.     Figure
    579. FRANCE CHEMICAL INDUSTRY OUTLOOK 89294716 MARKET ANALYSIS BY PRODUCT TYPE 
    580.     Figure 25. FRANCE CHEMICAL INDUSTRY OUTLOOK 89294716 MARKET ANALYSIS
    581. BY APPLICATION 
    582.     Figure 26. FRANCE CHEMICAL INDUSTRY OUTLOOK
    583. MARKET ANALYSIS BY END USE INDUSTRY 
    584.     Figure 27.
    585. FRANCE CHEMICAL INDUSTRY OUTLOOK 89294716 MARKET ANALYSIS BY FORM 
    586.   Figure 28. FRANCE CHEMICAL INDUSTRY OUTLOOK 89294716 MARKET ANALYSIS BY REGIONAL 
    587.     Figure 29. RUSSIA CHEMICAL INDUSTRY OUTLOOK 89294716 MARKET ANALYSIS
    588. BY PRODUCT TYPE 
    589.     Figure 30. RUSSIA CHEMICAL INDUSTRY OUTLOOK
    590. MARKET ANALYSIS BY APPLICATION 
    591.     Figure 31. RUSSIA
    592. CHEMICAL INDUSTRY OUTLOOK 89294716 MARKET ANALYSIS BY END USE INDUSTRY 
    593.     Figure 32. RUSSIA CHEMICAL INDUSTRY OUTLOOK 89294716 MARKET ANALYSIS
    594. BY FORM 
    595.     Figure 33. RUSSIA CHEMICAL INDUSTRY OUTLOOK 89294716
    596. MARKET ANALYSIS BY REGIONAL 
    597.     Figure 34. ITALY CHEMICAL INDUSTRY
    598. OUTLOOK 89294716 MARKET ANALYSIS BY PRODUCT TYPE 
    599.     Figure
    600. ITALY CHEMICAL INDUSTRY OUTLOOK 89294716 MARKET ANALYSIS BY APPLICATION 
    601.     Figure 36. ITALY CHEMICAL INDUSTRY OUTLOOK 89294716 MARKET ANALYSIS
    602. BY END USE INDUSTRY 
    603.     Figure 37. ITALY CHEMICAL INDUSTRY
    604. OUTLOOK 89294716 MARKET ANALYSIS BY FORM 
    605.     Figure 38. ITALY
    606. CHEMICAL INDUSTRY OUTLOOK 89294716 MARKET ANALYSIS BY REGIONAL 
    607.   Figure 39. SPAIN CHEMICAL INDUSTRY OUTLOOK 89294716 MARKET ANALYSIS BY PRODUCT
    608. TYPE 
    609.     Figure 40. SPAIN CHEMICAL INDUSTRY OUTLOOK 89294716
    610. MARKET ANALYSIS BY APPLICATION 
    611.     Figure 41. SPAIN CHEMICAL
    612. INDUSTRY OUTLOOK 89294716 MARKET ANALYSIS BY END USE INDUSTRY 
    613.   Figure 42. SPAIN CHEMICAL INDUSTRY OUTLOOK 89294716 MARKET ANALYSIS BY FORM 
    614.     Figure 43. SPAIN CHEMICAL INDUSTRY OUTLOOK 89294716 MARKET ANALYSIS
    615. BY REGIONAL 
    616.     Figure 44. REST OF EUROPE CHEMICAL INDUSTRY
    617. OUTLOOK 89294716 MARKET ANALYSIS BY PRODUCT TYPE 
    618.     Figure
    619. REST OF EUROPE CHEMICAL INDUSTRY OUTLOOK 89294716 MARKET ANALYSIS BY APPLICATION 
    620.     Figure 46. REST OF EUROPE CHEMICAL INDUSTRY OUTLOOK 89294716 MARKET
    621. ANALYSIS BY END USE INDUSTRY 
    622.     Figure 47. REST OF EUROPE
    623. CHEMICAL INDUSTRY OUTLOOK 89294716 MARKET ANALYSIS BY FORM 
    624. REGIONAL 
    625.     Figure 49. APAC CHEMICAL INDUSTRY OUTLOOK 89294716
    626. MARKET ANALYSIS 
    627.     Figure 50. CHINA CHEMICAL INDUSTRY OUTLOOK
    628. MARKET ANALYSIS BY PRODUCT TYPE 
    629.     Figure 51. CHINA
    630. CHEMICAL INDUSTRY OUTLOOK 89294716 MARKET ANALYSIS BY APPLICATION 
    631.   Figure 52. CHINA CHEMICAL INDUSTRY OUTLOOK 89294716 MARKET ANALYSIS BY END
    632. USE INDUSTRY 
    633.     Figure 53. CHINA CHEMICAL INDUSTRY OUTLOOK
    634. MARKET ANALYSIS BY FORM 
    635.     Figure 54. CHINA CHEMICAL
    636. INDUSTRY OUTLOOK 89294716 MARKET ANALYSIS BY REGIONAL 
    637.     Figure
    638. INDIA CHEMICAL INDUSTRY OUTLOOK 89294716 MARKET ANALYSIS BY PRODUCT TYPE 
    639.     Figure 56. INDIA CHEMICAL INDUSTRY OUTLOOK 89294716 MARKET ANALYSIS
    640. BY APPLICATION 
    641.     Figure 57. INDIA CHEMICAL INDUSTRY OUTLOOK
    642. MARKET ANALYSIS BY END USE INDUSTRY 
    643.     Figure 58.
    644. INDIA CHEMICAL INDUSTRY OUTLOOK 89294716 MARKET ANALYSIS BY FORM 
    645.   Figure 59. INDIA CHEMICAL INDUSTRY OUTLOOK 89294716 MARKET ANALYSIS BY REGIONAL 
    646.     Figure 60. JAPAN CHEMICAL INDUSTRY OUTLOOK 89294716 MARKET ANALYSIS
    647. BY PRODUCT TYPE 
    648.     Figure 61. JAPAN CHEMICAL INDUSTRY OUTLOOK
    649. MARKET ANALYSIS BY APPLICATION 
    650.     Figure 62. JAPAN
    651. CHEMICAL INDUSTRY OUTLOOK 89294716 MARKET ANALYSIS BY END USE INDUSTRY 
    652.     Figure 63. JAPAN CHEMICAL INDUSTRY OUTLOOK 89294716 MARKET ANALYSIS
    653. BY FORM 
    654.     Figure 64. JAPAN CHEMICAL INDUSTRY OUTLOOK 89294716
    655. MARKET ANALYSIS BY REGIONAL 
    656.     Figure 65. SOUTH KOREA CHEMICAL
    657. INDUSTRY OUTLOOK 89294716 MARKET ANALYSIS BY PRODUCT TYPE 
    658.     Figure 67. SOUTH KOREA CHEMICAL INDUSTRY OUTLOOK 89294716 MARKET
    659. ANALYSIS BY END USE INDUSTRY 
    660.     Figure 68. SOUTH KOREA CHEMICAL
    661. INDUSTRY OUTLOOK 89294716 MARKET ANALYSIS BY FORM 
    662.     Figure
    663. SOUTH KOREA CHEMICAL INDUSTRY OUTLOOK 89294716 MARKET ANALYSIS BY REGIONAL 
    664.     Figure 70. MALAYSIA CHEMICAL INDUSTRY OUTLOOK 89294716 MARKET ANALYSIS
    665. BY PRODUCT TYPE 
    666.     Figure 71. MALAYSIA CHEMICAL INDUSTRY OUTLOOK
    667. MARKET ANALYSIS BY APPLICATION 
    668.     Figure 72. MALAYSIA
    669. CHEMICAL INDUSTRY OUTLOOK 89294716 MARKET ANALYSIS BY END USE INDUSTRY 
    670.     Figure 73. MALAYSIA CHEMICAL INDUSTRY OUTLOOK 89294716 MARKET ANALYSIS
    671. BY FORM 
    672.     Figure 74. MALAYSIA CHEMICAL INDUSTRY OUTLOOK 89294716
    673. MARKET ANALYSIS BY REGIONAL 
    674.     Figure 75. THAILAND CHEMICAL
    675. INDUSTRY OUTLOOK 89294716 MARKET ANALYSIS BY PRODUCT TYPE 
    676.     Figure 77. THAILAND CHEMICAL INDUSTRY OUTLOOK 89294716 MARKET ANALYSIS
    677. BY END USE INDUSTRY 
    678.     Figure 78. THAILAND CHEMICAL INDUSTRY
    679. OUTLOOK 89294716 MARKET ANALYSIS BY FORM 
    680.     Figure 79. THAILAND
    681. CHEMICAL INDUSTRY OUTLOOK 89294716 MARKET ANALYSIS BY REGIONAL 
    682.   Figure 80. INDONESIA CHEMICAL INDUSTRY OUTLOOK 89294716 MARKET ANALYSIS BY
    683. PRODUCT TYPE 
    684.     Figure 81. INDONESIA CHEMICAL INDUSTRY OUTLOOK
    685. MARKET ANALYSIS BY APPLICATION 
    686.     Figure 82. INDONESIA
    687. CHEMICAL INDUSTRY OUTLOOK 89294716 MARKET ANALYSIS BY END USE INDUSTRY 
    688.     Figure 83. INDONESIA CHEMICAL INDUSTRY OUTLOOK 89294716 MARKET ANALYSIS
    689. BY FORM 
    690.     Figure 84. INDONESIA CHEMICAL INDUSTRY OUTLOOK
    691. MARKET ANALYSIS BY REGIONAL 
    692.     Figure 85. REST OF
    693. APAC CHEMICAL INDUSTRY OUTLOOK 89294716 MARKET ANALYSIS BY PRODUCT TYPE 
    694.     Figure 86. REST OF APAC CHEMICAL INDUSTRY OUTLOOK 89294716 MARKET
    695. ANALYSIS BY APPLICATION 
    696.     Figure 87. REST OF APAC CHEMICAL
    697. INDUSTRY OUTLOOK 89294716 MARKET ANALYSIS BY END USE INDUSTRY 
    698.   Figure 88. REST OF APAC CHEMICAL INDUSTRY OUTLOOK 89294716 MARKET ANALYSIS
    699. BY FORM 
    700.     Figure 89. REST OF APAC CHEMICAL INDUSTRY OUTLOOK
    701. MARKET ANALYSIS BY REGIONAL 
    702.     Figure 90. SOUTH AMERICA
    703. CHEMICAL INDUSTRY OUTLOOK 89294716 MARKET ANALYSIS 
    704.     Figure
    705. BRAZIL CHEMICAL INDUSTRY OUTLOOK 89294716 MARKET ANALYSIS BY PRODUCT TYPE 
    706.     Figure 92. BRAZIL CHEMICAL INDUSTRY OUTLOOK 89294716 MARKET ANALYSIS
    707. BY APPLICATION 
    708.     Figure 93. BRAZIL CHEMICAL INDUSTRY OUTLOOK
    709. MARKET ANALYSIS BY END USE INDUSTRY 
    710.     Figure 94.
    711. BRAZIL CHEMICAL INDUSTRY OUTLOOK 89294716 MARKET ANALYSIS BY FORM 
    712.   Figure 95. BRAZIL CHEMICAL INDUSTRY OUTLOOK 89294716 MARKET ANALYSIS BY REGIONAL 
    713.     Figure 96. MEXICO CHEMICAL INDUSTRY OUTLOOK 89294716 MARKET ANALYSIS
    714. BY PRODUCT TYPE 
    715.     Figure 97. MEXICO CHEMICAL INDUSTRY OUTLOOK
    716. MARKET ANALYSIS BY APPLICATION 
    717.     Figure 98. MEXICO
    718. CHEMICAL INDUSTRY OUTLOOK 89294716 MARKET ANALYSIS BY END USE INDUSTRY 
    719.     Figure 99. MEXICO CHEMICAL INDUSTRY OUTLOOK 89294716 MARKET ANALYSIS
    720. BY FORM 
    721.     Figure 100. MEXICO CHEMICAL INDUSTRY OUTLOOK 89294716
    722. MARKET ANALYSIS BY REGIONAL 
    723.     Figure 101. ARGENTINA CHEMICAL
    724. INDUSTRY OUTLOOK 89294716 MARKET ANALYSIS BY PRODUCT TYPE 
    725.     Figure 103. ARGENTINA CHEMICAL INDUSTRY OUTLOOK 89294716 MARKET
    726. ANALYSIS BY END USE INDUSTRY 
    727.     Figure 104. ARGENTINA CHEMICAL
    728. INDUSTRY OUTLOOK 89294716 MARKET ANALYSIS BY FORM 
    729.     Figure
    730. ARGENTINA CHEMICAL INDUSTRY OUTLOOK 89294716 MARKET ANALYSIS BY REGIONAL 
    731.     Figure 106. REST OF SOUTH AMERICA CHEMICAL INDUSTRY OUTLOOK 89294716
    732. MARKET ANALYSIS BY PRODUCT TYPE 
    733.     Figure 107. REST OF SOUTH
    734. AMERICA CHEMICAL INDUSTRY OUTLOOK 89294716 MARKET ANALYSIS BY APPLICATION 
    735.     Figure 108. REST OF SOUTH AMERICA CHEMICAL INDUSTRY OUTLOOK 89294716
    736. MARKET ANALYSIS BY END USE INDUSTRY 
    737.     Figure 109. REST OF
    738. SOUTH AMERICA CHEMICAL INDUSTRY OUTLOOK 89294716 MARKET ANALYSIS BY FORM 
    739.     Figure 110. REST OF SOUTH AMERICA CHEMICAL INDUSTRY OUTLOOK 89294716
    740. MARKET ANALYSIS BY REGIONAL 
    741.     Figure 111. MEA CHEMICAL INDUSTRY
    742. OUTLOOK 89294716 MARKET ANALYSIS 
    743.     Figure 112. GCC COUNTRIES
    744. CHEMICAL INDUSTRY OUTLOOK 89294716 MARKET ANALYSIS BY PRODUCT TYPE 
    745.   Figure 113. GCC COUNTRIES CHEMICAL INDUSTRY OUTLOOK 89294716 MARKET ANALYSIS
    746. BY APPLICATION 
    747.     Figure 114. GCC COUNTRIES CHEMICAL INDUSTRY
    748. OUTLOOK 89294716 MARKET ANALYSIS BY END USE INDUSTRY 
    749.     Figure
    750. GCC COUNTRIES CHEMICAL INDUSTRY OUTLOOK 89294716 MARKET ANALYSIS BY FORM 
    751.     Figure 116. GCC COUNTRIES CHEMICAL INDUSTRY OUTLOOK 89294716 MARKET
    752. ANALYSIS BY REGIONAL 
    753.     Figure 117. SOUTH AFRICA CHEMICAL
    754. INDUSTRY OUTLOOK 89294716 MARKET ANALYSIS BY PRODUCT TYPE 
    755.     Figure 119. SOUTH AFRICA CHEMICAL INDUSTRY OUTLOOK 89294716 MARKET
    756. ANALYSIS BY END USE INDUSTRY 
    757.     Figure 120. SOUTH AFRICA CHEMICAL
    758. INDUSTRY OUTLOOK 89294716 MARKET ANALYSIS BY FORM 
    759.     Figure
    760. SOUTH AFRICA CHEMICAL INDUSTRY OUTLOOK 89294716 MARKET ANALYSIS BY REGIONAL 
    761.     Figure 122. REST OF MEA CHEMICAL INDUSTRY OUTLOOK 89294716 MARKET
    762. ANALYSIS BY PRODUCT TYPE 
    763.     Figure 123. REST OF MEA CHEMICAL
    764. INDUSTRY OUTLOOK 89294716 MARKET ANALYSIS BY APPLICATION 
    765. USE INDUSTRY 
    766.     Figure 125. REST OF MEA CHEMICAL INDUSTRY
    767. OUTLOOK 89294716 MARKET ANALYSIS BY FORM 
    768.     Figure 126. REST
    769. OF MEA CHEMICAL INDUSTRY OUTLOOK 89294716 MARKET ANALYSIS BY REGIONAL 
    770.   Figure 127. KEY BUYING CRITERIA OF CHEMICAL INDUSTRY OUTLOOK 89294716 MARKET 
    771.     Figure 128. RESEARCH PROCESS OF MRFR 
    772.     Figure
    773. DRO ANALYSIS OF CHEMICAL INDUSTRY OUTLOOK 89294716 MARKET 
    774.   Figure 130. DRIVERS IMPACT ANALYSIS: CHEMICAL INDUSTRY OUTLOOK 89294716 MARKET 
    775.     Figure 131. RESTRAINTS IMPACT ANALYSIS: CHEMICAL INDUSTRY OUTLOOK
    776. MARKET 
    777.     Figure 132. SUPPLY / VALUE CHAIN: CHEMICAL
    778. INDUSTRY OUTLOOK 89294716 MARKET 
    779.     Figure 133. CHEMICAL INDUSTRY
    780. OUTLOOK 89294716 MARKET, BY PRODUCT TYPE, 2024 (% SHARE) 
    781. (USD Billions) 
    782.     Figure 135. CHEMICAL INDUSTRY OUTLOOK 89294716
    783. MARKET, BY APPLICATION, 2024 (% SHARE) 
    784.     Figure 136. CHEMICAL
    785. INDUSTRY OUTLOOK 89294716 MARKET, BY APPLICATION, 2025-2034 (USD Billions) 
    786.     Figure 137. CHEMICAL INDUSTRY OUTLOOK 89294716 MARKET, BY END USE
    787. INDUSTRY, 2024 (% SHARE) 
    788.     Figure 138. CHEMICAL INDUSTRY
    789. OUTLOOK 89294716 MARKET, BY END USE INDUSTRY, 2025-2034 (USD Billions) 
    790.     Figure 139. CHEMICAL INDUSTRY OUTLOOK 89294716 MARKET, BY FORM,
    791. (% SHARE) 
    792.     Figure 140. CHEMICAL INDUSTRY OUTLOOK 89294716
    793. MARKET, BY FORM, 2025-2034 (USD Billions) 
    794.     Figure 141. CHEMICAL
    795. INDUSTRY OUTLOOK 89294716 MARKET, BY REGIONAL, 2024 (% SHARE) 
    796.   Figure 142. CHEMICAL INDUSTRY OUTLOOK 89294716 MARKET, BY REGIONAL, 2025-2034
    797. (USD Billions) 
    798.     Figure 143. BENCHMARKING OF MAJOR COMPETITORS

    Chemical Industry Market Segmentation

    Chemical Industry By Product Type (USD Billion, 2019-2032)

    • Basic Chemicals
    • Specialty Chemicals
    • Agricultural Chemicals
    • Petrochemicals
    • Consumer Chemicals


    Chemical Industry By Application (USD Billion, 2019-2032)

    • Agriculture
    • Pharmaceuticals
    • Construction
    • Automotive
    • Food Beverage


    Chemical Industry By End Use Industry (USD Billion, 2019-2032)

    • Manufacturing
    • Packaging
    • Textiles
    • Food Processing
    • Healthcare


    Chemical Industry By Form (USD Billion, 2019-2032)

    • Liquid
    • Solid
    • Gas


    Chemical Industry By Regional (USD Billion, 2019-2032)

    • North America
    • Europe
    • South America
    • Asia Pacific
    • Middle East and Africa


    Chemical Industry Regional Outlook (USD Billion, 2019-2032)


    • North America Outlook (USD Billion, 2019-2032)

      • North America Chemical Industry by Product Type

        • Basic Chemicals
        • Specialty Chemicals
        • Agricultural Chemicals
        • Petrochemicals
        • Consumer Chemicals
      • North America Chemical Industry by Application Type

        • Agriculture
        • Pharmaceuticals
        • Construction
        • Automotive
        • Food Beverage
      • North America Chemical Industry by End Use Industry Type

        • Manufacturing
        • Packaging
        • Textiles
        • Food Processing
        • Healthcare
      • North America Chemical Industry by Form Type

        • Liquid
        • Solid
        • Gas
      • North America Chemical Industry by Regional Type

        • US
        • Canada
      • US Outlook (USD Billion, 2019-2032)
      • US Chemical Industry by Product Type

        • Basic Chemicals
        • Specialty Chemicals
        • Agricultural Chemicals
        • Petrochemicals
        • Consumer Chemicals
      • US Chemical Industry by Application Type

        • Agriculture
        • Pharmaceuticals
        • Construction
        • Automotive
        • Food Beverage
      • US Chemical Industry by End Use Industry Type

        • Manufacturing
        • Packaging
        • Textiles
        • Food Processing
        • Healthcare
      • US Chemical Industry by Form Type

        • Liquid
        • Solid
        • Gas
      • CANADA Outlook (USD Billion, 2019-2032)
      • CANADA Chemical Industry by Product Type

        • Basic Chemicals
        • Specialty Chemicals
        • Agricultural Chemicals
        • Petrochemicals
        • Consumer Chemicals
      • CANADA Chemical Industry by Application Type

        • Agriculture
        • Pharmaceuticals
        • Construction
        • Automotive
        • Food Beverage
      • CANADA Chemical Industry by End Use Industry Type

        • Manufacturing
        • Packaging
        • Textiles
        • Food Processing
        • Healthcare
      • CANADA Chemical Industry by Form Type

        • Liquid
        • Solid
        • Gas
    • Europe Outlook (USD Billion, 2019-2032)

      • Europe Chemical Industry by Product Type

        • Basic Chemicals
        • Specialty Chemicals
        • Agricultural Chemicals
        • Petrochemicals
        • Consumer Chemicals
      • Europe Chemical Industry by Application Type

        • Agriculture
        • Pharmaceuticals
        • Construction
        • Automotive
        • Food Beverage
      • Europe Chemical Industry by End Use Industry Type

        • Manufacturing
        • Packaging
        • Textiles
        • Food Processing
        • Healthcare
      • Europe Chemical Industry by Form Type

        • Liquid
        • Solid
        • Gas
      • Europe Chemical Industry by Regional Type

        • Germany
        • UK
        • France
        • Russia
        • Italy
        • Spain
        • Rest of Europe
      • GERMANY Outlook (USD Billion, 2019-2032)
      • GERMANY Chemical Industry by Product Type

        • Basic Chemicals
        • Specialty Chemicals
        • Agricultural Chemicals
        • Petrochemicals
        • Consumer Chemicals
      • GERMANY Chemical Industry by Application Type

        • Agriculture
        • Pharmaceuticals
        • Construction
        • Automotive
        • Food Beverage
      • GERMANY Chemical Industry by End Use Industry Type

        • Manufacturing
        • Packaging
        • Textiles
        • Food Processing
        • Healthcare
      • GERMANY Chemical Industry by Form Type

        • Liquid
        • Solid
        • Gas
      • UK Outlook (USD Billion, 2019-2032)
      • UK Chemical Industry by Product Type

        • Basic Chemicals
        • Specialty Chemicals
        • Agricultural Chemicals
        • Petrochemicals
        • Consumer Chemicals
      • UK Chemical Industry by Application Type

        • Agriculture
        • Pharmaceuticals
        • Construction
        • Automotive
        • Food Beverage
      • UK Chemical Industry by End Use Industry Type

        • Manufacturing
        • Packaging
        • Textiles
        • Food Processing
        • Healthcare
      • UK Chemical Industry by Form Type

        • Liquid
        • Solid
        • Gas
      • FRANCE Outlook (USD Billion, 2019-2032)
      • FRANCE Chemical Industry by Product Type

        • Basic Chemicals
        • Specialty Chemicals
        • Agricultural Chemicals
        • Petrochemicals
        • Consumer Chemicals
      • FRANCE Chemical Industry by Application Type

        • Agriculture
        • Pharmaceuticals
        • Construction
        • Automotive
        • Food Beverage
      • FRANCE Chemical Industry by End Use Industry Type

        • Manufacturing
        • Packaging
        • Textiles
        • Food Processing
        • Healthcare
      • FRANCE Chemical Industry by Form Type

        • Liquid
        • Solid
        • Gas
      • RUSSIA Outlook (USD Billion, 2019-2032)
      • RUSSIA Chemical Industry by Product Type

        • Basic Chemicals
        • Specialty Chemicals
        • Agricultural Chemicals
        • Petrochemicals
        • Consumer Chemicals
      • RUSSIA Chemical Industry by Application Type

        • Agriculture
        • Pharmaceuticals
        • Construction
        • Automotive
        • Food Beverage
      • RUSSIA Chemical Industry by End Use Industry Type

        • Manufacturing
        • Packaging
        • Textiles
        • Food Processing
        • Healthcare
      • RUSSIA Chemical Industry by Form Type

        • Liquid
        • Solid
        • Gas
      • ITALY Outlook (USD Billion, 2019-2032)
      • ITALY Chemical Industry by Product Type

        • Basic Chemicals
        • Specialty Chemicals
        • Agricultural Chemicals
        • Petrochemicals
        • Consumer Chemicals
      • ITALY Chemical Industry by Application Type

        • Agriculture
        • Pharmaceuticals
        • Construction
        • Automotive
        • Food Beverage
      • ITALY Chemical Industry by End Use Industry Type

        • Manufacturing
        • Packaging
        • Textiles
        • Food Processing
        • Healthcare
      • ITALY Chemical Industry by Form Type

        • Liquid
        • Solid
        • Gas
      • SPAIN Outlook (USD Billion, 2019-2032)
      • SPAIN Chemical Industry by Product Type

        • Basic Chemicals
        • Specialty Chemicals
        • Agricultural Chemicals
        • Petrochemicals
        • Consumer Chemicals
      • SPAIN Chemical Industry by Application Type

        • Agriculture
        • Pharmaceuticals
        • Construction
        • Automotive
        • Food Beverage
      • SPAIN Chemical Industry by End Use Industry Type

        • Manufacturing
        • Packaging
        • Textiles
        • Food Processing
        • Healthcare
      • SPAIN Chemical Industry by Form Type

        • Liquid
        • Solid
        • Gas
      • REST OF EUROPE Outlook (USD Billion, 2019-2032)
      • REST OF EUROPE Chemical Industry by Product Type

        • Basic Chemicals
        • Specialty Chemicals
        • Agricultural Chemicals
        • Petrochemicals
        • Consumer Chemicals
      • REST OF EUROPE Chemical Industry by Application Type

        • Agriculture
        • Pharmaceuticals
        • Construction
        • Automotive
        • Food Beverage
      • REST OF EUROPE Chemical Industry by End Use Industry Type

        • Manufacturing
        • Packaging
        • Textiles
        • Food Processing
        • Healthcare
      • REST OF EUROPE Chemical Industry by Form Type

        • Liquid
        • Solid
        • Gas
    • APAC Outlook (USD Billion, 2019-2032)

      • APAC Chemical Industry by Product Type

        • Basic Chemicals
        • Specialty Chemicals
        • Agricultural Chemicals
        • Petrochemicals
        • Consumer Chemicals
      • APAC Chemical Industry by Application Type

        • Agriculture
        • Pharmaceuticals
        • Construction
        • Automotive
        • Food Beverage
      • APAC Chemical Industry by End Use Industry Type

        • Manufacturing
        • Packaging
        • Textiles
        • Food Processing
        • Healthcare
      • APAC Chemical Industry by Form Type

        • Liquid
        • Solid
        • Gas
      • APAC Chemical Industry by Regional Type

        • China
        • India
        • Japan
        • South Korea
        • Malaysia
        • Thailand
        • Indonesia
        • Rest of APAC
      • CHINA Outlook (USD Billion, 2019-2032)
      • CHINA Chemical Industry by Product Type

        • Basic Chemicals
        • Specialty Chemicals
        • Agricultural Chemicals
        • Petrochemicals
        • Consumer Chemicals
      • CHINA Chemical Industry by Application Type

        • Agriculture
        • Pharmaceuticals
        • Construction
        • Automotive
        • Food Beverage
      • CHINA Chemical Industry by End Use Industry Type

        • Manufacturing
        • Packaging
        • Textiles
        • Food Processing
        • Healthcare
      • CHINA Chemical Industry by Form Type

        • Liquid
        • Solid
        • Gas
      • INDIA Outlook (USD Billion, 2019-2032)
      • INDIA Chemical Industry by Product Type

        • Basic Chemicals
        • Specialty Chemicals
        • Agricultural Chemicals
        • Petrochemicals
        • Consumer Chemicals
      • INDIA Chemical Industry by Application Type

        • Agriculture
        • Pharmaceuticals
        • Construction
        • Automotive
        • Food Beverage
      • INDIA Chemical Industry by End Use Industry Type

        • Manufacturing
        • Packaging
        • Textiles
        • Food Processing
        • Healthcare
      • INDIA Chemical Industry by Form Type

        • Liquid
        • Solid
        • Gas
      • JAPAN Outlook (USD Billion, 2019-2032)
      • JAPAN Chemical Industry by Product Type

        • Basic Chemicals
        • Specialty Chemicals
        • Agricultural Chemicals
        • Petrochemicals
        • Consumer Chemicals
      • JAPAN Chemical Industry by Application Type

        • Agriculture
        • Pharmaceuticals
        • Construction
        • Automotive
        • Food Beverage
      • JAPAN Chemical Industry by End Use Industry Type

        • Manufacturing
        • Packaging
        • Textiles
        • Food Processing
        • Healthcare
      • JAPAN Chemical Industry by Form Type

        • Liquid
        • Solid
        • Gas
      • SOUTH KOREA Outlook (USD Billion, 2019-2032)
      • SOUTH KOREA Chemical Industry by Product Type

        • Basic Chemicals
        • Specialty Chemicals
        • Agricultural Chemicals
        • Petrochemicals
        • Consumer Chemicals
      • SOUTH KOREA Chemical Industry by Application Type

        • Agriculture
        • Pharmaceuticals
        • Construction
        • Automotive
        • Food Beverage
      • SOUTH KOREA Chemical Industry by End Use Industry Type

        • Manufacturing
        • Packaging
        • Textiles
        • Food Processing
        • Healthcare
      • SOUTH KOREA Chemical Industry by Form Type

        • Liquid
        • Solid
        • Gas
      • MALAYSIA Outlook (USD Billion, 2019-2032)
      • MALAYSIA Chemical Industry by Product Type

        • Basic Chemicals
        • Specialty Chemicals
        • Agricultural Chemicals
        • Petrochemicals
        • Consumer Chemicals
      • MALAYSIA Chemical Industry by Application Type

        • Agriculture
        • Pharmaceuticals
        • Construction
        • Automotive
        • Food Beverage
      • MALAYSIA Chemical Industry by End Use Industry Type

        • Manufacturing
        • Packaging
        • Textiles
        • Food Processing
        • Healthcare
      • MALAYSIA Chemical Industry by Form Type

        • Liquid
        • Solid
        • Gas
      • THAILAND Outlook (USD Billion, 2019-2032)
      • THAILAND Chemical Industry by Product Type

        • Basic Chemicals
        • Specialty Chemicals
        • Agricultural Chemicals
        • Petrochemicals
        • Consumer Chemicals
      • THAILAND Chemical Industry by Application Type

        • Agriculture
        • Pharmaceuticals
        • Construction
        • Automotive
        • Food Beverage
      • THAILAND Chemical Industry by End Use Industry Type

        • Manufacturing
        • Packaging
        • Textiles
        • Food Processing
        • Healthcare
      • THAILAND Chemical Industry by Form Type

        • Liquid
        • Solid
        • Gas
      • INDONESIA Outlook (USD Billion, 2019-2032)
      • INDONESIA Chemical Industry by Product Type

        • Basic Chemicals
        • Specialty Chemicals
        • Agricultural Chemicals
        • Petrochemicals
        • Consumer Chemicals
      • INDONESIA Chemical Industry by Application Type

        • Agriculture
        • Pharmaceuticals
        • Construction
        • Automotive
        • Food Beverage
      • INDONESIA Chemical Industry by End Use Industry Type

        • Manufacturing
        • Packaging
        • Textiles
        • Food Processing
        • Healthcare
      • INDONESIA Chemical Industry by Form Type

        • Liquid
        • Solid
        • Gas
      • REST OF APAC Outlook (USD Billion, 2019-2032)
      • REST OF APAC Chemical Industry by Product Type

        • Basic Chemicals
        • Specialty Chemicals
        • Agricultural Chemicals
        • Petrochemicals
        • Consumer Chemicals
      • REST OF APAC Chemical Industry by Application Type

        • Agriculture
        • Pharmaceuticals
        • Construction
        • Automotive
        • Food Beverage
      • REST OF APAC Chemical Industry by End Use Industry Type

        • Manufacturing
        • Packaging
        • Textiles
        • Food Processing
        • Healthcare
      • REST OF APAC Chemical Industry by Form Type

        • Liquid
        • Solid
        • Gas
    • South America Outlook (USD Billion, 2019-2032)

      • South America Chemical Industry by Product Type

        • Basic Chemicals
        • Specialty Chemicals
        • Agricultural Chemicals
        • Petrochemicals
        • Consumer Chemicals
      • South America Chemical Industry by Application Type

        • Agriculture
        • Pharmaceuticals
        • Construction
        • Automotive
        • Food Beverage
      • South America Chemical Industry by End Use Industry Type

        • Manufacturing
        • Packaging
        • Textiles
        • Food Processing
        • Healthcare
      • South America Chemical Industry by Form Type

        • Liquid
        • Solid
        • Gas
      • South America Chemical Industry by Regional Type

        • Brazil
        • Mexico
        • Argentina
        • Rest of South America
      • BRAZIL Outlook (USD Billion, 2019-2032)
      • BRAZIL Chemical Industry by Product Type

        • Basic Chemicals
        • Specialty Chemicals
        • Agricultural Chemicals
        • Petrochemicals
        • Consumer Chemicals
      • BRAZIL Chemical Industry by Application Type

        • Agriculture
        • Pharmaceuticals
        • Construction
        • Automotive
        • Food Beverage
      • BRAZIL Chemical Industry by End Use Industry Type

        • Manufacturing
        • Packaging
        • Textiles
        • Food Processing
        • Healthcare
      • BRAZIL Chemical Industry by Form Type

        • Liquid
        • Solid
        • Gas
      • MEXICO Outlook (USD Billion, 2019-2032)
      • MEXICO Chemical Industry by Product Type

        • Basic Chemicals
        • Specialty Chemicals
        • Agricultural Chemicals
        • Petrochemicals
        • Consumer Chemicals
      • MEXICO Chemical Industry by Application Type

        • Agriculture
        • Pharmaceuticals
        • Construction
        • Automotive
        • Food Beverage
      • MEXICO Chemical Industry by End Use Industry Type

        • Manufacturing
        • Packaging
        • Textiles
        • Food Processing
        • Healthcare
      • MEXICO Chemical Industry by Form Type

        • Liquid
        • Solid
        • Gas
      • ARGENTINA Outlook (USD Billion, 2019-2032)
      • ARGENTINA Chemical Industry by Product Type

        • Basic Chemicals
        • Specialty Chemicals
        • Agricultural Chemicals
        • Petrochemicals
        • Consumer Chemicals
      • ARGENTINA Chemical Industry by Application Type

        • Agriculture
        • Pharmaceuticals
        • Construction
        • Automotive
        • Food Beverage
      • ARGENTINA Chemical Industry by End Use Industry Type

        • Manufacturing
        • Packaging
        • Textiles
        • Food Processing
        • Healthcare
      • ARGENTINA Chemical Industry by Form Type

        • Liquid
        • Solid
        • Gas
      • REST OF SOUTH AMERICA Outlook (USD Billion, 2019-2032)
      • REST OF SOUTH AMERICA Chemical Industry by Product Type

        • Basic Chemicals
        • Specialty Chemicals
        • Agricultural Chemicals
        • Petrochemicals
        • Consumer Chemicals
      • REST OF SOUTH AMERICA Chemical Industry by Application Type

        • Agriculture
        • Pharmaceuticals
        • Construction
        • Automotive
        • Food Beverage
      • REST OF SOUTH AMERICA Chemical Industry by End Use Industry Type

        • Manufacturing
        • Packaging
        • Textiles
        • Food Processing
        • Healthcare
      • REST OF SOUTH AMERICA Chemical Industry by Form Type

        • Liquid
        • Solid
        • Gas
    • MEA Outlook (USD Billion, 2019-2032)

      • MEA Chemical Industry by Product Type

        • Basic Chemicals
        • Specialty Chemicals
        • Agricultural Chemicals
        • Petrochemicals
        • Consumer Chemicals
      • MEA Chemical Industry by Application Type

        • Agriculture
        • Pharmaceuticals
        • Construction
        • Automotive
        • Food Beverage
      • MEA Chemical Industry by End Use Industry Type

        • Manufacturing
        • Packaging
        • Textiles
        • Food Processing
        • Healthcare
      • MEA Chemical Industry by Form Type

        • Liquid
        • Solid
        • Gas
      • MEA Chemical Industry by Regional Type

        • GCC Countries
        • South Africa
        • Rest of MEA
      • GCC COUNTRIES Outlook (USD Billion, 2019-2032)
      • GCC COUNTRIES Chemical Industry by Product Type

        • Basic Chemicals
        • Specialty Chemicals
        • Agricultural Chemicals
        • Petrochemicals
        • Consumer Chemicals
      • GCC COUNTRIES Chemical Industry by Application Type

        • Agriculture
        • Pharmaceuticals
        • Construction
        • Automotive
        • Food Beverage
      • GCC COUNTRIES Chemical Industry by End Use Industry Type

        • Manufacturing
        • Packaging
        • Textiles
        • Food Processing
        • Healthcare
      • GCC COUNTRIES Chemical Industry by Form Type

        • Liquid
        • Solid
        • Gas
      • SOUTH AFRICA Outlook (USD Billion, 2019-2032)
      • SOUTH AFRICA Chemical Industry by Product Type

        • Basic Chemicals
        • Specialty Chemicals
        • Agricultural Chemicals
        • Petrochemicals
        • Consumer Chemicals
      • SOUTH AFRICA Chemical Industry by Application Type

        • Agriculture
        • Pharmaceuticals
        • Construction
        • Automotive
        • Food Beverage
      • SOUTH AFRICA Chemical Industry by End Use Industry Type

        • Manufacturing
        • Packaging
        • Textiles
        • Food Processing
        • Healthcare
      • SOUTH AFRICA Chemical Industry by Form Type

        • Liquid
        • Solid
        • Gas
      • REST OF MEA Outlook (USD Billion, 2019-2032)
      • REST OF MEA Chemical Industry by Product Type

        • Basic Chemicals
        • Specialty Chemicals
        • Agricultural Chemicals
        • Petrochemicals
        • Consumer Chemicals
      • REST OF MEA Chemical Industry by Application Type

        • Agriculture
        • Pharmaceuticals
        • Construction
        • Automotive
        • Food Beverage
      • REST OF MEA Chemical Industry by End Use Industry Type

        • Manufacturing
        • Packaging
        • Textiles
        • Food Processing
        • Healthcare
      • REST OF MEA Chemical Industry by Form Type

        • Liquid
        • Solid
        • Gas


    Report Infographic
    Free Sample Request

    Kindly complete the form below to receive a free sample of this Report

    Customer Strories

    “I am very pleased with how market segments have been defined in a relevant way for my purposes (such as "Portable Freezers & refrigerators" and "last-mile"). In general the report is well structured. Thanks very much for your efforts.”

    Victoria Milne Founder
    Case Study

    Chemicals and Materials