• Cat-intel
  • MedIntelliX
  • Resources
  • About Us
  • Hero Background
    English
    Chinese
    French
    Japanese
    Korean
    German
    Spanish

    Garcinia Market Share

    ID: MRFR/F-B & N/0856-CR
    100 Pages
    Tejas Chaudhary
    February 2020

    Garcinia Market Research Report By Form (Powder, Capsule, Liquid, Extract, Tablet), By Application (Dietary Supplements, Food and Beverages, Cosmetics, Pharmaceuticals), By Distribution Channel (Online Retail, Supermarkets, Health Stores, Pharmacies), By End Use (Adults, Elderly, Athletes) and By Regional (North America, Europe, South America, Asia Pacific, Middle East and Africa) - Forecast ...

    Share:
    Download PDF ×

    We do not share your information with anyone. However, we may send you emails based on your report interest from time to time. You may contact us at any time to opt-out.

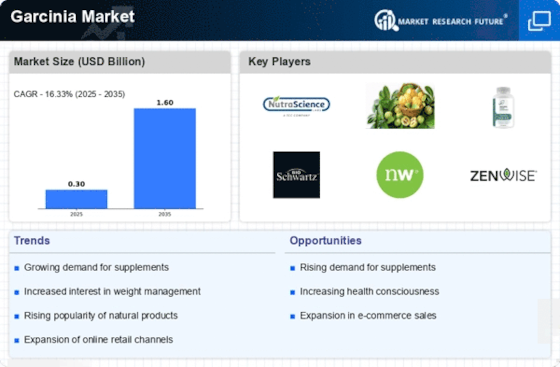
    Garcinia Market Infographic
    $ 4,950.0
    $ 5,950.0
    $ 7,250.0

    Market Share

    Garcinia Market Share Analysis

    The escalating concern for healthcare and a growing emphasis on well-being have triggered a heightened demand for food products crafted from natural and healthful ingredients. In this landscape, garcinia, a fruit rich in natural proteins, polyphenols, oleic and stearic triglycerides, minerals, and vitamins, has emerged as a noteworthy contender. Recognized for its natural and healthy attributes, garcinia extract is increasingly becoming a viable alternative to synthetic ingredients commonly added to food products for flavor enhancement and preservation. Consumers worldwide are displaying a discerning shift towards food products that boast a 'no artificial ingredients' claim. According to Ingredion Incorporated, a prominent food and beverage ingredient manufacturer, the percentage of Chinese consumers who switched brands due to such claims rose from 54% in 2013 to 65% in 2014. A parallel trend was observed in Japan, where the percentage increased from 37% in 2014 to 44% in 2015. This shift in consumer behavior is indicative of a growing preference for natural and unadulterated food options. Major players in the food industry, including Nestlé, General Mills, Kellogg’s, and Hershey’s, have actively embraced this trend. Since 2015, these brands have initiated the use of natural flavors in products marketed in the United States. This shift underscores the industry's acknowledgment of the demand for natural ingredients, with garcinia poised to play a significant role in this evolving landscape. Garcinia finds major applications in functional food and beverages as well as dietary supplements. The surge in popularity of functional foods and dietary supplements is a notable trend in recent years. These products have witnessed increased adoption as consumers focus on aspects such as gut health, body weight management, inflammatory ailments, and gastrointestinal issues. The incorporation of garcinia-based supplements into daily meals has seen a notable uptick globally, aligning with the broader trend of seeking natural solutions for overall well-being. The burgeoning demand for natural and healthful ingredients across various applications is anticipated to be a driving force behind the growth of the global garcinia market. As consumers become increasingly discerning about the contents of their food and seek options aligned with their health-conscious preferences, the appeal of garcinia as a natural ingredient is expected to further intensify.

    Market Summary

    As per Market Research Future Analysis, the Global Garcinia Market was valued at 0.22 USD Billion in 2022 and is projected to grow to 1.0 USD Billion by 2032, reflecting a CAGR of 16.33% from 2024 to 2032. The market is driven by increasing health consciousness, demand for natural dietary supplements, and the rise of e-commerce platforms enhancing product accessibility. The popularity of Garcinia cambogia for weight management and the shift towards organic products further support market growth.

    Key Market Trends & Highlights

    Key trends driving the Garcinia Market include:

    • Rising consumer awareness of health and wellness is boosting demand for Garcinia products.
    • The Powder form of Garcinia is projected to grow from 0.09 USD Billion in 2023 to 0.36 USD Billion by 2032.
    • Online retail is becoming the preferred distribution channel, enhancing product accessibility.
    • The Adult demographic is the primary end-user, significantly influencing market dynamics.

    Market Size & Forecast

    2022 Market Size USD 0.22 Billion
    2023 Market Size USD 0.26 Billion
    2032 Market Size USD 1.0 Billion
    CAGR (2024-2032) 16.33%
    Largest Regional Market Share in 2023 North America.

    Major Players

    Key players in the Garcinia Market include Zazzee, Garcinia Cambogia Select, Herbalife, NatureWise, Garden of Life, Goli Nutrition, BioSense, NOW Foods, NutraBlast, Keto Diet, BulkSupplements, and Divine Bounty.

    Market Trends

    The Garcinia Market is witnessing significant growth, largely driven by rising consumer awareness of health and wellness. This awareness has led to an increased demand for natural

    dietary supplements

    and weight-loss products, with Garcinia cambogia emerging as a popular choice due to its purported benefits in weight management. The shift towards adopting a healthier lifestyle, coupled with a growing inclination for plant-based products, has further propelled the growth of this market. Additionally, the easy availability of Garcinia products through online platforms has enhanced consumer access, fueling increased sales and demand. There are numerous opportunities within the market that can be explored for future growth.

    The expanding vegan and vegetarian population presents a potential target market for Garcinia products, as these consumers often seek natural, plant-based solutions to assist with

    weight control

    Consumers are becoming more discerning about the ingredients they consume and are opting for products that align with their values of sustainability and ethical sourcing. There is a noticeable shift towards products that are labeled as non-GMO,

    gluten-free,

    and organic, reflecting a desire for cleaner consumption. Additionally, the market is seeing a surge in the use of Garcinia in combination with other ingredients, enhancing its appeal in functional foods and beverages. As awareness continues to grow and product offerings diversify, the Garcinia Market is poised for continued evolution and expansion.

    The growing consumer inclination towards natural weight management solutions appears to bolster the demand for Garcinia products in the global market.

    U.S. Department of Agriculture

    Garcinia Market Market Drivers

    Rising Obesity Rates

    The Global Garcinia Market Industry is significantly influenced by rising obesity rates globally, prompting individuals to seek effective weight management solutions. Garcinia, often marketed as a natural weight loss aid, aligns with the growing demand for products that support weight control. The increasing prevalence of obesity-related health issues has led to a heightened focus on dietary supplements that can assist in weight loss efforts. As the market evolves, it is anticipated that the CAGR of 16.08% from 2025 to 2035 will reflect the industry's response to these health challenges, further solidifying Garcinia's position in the supplement market.

    Market Growth Projections

    The Global Garcinia Market Industry is projected to experience substantial growth over the next decade. With a market value of 0.31 USD Billion in 2024, it is anticipated to reach 1.57 USD Billion by 2035, reflecting a robust CAGR of 16.08% from 2025 to 2035. This growth is indicative of the increasing consumer interest in natural health products and the expanding applications of Garcinia in various sectors, including dietary supplements and functional foods. The market's expansion is likely to be driven by ongoing research and development efforts aimed at enhancing the efficacy and appeal of Garcinia-based products.

    Rising Health Consciousness

    The Global Garcinia Market Industry is experiencing a surge in demand driven by increasing health consciousness among consumers. As individuals become more aware of the benefits of natural supplements, Garcinia, known for its potential weight loss properties, has gained traction. In 2024, the market is valued at 0.31 USD Billion, reflecting a growing preference for herbal and organic products. This trend is likely to continue as consumers seek alternatives to synthetic weight loss solutions, thereby expanding the market's reach. The emphasis on preventive healthcare and wellness is expected to further bolster the industry's growth.

    Expansion of E-commerce Platforms

    The Global Garcinia Market Industry is benefiting from the rapid expansion of e-commerce platforms, which facilitate easier access to Garcinia products. Online retailing has transformed consumer purchasing behaviors, allowing for a broader reach and convenience. This shift is particularly significant as consumers increasingly prefer shopping from home, especially for health-related products. E-commerce sales of Garcinia are expected to rise, contributing to the market's growth. The accessibility of information and customer reviews online also enhances consumer confidence, potentially leading to increased sales and market penetration in the coming years.

    Growing Demand for Natural Supplements

    The Global Garcinia Market Industry is witnessing a notable increase in the demand for natural dietary supplements. As consumers shift towards holistic health approaches, Garcinia has emerged as a popular choice due to its perceived health benefits, including appetite suppression and fat metabolism enhancement. This trend aligns with the broader movement towards clean label products, where consumers prefer transparency in ingredient sourcing. By 2035, the market is projected to reach 1.57 USD Billion, indicating a robust growth trajectory. The rising awareness of the adverse effects of synthetic additives further propels the demand for natural alternatives like Garcinia.

    Regulatory Support for Herbal Products

    The Global Garcinia Market Industry is positively impacted by regulatory support for herbal and natural products. Governments worldwide are increasingly recognizing the potential health benefits of herbal supplements, leading to favorable regulations that encourage their use. This support not only enhances consumer trust but also stimulates market growth by ensuring product safety and efficacy. As regulatory frameworks evolve, they are likely to facilitate the entry of new Garcinia products into the market, thereby expanding the range of options available to consumers. This trend is expected to contribute to the overall growth of the industry.

    Market Segment Insights

    Garcinia Form Insights   

    The Garcinia Market shows significant potential within the Form segment, which is a critical component for consumers seeking various applications of Garcinia. In 2023, the market has generated a revenue of approximately 0.26 USD Billion and is expected to grow considerably by 2032. This segment includes various formats of Garcinia products, including Powder, Capsule, Liquid, Extract, and Tablet. Among these, the Powder form dominates the market with a valuation of 0.09 USD Billion in 2023, projected to reach 0.36 USD Billion in 2032, highlighting its preference among consumers for its versatility in usage.

    The popularity of Powder is attributed to the increasing demand for natural dietary supplements and health products that consumers can easily incorporate into their daily routines.

    Capsules also represent a significant portion of the market, valued at 0.07 USD Billion in 2023 and expected to grow to 0.28 USD Billion by 2032. The capsule form is favored for its convenience, portability, and precise dosage, appealing to health-conscious individuals looking for easy-to-consume options. Liquid forms, while currently valued at 0.04 USD Billion in 2023, are projected to escalate to 0.16 USD Billion by 2032, indicating a growing trend towards liquid supplementation that caters to consumers who prefer drinks or smoothies for their nutritional needs.

    The Extract form has a smaller share, with a valuation of 0.03 USD Billion in 2023, anticipated to rise to 0.12 USD Billion in 2032; it serves a niche market focused on concentrated health benefits. Similarly, Tablets capture a modest segment, valued at 0.03 USD Billion in 2023 and expected to grow to 0.08 USD Billion by 2032, providing a straightforward and traditional format for dietary supplements.

    Each form brings unique benefits, contributing to a diversified Garcinia Market. Lubricating factors, such as the increasing health consciousness among consumers and the rising inclination towards natural and organic products, drive growth within each of these segments. However, challenges remain, including the need for regulatory compliance and competition from other natural supplements. Overall, as the market continues to expand, the different forms of Garcinia products are likely to meet varying consumer preferences while embracing emerging trends in natural health improvement, thus allowing the industry to maintain a robust growth trajectory.

    Garcinia Application Insights   

    The Garcinia Market is experiencing significant growth, with a projected value of 0.26 USD Billion in 2023, and continues to exhibit robust market growth through 2032. The market segmentation of the Garcinia Market includes diverse applications such as Dietary Supplements, Food and Beverages, Cosmetics, and Pharmaceuticals. The Dietary Supplements segment plays a major role, driven by increasing health consciousness among consumers seeking natural weight management solutions. Food and Beverages have become a prominent application area due to the rising demand for functional foods, which incorporate Garcinia extract for its health benefits.

    Meanwhile, the Cosmetics segment is gaining traction as consumers recognize Garcinia's potential for skin health, leveraging its antioxidant properties. Pharmaceuticals are also gaining importance, with innovative formulations emerging in various therapeutic applications. The growth of these applications is underpinned by shifting consumer preferences towards natural and organic products, alongside an expanding awareness of the health benefits associated with Garcinia. As a result, the Garcinia Market data highlights a compelling opportunity for ongoing innovation and expansion across these application areas, leading to noteworthy trends in the Garcinia Market statistics and industry growth dynamics.

    Garcinia Distribution Channel Insights   

    The Garcinia Market is gaining momentum through various distribution channels, which significantly contribute to its overall revenue and market growth. In 2023, the market is valued at 0.26 billion USD and is experiencing robust expansion, projected to reach 1.0 billion USD by 2032. Among the various distribution channels, online retail has emerged as a preferred choice for consumers, driven by the convenience of shopping and a wide selection of products. Supermarkets also play a crucial role in providing access to Garcinia products, attracting a significant consumer base.

    Health stores and pharmacies contribute to the market as well, providing specialized knowledge and products tailored for health-conscious individuals. The presence of these distribution channels is vital, as they enhance product visibility and accessibility, thereby promoting the consumption of Garcinia supplements. Market statistics show that the effective distribution of Garcinia products through these channels ensures a steady revenue stream, while industry trends indicate a growing awareness of health benefits associated with Garcinia, further boosting market opportunities.

    As online shopping continues to grow, coupled with the reliance on physical retail spaces like supermarkets and health stores, the distribution channel segment remains a key driver in the overall dynamics of the Garcinia Market.

    Garcinia End Use Insights   

    The Garcinia Market revenue is experiencing growth driven by diverse End Use applications. By 2023, the market reached a valuation of 0.26 USD Billion, with a clear trajectory towards increased adoption across various consumer segments. Among these, the Adult demographic plays a prominent role, leveraging Garcinia for weight management and health benefits, significantly influencing the market landscape. The Elderly segment also shows notable engagement, utilizing Garcinia for its potential health-promoting properties, which is essential for enhancing well-being in older adults.

    Athletes represent another vital group, as they increasingly incorporate Garcinia for its reputed energy-boosting and performance-enhancing attributes. The collective demand from these segments contributes to a robust Garcinia Market industry, underlining the importance of effective market growth strategies tailored for each group. Market trends reflect a growing awareness of Garcinia's health benefits, supported by an expanding range of products catering to these End Use categories. However, challenges such as regulatory scrutiny and competition from alternative supplements remain pertinent, presenting opportunities for innovation and targeted marketing within the Garcinia Market segmentation.

    As the market statistics progress towards 2032, the significance of these segments in shaping the overall market dynamics will undoubtedly continue to evolve.

    Get more detailed insights about Garcinia Market Research Report — Global Forecast till 2032

    Regional Insights

    The Garcinia Market showcases a diverse regional landscape, with significant variations in market valuation. In 2023, North America holds a dominating position, valued at 0.1 USD Billion, and is projected to reach 0.38 USD Billion by 2032, showcasing a majority holding in the market due to the rising demand for weight management products. Europe, valued at 0.06 USD Billion in 2023, is expected to achieve 0.23 USD Billion in 2032, reflecting a significant interest in herbal supplements.

    The APAC region, gaining traction with a valuation of 0.07 USD Billion in 2023, is projected to grow to 0.3 USD Billion, highlighting its increased penetration in health-conscious consumer segments.

    Meanwhile, South America and MEA represent smaller market shares, valued at 0.02 USD Billion and 0.01 USD Billion, respectively in 2023 and anticipated to reach 0.13 USD Billion and 0.06 USD Billion by 2032. The growth across regions is driven by the increasing health awareness and consumer inclination towards natural products, presenting opportunities amidst challenges like regulatory compliances and market education. Each region contributes uniquely to the overall dynamics of the Garcinia Market revenue.

    Key Players and Competitive Insights

    The Garcinia Market has gained considerable traction in recent years, fueled by increasing health consciousness and a growing preference for natural dietary supplements. As consumers become more aware of weight management solutions, garcinia products are positioned as effective tools due to their natural composition, with a particular emphasis on hydroxycitric acid (HCA). This market is characterized by a diverse range of products, from weight loss supplements to functional foods, creating a competitive landscape where innovation and product quality play crucial roles.

    The market is influenced by various factors, including the rise of e-commerce, collaborations, and partnerships that enhance product availability, making it essential for companies to adopt strategic approaches to carve a niche in this evolving sector.

    Zazzee has established a solid presence in the Garcinia Market, primarily known for its commitment to high-quality, pure products. The company emphasizes rigorous testing and adherence to manufacturing standards, ensuring that its garcinia supplements are effective and safe for consumer use. Zazzee capitalizes on its extensive research and development capabilities to create products that cater to diverse consumer needs, emphasizing the natural origin of its ingredients. Furthermore, Zazzee's robust online presence and positive customer feedback contribute to its strong brand reputation and customer loyalty, which serve as significant strengths in an increasingly competitive market landscape.

    The company’s continued focus on quality and customer satisfaction positions it advantageously against competitors, making it a noteworthy player in the Garcinia Market.

    Garcinia Cambogia Select also commands attention in the Garcinia Market with its unique product offerings and strategic marketing initiatives. The company has effectively leveraged the popularity of garcinia cambogia as a prominent weight loss supplement. It distinguishes itself by focusing on delivering high-potency formulations that promise maximized results for consumers, thus enhancing its market appeal. Additionally, Garcinia Cambogia Select employs targeted promotions and educational campaigns that inform potential customers about the benefits of its products, fostering trust and engagement.

    Through its user-friendly online sales platform, the company provides easy access to a variety of formulations and pack sizes tailored to meet different consumer preferences. This adaptability, combined with a clear focus on efficacy and customer satisfaction, positions Garcinia Cambogia Select as a competitive force within the Garcinia Market, ready to meet the evolving needs of health-conscious consumers.

    Key Companies in the Garcinia Market market include

    Industry Developments

    Recent developments in the Garcinia Market have seen companies such as Zazzee, Garcinia Cambogia Select, Herbalife, and NatureWise increasing their product offerings to meet rising consumer demand for weight management and dietary supplements. The market has experienced significant growth, attributed to the increasing awareness of health and wellness, with consumers gravitating towards natural products, including garcinia cambogia extracts. Current affairs indicate that Goli Nutrition and NOW Foods are intensifying their marketing strategies to attract a broader audience, while BulkSupplements and Divine Bounty are focusing on enhancing their supply chains to improve distribution efficiency.

    Key players are also exploring collaborations to expand their market reach, although concrete reports of mergers or acquisitions among these companies remain limited. A noteworthy trend is the rising market valuation of Herbalife and Garden of Life, which further impacts market dynamics as their investments in research and development for innovative garcinia-based products strengthen their competitive position. Overall, the combined moves within these firms highlight a vibrant and competitive landscape within the Garcinia Market, reflecting a strong response to evolving consumer preferences and market opportunities.

    Future Outlook

    Garcinia Market Future Outlook

    The Global Garcinia Market is projected to grow at a 16.08% CAGR from 2024 to 2035, driven by rising health consciousness, demand for natural supplements, and expanding applications in food and cosmetics.

    New opportunities lie in:

    • Develop innovative Garcinia-based dietary supplements targeting weight management and metabolic health.
    • Explore partnerships with cosmetic brands to incorporate Garcinia extracts in skincare products.
    • Invest in sustainable sourcing and production methods to enhance brand reputation and consumer trust.

    By 2035, the Garcinia Market is expected to achieve substantial growth, solidifying its position as a key player in health and wellness sectors.

    Market Segmentation

    Garcinia Form Outlook

    • Dietary Supplements
    • Food and Beverages
    • Cosmetics
    • Pharmaceuticals

    Garcinia End Use Outlook

    • North America
    • Europe
    • South America
    • Asia Pacific
    • Middle East and Africa

    Garcinia Regional Outlook

    • North America
    • Europe
    • South America
    • Asia Pacific
    • Middle East and Africa

    Garcinia Application Outlook

    • Online Retail
    • Supermarkets
    • Health Stores
    • Pharmacies

    Garcinia Distribution Channel Outlook

    • Adults
    • Elderly
    • Athletes

    Report Scope

    Attribute/Metric Details
    Market Size 2022 0.22(USD Billion)
    Market Size 2023 0.26(USD Billion)
    Market Size 2032 1.0(USD Billion)
    Compound Annual Growth Rate (CAGR) 16.33% (2024 - 2032)
    Report Coverage Revenue Forecast, Competitive Landscape, Growth Factors, and Trends
    Base Year 2023
    Market Forecast Period 2024 - 2032
    Historical Data 2019 - 2023
    Market Forecast Units USD Billion
    Key Companies Profiled Zazzee, Garcinia Cambogia Select, Herbalife, NatureWise, Garden of Life, Goli Nutrition, BioSense, NOW Foods, NutraBlast, Keto Diet, BulkSupplements, Divine Bounty
    Segments Covered Form, Application, Distribution Channel, End Use, Regional
    Key Market Opportunities Rising demand for weight loss, Increasing health consciousness globally, Growth in the dietary supplements sector, Expanding e-commerce channels, Potential in functional foods market
    Key Market Dynamics growing health consciousness, increasing demand for weight loss, rise in dietary supplements, fluctuations in raw material prices, regulatory challenges and compliance
    Countries Covered North America, Europe, APAC, South America, MEA

    Market Highlights

    Author

    Tejas Chaudhary
    Research Analyst Level II

    She holds an experience of about 6+ years in market research and business consulting, working under the spectrum of information communication technology, telecommunications and semiconductor domains. aarti conceptualizes and implements a scalable business strategy and provides strategic leadership to the clients. her expertise lies in market estimation, competitive intelligence, pipeline analysis, customer assessment, etc.

    Leave a Comment

    Latest Comments

    John Doe
    john@example.com

    This is a great article! Really helped me understand the topic better.

    Posted on July 23, 2025, 10:15 AM
    Jane Smith
    jane@domain.com

    Thanks for sharing this. I’ve bookmarked it for later reference.

    Posted on July 22, 2025, 7:45 PM

    FAQs

    What is the expected market size of the Garcinia Market in 2032?

    The Garcinia Market is expected to be valued at 1.0 USD Billion in 2032.

    What is the projected CAGR for the Garcinia Market from 2024 to 2032?

    The Garcinia Market is projected to have a CAGR of 16.33% from 2024 to 2032.

    Which region is expected to dominate the Garcinia Market by 2032?

    North America is expected to dominate the Garcinia Market, valued at 0.38 USD Billion in 2032.

    What is the market size of the Powder segment in the Garcinia Market for 2032?

    The Powder segment is expected to reach a market size of 0.36 USD Billion in 2032.

    Who are the major key players in the Garcinia Market?

    Some key players in the market include Zazzee, Garcinia Cambogia Select, Herbalife, and NatureWise.

    What is the expected market size for Capsules in the Garcinia Market by 2032?

    The Capsules segment is projected to be valued at 0.28 USD Billion in 2032.

    How much is the Liquid segment of the Garcinia Market expected to be worth in 2032?

    The Liquid segment is expected to be worth 0.16 USD Billion in 2032.

    What challenges does the Garcinia Market face in terms of growth?

    Challenges include regulatory issues and varying consumer perceptions regarding herbal supplements.

    What is the expected market value for the Extract segment by 2032?

    The Extract segment is expected to reach a market value of 0.12 USD Billion in 2032.

    What is the projected market size for the South American region in the Garcinia Market by 2032?

    The South American region is expected to reach a market size of 0.13 USD Billion by 2032.

    1. List of Tables and Figures
      1. Table of Contents 1. Executive Summary 1.1. Market Overview 1.2. Key Findings 1.3. Market Segmentation 1.4. Competitive Landscape 1.5. Challenges and Opportunities 1.6. Future Outlook 2. Market Introduction 2.1. Definition 2.2. Scope of the Study 2.2.1. Research Objective 2.2.2. Assumption 2.2.3. Limitations 3. Research Methodology 3.1. Overview 3.2. Data Mining 3.3. Secondary Research 3.4. Primary Research 3.4.1. Primary Interviews and Information Gathering Process 3.4.2. Breakdown of Primary Respondents 3.5. Forecasting Model 3.6. Market Size Estimation 3.6.1. Bottom-up Approach 3.6.2. Top-Down Approach 3.7. Data Triangulation 3.8. Validation 4. MARKET DYNAMICS 4.1. Overview 4.2. Drivers 4.3. Restraints 4.4. Opportunities 5. MARKET FACTOR ANALYSIS 5.1. Value chain Analysis 5.2. Porter's Five Forces Analysis 5.2.1. Bargaining Power of Suppliers 5.2.2. Bargaining Power of Buyers 5.2.3. Threat of New Entrants 5.2.4. Threat of Substitutes 5.2.5. Intensity of Rivalry 5.3. COVID-19 Impact Analysis 5.3.1. Market Impact Analysis 5.3.2. Regional Impact 5.3.3. Opportunity and Threat Analysis 6. GARCINIA MARKET, BY FORM (USD BILLION) 6.1. Powder 6.2. Capsule 6.3. Liquid 6.4. Extract 6.5. Tablet 7. GARCINIA MARKET, BY APPLICATION (USD BILLION) 7.1. Dietary Supplements 7.2. Food and Beverages 7.3. Cosmetics 7.4. Pharmaceuticals 8. GARCINIA MARKET, BY DISTRIBUTION CHANNEL (USD BILLION) 8.1. Online Retail 8.2. Supermarkets 8.3. Health Stores 8.4. Pharmacies 9. GARCINIA MARKET, BY END USE (USD BILLION) 9.1. Adults 9.2. Elderly 9.3. Athletes 10. GARCINIA MARKET, BY REGIONAL (USD BILLION) 10.1. North America 10.1.1. US 10.1.2. Canada 10.2. Europe 10.2.1. Germany 10.2.2. UK 10.2.3. France 10.2.4. Russia 10.2.5. Italy 10.2.6. Spain 10.2.7. Rest of Europe 10.3. APAC 10.3.1. China 10.3.2. India 10.3.3. Japan 10.3.4. South Korea 10.3.5. Malaysia 10.3.6. Thailand 10.3.7. Indonesia 10.3.8. Rest of APAC 10.4. South America 10.4.1. Brazil 10.4.2. Mexico 10.4.3. Argentina 10.4.4. Rest of South America 10.5. MEA 10.5.1. GCC Countries 10.5.2. South Africa 10.5.3. Rest of MEA 11. Competitive Landscape 11.1. Overview 11.2. Competitive Analysis 11.3. Market share Analysis 11.4. Major Growth Strategy in the Garcinia Market 11.5. Competitive Benchmarking 11.6. Leading Players in Terms of Number of Developments in the Garcinia Market 11.7. Key developments and growth strategies 11.7.1. New Product Launch/Service Deployment 11.7.2. Merger & Acquisitions 11.7.3. Joint Ventures 11.8. Major Players Financial Matrix 11.8.1. Sales and Operating Income 11.8.2. Major Players R&D Expenditure. 2023 12. COMPANY PROFILES 12.1. Zazzee 12.1.1. Financial Overview 12.1.2. Products Offered 12.1.3. Key Developments 12.1.4. SWOT Analysis 12.1.5. Key Strategies 12.2. Garcinia Cambogia Select 12.2.1. Financial Overview 12.2.2. Products Offered 12.2.3. Key Developments 12.2.4. SWOT Analysis 12.2.5. Key Strategies 12.3. Herbalife 12.3.1. Financial Overview 12.3.2. Products Offered 12.3.3. Key Developments 12.3.4. SWOT Analysis 12.3.5. Key Strategies 12.4. NatureWise 12.4.1. Financial Overview 12.4.2. Products Offered 12.4.3. Key Developments 12.4.4. SWOT Analysis 12.4.5. Key Strategies 12.5. Garden of Life 12.5.1. Financial Overview 12.5.2. Products Offered 12.5.3. Key Developments 12.5.4. SWOT Analysis 12.5.5. Key Strategies 12.6. Goli Nutrition 12.6.1. Financial Overview 12.6.2. Products Offered 12.6.3. Key Developments 12.6.4. SWOT Analysis 12.6.5. Key Strategies 12.7. BioSense 12.7.1. Financial Overview 12.7.2. Products Offered 12.7.3. Key Developments 12.7.4. SWOT Analysis 12.7.5. Key Strategies 12.8. NOW Foods 12.8.1. Financial Overview 12.8.2. Products Offered 12.8.3. Key Developments 12.8.4. SWOT Analysis 12.8.5. Key Strategies 12.9. NutraBlast 12.9.1. Financial Overview 12.9.2. Products Offered 12.9.3. Key Developments 12.9.4. SWOT Analysis 12.9.5. Key Strategies 12.10. Keto Diet 12.10.1. Financial Overview 12.10.2. Products Offered 12.10.3. Key Developments 12.10.4. SWOT Analysis 12.10.5. Key Strategies 12.11. BulkSupplements 12.11.1. Financial Overview 12.11.2. Products Offered 12.11.3. Key Developments 12.11.4. SWOT Analysis 12.11.5. Key Strategies 12.12. Divine Bounty 12.12.1. Financial Overview 12.12.2. Products Offered 12.12.3. Key Developments 12.12.4. SWOT Analysis 12.12.5. Key Strategies 13. APPENDIX 13.1. References 13.2. Related Reports LIST OF TABLES
      2. TABLE 1. LIST OF ASSUMPTIONS
      3. TABLE 2. NORTH AMERICA GARCINIA MARKET SIZE ESTIMATES & FORECAST, BY FORM, 2019-2032 (USD BILLIONS)
      4. TABLE 3. NORTH AMERICA GARCINIA MARKET SIZE ESTIMATES & FORECAST, BY APPLICATION, 2019-2032 (USD BILLIONS)
      5. TABLE 4. NORTH AMERICA GARCINIA MARKET SIZE ESTIMATES & FORECAST, BY DISTRIBUTION CHANNEL, 2019-2032 (USD BILLIONS)
      6. TABLE 5. NORTH AMERICA GARCINIA MARKET SIZE ESTIMATES & FORECAST, BY END USE, 2019-2032 (USD BILLIONS)
      7. TABLE 6. NORTH AMERICA GARCINIA MARKET SIZE ESTIMATES & FORECAST, BY REGIONAL, 2019-2032 (USD BILLIONS)
      8. TABLE 7. US GARCINIA MARKET SIZE ESTIMATES & FORECAST, BY FORM, 2019-2032 (USD BILLIONS)
      9. TABLE 8. US GARCINIA MARKET SIZE ESTIMATES & FORECAST, BY APPLICATION, 2019-2032 (USD BILLIONS)
      10. TABLE 9. US GARCINIA MARKET SIZE ESTIMATES & FORECAST, BY DISTRIBUTION CHANNEL, 2019-2032 (USD BILLIONS)
      11. TABLE 10. US GARCINIA MARKET SIZE ESTIMATES & FORECAST, BY END USE, 2019-2032 (USD BILLIONS)
      12. TABLE 11. US GARCINIA MARKET SIZE ESTIMATES & FORECAST, BY REGIONAL, 2019-2032 (USD BILLIONS)
      13. TABLE 12. CANADA GARCINIA MARKET SIZE ESTIMATES & FORECAST, BY FORM, 2019-2032 (USD BILLIONS)
      14. TABLE 13. CANADA GARCINIA MARKET SIZE ESTIMATES & FORECAST, BY APPLICATION, 2019-2032 (USD BILLIONS)
      15. TABLE 14. CANADA GARCINIA MARKET SIZE ESTIMATES & FORECAST, BY DISTRIBUTION CHANNEL, 2019-2032 (USD BILLIONS)
      16. TABLE 15. CANADA GARCINIA MARKET SIZE ESTIMATES & FORECAST, BY END USE, 2019-2032 (USD BILLIONS)
      17. TABLE 16. CANADA GARCINIA MARKET SIZE ESTIMATES & FORECAST, BY REGIONAL, 2019-2032 (USD BILLIONS)
      18. TABLE 17. EUROPE GARCINIA MARKET SIZE ESTIMATES & FORECAST, BY FORM, 2019-2032 (USD BILLIONS)
      19. TABLE 18. EUROPE GARCINIA MARKET SIZE ESTIMATES & FORECAST, BY APPLICATION, 2019-2032 (USD BILLIONS)
      20. TABLE 19. EUROPE GARCINIA MARKET SIZE ESTIMATES & FORECAST, BY DISTRIBUTION CHANNEL, 2019-2032 (USD BILLIONS)
      21. TABLE 20. EUROPE GARCINIA MARKET SIZE ESTIMATES & FORECAST, BY END USE, 2019-2032 (USD BILLIONS)
      22. TABLE 21. EUROPE GARCINIA MARKET SIZE ESTIMATES & FORECAST, BY REGIONAL, 2019-2032 (USD BILLIONS)
      23. TABLE 22. GERMANY GARCINIA MARKET SIZE ESTIMATES & FORECAST, BY FORM, 2019-2032 (USD BILLIONS)
      24. TABLE 23. GERMANY GARCINIA MARKET SIZE ESTIMATES & FORECAST, BY APPLICATION, 2019-2032 (USD BILLIONS)
      25. TABLE 24. GERMANY GARCINIA MARKET SIZE ESTIMATES & FORECAST, BY DISTRIBUTION CHANNEL, 2019-2032 (USD BILLIONS)
      26. TABLE 25. GERMANY GARCINIA MARKET SIZE ESTIMATES & FORECAST, BY END USE, 2019-2032 (USD BILLIONS)
      27. TABLE 26. GERMANY GARCINIA MARKET SIZE ESTIMATES & FORECAST, BY REGIONAL, 2019-2032 (USD BILLIONS)
      28. TABLE 27. UK GARCINIA MARKET SIZE ESTIMATES & FORECAST, BY FORM, 2019-2032 (USD BILLIONS)
      29. TABLE 28. UK GARCINIA MARKET SIZE ESTIMATES & FORECAST, BY APPLICATION, 2019-2032 (USD BILLIONS)
      30. TABLE 29. UK GARCINIA MARKET SIZE ESTIMATES & FORECAST, BY DISTRIBUTION CHANNEL, 2019-2032 (USD BILLIONS)
      31. TABLE 30. UK GARCINIA MARKET SIZE ESTIMATES & FORECAST, BY END USE, 2019-2032 (USD BILLIONS)
      32. TABLE 31. UK GARCINIA MARKET SIZE ESTIMATES & FORECAST, BY REGIONAL, 2019-2032 (USD BILLIONS)
      33. TABLE 32. FRANCE GARCINIA MARKET SIZE ESTIMATES & FORECAST, BY FORM, 2019-2032 (USD BILLIONS)
      34. TABLE 33. FRANCE GARCINIA MARKET SIZE ESTIMATES & FORECAST, BY APPLICATION, 2019-2032 (USD BILLIONS)
      35. TABLE 34. FRANCE GARCINIA MARKET SIZE ESTIMATES & FORECAST, BY DISTRIBUTION CHANNEL, 2019-2032 (USD BILLIONS)
      36. TABLE 35. FRANCE GARCINIA MARKET SIZE ESTIMATES & FORECAST, BY END USE, 2019-2032 (USD BILLIONS)
      37. TABLE 36. FRANCE GARCINIA MARKET SIZE ESTIMATES & FORECAST, BY REGIONAL, 2019-2032 (USD BILLIONS)
      38. TABLE 37. RUSSIA GARCINIA MARKET SIZE ESTIMATES & FORECAST, BY FORM, 2019-2032 (USD BILLIONS)
      39. TABLE 38. RUSSIA GARCINIA MARKET SIZE ESTIMATES & FORECAST, BY APPLICATION, 2019-2032 (USD BILLIONS)
      40. TABLE 39. RUSSIA GARCINIA MARKET SIZE ESTIMATES & FORECAST, BY DISTRIBUTION CHANNEL, 2019-2032 (USD BILLIONS)
      41. TABLE 40. RUSSIA GARCINIA MARKET SIZE ESTIMATES & FORECAST, BY END USE, 2019-2032 (USD BILLIONS)
      42. TABLE 41. RUSSIA GARCINIA MARKET SIZE ESTIMATES & FORECAST, BY REGIONAL, 2019-2032 (USD BILLIONS)
      43. TABLE 42. ITALY GARCINIA MARKET SIZE ESTIMATES & FORECAST, BY FORM, 2019-2032 (USD BILLIONS)
      44. TABLE 43. ITALY GARCINIA MARKET SIZE ESTIMATES & FORECAST, BY APPLICATION, 2019-2032 (USD BILLIONS)
      45. TABLE 44. ITALY GARCINIA MARKET SIZE ESTIMATES & FORECAST, BY DISTRIBUTION CHANNEL, 2019-2032 (USD BILLIONS)
      46. TABLE 45. ITALY GARCINIA MARKET SIZE ESTIMATES & FORECAST, BY END USE, 2019-2032 (USD BILLIONS)
      47. TABLE 46. ITALY GARCINIA MARKET SIZE ESTIMATES & FORECAST, BY REGIONAL, 2019-2032 (USD BILLIONS)
      48. TABLE 47. SPAIN GARCINIA MARKET SIZE ESTIMATES & FORECAST, BY FORM, 2019-2032 (USD BILLIONS)
      49. TABLE 48. SPAIN GARCINIA MARKET SIZE ESTIMATES & FORECAST, BY APPLICATION, 2019-2032 (USD BILLIONS)
      50. TABLE 49. SPAIN GARCINIA MARKET SIZE ESTIMATES & FORECAST, BY DISTRIBUTION CHANNEL, 2019-2032 (USD BILLIONS)
      51. TABLE 50. SPAIN GARCINIA MARKET SIZE ESTIMATES & FORECAST, BY END USE, 2019-2032 (USD BILLIONS)
      52. TABLE 51. SPAIN GARCINIA MARKET SIZE ESTIMATES & FORECAST, BY REGIONAL, 2019-2032 (USD BILLIONS)
      53. TABLE 52. REST OF EUROPE GARCINIA MARKET SIZE ESTIMATES & FORECAST, BY FORM, 2019-2032 (USD BILLIONS)
      54. TABLE 53. REST OF EUROPE GARCINIA MARKET SIZE ESTIMATES & FORECAST, BY APPLICATION, 2019-2032 (USD BILLIONS)
      55. TABLE 54. REST OF EUROPE GARCINIA MARKET SIZE ESTIMATES & FORECAST, BY DISTRIBUTION CHANNEL, 2019-2032 (USD BILLIONS)
      56. TABLE 55. REST OF EUROPE GARCINIA MARKET SIZE ESTIMATES & FORECAST, BY END USE, 2019-2032 (USD BILLIONS)
      57. TABLE 56. REST OF EUROPE GARCINIA MARKET SIZE ESTIMATES & FORECAST, BY REGIONAL, 2019-2032 (USD BILLIONS)
      58. TABLE 57. APAC GARCINIA MARKET SIZE ESTIMATES & FORECAST, BY FORM, 2019-2032 (USD BILLIONS)
      59. TABLE 58. APAC GARCINIA MARKET SIZE ESTIMATES & FORECAST, BY APPLICATION, 2019-2032 (USD BILLIONS)
      60. TABLE 59. APAC GARCINIA MARKET SIZE ESTIMATES & FORECAST, BY DISTRIBUTION CHANNEL, 2019-2032 (USD BILLIONS)
      61. TABLE 60. APAC GARCINIA MARKET SIZE ESTIMATES & FORECAST, BY END USE, 2019-2032 (USD BILLIONS)
      62. TABLE 61. APAC GARCINIA MARKET SIZE ESTIMATES & FORECAST, BY REGIONAL, 2019-2032 (USD BILLIONS)
      63. TABLE 62. CHINA GARCINIA MARKET SIZE ESTIMATES & FORECAST, BY FORM, 2019-2032 (USD BILLIONS)
      64. TABLE 63. CHINA GARCINIA MARKET SIZE ESTIMATES & FORECAST, BY APPLICATION, 2019-2032 (USD BILLIONS)
      65. TABLE 64. CHINA GARCINIA MARKET SIZE ESTIMATES & FORECAST, BY DISTRIBUTION CHANNEL, 2019-2032 (USD BILLIONS)
      66. TABLE 65. CHINA GARCINIA MARKET SIZE ESTIMATES & FORECAST, BY END USE, 2019-2032 (USD BILLIONS)
      67. TABLE 66. CHINA GARCINIA MARKET SIZE ESTIMATES & FORECAST, BY REGIONAL, 2019-2032 (USD BILLIONS)
      68. TABLE 67. INDIA GARCINIA MARKET SIZE ESTIMATES & FORECAST, BY FORM, 2019-2032 (USD BILLIONS)
      69. TABLE 68. INDIA GARCINIA MARKET SIZE ESTIMATES & FORECAST, BY APPLICATION, 2019-2032 (USD BILLIONS)
      70. TABLE 69. INDIA GARCINIA MARKET SIZE ESTIMATES & FORECAST, BY DISTRIBUTION CHANNEL, 2019-2032 (USD BILLIONS)
      71. TABLE 70. INDIA GARCINIA MARKET SIZE ESTIMATES & FORECAST, BY END USE, 2019-2032 (USD BILLIONS)
      72. TABLE 71. INDIA GARCINIA MARKET SIZE ESTIMATES & FORECAST, BY REGIONAL, 2019-2032 (USD BILLIONS)
      73. TABLE 72. JAPAN GARCINIA MARKET SIZE ESTIMATES & FORECAST, BY FORM, 2019-2032 (USD BILLIONS)
      74. TABLE 73. JAPAN GARCINIA MARKET SIZE ESTIMATES & FORECAST, BY APPLICATION, 2019-2032 (USD BILLIONS)
      75. TABLE 74. JAPAN GARCINIA MARKET SIZE ESTIMATES & FORECAST, BY DISTRIBUTION CHANNEL, 2019-2032 (USD BILLIONS)
      76. TABLE 75. JAPAN GARCINIA MARKET SIZE ESTIMATES & FORECAST, BY END USE, 2019-2032 (USD BILLIONS)
      77. TABLE 76. JAPAN GARCINIA MARKET SIZE ESTIMATES & FORECAST, BY REGIONAL, 2019-2032 (USD BILLIONS)
      78. TABLE 77. SOUTH KOREA GARCINIA MARKET SIZE ESTIMATES & FORECAST, BY FORM, 2019-2032 (USD BILLIONS)
      79. TABLE 78. SOUTH KOREA GARCINIA MARKET SIZE ESTIMATES & FORECAST, BY APPLICATION, 2019-2032 (USD BILLIONS)
      80. TABLE 79. SOUTH KOREA GARCINIA MARKET SIZE ESTIMATES & FORECAST, BY DISTRIBUTION CHANNEL, 2019-2032 (USD BILLIONS)
      81. TABLE 80. SOUTH KOREA GARCINIA MARKET SIZE ESTIMATES & FORECAST, BY END USE, 2019-2032 (USD BILLIONS)
      82. TABLE 81. SOUTH KOREA GARCINIA MARKET SIZE ESTIMATES & FORECAST, BY REGIONAL, 2019-2032 (USD BILLIONS)
      83. TABLE 82. MALAYSIA GARCINIA MARKET SIZE ESTIMATES & FORECAST, BY FORM, 2019-2032 (USD BILLIONS)
      84. TABLE 83. MALAYSIA GARCINIA MARKET SIZE ESTIMATES & FORECAST, BY APPLICATION, 2019-2032 (USD BILLIONS)
      85. TABLE 84. MALAYSIA GARCINIA MARKET SIZE ESTIMATES & FORECAST, BY DISTRIBUTION CHANNEL, 2019-2032 (USD BILLIONS)
      86. TABLE 85. MALAYSIA GARCINIA MARKET SIZE ESTIMATES & FORECAST, BY END USE, 2019-2032 (USD BILLIONS)
      87. TABLE 86. MALAYSIA GARCINIA MARKET SIZE ESTIMATES & FORECAST, BY REGIONAL, 2019-2032 (USD BILLIONS)
      88. TABLE 87. THAILAND GARCINIA MARKET SIZE ESTIMATES & FORECAST, BY FORM, 2019-2032 (USD BILLIONS)
      89. TABLE 88. THAILAND GARCINIA MARKET SIZE ESTIMATES & FORECAST, BY APPLICATION, 2019-2032 (USD BILLIONS)
      90. TABLE 89. THAILAND GARCINIA MARKET SIZE ESTIMATES & FORECAST, BY DISTRIBUTION CHANNEL, 2019-2032 (USD BILLIONS)
      91. TABLE 90. THAILAND GARCINIA MARKET SIZE ESTIMATES & FORECAST, BY END USE, 2019-2032 (USD BILLIONS)
      92. TABLE 91. THAILAND GARCINIA MARKET SIZE ESTIMATES & FORECAST, BY REGIONAL, 2019-2032 (USD BILLIONS)
      93. TABLE 92. INDONESIA GARCINIA MARKET SIZE ESTIMATES & FORECAST, BY FORM, 2019-2032 (USD BILLIONS)
      94. TABLE 93. INDONESIA GARCINIA MARKET SIZE ESTIMATES & FORECAST, BY APPLICATION, 2019-2032 (USD BILLIONS)
      95. TABLE 94. INDONESIA GARCINIA MARKET SIZE ESTIMATES & FORECAST, BY DISTRIBUTION CHANNEL, 2019-2032 (USD BILLIONS)
      96. TABLE 95. INDONESIA GARCINIA MARKET SIZE ESTIMATES & FORECAST, BY END USE, 2019-2032 (USD BILLIONS)
      97. TABLE 96. INDONESIA GARCINIA MARKET SIZE ESTIMATES & FORECAST, BY REGIONAL, 2019-2032 (USD BILLIONS)
      98. TABLE 97. REST OF APAC GARCINIA MARKET SIZE ESTIMATES & FORECAST, BY FORM, 2019-2032 (USD BILLIONS)
      99. TABLE 98. REST OF APAC GARCINIA MARKET SIZE ESTIMATES & FORECAST, BY APPLICATION, 2019-2032 (USD BILLIONS)
      100. TABLE 99. REST OF APAC GARCINIA MARKET SIZE ESTIMATES & FORECAST, BY DISTRIBUTION CHANNEL, 2019-2032 (USD BILLIONS)
      101. TABLE 100. REST OF APAC GARCINIA MARKET SIZE ESTIMATES & FORECAST, BY END USE, 2019-2032 (USD BILLIONS)
      102. TABLE 101. REST OF APAC GARCINIA MARKET SIZE ESTIMATES & FORECAST, BY REGIONAL, 2019-2032 (USD BILLIONS)
      103. TABLE 102. SOUTH AMERICA GARCINIA MARKET SIZE ESTIMATES & FORECAST, BY FORM, 2019-2032 (USD BILLIONS)
      104. TABLE 103. SOUTH AMERICA GARCINIA MARKET SIZE ESTIMATES & FORECAST, BY APPLICATION, 2019-2032 (USD BILLIONS)
      105. TABLE 104. SOUTH AMERICA GARCINIA MARKET SIZE ESTIMATES & FORECAST, BY DISTRIBUTION CHANNEL, 2019-2032 (USD BILLIONS)
      106. TABLE 105. SOUTH AMERICA GARCINIA MARKET SIZE ESTIMATES & FORECAST, BY END USE, 2019-2032 (USD BILLIONS)
      107. TABLE 106. SOUTH AMERICA GARCINIA MARKET SIZE ESTIMATES & FORECAST, BY REGIONAL, 2019-2032 (USD BILLIONS)
      108. TABLE 107. BRAZIL GARCINIA MARKET SIZE ESTIMATES & FORECAST, BY FORM, 2019-2032 (USD BILLIONS)
      109. TABLE 108. BRAZIL GARCINIA MARKET SIZE ESTIMATES & FORECAST, BY APPLICATION, 2019-2032 (USD BILLIONS)
      110. TABLE 109. BRAZIL GARCINIA MARKET SIZE ESTIMATES & FORECAST, BY DISTRIBUTION CHANNEL, 2019-2032 (USD BILLIONS)
      111. TABLE 110. BRAZIL GARCINIA MARKET SIZE ESTIMATES & FORECAST, BY END USE, 2019-2032 (USD BILLIONS)
      112. TABLE 111. BRAZIL GARCINIA MARKET SIZE ESTIMATES & FORECAST, BY REGIONAL, 2019-2032 (USD BILLIONS)
      113. TABLE 112. MEXICO GARCINIA MARKET SIZE ESTIMATES & FORECAST, BY FORM, 2019-2032 (USD BILLIONS)
      114. TABLE 113. MEXICO GARCINIA MARKET SIZE ESTIMATES & FORECAST, BY APPLICATION, 2019-2032 (USD BILLIONS)
      115. TABLE 114. MEXICO GARCINIA MARKET SIZE ESTIMATES & FORECAST, BY DISTRIBUTION CHANNEL, 2019-2032 (USD BILLIONS)
      116. TABLE 115. MEXICO GARCINIA MARKET SIZE ESTIMATES & FORECAST, BY END USE, 2019-2032 (USD BILLIONS)
      117. TABLE 116. MEXICO GARCINIA MARKET SIZE ESTIMATES & FORECAST, BY REGIONAL, 2019-2032 (USD BILLIONS)
      118. TABLE 117. ARGENTINA GARCINIA MARKET SIZE ESTIMATES & FORECAST, BY FORM, 2019-2032 (USD BILLIONS)
      119. TABLE 118. ARGENTINA GARCINIA MARKET SIZE ESTIMATES & FORECAST, BY APPLICATION, 2019-2032 (USD BILLIONS)
      120. TABLE 119. ARGENTINA GARCINIA MARKET SIZE ESTIMATES & FORECAST, BY DISTRIBUTION CHANNEL, 2019-2032 (USD BILLIONS)
      121. TABLE 120. ARGENTINA GARCINIA MARKET SIZE ESTIMATES & FORECAST, BY END USE, 2019-2032 (USD BILLIONS)
      122. TABLE 121. ARGENTINA GARCINIA MARKET SIZE ESTIMATES & FORECAST, BY REGIONAL, 2019-2032 (USD BILLIONS)
      123. TABLE 122. REST OF SOUTH AMERICA GARCINIA MARKET SIZE ESTIMATES & FORECAST, BY FORM, 2019-2032 (USD BILLIONS)
      124. TABLE 123. REST OF SOUTH AMERICA GARCINIA MARKET SIZE ESTIMATES & FORECAST, BY APPLICATION, 2019-2032 (USD BILLIONS)
      125. TABLE 124. REST OF SOUTH AMERICA GARCINIA MARKET SIZE ESTIMATES & FORECAST, BY DISTRIBUTION CHANNEL, 2019-2032 (USD BILLIONS)
      126. TABLE 125. REST OF SOUTH AMERICA GARCINIA MARKET SIZE ESTIMATES & FORECAST, BY END USE, 2019-2032 (USD BILLIONS)
      127. TABLE 126. REST OF SOUTH AMERICA GARCINIA MARKET SIZE ESTIMATES & FORECAST, BY REGIONAL, 2019-2032 (USD BILLIONS)
      128. TABLE 127. MEA GARCINIA MARKET SIZE ESTIMATES & FORECAST, BY FORM, 2019-2032 (USD BILLIONS)
      129. TABLE 128. MEA GARCINIA MARKET SIZE ESTIMATES & FORECAST, BY APPLICATION, 2019-2032 (USD BILLIONS)
      130. TABLE 129. MEA GARCINIA MARKET SIZE ESTIMATES & FORECAST, BY DISTRIBUTION CHANNEL, 2019-2032 (USD BILLIONS)
      131. TABLE 130. MEA GARCINIA MARKET SIZE ESTIMATES & FORECAST, BY END USE, 2019-2032 (USD BILLIONS)
      132. TABLE 131. MEA GARCINIA MARKET SIZE ESTIMATES & FORECAST, BY REGIONAL, 2019-2032 (USD BILLIONS)
      133. TABLE 132. GCC COUNTRIES GARCINIA MARKET SIZE ESTIMATES & FORECAST, BY FORM, 2019-2032 (USD BILLIONS)
      134. TABLE 133. GCC COUNTRIES GARCINIA MARKET SIZE ESTIMATES & FORECAST, BY APPLICATION, 2019-2032 (USD BILLIONS)
      135. TABLE 134. GCC COUNTRIES GARCINIA MARKET SIZE ESTIMATES & FORECAST, BY DISTRIBUTION CHANNEL, 2019-2032 (USD BILLIONS)
      136. TABLE 135. GCC COUNTRIES GARCINIA MARKET SIZE ESTIMATES & FORECAST, BY END USE, 2019-2032 (USD BILLIONS)
      137. TABLE 136. GCC COUNTRIES GARCINIA MARKET SIZE ESTIMATES & FORECAST, BY REGIONAL, 2019-2032 (USD BILLIONS)
      138. TABLE 137. SOUTH AFRICA GARCINIA MARKET SIZE ESTIMATES & FORECAST, BY FORM, 2019-2032 (USD BILLIONS)
      139. TABLE 138. SOUTH AFRICA GARCINIA MARKET SIZE ESTIMATES & FORECAST, BY APPLICATION, 2019-2032 (USD BILLIONS)
      140. TABLE 139. SOUTH AFRICA GARCINIA MARKET SIZE ESTIMATES & FORECAST, BY DISTRIBUTION CHANNEL, 2019-2032 (USD BILLIONS)
      141. TABLE 140. SOUTH AFRICA GARCINIA MARKET SIZE ESTIMATES & FORECAST, BY END USE, 2019-2032 (USD BILLIONS)
      142. TABLE 141. SOUTH AFRICA GARCINIA MARKET SIZE ESTIMATES & FORECAST, BY REGIONAL, 2019-2032 (USD BILLIONS)
      143. TABLE 142. REST OF MEA GARCINIA MARKET SIZE ESTIMATES & FORECAST, BY FORM, 2019-2032 (USD BILLIONS)
      144. TABLE 143. REST OF MEA GARCINIA MARKET SIZE ESTIMATES & FORECAST, BY APPLICATION, 2019-2032 (USD BILLIONS)
      145. TABLE 144. REST OF MEA GARCINIA MARKET SIZE ESTIMATES & FORECAST, BY DISTRIBUTION CHANNEL, 2019-2032 (USD BILLIONS)
      146. TABLE 145. REST OF MEA GARCINIA MARKET SIZE ESTIMATES & FORECAST, BY END USE, 2019-2032 (USD BILLIONS)
      147. TABLE 146. REST OF MEA GARCINIA MARKET SIZE ESTIMATES & FORECAST, BY REGIONAL, 2019-2032 (USD BILLIONS)
      148. TABLE 147. PRODUCT LAUNCH/PRODUCT DEVELOPMENT/APPROVAL
      149. TABLE 148. ACQUISITION/PARTNERSHIP LIST OF FIGURES
      150. FIGURE 1. MARKET SYNOPSIS
      151. FIGURE 2. NORTH AMERICA GARCINIA MARKET ANALYSIS
      152. FIGURE 3. US GARCINIA MARKET ANALYSIS BY FORM
      153. FIGURE 4. US GARCINIA MARKET ANALYSIS BY APPLICATION
      154. FIGURE 5. US GARCINIA MARKET ANALYSIS BY DISTRIBUTION CHANNEL
      155. FIGURE 6. US GARCINIA MARKET ANALYSIS BY END USE
      156. FIGURE 7. US GARCINIA MARKET ANALYSIS BY REGIONAL
      157. FIGURE 8. CANADA GARCINIA MARKET ANALYSIS BY FORM
      158. FIGURE 9. CANADA GARCINIA MARKET ANALYSIS BY APPLICATION
      159. FIGURE 10. CANADA GARCINIA MARKET ANALYSIS BY DISTRIBUTION CHANNEL
      160. FIGURE 11. CANADA GARCINIA MARKET ANALYSIS BY END USE
      161. FIGURE 12. CANADA GARCINIA MARKET ANALYSIS BY REGIONAL
      162. FIGURE 13. EUROPE GARCINIA MARKET ANALYSIS
      163. FIGURE 14. GERMANY GARCINIA MARKET ANALYSIS BY FORM
      164. FIGURE 15. GERMANY GARCINIA MARKET ANALYSIS BY APPLICATION
      165. FIGURE 16. GERMANY GARCINIA MARKET ANALYSIS BY DISTRIBUTION CHANNEL
      166. FIGURE 17. GERMANY GARCINIA MARKET ANALYSIS BY END USE
      167. FIGURE 18. GERMANY GARCINIA MARKET ANALYSIS BY REGIONAL
      168. FIGURE 19. UK GARCINIA MARKET ANALYSIS BY FORM
      169. FIGURE 20. UK GARCINIA MARKET ANALYSIS BY APPLICATION
      170. FIGURE 21. UK GARCINIA MARKET ANALYSIS BY DISTRIBUTION CHANNEL
      171. FIGURE 22. UK GARCINIA MARKET ANALYSIS BY END USE
      172. FIGURE 23. UK GARCINIA MARKET ANALYSIS BY REGIONAL
      173. FIGURE 24. FRANCE GARCINIA MARKET ANALYSIS BY FORM
      174. FIGURE 25. FRANCE GARCINIA MARKET ANALYSIS BY APPLICATION
      175. FIGURE 26. FRANCE GARCINIA MARKET ANALYSIS BY DISTRIBUTION CHANNEL
      176. FIGURE 27. FRANCE GARCINIA MARKET ANALYSIS BY END USE
      177. FIGURE 28. FRANCE GARCINIA MARKET ANALYSIS BY REGIONAL
      178. FIGURE 29. RUSSIA GARCINIA MARKET ANALYSIS BY FORM
      179. FIGURE 30. RUSSIA GARCINIA MARKET ANALYSIS BY APPLICATION
      180. FIGURE 31. RUSSIA GARCINIA MARKET ANALYSIS BY DISTRIBUTION CHANNEL
      181. FIGURE 32. RUSSIA GARCINIA MARKET ANALYSIS BY END USE
      182. FIGURE 33. RUSSIA GARCINIA MARKET ANALYSIS BY REGIONAL
      183. FIGURE 34. ITALY GARCINIA MARKET ANALYSIS BY FORM
      184. FIGURE 35. ITALY GARCINIA MARKET ANALYSIS BY APPLICATION
      185. FIGURE 36. ITALY GARCINIA MARKET ANALYSIS BY DISTRIBUTION CHANNEL
      186. FIGURE 37. ITALY GARCINIA MARKET ANALYSIS BY END USE
      187. FIGURE 38. ITALY GARCINIA MARKET ANALYSIS BY REGIONAL
      188. FIGURE 39. SPAIN GARCINIA MARKET ANALYSIS BY FORM
      189. FIGURE 40. SPAIN GARCINIA MARKET ANALYSIS BY APPLICATION
      190. FIGURE 41. SPAIN GARCINIA MARKET ANALYSIS BY DISTRIBUTION CHANNEL
      191. FIGURE 42. SPAIN GARCINIA MARKET ANALYSIS BY END USE
      192. FIGURE 43. SPAIN GARCINIA MARKET ANALYSIS BY REGIONAL
      193. FIGURE 44. REST OF EUROPE GARCINIA MARKET ANALYSIS BY FORM
      194. FIGURE 45. REST OF EUROPE GARCINIA MARKET ANALYSIS BY APPLICATION
      195. FIGURE 46. REST OF EUROPE GARCINIA MARKET ANALYSIS BY DISTRIBUTION CHANNEL
      196. FIGURE 47. REST OF EUROPE GARCINIA MARKET ANALYSIS BY END USE
      197. FIGURE 48. REST OF EUROPE GARCINIA MARKET ANALYSIS BY REGIONAL
      198. FIGURE 49. APAC GARCINIA MARKET ANALYSIS
      199. FIGURE 50. CHINA GARCINIA MARKET ANALYSIS BY FORM
      200. FIGURE 51. CHINA GARCINIA MARKET ANALYSIS BY APPLICATION
      201. FIGURE 52. CHINA GARCINIA MARKET ANALYSIS BY DISTRIBUTION CHANNEL
      202. FIGURE 53. CHINA GARCINIA MARKET ANALYSIS BY END USE
      203. FIGURE 54. CHINA GARCINIA MARKET ANALYSIS BY REGIONAL
      204. FIGURE 55. INDIA GARCINIA MARKET ANALYSIS BY FORM
      205. FIGURE 56. INDIA GARCINIA MARKET ANALYSIS BY APPLICATION
      206. FIGURE 57. INDIA GARCINIA MARKET ANALYSIS BY DISTRIBUTION CHANNEL
      207. FIGURE 58. INDIA GARCINIA MARKET ANALYSIS BY END USE
      208. FIGURE 59. INDIA GARCINIA MARKET ANALYSIS BY REGIONAL
      209. FIGURE 60. JAPAN GARCINIA MARKET ANALYSIS BY FORM
      210. FIGURE 61. JAPAN GARCINIA MARKET ANALYSIS BY APPLICATION
      211. FIGURE 62. JAPAN GARCINIA MARKET ANALYSIS BY DISTRIBUTION CHANNEL
      212. FIGURE 63. JAPAN GARCINIA MARKET ANALYSIS BY END USE
      213. FIGURE 64. JAPAN GARCINIA MARKET ANALYSIS BY REGIONAL
      214. FIGURE 65. SOUTH KOREA GARCINIA MARKET ANALYSIS BY FORM
      215. FIGURE 66. SOUTH KOREA GARCINIA MARKET ANALYSIS BY APPLICATION
      216. FIGURE 67. SOUTH KOREA GARCINIA MARKET ANALYSIS BY DISTRIBUTION CHANNEL
      217. FIGURE 68. SOUTH KOREA GARCINIA MARKET ANALYSIS BY END USE
      218. FIGURE 69. SOUTH KOREA GARCINIA MARKET ANALYSIS BY REGIONAL
      219. FIGURE 70. MALAYSIA GARCINIA MARKET ANALYSIS BY FORM
      220. FIGURE 71. MALAYSIA GARCINIA MARKET ANALYSIS BY APPLICATION
      221. FIGURE 72. MALAYSIA GARCINIA MARKET ANALYSIS BY DISTRIBUTION CHANNEL
      222. FIGURE 73. MALAYSIA GARCINIA MARKET ANALYSIS BY END USE
      223. FIGURE 74. MALAYSIA GARCINIA MARKET ANALYSIS BY REGIONAL
      224. FIGURE 75. THAILAND GARCINIA MARKET ANALYSIS BY FORM
      225. FIGURE 76. THAILAND GARCINIA MARKET ANALYSIS BY APPLICATION
      226. FIGURE 77. THAILAND GARCINIA MARKET ANALYSIS BY DISTRIBUTION CHANNEL
      227. FIGURE 78. THAILAND GARCINIA MARKET ANALYSIS BY END USE
      228. FIGURE 79. THAILAND GARCINIA MARKET ANALYSIS BY REGIONAL
      229. FIGURE 80. INDONESIA GARCINIA MARKET ANALYSIS BY FORM
      230. FIGURE 81. INDONESIA GARCINIA MARKET ANALYSIS BY APPLICATION
      231. FIGURE 82. INDONESIA GARCINIA MARKET ANALYSIS BY DISTRIBUTION CHANNEL
      232. FIGURE 83. INDONESIA GARCINIA MARKET ANALYSIS BY END USE
      233. FIGURE 84. INDONESIA GARCINIA MARKET ANALYSIS BY REGIONAL
      234. FIGURE 85. REST OF APAC GARCINIA MARKET ANALYSIS BY FORM
      235. FIGURE 86. REST OF APAC GARCINIA MARKET ANALYSIS BY APPLICATION
      236. FIGURE 87. REST OF APAC GARCINIA MARKET ANALYSIS BY DISTRIBUTION CHANNEL
      237. FIGURE 88. REST OF APAC GARCINIA MARKET ANALYSIS BY END USE
      238. FIGURE 89. REST OF APAC GARCINIA MARKET ANALYSIS BY REGIONAL
      239. FIGURE 90. SOUTH AMERICA GARCINIA MARKET ANALYSIS
      240. FIGURE 91. BRAZIL GARCINIA MARKET ANALYSIS BY FORM
      241. FIGURE 92. BRAZIL GARCINIA MARKET ANALYSIS BY APPLICATION
      242. FIGURE 93. BRAZIL GARCINIA MARKET ANALYSIS BY DISTRIBUTION CHANNEL
      243. FIGURE 94. BRAZIL GARCINIA MARKET ANALYSIS BY END USE
      244. FIGURE 95. BRAZIL GARCINIA MARKET ANALYSIS BY REGIONAL
      245. FIGURE 96. MEXICO GARCINIA MARKET ANALYSIS BY FORM
      246. FIGURE 97. MEXICO GARCINIA MARKET ANALYSIS BY APPLICATION
      247. FIGURE 98. MEXICO GARCINIA MARKET ANALYSIS BY DISTRIBUTION CHANNEL
      248. FIGURE 99. MEXICO GARCINIA MARKET ANALYSIS BY END USE
      249. FIGURE 100. MEXICO GARCINIA MARKET ANALYSIS BY REGIONAL
      250. FIGURE 101. ARGENTINA GARCINIA MARKET ANALYSIS BY FORM
      251. FIGURE 102. ARGENTINA GARCINIA MARKET ANALYSIS BY APPLICATION
      252. FIGURE 103. ARGENTINA GARCINIA MARKET ANALYSIS BY DISTRIBUTION CHANNEL
      253. FIGURE 104. ARGENTINA GARCINIA MARKET ANALYSIS BY END USE
      254. FIGURE 105. ARGENTINA GARCINIA MARKET ANALYSIS BY REGIONAL
      255. FIGURE 106. REST OF SOUTH AMERICA GARCINIA MARKET ANALYSIS BY FORM
      256. FIGURE 107. REST OF SOUTH AMERICA GARCINIA MARKET ANALYSIS BY APPLICATION
      257. FIGURE 108. REST OF SOUTH AMERICA GARCINIA MARKET ANALYSIS BY DISTRIBUTION CHANNEL
      258. FIGURE 109. REST OF SOUTH AMERICA GARCINIA MARKET ANALYSIS BY END USE
      259. FIGURE 110. REST OF SOUTH AMERICA GARCINIA MARKET ANALYSIS BY REGIONAL
      260. FIGURE 111. MEA GARCINIA MARKET ANALYSIS
      261. FIGURE 112. GCC COUNTRIES GARCINIA MARKET ANALYSIS BY FORM
      262. FIGURE 113. GCC COUNTRIES GARCINIA MARKET ANALYSIS BY APPLICATION
      263. FIGURE 114. GCC COUNTRIES GARCINIA MARKET ANALYSIS BY DISTRIBUTION CHANNEL
      264. FIGURE 115. GCC COUNTRIES GARCINIA MARKET ANALYSIS BY END USE
      265. FIGURE 116. GCC COUNTRIES GARCINIA MARKET ANALYSIS BY REGIONAL
      266. FIGURE 117. SOUTH AFRICA GARCINIA MARKET ANALYSIS BY FORM
      267. FIGURE 118. SOUTH AFRICA GARCINIA MARKET ANALYSIS BY APPLICATION
      268. FIGURE 119. SOUTH AFRICA GARCINIA MARKET ANALYSIS BY DISTRIBUTION CHANNEL
      269. FIGURE 120. SOUTH AFRICA GARCINIA MARKET ANALYSIS BY END USE
      270. FIGURE 121. SOUTH AFRICA GARCINIA MARKET ANALYSIS BY REGIONAL
      271. FIGURE 122. REST OF MEA GARCINIA MARKET ANALYSIS BY FORM
      272. FIGURE 123. REST OF MEA GARCINIA MARKET ANALYSIS BY APPLICATION
      273. FIGURE 124. REST OF MEA GARCINIA MARKET ANALYSIS BY DISTRIBUTION CHANNEL
      274. FIGURE 125. REST OF MEA GARCINIA MARKET ANALYSIS BY END USE
      275. FIGURE 126. REST OF MEA GARCINIA MARKET ANALYSIS BY REGIONAL
      276. FIGURE 127. KEY BUYING CRITERIA OF GARCINIA MARKET
      277. FIGURE 128. RESEARCH PROCESS OF MRFR
      278. FIGURE 129. DRO ANALYSIS OF GARCINIA MARKET
      279. FIGURE 130. DRIVERS IMPACT ANALYSIS: GARCINIA MARKET
      280. FIGURE 131. RESTRAINTS IMPACT ANALYSIS: GARCINIA MARKET
      281. FIGURE 132. SUPPLY / VALUE CHAIN: GARCINIA MARKET
      282. FIGURE 133. GARCINIA MARKET, BY FORM, 2024 (% SHARE)
      283. FIGURE 134. GARCINIA MARKET, BY FORM, 2019 TO 2032 (USD Billions)
      284. FIGURE 135. GARCINIA MARKET, BY APPLICATION, 2024 (% SHARE)
      285. FIGURE 136. GARCINIA MARKET, BY APPLICATION, 2019 TO 2032 (USD Billions)
      286. FIGURE 137. GARCINIA MARKET, BY DISTRIBUTION CHANNEL, 2024 (% SHARE)
      287. FIGURE 138. GARCINIA MARKET, BY DISTRIBUTION CHANNEL, 2019 TO 2032 (USD Billions)
      288. FIGURE 139. GARCINIA MARKET, BY END USE, 2024 (% SHARE)
      289. FIGURE 140. GARCINIA MARKET, BY END USE, 2019 TO 2032 (USD Billions)
      290. FIGURE 141. GARCINIA MARKET, BY REGIONAL, 2024 (% SHARE)
      291. FIGURE 142. GARCINIA MARKET, BY REGIONAL, 2019 TO 2032 (USD Billions)
      292. FIGURE 143. BENCHMARKING OF MAJOR COMPETITORS

    Garcinia Market Market Segmentation

    • Garcinia Market By Form (USD Billion, 2019-2032)

      • Powder

      • Capsule

      • Liquid

      • Extract

      • Tablet

    • Garcinia Market By Application (USD Billion, 2019-2032)

      • Dietary Supplements

      • Food and Beverages

      • Cosmetics

      • Pharmaceuticals

    • Garcinia Market By Distribution Channel (USD Billion, 2019-2032)

      • Online Retail

      • Supermarkets

      • Health Stores

      • Pharmacies

    • Garcinia Market By End Use (USD Billion, 2019-2032)

      • Adults

      • Elderly

      • Athletes

    • Garcinia Market By Regional (USD Billion, 2019-2032)

      • North America

      • Europe

      • South America

      • Asia Pacific

      • Middle East and Africa

    Garcinia Market Regional Outlook (USD Billion, 2019-2032)

    • North America Outlook (USD Billion, 2019-2032)

      • North America Garcinia Market by Form Type

        • Powder

        • Capsule

        • Liquid

        • Extract

        • Tablet

      • North America Garcinia Market by Application Type

        • Dietary Supplements

        • Food and Beverages

        • Cosmetics

        • Pharmaceuticals

      • North America Garcinia Market by Distribution Channel Type

        • Online Retail

        • Supermarkets

        • Health Stores

        • Pharmacies

      • North America Garcinia Market by End Use Type

        • Adults

        • Elderly

        • Athletes

      • North America Garcinia Market by Regional Type

        • US

        • Canada

      • US Outlook (USD Billion, 2019-2032)

      • US Garcinia Market by Form Type

        • Powder

        • Capsule

        • Liquid

        • Extract

        • Tablet

      • US Garcinia Market by Application Type

        • Dietary Supplements

        • Food and Beverages

        • Cosmetics

        • Pharmaceuticals

      • US Garcinia Market by Distribution Channel Type

        • Online Retail

        • Supermarkets

        • Health Stores

        • Pharmacies

      • US Garcinia Market by End Use Type

        • Adults

        • Elderly

        • Athletes

      • CANADA Outlook (USD Billion, 2019-2032)

      • CANADA Garcinia Market by Form Type

        • Powder

        • Capsule

        • Liquid

        • Extract

        • Tablet

      • CANADA Garcinia Market by Application Type

        • Dietary Supplements

        • Food and Beverages

        • Cosmetics

        • Pharmaceuticals

      • CANADA Garcinia Market by Distribution Channel Type

        • Online Retail

        • Supermarkets

        • Health Stores

        • Pharmacies

      • CANADA Garcinia Market by End Use Type

        • Adults

        • Elderly

        • Athletes

    • Europe Outlook (USD Billion, 2019-2032)

      • Europe Garcinia Market by Form Type

        • Powder

        • Capsule

        • Liquid

        • Extract

        • Tablet

      • Europe Garcinia Market by Application Type

        • Dietary Supplements

        • Food and Beverages

        • Cosmetics

        • Pharmaceuticals

      • Europe Garcinia Market by Distribution Channel Type

        • Online Retail

        • Supermarkets

        • Health Stores

        • Pharmacies

      • Europe Garcinia Market by End Use Type

        • Adults

        • Elderly

        • Athletes

      • Europe Garcinia Market by Regional Type

        • Germany

        • UK

        • France

        • Russia

        • Italy

        • Spain

        • Rest of Europe

      • GERMANY Outlook (USD Billion, 2019-2032)

      • GERMANY Garcinia Market by Form Type

        • Powder

        • Capsule

        • Liquid

        • Extract

        • Tablet

      • GERMANY Garcinia Market by Application Type

        • Dietary Supplements

        • Food and Beverages

        • Cosmetics

        • Pharmaceuticals

      • GERMANY Garcinia Market by Distribution Channel Type

        • Online Retail

        • Supermarkets

        • Health Stores

        • Pharmacies

      • GERMANY Garcinia Market by End Use Type

        • Adults

        • Elderly

        • Athletes

      • UK Outlook (USD Billion, 2019-2032)

      • UK Garcinia Market by Form Type

        • Powder

        • Capsule

        • Liquid

        • Extract

        • Tablet

      • UK Garcinia Market by Application Type

        • Dietary Supplements

        • Food and Beverages

        • Cosmetics

        • Pharmaceuticals

      • UK Garcinia Market by Distribution Channel Type

        • Online Retail

        • Supermarkets

        • Health Stores

        • Pharmacies

      • UK Garcinia Market by End Use Type

        • Adults

        • Elderly

        • Athletes

      • FRANCE Outlook (USD Billion, 2019-2032)

      • FRANCE Garcinia Market by Form Type

        • Powder

        • Capsule

        • Liquid

        • Extract

        • Tablet

      • FRANCE Garcinia Market by Application Type

        • Dietary Supplements

        • Food and Beverages

        • Cosmetics

        • Pharmaceuticals

      • FRANCE Garcinia Market by Distribution Channel Type

        • Online Retail

        • Supermarkets

        • Health Stores

        • Pharmacies

      • FRANCE Garcinia Market by End Use Type

        • Adults

        • Elderly

        • Athletes

      • RUSSIA Outlook (USD Billion, 2019-2032)

      • RUSSIA Garcinia Market by Form Type

        • Powder

        • Capsule

        • Liquid

        • Extract

        • Tablet

      • RUSSIA Garcinia Market by Application Type

        • Dietary Supplements

        • Food and Beverages

        • Cosmetics

        • Pharmaceuticals

      • RUSSIA Garcinia Market by Distribution Channel Type

        • Online Retail

        • Supermarkets

        • Health Stores

        • Pharmacies

      • RUSSIA Garcinia Market by End Use Type

        • Adults

        • Elderly

        • Athletes

      • ITALY Outlook (USD Billion, 2019-2032)

      • ITALY Garcinia Market by Form Type

        • Powder

        • Capsule

        • Liquid

        • Extract

        • Tablet

      • ITALY Garcinia Market by Application Type

        • Dietary Supplements

        • Food and Beverages

        • Cosmetics

        • Pharmaceuticals

      • ITALY Garcinia Market by Distribution Channel Type

        • Online Retail

        • Supermarkets

        • Health Stores

        • Pharmacies

      • ITALY Garcinia Market by End Use Type

        • Adults

        • Elderly

        • Athletes

      • SPAIN Outlook (USD Billion, 2019-2032)

      • SPAIN Garcinia Market by Form Type

        • Powder

        • Capsule

        • Liquid

        • Extract

        • Tablet

      • SPAIN Garcinia Market by Application Type

        • Dietary Supplements

        • Food and Beverages

        • Cosmetics

        • Pharmaceuticals

      • SPAIN Garcinia Market by Distribution Channel Type

        • Online Retail

        • Supermarkets

        • Health Stores

        • Pharmacies

      • SPAIN Garcinia Market by End Use Type

        • Adults

        • Elderly

        • Athletes

      • REST OF EUROPE Outlook (USD Billion, 2019-2032)

      • REST OF EUROPE Garcinia Market by Form Type

        • Powder

        • Capsule

        • Liquid

        • Extract

        • Tablet

      • REST OF EUROPE Garcinia Market by Application Type

        • Dietary Supplements

        • Food and Beverages

        • Cosmetics

        • Pharmaceuticals

      • REST OF EUROPE Garcinia Market by Distribution Channel Type

        • Online Retail

        • Supermarkets

        • Health Stores

        • Pharmacies

      • REST OF EUROPE Garcinia Market by End Use Type

        • Adults

        • Elderly

        • Athletes

    • APAC Outlook (USD Billion, 2019-2032)

      • APAC Garcinia Market by Form Type

        • Powder

        • Capsule

        • Liquid

        • Extract

        • Tablet

      • APAC Garcinia Market by Application Type

        • Dietary Supplements

        • Food and Beverages

        • Cosmetics

        • Pharmaceuticals

      • APAC Garcinia Market by Distribution Channel Type

        • Online Retail

        • Supermarkets

        • Health Stores

        • Pharmacies

      • APAC Garcinia Market by End Use Type

        • Adults

        • Elderly

        • Athletes

      • APAC Garcinia Market by Regional Type

        • China

        • India

        • Japan

        • South Korea

        • Malaysia

        • Thailand

        • Indonesia

        • Rest of APAC

      • CHINA Outlook (USD Billion, 2019-2032)

      • CHINA Garcinia Market by Form Type

        • Powder

        • Capsule

        • Liquid

        • Extract

        • Tablet

      • CHINA Garcinia Market by Application Type

        • Dietary Supplements

        • Food and Beverages

        • Cosmetics

        • Pharmaceuticals

      • CHINA Garcinia Market by Distribution Channel Type

        • Online Retail

        • Supermarkets

        • Health Stores

        • Pharmacies

      • CHINA Garcinia Market by End Use Type

        • Adults

        • Elderly

        • Athletes

      • INDIA Outlook (USD Billion, 2019-2032)

      • INDIA Garcinia Market by Form Type

        • Powder

        • Capsule

        • Liquid

        • Extract

        • Tablet

      • INDIA Garcinia Market by Application Type

        • Dietary Supplements

        • Food and Beverages

        • Cosmetics

        • Pharmaceuticals

      • INDIA Garcinia Market by Distribution Channel Type

        • Online Retail

        • Supermarkets

        • Health Stores

        • Pharmacies

      • INDIA Garcinia Market by End Use Type

        • Adults

        • Elderly

        • Athletes

      • JAPAN Outlook (USD Billion, 2019-2032)

      • JAPAN Garcinia Market by Form Type

        • Powder

        • Capsule

        • Liquid

        • Extract

        • Tablet

      • JAPAN Garcinia Market by Application Type

        • Dietary Supplements

        • Food and Beverages

        • Cosmetics

        • Pharmaceuticals

      • JAPAN Garcinia Market by Distribution Channel Type

        • Online Retail

        • Supermarkets

        • Health Stores

        • Pharmacies

      • JAPAN Garcinia Market by End Use Type

        • Adults

        • Elderly

        • Athletes

      • SOUTH KOREA Outlook (USD Billion, 2019-2032)

      • SOUTH KOREA Garcinia Market by Form Type

        • Powder

        • Capsule

        • Liquid

        • Extract

        • Tablet

      • SOUTH KOREA Garcinia Market by Application Type

        • Dietary Supplements

        • Food and Beverages

        • Cosmetics

        • Pharmaceuticals

      • SOUTH KOREA Garcinia Market by Distribution Channel Type

        • Online Retail

        • Supermarkets

        • Health Stores

        • Pharmacies

      • SOUTH KOREA Garcinia Market by End Use Type

        • Adults

        • Elderly

        • Athletes

      • MALAYSIA Outlook (USD Billion, 2019-2032)

      • MALAYSIA Garcinia Market by Form Type

        • Powder

        • Capsule

        • Liquid

        • Extract

        • Tablet

      • MALAYSIA Garcinia Market by Application Type

        • Dietary Supplements

        • Food and Beverages

        • Cosmetics

        • Pharmaceuticals

      • MALAYSIA Garcinia Market by Distribution Channel Type

        • Online Retail

        • Supermarkets

        • Health Stores

        • Pharmacies

      • MALAYSIA Garcinia Market by End Use Type

        • Adults

        • Elderly

        • Athletes

      • THAILAND Outlook (USD Billion, 2019-2032)

      • THAILAND Garcinia Market by Form Type

        • Powder

        • Capsule

        • Liquid

        • Extract

        • Tablet

      • THAILAND Garcinia Market by Application Type

        • Dietary Supplements

        • Food and Beverages

        • Cosmetics

        • Pharmaceuticals

      • THAILAND Garcinia Market by Distribution Channel Type

        • Online Retail

        • Supermarkets

        • Health Stores

        • Pharmacies

      • THAILAND Garcinia Market by End Use Type

        • Adults

        • Elderly

        • Athletes

      • INDONESIA Outlook (USD Billion, 2019-2032)

      • INDONESIA Garcinia Market by Form Type

        • Powder

        • Capsule

        • Liquid

        • Extract

        • Tablet

      • INDONESIA Garcinia Market by Application Type

        • Dietary Supplements

        • Food and Beverages

        • Cosmetics

        • Pharmaceuticals

      • INDONESIA Garcinia Market by Distribution Channel Type

        • Online Retail

        • Supermarkets

        • Health Stores

        • Pharmacies

      • INDONESIA Garcinia Market by End Use Type

        • Adults

        • Elderly

        • Athletes

      • REST OF APAC Outlook (USD Billion, 2019-2032)

      • REST OF APAC Garcinia Market by Form Type

        • Powder

        • Capsule

        • Liquid

        • Extract

        • Tablet

      • REST OF APAC Garcinia Market by Application Type

        • Dietary Supplements

        • Food and Beverages

        • Cosmetics

        • Pharmaceuticals

      • REST OF APAC Garcinia Market by Distribution Channel Type

        • Online Retail

        • Supermarkets

        • Health Stores

        • Pharmacies

      • REST OF APAC Garcinia Market by End Use Type

        • Adults

        • Elderly

        • Athletes

    • South America Outlook (USD Billion, 2019-2032)

      • South America Garcinia Market by Form Type

        • Powder

        • Capsule

        • Liquid

        • Extract

        • Tablet

      • South America Garcinia Market by Application Type

        • Dietary Supplements

        • Food and Beverages

        • Cosmetics

        • Pharmaceuticals

      • South America Garcinia Market by Distribution Channel Type

        • Online Retail

        • Supermarkets

        • Health Stores

        • Pharmacies

      • South America Garcinia Market by End Use Type

        • Adults

        • Elderly

        • Athletes

      • South America Garcinia Market by Regional Type

        • Brazil

        • Mexico

        • Argentina

        • Rest of South America

      • BRAZIL Outlook (USD Billion, 2019-2032)

      • BRAZIL Garcinia Market by Form Type

        • Powder

        • Capsule

        • Liquid

        • Extract

        • Tablet

      • BRAZIL Garcinia Market by Application Type

        • Dietary Supplements

        • Food and Beverages

        • Cosmetics

        • Pharmaceuticals

      • BRAZIL Garcinia Market by Distribution Channel Type

        • Online Retail

        • Supermarkets

        • Health Stores

        • Pharmacies

      • BRAZIL Garcinia Market by End Use Type

        • Adults

        • Elderly

        • Athletes

      • MEXICO Outlook (USD Billion, 2019-2032)

      • MEXICO Garcinia Market by Form Type

        • Powder

        • Capsule

        • Liquid

        • Extract

        • Tablet

      • MEXICO Garcinia Market by Application Type

        • Dietary Supplements

        • Food and Beverages

        • Cosmetics

        • Pharmaceuticals

      • MEXICO Garcinia Market by Distribution Channel Type

        • Online Retail

        • Supermarkets

        • Health Stores

        • Pharmacies

      • MEXICO Garcinia Market by End Use Type

        • Adults

        • Elderly

        • Athletes

      • ARGENTINA Outlook (USD Billion, 2019-2032)

      • ARGENTINA Garcinia Market by Form Type

        • Powder

        • Capsule

        • Liquid

        • Extract

        • Tablet

      • ARGENTINA Garcinia Market by Application Type

        • Dietary Supplements

        • Food and Beverages

        • Cosmetics

        • Pharmaceuticals

      • ARGENTINA Garcinia Market by Distribution Channel Type

        • Online Retail

        • Supermarkets

        • Health Stores

        • Pharmacies

      • ARGENTINA Garcinia Market by End Use Type

        • Adults

        • Elderly

        • Athletes

      • REST OF SOUTH AMERICA Outlook (USD Billion, 2019-2032)

      • REST OF SOUTH AMERICA Garcinia Market by Form Type

        • Powder

        • Capsule

        • Liquid

        • Extract

        • Tablet

      • REST OF SOUTH AMERICA Garcinia Market by Application Type

        • Dietary Supplements

        • Food and Beverages

        • Cosmetics

        • Pharmaceuticals

      • REST OF SOUTH AMERICA Garcinia Market by Distribution Channel Type

        • Online Retail

        • Supermarkets

        • Health Stores

        • Pharmacies

      • REST OF SOUTH AMERICA Garcinia Market by End Use Type

        • Adults

        • Elderly

        • Athletes

    • MEA Outlook (USD Billion, 2019-2032)

      • MEA Garcinia Market by Form Type

        • Powder

        • Capsule

        • Liquid

        • Extract

        • Tablet

      • MEA Garcinia Market by Application Type

        • Dietary Supplements

        • Food and Beverages

        • Cosmetics

        • Pharmaceuticals

      • MEA Garcinia Market by Distribution Channel Type

        • Online Retail

        • Supermarkets

        • Health Stores

        • Pharmacies

      • MEA Garcinia Market by End Use Type

        • Adults

        • Elderly

        • Athletes

      • MEA Garcinia Market by Regional Type

        • GCC Countries

        • South Africa

        • Rest of MEA

      • GCC COUNTRIES Outlook (USD Billion, 2019-2032)

      • GCC COUNTRIES Garcinia Market by Form Type

        • Powder

        • Capsule

        • Liquid

        • Extract

        • Tablet

      • GCC COUNTRIES Garcinia Market by Application Type

        • Dietary Supplements

        • Food and Beverages

        • Cosmetics

        • Pharmaceuticals

      • GCC COUNTRIES Garcinia Market by Distribution Channel Type

        • Online Retail

        • Supermarkets

        • Health Stores

        • Pharmacies

      • GCC COUNTRIES Garcinia Market by End Use Type

        • Adults

        • Elderly

        • Athletes

      • SOUTH AFRICA Outlook (USD Billion, 2019-2032)

      • SOUTH AFRICA Garcinia Market by Form Type

        • Powder

        • Capsule

        • Liquid

        • Extract

        • Tablet

      • SOUTH AFRICA Garcinia Market by Application Type

        • Dietary Supplements

        • Food and Beverages

        • Cosmetics

        • Pharmaceuticals

      • SOUTH AFRICA Garcinia Market by Distribution Channel Type

        • Online Retail

        • Supermarkets

        • Health Stores

        • Pharmacies

      • SOUTH AFRICA Garcinia Market by End Use Type

        • Adults

        • Elderly

        • Athletes

      • REST OF MEA Outlook (USD Billion, 2019-2032)

      • REST OF MEA Garcinia Market by Form Type

        • Powder

        • Capsule

        • Liquid

        • Extract

        • Tablet

      • REST OF MEA Garcinia Market by Application Type

        • Dietary Supplements

        • Food and Beverages

        • Cosmetics

        • Pharmaceuticals

      • REST OF MEA Garcinia Market by Distribution Channel Type

        • Online Retail

        • Supermarkets

        • Health Stores

        • Pharmacies

      • REST OF MEA Garcinia Market by End Use Type

        • Adults

        • Elderly

        • Athletes

    Infographic

    Free Sample Request

    Kindly complete the form below to receive a free sample of this Report

    Get Free Sample

    Customer Strories

    “I am very pleased with how market segments have been defined in a relevant way for my purposes (such as "Portable Freezers & refrigerators" and "last-mile"). In general the report is well structured. Thanks very much for your efforts.”

    Victoria Milne

    Founder
    Case Study
    Chemicals and Materials