• Cat-intel
  • MedIntelliX
  • Resources
  • About Us
  • Request Free Sample ×

    Kindly complete the form below to receive a free sample of this Report

    Leading companies partner with us for data-driven Insights

    clients tt-cursor

    Frac Sand Market

    ID: MRFR/E&P/20761-HCR
    100 Pages
    Chitranshi Jaiswal
    September 2025

    Frac Sand Market Research Report By Grade (100 Mesh, 140 Mesh, 20/40 Mesh, 40/70 Mesh, 70/140 Mesh, Others), By Application (Hydraulic Fracturing, Foundry Casting, Abrasive Blasting, Glass Manufacturing, Sports and Recreation, Others), By End User (Oil and Gas Companies, Foundries, Construction Companies, Glass Manufacturers, Sports and Recreation Industries, Others), By Source (Northern White Sand, Brown Sand, Jordan Sand, Ottawa Sand, Others) and By Regional (North America, Europe, South America, Asia Pacific, Middle East and Africa) - For...

    Share:
    Download PDF ×

    We do not share your information with anyone. However, we may send you emails based on your report interest from time to time. You may contact us at any time to opt-out.

    Frac Sand Market Research Report — Global Forecast till 2032 Infographic
    Purchase Options
    $ 4,950.0
    $ 5,950.0
    $ 7,250.0
    Table of Contents

    Frac Sand Market Summary

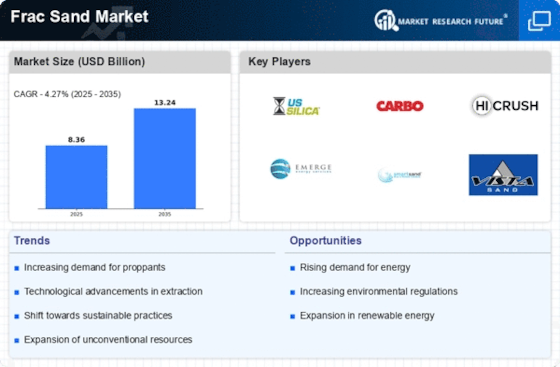
    The global frac sand market is projected to grow from 7.92 USD billion in 2024 to 12.7 USD billion by 2035, reflecting a robust growth trajectory.

    Key Market Trends & Highlights

    Frac Sand Key Trends and Highlights

    • The market is expected to experience a compound annual growth rate of 4.39 percent from 2025 to 2035.
    • By 2035, the market valuation is anticipated to reach 12.7 USD billion, indicating substantial growth potential.
    • In 2024, the market is valued at 7.92 USD billion, highlighting its current significance in the industry.
    • Growing adoption of hydraulic fracturing technology due to increased energy demand is a major market driver.

    Market Size & Forecast

    2024 Market Size 7.92 (USD Billion)
    2035 Market Size 12.7 (USD Billion)
    CAGR (2025-2035) 4.39%

    Major Players

    U.S. Silica Holdings, Inc., CARBO Ceramics, Inc., Hi-Crush Partners LP, Superior Silica Sands, LLC, Smart Sand, Inc., Badger Mining Corporation, R. Grace and Co, Haakon Industries Inc, Proppant Express Logistics, LP, Northern White Sand Company, Covia Holdings Corporation, Fairmount Santrol Holdings Inc., EP Minerals, LLC, S Midstream, LLC, Preferred Sands LLC

    Frac Sand Market Trends

    The Frac Sand Market is experiencing significant growth due to the expanding oil and gas industry, particularly in North America. Frac sand is a crucial component in hydraulic fracturing, a technique used to extract oil and gas from shale formations. The increasing demand for energy and the depletion of conventional oil and gas reserves have driven the adoption of hydraulic fracturing, leading to a surge in frac sand consumption. Key market drivers include the rising global energy demand, increasing oil and gas exploration activities, and technological advancements in hydraulic fracturing.

    Opportunities for growth exist in emerging markets such as Asia-Pacific, where oil and gas production is rapidly growing. Trends in recent times include the adoption of low-cost, high-efficiency frac sand production methods, as well as the development of environmentally sustainable frac sand solutions. The market is also influenced by regulatory changes and environmental concerns, which are driving the adoption of environmentally friendly frac sand and waste management practices.

    The demand for frac sand is poised to expand as energy companies increasingly seek efficient extraction methods to enhance oil and gas production, reflecting a broader trend towards optimizing resource utilization in the energy sector.

    U.S. Energy Information Administration

    Frac Sand Market Drivers

    Market Trends and Projections

    Increasing Demand for Oil and Gas

    The Global Frac Sand Market Industry experiences heightened demand driven by the oil and gas sector's expansion. As exploration and production activities intensify, the need for frac sand, a critical component in hydraulic fracturing, escalates. In 2024, the market is projected to reach 7.92 USD Billion, reflecting the industry's reliance on this resource. The ongoing shift towards unconventional oil and gas extraction methods further propels this demand, as operators seek efficient ways to enhance production rates. This trend indicates a robust growth trajectory for the Global Frac Sand Market, with significant implications for supply chain dynamics.

    Growing Infrastructure Development

    Infrastructure development across various regions significantly influences the Global Frac Sand Market Industry. As countries invest in energy infrastructure, the demand for oil and gas surges, subsequently increasing the need for frac sand. The construction of pipelines, refineries, and processing facilities creates a favorable environment for hydraulic fracturing activities. This trend is particularly evident in regions rich in shale reserves, where infrastructure improvements facilitate easier access to extraction sites. Consequently, the market is poised for growth, with projections indicating a compound annual growth rate of 4.39% from 2025 to 2035, underscoring the interconnectedness of infrastructure and frac sand demand.

    Emerging Markets and Global Expansion

    Emerging markets are becoming increasingly relevant in the Global Frac Sand Market Industry, as countries seek to harness their natural resources. Regions such as Latin America and parts of Asia are witnessing a surge in exploration activities, driven by the need for energy independence. This expansion into new markets not only diversifies the demand for frac sand but also presents opportunities for suppliers to establish a foothold in untapped regions. As these markets develop, the overall landscape of the Global Frac Sand Market is likely to evolve, reflecting a broader global engagement in energy production.

    Regulatory Support for Unconventional Resources

    Regulatory frameworks supporting the extraction of unconventional oil and gas resources play a pivotal role in shaping the Global Frac Sand Market Industry. Governments worldwide are increasingly recognizing the economic benefits of domestic energy production, leading to favorable policies that encourage exploration and production activities. This regulatory support not only boosts investor confidence but also stimulates demand for frac sand as a vital input in hydraulic fracturing processes. As the market evolves, it appears that such supportive measures will continue to foster growth, potentially leading to a market valuation of 12.7 USD Billion by 2035.

    Technological Advancements in Fracturing Techniques

    Technological innovations in hydraulic fracturing techniques contribute positively to the Global Frac Sand Market Industry. Enhanced methods, such as the use of advanced proppants and optimized fracturing fluids, improve the efficiency of sand usage. These advancements not only increase the effectiveness of extraction but also reduce operational costs for producers. As a result, operators are more inclined to invest in frac sand, anticipating higher returns on investment. The integration of data analytics and real-time monitoring systems further streamlines operations, suggesting a promising outlook for the market as it adapts to evolving technological landscapes.

    Market Segment Insights

    Frac Sand Market Grade Insights

    Segmentation-by-grade The Frac Sand Market is segmented by Grade into 100 Mesh, 140 Mesh, 20/40 Mesh, 40/70 Mesh, 70/140 Mesh, and Others. By holding the largest market share, the 100 Mesh segment is anticipated to experience the fastest growth. The 100 Mesh frac is generally employed in the oil and gas industry as it possesses characteristics for high pressure and high temperature. The 140 Mesh segment is estimated to experience remarkable acceleration with the forecasted tenure.

    The demand for this grade of frac sand is increasing owing to its adoption in unconventional oil gas extraction, such as horizontal drilling and hydraulic fracturing, among others. The 20/40 Mesh and 40/70 Mesh are expected to account for revenue by being established in the market. The 70/140 Mesh is likely to hold moderate market growth. The Others segment is anticipated to have a steady rise.

    On the whole, the analysis of the segmentation yields an insight into the applications and ratios of frac sand grades, thereby aiding the effective ascription of market strategies depending upon the choices and needs of the industry.

    Source: Primary Research, Secondary Research, Market Research Future Database and Analyst Review

    Frac Sand Market Application Insights

    The Frac Sand Market is segmented into various applications, including hydraulic fracturing, foundry casting, abrasive blasting, glass manufacturing, sports and recreation, and others. Among these, hydraulic fracturing is the dominant application, accounting for over 75% of the frac sand market revenue in 2023. The growth of this segment is primarily driven by the increasing demand for oil and gas, particularly in North America. Foundry casting is another significant application, with a market share of around 12% in 2023.

    The demand for frac sand in this segment is expected to remain stable over the next few years due to the growing demand for castings in various industries such as automotive, construction, and manufacturing. Abrasive blasting, glass manufacturing, and sports and recreation are other notable applications, collectively accounting for around 10% of the frac sand market revenue in 2023. The growth of these segments is expected to be driven by increasing industrial activities and consumer spending.

    Frac Sand Market End User Insights

    The end-user segment of the frac sand market encompasses various industries that utilize frac sand for diverse applications. Key end users include oil and gas companies, foundries, construction companies, glass manufacturers, sports and recreation industries, and others. Oil and gas companies account for a significant share of frac sand consumption due to its use in hydraulic fracturing operations. Foundries utilize frac sand in metal casting processes, while construction companies employ it in concrete production and infrastructure development. Glass manufacturers leverage frac sand as a raw material in the production of glass products.

    Sports and recreation industries use frac sand in sports facilities such as golf courses and baseball fields. Other end users include water filtration systems, industrial cleaning, and landscaping applications. The increasing demand for frac sand across these end-user segments is expected to drive the growth of the frac sand market in the coming years.

    Frac Sand Market Source Insights

    The Frac Sand Market is segmented by source into Northern White Sand, Brown Sand, Jordan Sand, Ottawa Sand, and Others. The Northern White Sand segment is expected to account for the largest share of the market in 2023, owing to its high purity and roundness, which makes it ideal for use in hydraulic fracturing operations. The Brown Sand segment is expected to witness the fastest growth during the forecast period, owing to its increasing adoption in unconventional oil and gas exploration and production activities.

    The Jordan Sand segment is expected to account for a significant share of the market, owing to its availability in large quantities and its cost-effectiveness. The Ottawa Sand segment is expected to witness moderate growth, owing to its use in specialized applications. The Others segment is expected to account for a small share of the market, owing to its limited availability and its use in niche applications. Overall, the Frac Sand Market is expected to witness steady growth over the forecast period, driven by the increasing demand for frac sand in the oil and gas industry.

    Get more detailed insights about Frac Sand Market Research Report — Global Forecast till 2032

    Regional Insights

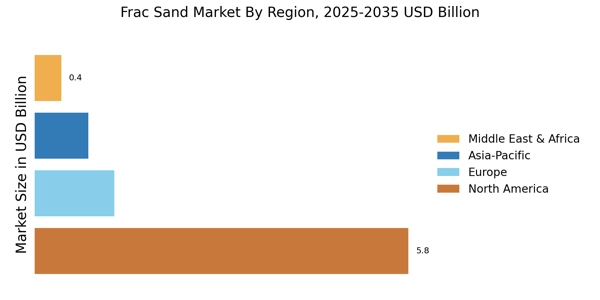
    Regionally, North America dominated the market with a share of over 60% in 2023. The region's dominance can be attributed to the presence of significant shale gas and oil reserves coupled with favorable government policies. Europe is expected to witness a steady growth rate over the forecast period, driven by increasing demand for frac sand in unconventional oil and gas exploration activities. APAC is anticipated to emerge as a lucrative market, owing to the rising exploration and production activities in countries such as China and India.

    South America and MEA are expected to contribute a moderate share to the overall market growth.

    Frac Sand Market Regional Insights

    Source: Primary Research, Secondary Research, Market Research Future Database and Analyst Review

    Key Players and Competitive Insights

    Players in the Frac Sand Market Industry are continuously focusing on research and development processes to expand their product line and to find cost-effective solutions for market dominance. Leading players in the Frac Sand Market are also finding ways to gain margins through niche products and flexible solution offerings. The Frac Sand Market is segmented based on application types and geographical regions. Market development is driven by the adoption of hydraulic fracturing in oil and gas exploration and production. Hydraulic fracturing uses frac sand to prop open the fractures to allow the flow of oil and gas.

    APAC, North America, South America and MEA are the primary regions for the Frac Sand Market.

    The presence of both global and regional players characterizes the Frac Sand Market. U.S. Silica Holdings, Inc., CARBO Ceramics, Inc., Hi-Crush Partners LP and Superior Silica Sands, LLC are some of the key companies in the Frac Sand Market. Companies in the market are focused on expanding their presence globally and to increase their market share. U.S. Silica Holdings, Inc. is a leading competitor in the Frac Sand Market and is poised to be a successful firm for years to come. U.S.

    Silica Holdings, Inc. is a North American oil and gas company and is a leading producer of industrial minerals. The company sustainably produces fracking sand and creates clean and safe working environments. U.S. Silica has a global presence in North America, South America, Europe and Asia and is committed to high-quality products. U.S. Silica is also committed to safety and has made significant investments in the research and development process.

    CARBO Ceramics, Inc. is another leading player in the Frac Sand Market. The company specializes in the designing and selling of proppants, the company created the ceramic proppant technology and product in 1978. The company has a presence worldwide and developed fracture simulation software and other technologies. The company developed the technology known as Ceramic Proppant in 1978.

    Key Companies in the Frac Sand Market market include

    Industry Developments

    The frac sand market is projected to reach USD 11.2 billion by 2032, exhibiting a CAGR of 4.27% during the forecast period. Increasing drilling activities in unconventional oil and gas reservoirs, coupled with the growing demand for proppants in hydraulic fracturing operations, are primarily driving market growth. The rise in shale gas production in North America and the increasing adoption of multi-stage fracturing techniques are further propelling market expansion. Recent news developments in the market include: In January 2023, U.S. Silica Holdings Inc.

    announced plans to expand its frac sand production capacity in Texas to meet the growing demand from the Permian Basin. In February 2023, Smart Sand Inc. acquired Covia Holdings Corporation's frac sand business, creating one of the largest frac sand companies in North America. In March 2023, Hi-Crush Inc. reported a surge in frac sand demand from oil and gas producers in the United States. These developments indicate a positive outlook for the frac sand market, driven by the increasing demand for unconventional oil and gas production.

    Future Outlook

    Frac Sand Market Future Outlook

    The Global Frac Sand Market is projected to grow at a 4.39% CAGR from 2024 to 2035, driven by increasing demand for hydraulic fracturing and technological advancements in extraction processes.

    New opportunities lie in:

    • Invest in eco-friendly frac sand production technologies to meet sustainability demands.
    • Develop advanced logistics solutions to optimize sand delivery to remote drilling sites.
    • Explore strategic partnerships with oil and gas companies to secure long-term supply contracts.

    By 2035, the Frac Sand Market is expected to exhibit robust growth, reflecting evolving industry dynamics and increased resource extraction efficiency.

    Market Segmentation

    Frac Sand Market Grade Outlook

    • Hydraulic Fracturing
    • Foundry Casting
    • Abrasive Blasting
    • Glass Manufacturing
    • Sports and Recreation
    • Others

    Frac Sand Market Source Outlook

    • North America
    • Europe
    • South America
    • Asia Pacific
    • Middle East and Africa

    Frac Sand Market End User Outlook

    • Northern White Sand
    • Brown Sand
    • Jordan Sand
    • Ottawa Sand
    • Others

    Frac Sand Market Regional Outlook

    • North America
    • Europe
    • South America
    • Asia Pacific
    • Middle East and Africa

    Frac Sand Market Application Outlook

    • Oil and Gas Companies
    • Foundries
    • Construction Companies
    • Glass Manufacturers
    • Sports and Recreation Industries
    • Others

    Report Scope

    Report Attribute/Metric Details
    Market Size 2022 7.37 (USD Billion)
    Market Size 2023 7.68 (USD Billion)
    Market Size 2032 11.2 (USD Billion)
    Compound Annual Growth Rate (CAGR) 4.27% (2024 - 2032)
    Report Coverage Revenue Forecast, Competitive Landscape, Growth Factors, and Trends
    Base Year 2023
    Market Forecast Period 2024 - 2032
    Historical Data 2019 - 2023
    Market Forecast Units USD Billion
    Key Companies Profiled HiCrush Inc., Badger Mining Corporation, W.R. Grace and Co, Haakon Industries Inc., Proppant Express Logistics, LP, Superior Silica Sands LLC, Northern White Sand Company, Covia Holdings Corporation, Fairmount Santrol Holdings Inc., Smart Sand, Inc., U.S. Silica Holdings, Inc., EP Minerals, LLC, S Midstream, LLC, Preferred Sands LLC, CARBO Ceramics, Inc.
    Segments Covered Grade, Application, End User, Source, Regional
    Key Market Opportunities 1 Increasing demand for unconventional oil and gas production 2 Growing shale gas and tight oil reserves in North America 3 Expanding frac sand transportation infrastructure 4 Rising investments in oil and gas exploration and production 5 Government incentives for energy efficiency and decarbonization
    Key Market Dynamics Rising Oil and Gas Production Technological Advancements Increasing Environmental Concerns Growing Demand for Offshore Drilling Government Regulations
    Countries Covered North America, Europe, APAC, South America, MEA

    Market Highlights

    Author
    Chitranshi Jaiswal
    Research Analyst Level I

    In her 3 years of experience in the market research field, she has handled critical cross-domain projects. She has an in-depth knowledge of market estimation & analysis, problem-solving, primary as well as secondary research, and team management.She holds an engineering degree and is an MBA professional from a well-known university, capable of evaluating the market and competitive conditions. An exceptional strategist with excellent communication skills and a passion for delivering cutting-edge & practical insights for the market. Proficient in multi-tasking, and can successfully deal with competing demands, while maintaining complete confidentiality. Generated business through active client and project development, networking, and high-quality responses. Her knowledge and skills have helped in making solid business decisions, securing funding from investors, and avoiding business failures.

    Leave a Comment

    FAQs

    What is the current market size of the Global Frac Sand Market?

    The global frac sand market is expected to reach USD 7.68 billion in 2023, with an expected valuation of USD 11.2 billion by 2032, exhibiting a CAGR of 4.27% during the forecast period from 2024 to 2032.

    What are the key application areas of frac sand?

    Frac sand finds application in the hydraulic fracturing process used in oil and gas well development, primarily as a proppant to keep the fractures open and allow the flow of hydrocarbons.

    Which region is expected to dominate the Global Frac Sand Market in the coming years?

    North America is expected to dominate the global frac sand market during the forecast period, owing to the increasing oil and gas exploration and production activities in the region, particularly in the United States.

    Who are the key competitors in the Global Frac Sand Market?

    Key players in the global frac sand market include U.S. Silica Holdings, Inc., Hi-Crush Inc., Fairmount Santrol, Smart Sand, Inc., and Superior Silica Sands, among others.

    What are the growth drivers for the Global Frac Sand Market?

    Growing demand for oil and gas, increasing exploration and production activities, and technological advancements in hydraulic fracturing techniques are driving the growth of the global frac sand market.

    What are the challenges faced by the Global Frac Sand Market?

    Environmental concerns related to hydraulic fracturing, fluctuations in oil and gas prices, and competition from alternative proppants pose challenges to the growth of the global frac sand market.

    What are the expected trends in the Global Frac Sand Market?

    Increasing adoption of advanced drilling technologies, such as horizontal drilling and multi-stage fracturing, is a key trend shaping the global frac sand market.

    How is the Global Frac Sand Market segmented?

    The global frac sand market is segmented based on mesh size, end-use, and region. Major mesh sizes include 100 mesh, 40/70 mesh, 20/40 mesh, and others.

    What is the expected CAGR of the Global Frac Sand Market?

    The global frac sand market is expected to exhibit a CAGR of 4.27% from 2024 to 2032.

    What factors are influencing the growth of the Global Frac Sand Market?

    Rising energy demand, government initiatives promoting domestic oil and gas production, and advancements in drilling technologies are key factors driving the growth of the global frac sand market.

    1. ATABLE OF CONTENTS
    2. EXECUTIVE SUMMARY 
      1. Market Overview 
    3. Key Findings 
      1. Market Segmentation 
    4. Competitive Landscape 
      1. Challenges and Opportunities 
    5. Future Outlook 
    6. MARKET INTRODUCTION 
      1. Definition 
    7. Scope of the study 
      1. Research Objective 
    8. Assumption 
      1. Limitations 
    9. RESEARCH
    10. METHODOLOGY 
      1. Overview 
      2. Data Mining 
    11. Secondary Research 
      1. Primary Research 
    12. Primary Interviews and Information Gathering Process 
    13. Breakdown of Primary Respondents 
      1. Forecasting Model 
    14. Market Size Estimation 
      1. Bottom-Up Approach 
    15. Top-Down Approach 
      1. Data Triangulation 
    16. Validation 
    17. MARKET DYNAMICS 
      1. Overview 
      2. Drivers 
    18. Restraints 
      1. Opportunities 
    19. MARKET FACTOR ANALYSIS 
      1. Value chain Analysis 
    20. Porter's Five Forces Analysis 
      1. Bargaining Power of Suppliers 
    21. Bargaining Power of Buyers 
      1. Threat of New Entrants 
    22. Threat of Substitutes 
      1. Intensity of Rivalry 
    23. COVID-19 Impact Analysis 
      1. Market Impact Analysis 
    24. Regional Impact 
      1. Opportunity and Threat Analysis 
    25. FRAC SAND MARKET, BY GRADE (USD BILLION) 
      1. 100 Mesh 
    26. Mesh 
      1. 20/40 Mesh 
      2. 40/70 Mesh 
    27. /140 Mesh 
      1. Others 
    28. FRAC SAND MARKET,
    29. BY APPLICATION (USD BILLION) 
      1. Hydraulic Fracturing 
    30. Foundry Casting 
      1. Abrasive Blasting 
    31. Glass Manufacturing 
      1. Sports and Recreation 
    32. Others 
    33. FRAC SAND MARKET, BY END USER (USD BILLION) 
    34. Oil and Gas Companies 
      1. Foundries 
    35. Construction Companies 
      1. Glass Manufacturers 
    36. Sports and Recreation Industries 
      1. Others 
    37. FRAC SAND MARKET, BY SOURCE (USD BILLION) 
      1. Northern White
    38. Sand 
      1. Brown Sand 
      2. Jordan Sand 
    39. Ottawa Sand 
      1. Others 
    40. FRAC SAND MARKET,
    41. BY REGIONAL (USD BILLION) 
      1. North America 
    42. US 
      1. Canada 
      2. Europe 
    43. Germany 
      1. UK 
        1. France 
    44. Russia 
      1. Italy 
        1. Spain 
    45. Rest of Europe 
      1. APAC 
        1. China 
    46. India 
      1. Japan 
        1. South Korea 
    47. Malaysia 
      1. Thailand 
        1. Indonesia 
    48. Rest of APAC 
      1. South America 
    49. Brazil 
      1. Mexico 
        1. Argentina 
    50. Rest of South America 
      1. MEA 
    51. GCC Countries 
      1. South Africa 
    52. Rest of MEA 
    53. COMPETITIVE LANDSCAPE 
      1. Overview 
    54. Competitive Analysis 
      1. Market share Analysis 
    55. Major Growth Strategy in the Frac Sand Market 
      1. Competitive
    56. Benchmarking 
      1. Leading Players in Terms of Number of Developments
    57. in the Frac Sand Market 
      1. Key developments and growth strategies 
    58. New Product Launch/Service Deployment 
      1. Merger & Acquisitions 
    59. Joint Ventures 
      1. Major Players Financial Matrix 
    60. Sales and Operating Income 
      1. Major Players R&D Expenditure,
    61. COMPANY PROFILES 
      1. HiCrush
    62. Inc. 
      1. Financial Overview 
    63. Products Offered 
      1. Key Developments 
    64. SWOT Analysis 
      1. Key Strategies 
    65. Badger Mining Corporation 
      1. Financial Overview 
    66. Products Offered 
      1. Key Developments 
    67. SWOT Analysis 
      1. Key Strategies 
    68. W.R. Grace and Co 
      1. Financial Overview 
    69. Products Offered 
      1. Key Developments 
    70. SWOT Analysis 
      1. Key Strategies 
    71. Haakon Industries Inc 
      1. Financial Overview 
    72. Products Offered 
      1. Key Developments 
    73. SWOT Analysis 
      1. Key Strategies 
    74. Proppant Express Logistics, LP 
      1. Financial Overview 
    75. Products Offered 
      1. Key Developments 
    76. SWOT Analysis 
      1. Key Strategies 
    77. Superior Silica Sands LLC 
      1. Financial Overview 
    78. Products Offered 
      1. Key Developments 
    79. SWOT Analysis 
      1. Key Strategies 
    80. Northern White Sand Company 
      1. Financial Overview 
    81. Products Offered 
      1. Key Developments 
    82. SWOT Analysis 
      1. Key Strategies 
    83. Covia Holdings Corporation 
      1. Financial Overview 
    84. Products Offered 
      1. Key Developments 
    85. SWOT Analysis 
      1. Key Strategies 
    86. Fairmount Santrol Holdings Inc. 
      1. Financial Overview 
    87. Products Offered 
      1. Key Developments 
    88. SWOT Analysis 
      1. Key Strategies 
    89. Smart Sand, Inc. 
      1. Financial Overview 
    90. Products Offered 
      1. Key Developments 
    91. SWOT Analysis 
      1. Key Strategies 
    92. U.S. Silica Holdings, Inc. 
      1. Financial Overview 
    93. Products Offered 
      1. Key Developments 
    94. SWOT Analysis 
      1. Key Strategies 
    95. EP Minerals, LLC 
      1. Financial Overview 
    96. Products Offered 
      1. Key Developments 
    97. SWOT Analysis 
      1. Key Strategies 
    98. S Midstream, LLC 
      1. Financial Overview 
    99. Products Offered 
      1. Key Developments 
    100. SWOT Analysis 
      1. Key Strategies 
    101. Preferred Sands LLC 
      1. Financial Overview 
    102. Products Offered 
      1. Key Developments 
    103. SWOT Analysis 
      1. Key Strategies 
    104. CARBO Ceramics, Inc 
      1. Financial Overview 
    105. Products Offered 
      1. Key Developments 
    106. SWOT Analysis 
      1. Key Strategies 
      2. References 
      3. Related
    107. Reports 
    108. LIST OF ASSUMPTIONS 
    109. SIZE ESTIMATES & FORECAST, BY GRADE, 2019-2032 (USD BILLIONS) 
    110. NORTH AMERICA FRAC SAND MARKET SIZE ESTIMATES & FORECAST, BY APPLICATION,
    111. 2032 (USD BILLIONS) 
    112. SIZE ESTIMATES & FORECAST, BY END USER, 2019-2032 (USD BILLIONS) 
    113. NORTH AMERICA FRAC SAND MARKET SIZE ESTIMATES & FORECAST, BY SOURCE, 2019-2032
    114. (USD BILLIONS) 
    115. ESTIMATES & FORECAST, BY REGIONAL, 2019-2032 (USD BILLIONS) 
    116. US FRAC SAND MARKET SIZE ESTIMATES & FORECAST, BY GRADE, 2019-2032 (USD BILLIONS) 
    117. US FRAC SAND MARKET SIZE ESTIMATES & FORECAST, BY APPLICATION, 2019-2032
    118. (USD BILLIONS) 
    119. FORECAST, BY END USER, 2019-2032 (USD BILLIONS) 
    120. FRAC SAND MARKET SIZE ESTIMATES & FORECAST, BY SOURCE, 2019-2032 (USD BILLIONS) 
    121. US FRAC SAND MARKET SIZE ESTIMATES & FORECAST, BY REGIONAL, 2019-2032 (USD
    122. BILLIONS) 
    123. FORECAST, BY GRADE, 2019-2032 (USD BILLIONS) 
    124. FRAC SAND MARKET SIZE ESTIMATES & FORECAST, BY APPLICATION, 2019-2032 (USD BILLIONS) 
    125. CANADA FRAC SAND MARKET SIZE ESTIMATES & FORECAST, BY END USER, 2019-2032
    126. (USD BILLIONS) 
    127. & FORECAST, BY SOURCE, 2019-2032 (USD BILLIONS) 
    128. CANADA FRAC SAND MARKET SIZE ESTIMATES & FORECAST, BY REGIONAL, 2019-2032 (USD
    129. BILLIONS) 
    130. FORECAST, BY GRADE, 2019-2032 (USD BILLIONS) 
    131. FRAC SAND MARKET SIZE ESTIMATES & FORECAST, BY APPLICATION, 2019-2032 (USD BILLIONS) 
    132. EUROPE FRAC SAND MARKET SIZE ESTIMATES & FORECAST, BY END USER, 2019-2032
    133. (USD BILLIONS) 
    134. & FORECAST, BY SOURCE, 2019-2032 (USD BILLIONS) 
    135. EUROPE FRAC SAND MARKET SIZE ESTIMATES & FORECAST, BY REGIONAL, 2019-2032 (USD
    136. BILLIONS) 
    137. & FORECAST, BY GRADE, 2019-2032 (USD BILLIONS) 
    138. GERMANY FRAC SAND MARKET SIZE ESTIMATES & FORECAST, BY APPLICATION, 2019-2032
    139. (USD BILLIONS) 
    140. & FORECAST, BY END USER, 2019-2032 (USD BILLIONS) 
    141. GERMANY FRAC SAND MARKET SIZE ESTIMATES & FORECAST, BY SOURCE, 2019-2032
    142. (USD BILLIONS) 
    143. & FORECAST, BY REGIONAL, 2019-2032 (USD BILLIONS) 
    144. UK FRAC SAND MARKET SIZE ESTIMATES & FORECAST, BY GRADE, 2019-2032 (USD
    145. BILLIONS) 
    146. FORECAST, BY APPLICATION, 2019-2032 (USD BILLIONS) 
    147. UK FRAC SAND MARKET SIZE ESTIMATES & FORECAST, BY END USER, 2019-2032 (USD BILLIONS) 
    148. UK FRAC SAND MARKET SIZE ESTIMATES & FORECAST, BY SOURCE, 2019-2032 (USD
    149. BILLIONS) 
    150. FORECAST, BY REGIONAL, 2019-2032 (USD BILLIONS) 
    151. FRAC SAND MARKET SIZE ESTIMATES & FORECAST, BY GRADE, 2019-2032 (USD BILLIONS) 
    152. FRANCE FRAC SAND MARKET SIZE ESTIMATES & FORECAST, BY APPLICATION, 2019-2032
    153. (USD BILLIONS) 
    154. & FORECAST, BY END USER, 2019-2032 (USD BILLIONS) 
    155. FRANCE FRAC SAND MARKET SIZE ESTIMATES & FORECAST, BY SOURCE, 2019-2032
    156. (USD BILLIONS) 
    157. & FORECAST, BY REGIONAL, 2019-2032 (USD BILLIONS) 
    158. RUSSIA FRAC SAND MARKET SIZE ESTIMATES & FORECAST, BY GRADE, 2019-2032 (USD
    159. BILLIONS) 
    160. FORECAST, BY APPLICATION, 2019-2032 (USD BILLIONS) 
    161. RUSSIA FRAC SAND MARKET SIZE ESTIMATES & FORECAST, BY END USER, 2019-2032 (USD
    162. BILLIONS) 
    163. FORECAST, BY SOURCE, 2019-2032 (USD BILLIONS) 
    164. FRAC SAND MARKET SIZE ESTIMATES & FORECAST, BY REGIONAL, 2019-2032 (USD BILLIONS) 
    165. ITALY FRAC SAND MARKET SIZE ESTIMATES & FORECAST, BY GRADE, 2019-2032 (USD
    166. BILLIONS) 
    167. FORECAST, BY APPLICATION, 2019-2032 (USD BILLIONS) 
    168. ITALY FRAC SAND MARKET SIZE ESTIMATES & FORECAST, BY END USER, 2019-2032 (USD
    169. BILLIONS) 
    170. FORECAST, BY SOURCE, 2019-2032 (USD BILLIONS) 
    171. FRAC SAND MARKET SIZE ESTIMATES & FORECAST, BY REGIONAL, 2019-2032 (USD BILLIONS) 
    172. SPAIN FRAC SAND MARKET SIZE ESTIMATES & FORECAST, BY GRADE, 2019-2032 (USD
    173. BILLIONS) 
    174. FORECAST, BY APPLICATION, 2019-2032 (USD BILLIONS) 
    175. SPAIN FRAC SAND MARKET SIZE ESTIMATES & FORECAST, BY END USER, 2019-2032 (USD
    176. BILLIONS) 
    177. FORECAST, BY SOURCE, 2019-2032 (USD BILLIONS) 
    178. FRAC SAND MARKET SIZE ESTIMATES & FORECAST, BY REGIONAL, 2019-2032 (USD BILLIONS) 
    179. REST OF EUROPE FRAC SAND MARKET SIZE ESTIMATES & FORECAST, BY GRADE, 2019-2032
    180. (USD BILLIONS) 
    181. ESTIMATES & FORECAST, BY APPLICATION, 2019-2032 (USD BILLIONS) 
    182. REST OF EUROPE FRAC SAND MARKET SIZE ESTIMATES & FORECAST, BY END USER,
    183. 2032 (USD BILLIONS) 
    184. MARKET SIZE ESTIMATES & FORECAST, BY SOURCE, 2019-2032 (USD BILLIONS) 
    185. REST OF EUROPE FRAC SAND MARKET SIZE ESTIMATES & FORECAST, BY REGIONAL,
    186. 2032 (USD BILLIONS) 
    187. ESTIMATES & FORECAST, BY GRADE, 2019-2032 (USD BILLIONS) 
    188. APAC FRAC SAND MARKET SIZE ESTIMATES & FORECAST, BY APPLICATION, 2019-2032
    189. (USD BILLIONS) 
    190. & FORECAST, BY END USER, 2019-2032 (USD BILLIONS) 
    191. APAC FRAC SAND MARKET SIZE ESTIMATES & FORECAST, BY SOURCE, 2019-2032 (USD
    192. BILLIONS) 
    193. FORECAST, BY REGIONAL, 2019-2032 (USD BILLIONS) 
    194. FRAC SAND MARKET SIZE ESTIMATES & FORECAST, BY GRADE, 2019-2032 (USD BILLIONS) 
    195. CHINA FRAC SAND MARKET SIZE ESTIMATES & FORECAST, BY APPLICATION, 2019-2032
    196. (USD BILLIONS) 
    197. & FORECAST, BY END USER, 2019-2032 (USD BILLIONS) 
    198. CHINA FRAC SAND MARKET SIZE ESTIMATES & FORECAST, BY SOURCE, 2019-2032 (USD
    199. BILLIONS) 
    200. FORECAST, BY REGIONAL, 2019-2032 (USD BILLIONS) 
    201. FRAC SAND MARKET SIZE ESTIMATES & FORECAST, BY GRADE, 2019-2032 (USD BILLIONS) 
    202. INDIA FRAC SAND MARKET SIZE ESTIMATES & FORECAST, BY APPLICATION, 2019-2032
    203. (USD BILLIONS) 
    204. & FORECAST, BY END USER, 2019-2032 (USD BILLIONS) 
    205. INDIA FRAC SAND MARKET SIZE ESTIMATES & FORECAST, BY SOURCE, 2019-2032 (USD
    206. BILLIONS) 
    207. FORECAST, BY REGIONAL, 2019-2032 (USD BILLIONS) 
    208. FRAC SAND MARKET SIZE ESTIMATES & FORECAST, BY GRADE, 2019-2032 (USD BILLIONS) 
    209. JAPAN FRAC SAND MARKET SIZE ESTIMATES & FORECAST, BY APPLICATION, 2019-2032
    210. (USD BILLIONS) 
    211. & FORECAST, BY END USER, 2019-2032 (USD BILLIONS) 
    212. JAPAN FRAC SAND MARKET SIZE ESTIMATES & FORECAST, BY SOURCE, 2019-2032 (USD
    213. BILLIONS) 
    214. FORECAST, BY REGIONAL, 2019-2032 (USD BILLIONS) 
    215. KOREA FRAC SAND MARKET SIZE ESTIMATES & FORECAST, BY GRADE, 2019-2032 (USD BILLIONS) 
    216. SOUTH KOREA FRAC SAND MARKET SIZE ESTIMATES & FORECAST, BY APPLICATION,
    217. 2032 (USD BILLIONS) 
    218. SIZE ESTIMATES & FORECAST, BY END USER, 2019-2032 (USD BILLIONS) 
    219. SOUTH KOREA FRAC SAND MARKET SIZE ESTIMATES & FORECAST, BY SOURCE, 2019-2032
    220. (USD BILLIONS) 
    221. & FORECAST, BY REGIONAL, 2019-2032 (USD BILLIONS) 
    222. MALAYSIA FRAC SAND MARKET SIZE ESTIMATES & FORECAST, BY GRADE, 2019-2032
    223. (USD BILLIONS) 
    224. & FORECAST, BY APPLICATION, 2019-2032 (USD BILLIONS) 
    225. MALAYSIA FRAC SAND MARKET SIZE ESTIMATES & FORECAST, BY END USER, 2019-2032
    226. (USD BILLIONS) 
    227. & FORECAST, BY SOURCE, 2019-2032 (USD BILLIONS) 
    228. MALAYSIA FRAC SAND MARKET SIZE ESTIMATES & FORECAST, BY REGIONAL, 2019-2032
    229. (USD BILLIONS) 
    230. & FORECAST, BY GRADE, 2019-2032 (USD BILLIONS) 
    231. THAILAND FRAC SAND MARKET SIZE ESTIMATES & FORECAST, BY APPLICATION, 2019-2032
    232. (USD BILLIONS) 
    233. & FORECAST, BY END USER, 2019-2032 (USD BILLIONS) 
    234. THAILAND FRAC SAND MARKET SIZE ESTIMATES & FORECAST, BY SOURCE, 2019-2032
    235. (USD BILLIONS) 
    236. & FORECAST, BY REGIONAL, 2019-2032 (USD BILLIONS) 
    237. INDONESIA FRAC SAND MARKET SIZE ESTIMATES & FORECAST, BY GRADE, 2019-2032
    238. (USD BILLIONS) 
    239. & FORECAST, BY APPLICATION, 2019-2032 (USD BILLIONS) 
    240. INDONESIA FRAC SAND MARKET SIZE ESTIMATES & FORECAST, BY END USER, 2019-2032
    241. (USD BILLIONS) 
    242. & FORECAST, BY SOURCE, 2019-2032 (USD BILLIONS) 
    243. INDONESIA FRAC SAND MARKET SIZE ESTIMATES & FORECAST, BY REGIONAL, 2019-2032
    244. (USD BILLIONS) 
    245. ESTIMATES & FORECAST, BY GRADE, 2019-2032 (USD BILLIONS) 
    246. REST OF APAC FRAC SAND MARKET SIZE ESTIMATES & FORECAST, BY APPLICATION,
    247. 2032 (USD BILLIONS) 
    248. SIZE ESTIMATES & FORECAST, BY END USER, 2019-2032 (USD BILLIONS) 
    249. REST OF APAC FRAC SAND MARKET SIZE ESTIMATES & FORECAST, BY SOURCE, 2019-2032
    250. (USD BILLIONS) 
    251. ESTIMATES & FORECAST, BY REGIONAL, 2019-2032 (USD BILLIONS) 
    252. SOUTH AMERICA FRAC SAND MARKET SIZE ESTIMATES & FORECAST, BY GRADE, 2019-2032
    253. (USD BILLIONS) 
    254. ESTIMATES & FORECAST, BY APPLICATION, 2019-2032 (USD BILLIONS) 
    255. SOUTH AMERICA FRAC SAND MARKET SIZE ESTIMATES & FORECAST, BY END USER,
    256. 2032 (USD BILLIONS) 
    257. MARKET SIZE ESTIMATES & FORECAST, BY SOURCE, 2019-2032 (USD BILLIONS) 
    258. SOUTH AMERICA FRAC SAND MARKET SIZE ESTIMATES & FORECAST, BY REGIONAL,
    259. 2032 (USD BILLIONS) 
    260. SIZE ESTIMATES & FORECAST, BY GRADE, 2019-2032 (USD BILLIONS) 
    261. BRAZIL FRAC SAND MARKET SIZE ESTIMATES & FORECAST, BY APPLICATION, 2019-2032
    262. (USD BILLIONS) 
    263. & FORECAST, BY END USER, 2019-2032 (USD BILLIONS) 
    264. BRAZIL FRAC SAND MARKET SIZE ESTIMATES & FORECAST, BY SOURCE, 2019-2032
    265. (USD BILLIONS) 
    266. & FORECAST, BY REGIONAL, 2019-2032 (USD BILLIONS) 
    267. MEXICO FRAC SAND MARKET SIZE ESTIMATES & FORECAST, BY GRADE, 2019-2032
    268. (USD BILLIONS) 
    269. & FORECAST, BY APPLICATION, 2019-2032 (USD BILLIONS) 
    270. MEXICO FRAC SAND MARKET SIZE ESTIMATES & FORECAST, BY END USER, 2019-2032
    271. (USD BILLIONS) 
    272. & FORECAST, BY SOURCE, 2019-2032 (USD BILLIONS) 
    273. MEXICO FRAC SAND MARKET SIZE ESTIMATES & FORECAST, BY REGIONAL, 2019-2032 (USD
    274. BILLIONS) 
    275. & FORECAST, BY GRADE, 2019-2032 (USD BILLIONS) 
    276. ARGENTINA FRAC SAND MARKET SIZE ESTIMATES & FORECAST, BY APPLICATION, 2019-2032
    277. (USD BILLIONS) 
    278. & FORECAST, BY END USER, 2019-2032 (USD BILLIONS) 
    279. ARGENTINA FRAC SAND MARKET SIZE ESTIMATES & FORECAST, BY SOURCE, 2019-2032
    280. (USD BILLIONS) 
    281. & FORECAST, BY REGIONAL, 2019-2032 (USD BILLIONS) 
    282. REST OF SOUTH AMERICA FRAC SAND MARKET SIZE ESTIMATES & FORECAST, BY GRADE,
    283. 2032 (USD BILLIONS) 
    284. SAND MARKET SIZE ESTIMATES & FORECAST, BY APPLICATION, 2019-2032 (USD BILLIONS) 
    285. REST OF SOUTH AMERICA FRAC SAND MARKET SIZE ESTIMATES & FORECAST, BY END
    286. USER, 2019-2032 (USD BILLIONS) 
    287. FRAC SAND MARKET SIZE ESTIMATES & FORECAST, BY SOURCE, 2019-2032 (USD BILLIONS) 
    288. REST OF SOUTH AMERICA FRAC SAND MARKET SIZE ESTIMATES & FORECAST, BY REGIONAL,
    289. 2032 (USD BILLIONS) 
    290. ESTIMATES & FORECAST, BY GRADE, 2019-2032 (USD BILLIONS) 
    291. MEA FRAC SAND MARKET SIZE ESTIMATES & FORECAST, BY APPLICATION, 2019-2032
    292. (USD BILLIONS) 
    293. & FORECAST, BY END USER, 2019-2032 (USD BILLIONS) 
    294. MEA FRAC SAND MARKET SIZE ESTIMATES & FORECAST, BY SOURCE, 2019-2032 (USD
    295. BILLIONS) 
    296. FORECAST, BY REGIONAL, 2019-2032 (USD BILLIONS) 
    297. COUNTRIES FRAC SAND MARKET SIZE ESTIMATES & FORECAST, BY GRADE, 2019-2032 (USD
    298. BILLIONS) 
    299. & FORECAST, BY APPLICATION, 2019-2032 (USD BILLIONS) 
    300. GCC COUNTRIES FRAC SAND MARKET SIZE ESTIMATES & FORECAST, BY END USER,
    301. 2032 (USD BILLIONS) 
    302. MARKET SIZE ESTIMATES & FORECAST, BY SOURCE, 2019-2032 (USD BILLIONS) 
    303. GCC COUNTRIES FRAC SAND MARKET SIZE ESTIMATES & FORECAST, BY REGIONAL,
    304. 2032 (USD BILLIONS) 
    305. SIZE ESTIMATES & FORECAST, BY GRADE, 2019-2032 (USD BILLIONS) 
    306. SOUTH AFRICA FRAC SAND MARKET SIZE ESTIMATES & FORECAST, BY APPLICATION,
    307. 2032 (USD BILLIONS) 
    308. SIZE ESTIMATES & FORECAST, BY END USER, 2019-2032 (USD BILLIONS) 
    309. SOUTH AFRICA FRAC SAND MARKET SIZE ESTIMATES & FORECAST, BY SOURCE, 2019-2032
    310. (USD BILLIONS) 
    311. ESTIMATES & FORECAST, BY REGIONAL, 2019-2032 (USD BILLIONS) 
    312. REST OF MEA FRAC SAND MARKET SIZE ESTIMATES & FORECAST, BY GRADE, 2019-2032
    313. (USD BILLIONS) 
    314. ESTIMATES & FORECAST, BY APPLICATION, 2019-2032 (USD BILLIONS) 
    315. REST OF MEA FRAC SAND MARKET SIZE ESTIMATES & FORECAST, BY END USER, 2019-2032
    316. (USD BILLIONS) 
    317. ESTIMATES & FORECAST, BY SOURCE, 2019-2032 (USD BILLIONS) 
    318. REST OF MEA FRAC SAND MARKET SIZE ESTIMATES & FORECAST, BY REGIONAL, 2019-2032
    319. (USD BILLIONS) 
    320. ACQUISITION/PARTNERSHIP 
    321. LIST
    322. OF FIGURES
    323. NORTH AMERICA FRAC SAND MARKET ANALYSIS 
    324. SAND MARKET ANALYSIS BY GRADE 
    325. ANALYSIS BY APPLICATION 
    326. BY END USER 
    327. US FRAC SAND MARKET ANALYSIS BY REGIONAL 
    328. FRAC SAND MARKET ANALYSIS BY GRADE 
    329. MARKET ANALYSIS BY APPLICATION 
    330. ANALYSIS BY END USER 
    331. BY SOURCE 
    332. EUROPE FRAC SAND MARKET ANALYSIS 
    333. SAND MARKET ANALYSIS BY GRADE 
    334. ANALYSIS BY APPLICATION 
    335. ANALYSIS BY END USER 
    336. BY SOURCE 
    337. UK FRAC SAND MARKET ANALYSIS BY GRADE 
    338. SAND MARKET ANALYSIS BY APPLICATION 
    339. MARKET ANALYSIS BY END USER 
    340. BY SOURCE 
    341. FRANCE FRAC SAND MARKET ANALYSIS BY GRADE 
    342. FRAC SAND MARKET ANALYSIS BY APPLICATION 
    343. SAND MARKET ANALYSIS BY END USER 
    344. MARKET ANALYSIS BY SOURCE 
    345. ANALYSIS BY REGIONAL 
    346. BY GRADE 
    347. RUSSIA FRAC SAND MARKET ANALYSIS BY END USER 
    348. RUSSIA FRAC SAND MARKET ANALYSIS BY SOURCE 
    349. FRAC SAND MARKET ANALYSIS BY REGIONAL 
    350. SAND MARKET ANALYSIS BY GRADE 
    351. ANALYSIS BY APPLICATION 
    352. BY END USER 
    353. ITALY FRAC SAND MARKET ANALYSIS BY REGIONAL 
    354. FRAC SAND MARKET ANALYSIS BY GRADE 
    355. MARKET ANALYSIS BY APPLICATION 
    356. ANALYSIS BY END USER 
    357. BY SOURCE 
    358. REST OF EUROPE FRAC SAND MARKET ANALYSIS BY GRADE 
    359. REST OF EUROPE FRAC SAND MARKET ANALYSIS BY APPLICATION 
    360. REST OF EUROPE FRAC SAND MARKET ANALYSIS BY END USER 
    361. REST OF EUROPE FRAC SAND MARKET ANALYSIS BY SOURCE 
    362. REST OF EUROPE FRAC SAND MARKET ANALYSIS BY REGIONAL 
    363. APAC FRAC SAND MARKET ANALYSIS 
    364. MARKET ANALYSIS BY GRADE 
    365. BY APPLICATION 
    366. END USER 
    367. CHINA FRAC SAND MARKET ANALYSIS BY REGIONAL 
    368. FRAC SAND MARKET ANALYSIS BY GRADE 
    369. MARKET ANALYSIS BY APPLICATION 
    370. ANALYSIS BY END USER 
    371. BY SOURCE 
    372. JAPAN FRAC SAND MARKET ANALYSIS BY GRADE 
    373. FRAC SAND MARKET ANALYSIS BY APPLICATION 
    374. SAND MARKET ANALYSIS BY END USER 
    375. MARKET ANALYSIS BY SOURCE 
    376. ANALYSIS BY REGIONAL 
    377. ANALYSIS BY GRADE 
    378. BY APPLICATION 
    379. BY END USER 
    380. BY SOURCE 
    381. REGIONAL 
    382. MALAYSIA FRAC SAND MARKET ANALYSIS BY APPLICATION 
    383. MALAYSIA FRAC SAND MARKET ANALYSIS BY END USER 
    384. MALAYSIA FRAC SAND MARKET ANALYSIS BY SOURCE 
    385. FRAC SAND MARKET ANALYSIS BY REGIONAL 
    386. SAND MARKET ANALYSIS BY GRADE 
    387. MARKET ANALYSIS BY APPLICATION 
    388. MARKET ANALYSIS BY END USER 
    389. ANALYSIS BY SOURCE 
    390. BY REGIONAL 
    391. GRADE 
    392. INDONESIA FRAC SAND MARKET ANALYSIS BY END USER 
    393. INDONESIA FRAC SAND MARKET ANALYSIS BY SOURCE 
    394. FRAC SAND MARKET ANALYSIS BY REGIONAL 
    395. FRAC SAND MARKET ANALYSIS BY GRADE 
    396. SAND MARKET ANALYSIS BY APPLICATION 
    397. FRAC SAND MARKET ANALYSIS BY END USER 
    398. FRAC SAND MARKET ANALYSIS BY SOURCE 
    399. FRAC SAND MARKET ANALYSIS BY REGIONAL 
    400. FRAC SAND MARKET ANALYSIS 
    401. ANALYSIS BY GRADE 
    402. BY APPLICATION 
    403. END USER 
    404. BRAZIL FRAC SAND MARKET ANALYSIS BY REGIONAL 
    405. MEXICO FRAC SAND MARKET ANALYSIS BY GRADE 
    406. FRAC SAND MARKET ANALYSIS BY APPLICATION 
    407. SAND MARKET ANALYSIS BY END USER 
    408. MARKET ANALYSIS BY SOURCE 
    409. ANALYSIS BY REGIONAL 
    410. ANALYSIS BY GRADE 
    411. BY APPLICATION 
    412. BY END USER 
    413. BY SOURCE 
    414. REGIONAL 
    415. ANALYSIS BY GRADE 
    416. MARKET ANALYSIS BY APPLICATION 
    417. FRAC SAND MARKET ANALYSIS BY END USER 
    418. AMERICA FRAC SAND MARKET ANALYSIS BY SOURCE 
    419. OF SOUTH AMERICA FRAC SAND MARKET ANALYSIS BY REGIONAL 
    420. MEA FRAC SAND MARKET ANALYSIS 
    421. FRAC SAND MARKET ANALYSIS BY GRADE 
    422. FRAC SAND MARKET ANALYSIS BY APPLICATION 
    423. FRAC SAND MARKET ANALYSIS BY END USER 
    424. FRAC SAND MARKET ANALYSIS BY SOURCE 
    425. FRAC SAND MARKET ANALYSIS BY REGIONAL 
    426. FRAC SAND MARKET ANALYSIS BY GRADE 
    427. FRAC SAND MARKET ANALYSIS BY APPLICATION 
    428. FRAC SAND MARKET ANALYSIS BY END USER 
    429. FRAC SAND MARKET ANALYSIS BY SOURCE 
    430. FRAC SAND MARKET ANALYSIS BY REGIONAL 
    431. FRAC SAND MARKET ANALYSIS BY GRADE 
    432. SAND MARKET ANALYSIS BY APPLICATION 
    433. FRAC SAND MARKET ANALYSIS BY END USER 
    434. FRAC SAND MARKET ANALYSIS BY SOURCE 
    435. FRAC SAND MARKET ANALYSIS BY REGIONAL 
    436. CRITERIA OF FRAC SAND MARKET 
    437. MRFR 
    438. DRIVERS IMPACT ANALYSIS: FRAC SAND MARKET 
    439. IMPACT ANALYSIS: FRAC SAND MARKET 
    440. CHAIN: FRAC SAND MARKET 
    441. (% SHARE) 
    442. TO 2032 (USD Billions) 
    443. (% SHARE) 
    444. TO 2032 (USD Billions) 
    445. END USER, 2024 (% SHARE) 
    446. USER, 2019 TO 2032 (USD Billions) 
    447. BY SOURCE, 2024 (% SHARE) 
    448. TO 2032 (USD Billions) 
    449. REGIONAL, 2024 (% SHARE) 
    450. TO 2032 (USD Billions) 
    451. COMPETITORS 

    Frac Sand Market Segmentation

    • Frac Sand Market By Grade (USD Billion, 2019-2032)

      • 100 Mesh
      • 140 Mesh
      • 20/40 Mesh
      • 40/70 Mesh
      • 70/140 Mesh
      • Others
    • Frac Sand Market By Application (USD Billion, 2019-2032)

      • Hydraulic Fracturing
      • Foundry Casting
      • Abrasive Blasting
      • Glass Manufacturing
      • Sports and Recreation
      • Others
    • Frac Sand Market By End User (USD Billion, 2019-2032)

      • Oil and Gas Companies
      • Foundries
      • Construction Companies
      • Glass Manufacturers
      • Sports and Recreation Industries
      • Others
    • Frac Sand Market By Source (USD Billion, 2019-2032)

      • Northern White Sand
      • Brown Sand
      • Jordan Sand
      • Ottawa Sand
      • Others
    • Frac Sand Market By Regional (USD Billion, 2019-2032)

      • North America
      • Europe
      • South America
      • Asia Pacific
      • Middle East and Africa

    Frac Sand Market Regional Outlook (USD Billion, 2019-2032)

    • North America Outlook (USD Billion, 2019-2032)

      • North America Frac Sand Market by Grade Type

        • 100 Mesh
        • 140 Mesh
        • 20/40 Mesh
        • 40/70 Mesh
        • 70/140 Mesh
        • Others
      • North America Frac Sand Market by Application Type

        • Hydraulic Fracturing
        • Foundry Casting
        • Abrasive Blasting
        • Glass Manufacturing
        • Sports and Recreation
        • Others
      • North America Frac Sand Market by End User Type

        • Oil and Gas Companies
        • Foundries
        • Construction Companies
        • Glass Manufacturers
        • Sports and Recreation Industries
        • Others
      • North America Frac Sand Market by Source Type

        • Northern White Sand
        • Brown Sand
        • Jordan Sand
        • Ottawa Sand
        • Others
      • North America Frac Sand Market by Regional Type

        • US
        • Canada
      • US Outlook (USD Billion, 2019-2032)
      • US Frac Sand Market by Grade Type

        • 100 Mesh
        • 140 Mesh
        • 20/40 Mesh
        • 40/70 Mesh
        • 70/140 Mesh
        • Others
      • US Frac Sand Market by Application Type

        • Hydraulic Fracturing
        • Foundry Casting
        • Abrasive Blasting
        • Glass Manufacturing
        • Sports and Recreation
        • Others
      • US Frac Sand Market by End User Type

        • Oil and Gas Companies
        • Foundries
        • Construction Companies
        • Glass Manufacturers
        • Sports and Recreation Industries
        • Others
      • US Frac Sand Market by Source Type

        • Northern White Sand
        • Brown Sand
        • Jordan Sand
        • Ottawa Sand
        • Others
      • CANADA Outlook (USD Billion, 2019-2032)
      • CANADA Frac Sand Market by Grade Type

        • 100 Mesh
        • 140 Mesh
        • 20/40 Mesh
        • 40/70 Mesh
        • 70/140 Mesh
        • Others
      • CANADA Frac Sand Market by Application Type

        • Hydraulic Fracturing
        • Foundry Casting
        • Abrasive Blasting
        • Glass Manufacturing
        • Sports and Recreation
        • Others
      • CANADA Frac Sand Market by End User Type

        • Oil and Gas Companies
        • Foundries
        • Construction Companies
        • Glass Manufacturers
        • Sports and Recreation Industries
        • Others
      • CANADA Frac Sand Market by Source Type

        • Northern White Sand
        • Brown Sand
        • Jordan Sand
        • Ottawa Sand
        • Others
    • Europe Outlook (USD Billion, 2019-2032)

      • Europe Frac Sand Market by Grade Type

        • 100 Mesh
        • 140 Mesh
        • 20/40 Mesh
        • 40/70 Mesh
        • 70/140 Mesh
        • Others
      • Europe Frac Sand Market by Application Type

        • Hydraulic Fracturing
        • Foundry Casting
        • Abrasive Blasting
        • Glass Manufacturing
        • Sports and Recreation
        • Others
      • Europe Frac Sand Market by End User Type

        • Oil and Gas Companies
        • Foundries
        • Construction Companies
        • Glass Manufacturers
        • Sports and Recreation Industries
        • Others
      • Europe Frac Sand Market by Source Type

        • Northern White Sand
        • Brown Sand
        • Jordan Sand
        • Ottawa Sand
        • Others
      • Europe Frac Sand Market by Regional Type

        • Germany
        • UK
        • France
        • Russia
        • Italy
        • Spain
        • Rest of Europe
      • GERMANY Outlook (USD Billion, 2019-2032)
      • GERMANY Frac Sand Market by Grade Type

        • 100 Mesh
        • 140 Mesh
        • 20/40 Mesh
        • 40/70 Mesh
        • 70/140 Mesh
        • Others
      • GERMANY Frac Sand Market by Application Type

        • Hydraulic Fracturing
        • Foundry Casting
        • Abrasive Blasting
        • Glass Manufacturing
        • Sports and Recreation
        • Others
      • GERMANY Frac Sand Market by End User Type

        • Oil and Gas Companies
        • Foundries
        • Construction Companies
        • Glass Manufacturers
        • Sports and Recreation Industries
        • Others
      • GERMANY Frac Sand Market by Source Type

        • Northern White Sand
        • Brown Sand
        • Jordan Sand
        • Ottawa Sand
        • Others
      • UK Outlook (USD Billion, 2019-2032)
      • UK Frac Sand Market by Grade Type

        • 100 Mesh
        • 140 Mesh
        • 20/40 Mesh
        • 40/70 Mesh
        • 70/140 Mesh
        • Others
      • UK Frac Sand Market by Application Type

        • Hydraulic Fracturing
        • Foundry Casting
        • Abrasive Blasting
        • Glass Manufacturing
        • Sports and Recreation
        • Others
      • UK Frac Sand Market by End User Type

        • Oil and Gas Companies
        • Foundries
        • Construction Companies
        • Glass Manufacturers
        • Sports and Recreation Industries
        • Others
      • UK Frac Sand Market by Source Type

        • Northern White Sand
        • Brown Sand
        • Jordan Sand
        • Ottawa Sand
        • Others
      • FRANCE Outlook (USD Billion, 2019-2032)
      • FRANCE Frac Sand Market by Grade Type

        • 100 Mesh
        • 140 Mesh
        • 20/40 Mesh
        • 40/70 Mesh
        • 70/140 Mesh
        • Others
      • FRANCE Frac Sand Market by Application Type

        • Hydraulic Fracturing
        • Foundry Casting
        • Abrasive Blasting
        • Glass Manufacturing
        • Sports and Recreation
        • Others
      • FRANCE Frac Sand Market by End User Type

        • Oil and Gas Companies
        • Foundries
        • Construction Companies
        • Glass Manufacturers
        • Sports and Recreation Industries
        • Others
      • FRANCE Frac Sand Market by Source Type

        • Northern White Sand
        • Brown Sand
        • Jordan Sand
        • Ottawa Sand
        • Others
      • RUSSIA Outlook (USD Billion, 2019-2032)
      • RUSSIA Frac Sand Market by Grade Type

        • 100 Mesh
        • 140 Mesh
        • 20/40 Mesh
        • 40/70 Mesh
        • 70/140 Mesh
        • Others
      • RUSSIA Frac Sand Market by Application Type

        • Hydraulic Fracturing
        • Foundry Casting
        • Abrasive Blasting
        • Glass Manufacturing
        • Sports and Recreation
        • Others
      • RUSSIA Frac Sand Market by End User Type

        • Oil and Gas Companies
        • Foundries
        • Construction Companies
        • Glass Manufacturers
        • Sports and Recreation Industries
        • Others
      • RUSSIA Frac Sand Market by Source Type

        • Northern White Sand
        • Brown Sand
        • Jordan Sand
        • Ottawa Sand
        • Others
      • ITALY Outlook (USD Billion, 2019-2032)
      • ITALY Frac Sand Market by Grade Type

        • 100 Mesh
        • 140 Mesh
        • 20/40 Mesh
        • 40/70 Mesh
        • 70/140 Mesh
        • Others
      • ITALY Frac Sand Market by Application Type

        • Hydraulic Fracturing
        • Foundry Casting
        • Abrasive Blasting
        • Glass Manufacturing
        • Sports and Recreation
        • Others
      • ITALY Frac Sand Market by End User Type

        • Oil and Gas Companies
        • Foundries
        • Construction Companies
        • Glass Manufacturers
        • Sports and Recreation Industries
        • Others
      • ITALY Frac Sand Market by Source Type

        • Northern White Sand
        • Brown Sand
        • Jordan Sand
        • Ottawa Sand
        • Others
      • SPAIN Outlook (USD Billion, 2019-2032)
      • SPAIN Frac Sand Market by Grade Type

        • 100 Mesh
        • 140 Mesh
        • 20/40 Mesh
        • 40/70 Mesh
        • 70/140 Mesh
        • Others
      • SPAIN Frac Sand Market by Application Type

        • Hydraulic Fracturing
        • Foundry Casting
        • Abrasive Blasting
        • Glass Manufacturing
        • Sports and Recreation
        • Others
      • SPAIN Frac Sand Market by End User Type

        • Oil and Gas Companies
        • Foundries
        • Construction Companies
        • Glass Manufacturers
        • Sports and Recreation Industries
        • Others
      • SPAIN Frac Sand Market by Source Type

        • Northern White Sand
        • Brown Sand
        • Jordan Sand
        • Ottawa Sand
        • Others
      • REST OF EUROPE Outlook (USD Billion, 2019-2032)
      • REST OF EUROPE Frac Sand Market by Grade Type

        • 100 Mesh
        • 140 Mesh
        • 20/40 Mesh
        • 40/70 Mesh
        • 70/140 Mesh
        • Others
      • REST OF EUROPE Frac Sand Market by Application Type

        • Hydraulic Fracturing
        • Foundry Casting
        • Abrasive Blasting
        • Glass Manufacturing
        • Sports and Recreation
        • Others
      • REST OF EUROPE Frac Sand Market by End User Type

        • Oil and Gas Companies
        • Foundries
        • Construction Companies
        • Glass Manufacturers
        • Sports and Recreation Industries
        • Others
      • REST OF EUROPE Frac Sand Market by Source Type

        • Northern White Sand
        • Brown Sand
        • Jordan Sand
        • Ottawa Sand
        • Others
    • APAC Outlook (USD Billion, 2019-2032)

      • APAC Frac Sand Market by Grade Type

        • 100 Mesh
        • 140 Mesh
        • 20/40 Mesh
        • 40/70 Mesh
        • 70/140 Mesh
        • Others
      • APAC Frac Sand Market by Application Type

        • Hydraulic Fracturing
        • Foundry Casting
        • Abrasive Blasting
        • Glass Manufacturing
        • Sports and Recreation
        • Others
      • APAC Frac Sand Market by End User Type

        • Oil and Gas Companies
        • Foundries
        • Construction Companies
        • Glass Manufacturers
        • Sports and Recreation Industries
        • Others
      • APAC Frac Sand Market by Source Type

        • Northern White Sand
        • Brown Sand
        • Jordan Sand
        • Ottawa Sand
        • Others
      • APAC Frac Sand Market by Regional Type

        • China
        • India
        • Japan
        • South Korea
        • Malaysia
        • Thailand
        • Indonesia
        • Rest of APAC
      • CHINA Outlook (USD Billion, 2019-2032)
      • CHINA Frac Sand Market by Grade Type

        • 100 Mesh
        • 140 Mesh
        • 20/40 Mesh
        • 40/70 Mesh
        • 70/140 Mesh
        • Others
      • CHINA Frac Sand Market by Application Type

        • Hydraulic Fracturing
        • Foundry Casting
        • Abrasive Blasting
        • Glass Manufacturing
        • Sports and Recreation
        • Others
      • CHINA Frac Sand Market by End User Type

        • Oil and Gas Companies
        • Foundries
        • Construction Companies
        • Glass Manufacturers
        • Sports and Recreation Industries
        • Others
      • CHINA Frac Sand Market by Source Type

        • Northern White Sand
        • Brown Sand
        • Jordan Sand
        • Ottawa Sand
        • Others
      • INDIA Outlook (USD Billion, 2019-2032)
      • INDIA Frac Sand Market by Grade Type

        • 100 Mesh
        • 140 Mesh
        • 20/40 Mesh
        • 40/70 Mesh
        • 70/140 Mesh
        • Others
      • INDIA Frac Sand Market by Application Type

        • Hydraulic Fracturing
        • Foundry Casting
        • Abrasive Blasting
        • Glass Manufacturing
        • Sports and Recreation
        • Others
      • INDIA Frac Sand Market by End User Type

        • Oil and Gas Companies
        • Foundries
        • Construction Companies
        • Glass Manufacturers
        • Sports and Recreation Industries
        • Others
      • INDIA Frac Sand Market by Source Type

        • Northern White Sand
        • Brown Sand
        • Jordan Sand
        • Ottawa Sand
        • Others
      • JAPAN Outlook (USD Billion, 2019-2032)
      • JAPAN Frac Sand Market by Grade Type

        • 100 Mesh
        • 140 Mesh
        • 20/40 Mesh
        • 40/70 Mesh
        • 70/140 Mesh
        • Others
      • JAPAN Frac Sand Market by Application Type

        • Hydraulic Fracturing
        • Foundry Casting
        • Abrasive Blasting
        • Glass Manufacturing
        • Sports and Recreation
        • Others
      • JAPAN Frac Sand Market by End User Type

        • Oil and Gas Companies
        • Foundries
        • Construction Companies
        • Glass Manufacturers
        • Sports and Recreation Industries
        • Others
      • JAPAN Frac Sand Market by Source Type

        • Northern White Sand
        • Brown Sand
        • Jordan Sand
        • Ottawa Sand
        • Others
      • SOUTH KOREA Outlook (USD Billion, 2019-2032)
      • SOUTH KOREA Frac Sand Market by Grade Type

        • 100 Mesh
        • 140 Mesh
        • 20/40 Mesh
        • 40/70 Mesh
        • 70/140 Mesh
        • Others
      • SOUTH KOREA Frac Sand Market by Application Type

        • Hydraulic Fracturing
        • Foundry Casting
        • Abrasive Blasting
        • Glass Manufacturing
        • Sports and Recreation
        • Others
      • SOUTH KOREA Frac Sand Market by End User Type

        • Oil and Gas Companies
        • Foundries
        • Construction Companies
        • Glass Manufacturers
        • Sports and Recreation Industries
        • Others
      • SOUTH KOREA Frac Sand Market by Source Type

        • Northern White Sand
        • Brown Sand
        • Jordan Sand
        • Ottawa Sand
        • Others
      • MALAYSIA Outlook (USD Billion, 2019-2032)
      • MALAYSIA Frac Sand Market by Grade Type

        • 100 Mesh
        • 140 Mesh
        • 20/40 Mesh
        • 40/70 Mesh
        • 70/140 Mesh
        • Others
      • MALAYSIA Frac Sand Market by Application Type

        • Hydraulic Fracturing
        • Foundry Casting
        • Abrasive Blasting
        • Glass Manufacturing
        • Sports and Recreation
        • Others
      • MALAYSIA Frac Sand Market by End User Type

        • Oil and Gas Companies
        • Foundries
        • Construction Companies
        • Glass Manufacturers
        • Sports and Recreation Industries
        • Others
      • MALAYSIA Frac Sand Market by Source Type

        • Northern White Sand
        • Brown Sand
        • Jordan Sand
        • Ottawa Sand
        • Others
      • THAILAND Outlook (USD Billion, 2019-2032)
      • THAILAND Frac Sand Market by Grade Type

        • 100 Mesh
        • 140 Mesh
        • 20/40 Mesh
        • 40/70 Mesh
        • 70/140 Mesh
        • Others
      • THAILAND Frac Sand Market by Application Type

        • Hydraulic Fracturing
        • Foundry Casting
        • Abrasive Blasting
        • Glass Manufacturing
        • Sports and Recreation
        • Others
      • THAILAND Frac Sand Market by End User Type

        • Oil and Gas Companies
        • Foundries
        • Construction Companies
        • Glass Manufacturers
        • Sports and Recreation Industries
        • Others
      • THAILAND Frac Sand Market by Source Type

        • Northern White Sand
        • Brown Sand
        • Jordan Sand
        • Ottawa Sand
        • Others
      • INDONESIA Outlook (USD Billion, 2019-2032)
      • INDONESIA Frac Sand Market by Grade Type

        • 100 Mesh
        • 140 Mesh
        • 20/40 Mesh
        • 40/70 Mesh
        • 70/140 Mesh
        • Others
      • INDONESIA Frac Sand Market by Application Type

        • Hydraulic Fracturing
        • Foundry Casting
        • Abrasive Blasting
        • Glass Manufacturing
        • Sports and Recreation
        • Others
      • INDONESIA Frac Sand Market by End User Type

        • Oil and Gas Companies
        • Foundries
        • Construction Companies
        • Glass Manufacturers
        • Sports and Recreation Industries
        • Others
      • INDONESIA Frac Sand Market by Source Type

        • Northern White Sand
        • Brown Sand
        • Jordan Sand
        • Ottawa Sand
        • Others
      • REST OF APAC Outlook (USD Billion, 2019-2032)
      • REST OF APAC Frac Sand Market by Grade Type

        • 100 Mesh
        • 140 Mesh
        • 20/40 Mesh
        • 40/70 Mesh
        • 70/140 Mesh
        • Others
      • REST OF APAC Frac Sand Market by Application Type

        • Hydraulic Fracturing
        • Foundry Casting
        • Abrasive Blasting
        • Glass Manufacturing
        • Sports and Recreation
        • Others
      • REST OF APAC Frac Sand Market by End User Type

        • Oil and Gas Companies
        • Foundries
        • Construction Companies
        • Glass Manufacturers
        • Sports and Recreation Industries
        • Others
      • REST OF APAC Frac Sand Market by Source Type

        • Northern White Sand
        • Brown Sand
        • Jordan Sand
        • Ottawa Sand
        • Others
    • South America Outlook (USD Billion, 2019-2032)

      • South America Frac Sand Market by Grade Type

        • 100 Mesh
        • 140 Mesh
        • 20/40 Mesh
        • 40/70 Mesh
        • 70/140 Mesh
        • Others
      • South America Frac Sand Market by Application Type

        • Hydraulic Fracturing
        • Foundry Casting
        • Abrasive Blasting
        • Glass Manufacturing
        • Sports and Recreation
        • Others
      • South America Frac Sand Market by End User Type

        • Oil and Gas Companies
        • Foundries
        • Construction Companies
        • Glass Manufacturers
        • Sports and Recreation Industries
        • Others
      • South America Frac Sand Market by Source Type

        • Northern White Sand
        • Brown Sand
        • Jordan Sand
        • Ottawa Sand
        • Others
      • South America Frac Sand Market by Regional Type

        • Brazil
        • Mexico
        • Argentina
        • Rest of South America
      • BRAZIL Outlook (USD Billion, 2019-2032)
      • BRAZIL Frac Sand Market by Grade Type

        • 100 Mesh
        • 140 Mesh
        • 20/40 Mesh
        • 40/70 Mesh
        • 70/140 Mesh
        • Others
      • BRAZIL Frac Sand Market by Application Type

        • Hydraulic Fracturing
        • Foundry Casting
        • Abrasive Blasting
        • Glass Manufacturing
        • Sports and Recreation
        • Others
      • BRAZIL Frac Sand Market by End User Type

        • Oil and Gas Companies
        • Foundries
        • Construction Companies
        • Glass Manufacturers
        • Sports and Recreation Industries
        • Others
      • BRAZIL Frac Sand Market by Source Type

        • Northern White Sand
        • Brown Sand
        • Jordan Sand
        • Ottawa Sand
        • Others
      • MEXICO Outlook (USD Billion, 2019-2032)
      • MEXICO Frac Sand Market by Grade Type

        • 100 Mesh
        • 140 Mesh
        • 20/40 Mesh
        • 40/70 Mesh
        • 70/140 Mesh
        • Others
      • MEXICO Frac Sand Market by Application Type

        • Hydraulic Fracturing
        • Foundry Casting
        • Abrasive Blasting
        • Glass Manufacturing
        • Sports and Recreation
        • Others
      • MEXICO Frac Sand Market by End User Type

        • Oil and Gas Companies
        • Foundries
        • Construction Companies
        • Glass Manufacturers
        • Sports and Recreation Industries
        • Others
      • MEXICO Frac Sand Market by Source Type

        • Northern White Sand
        • Brown Sand
        • Jordan Sand
        • Ottawa Sand
        • Others
      • ARGENTINA Outlook (USD Billion, 2019-2032)
      • ARGENTINA Frac Sand Market by Grade Type

        • 100 Mesh
        • 140 Mesh
        • 20/40 Mesh
        • 40/70 Mesh
        • 70/140 Mesh
        • Others
      • ARGENTINA Frac Sand Market by Application Type

        • Hydraulic Fracturing
        • Foundry Casting
        • Abrasive Blasting
        • Glass Manufacturing
        • Sports and Recreation
        • Others
      • ARGENTINA Frac Sand Market by End User Type

        • Oil and Gas Companies
        • Foundries
        • Construction Companies
        • Glass Manufacturers
        • Sports and Recreation Industries
        • Others
      • ARGENTINA Frac Sand Market by Source Type

        • Northern White Sand
        • Brown Sand
        • Jordan Sand
        • Ottawa Sand
        • Others
      • REST OF SOUTH AMERICA Outlook (USD Billion, 2019-2032)
      • REST OF SOUTH AMERICA Frac Sand Market by Grade Type

        • 100 Mesh
        • 140 Mesh
        • 20/40 Mesh
        • 40/70 Mesh
        • 70/140 Mesh
        • Others
      • REST OF SOUTH AMERICA Frac Sand Market by Application Type

        • Hydraulic Fracturing
        • Foundry Casting
        • Abrasive Blasting
        • Glass Manufacturing
        • Sports and Recreation
        • Others
      • REST OF SOUTH AMERICA Frac Sand Market by End User Type

        • Oil and Gas Companies
        • Foundries
        • Construction Companies
        • Glass Manufacturers
        • Sports and Recreation Industries
        • Others
      • REST OF SOUTH AMERICA Frac Sand Market by Source Type

        • Northern White Sand
        • Brown Sand
        • Jordan Sand
        • Ottawa Sand
        • Others
    • MEA Outlook (USD Billion, 2019-2032)

      • MEA Frac Sand Market by Grade Type

        • 100 Mesh
        • 140 Mesh
        • 20/40 Mesh
        • 40/70 Mesh
        • 70/140 Mesh
        • Others
      • MEA Frac Sand Market by Application Type

        • Hydraulic Fracturing
        • Foundry Casting
        • Abrasive Blasting
        • Glass Manufacturing
        • Sports and Recreation
        • Others
      • MEA Frac Sand Market by End User Type

        • Oil and Gas Companies
        • Foundries
        • Construction Companies
        • Glass Manufacturers
        • Sports and Recreation Industries
        • Others
      • MEA Frac Sand Market by Source Type

        • Northern White Sand
        • Brown Sand
        • Jordan Sand
        • Ottawa Sand
        • Others
      • MEA Frac Sand Market by Regional Type

        • GCC Countries
        • South Africa
        • Rest of MEA
      • GCC COUNTRIES Outlook (USD Billion, 2019-2032)
      • GCC COUNTRIES Frac Sand Market by Grade Type

        • 100 Mesh
        • 140 Mesh
        • 20/40 Mesh
        • 40/70 Mesh
        • 70/140 Mesh
        • Others
      • GCC COUNTRIES Frac Sand Market by Application Type

        • Hydraulic Fracturing
        • Foundry Casting
        • Abrasive Blasting
        • Glass Manufacturing
        • Sports and Recreation
        • Others
      • GCC COUNTRIES Frac Sand Market by End User Type

        • Oil and Gas Companies
        • Foundries
        • Construction Companies
        • Glass Manufacturers
        • Sports and Recreation Industries
        • Others
      • GCC COUNTRIES Frac Sand Market by Source Type

        • Northern White Sand
        • Brown Sand
        • Jordan Sand
        • Ottawa Sand
        • Others
      • SOUTH AFRICA Outlook (USD Billion, 2019-2032)
      • SOUTH AFRICA Frac Sand Market by Grade Type

        • 100 Mesh
        • 140 Mesh
        • 20/40 Mesh
        • 40/70 Mesh
        • 70/140 Mesh
        • Others
      • SOUTH AFRICA Frac Sand Market by Application Type

        • Hydraulic Fracturing
        • Foundry Casting
        • Abrasive Blasting
        • Glass Manufacturing
        • Sports and Recreation
        • Others
      • SOUTH AFRICA Frac Sand Market by End User Type

        • Oil and Gas Companies
        • Foundries
        • Construction Companies
        • Glass Manufacturers
        • Sports and Recreation Industries
        • Others
      • SOUTH AFRICA Frac Sand Market by Source Type

        • Northern White Sand
        • Brown Sand
        • Jordan Sand
        • Ottawa Sand
        • Others
      • REST OF MEA Outlook (USD Billion, 2019-2032)
      • REST OF MEA Frac Sand Market by Grade Type

        • 100 Mesh
        • 140 Mesh
        • 20/40 Mesh
        • 40/70 Mesh
        • 70/140 Mesh
        • Others
      • REST OF MEA Frac Sand Market by Application Type

        • Hydraulic Fracturing
        • Foundry Casting
        • Abrasive Blasting
        • Glass Manufacturing
        • Sports and Recreation
        • Others
      • REST OF MEA Frac Sand Market by End User Type

        • Oil and Gas Companies
        • Foundries
        • Construction Companies
        • Glass Manufacturers
        • Sports and Recreation Industries
        • Others
      • REST OF MEA Frac Sand Market by Source Type

        • Northern White Sand
        • Brown Sand
        • Jordan Sand
        • Ottawa Sand
        • Others


    Report Infographic
    Free Sample Request

    Kindly complete the form below to receive a free sample of this Report

    Customer Strories

    “I am very pleased with how market segments have been defined in a relevant way for my purposes (such as "Portable Freezers & refrigerators" and "last-mile"). In general the report is well structured. Thanks very much for your efforts.”

    Victoria Milne Founder
    Case Study

    Chemicals and Materials