• Cat-intel
  • MedIntelliX
  • Resources
  • About Us
  • Hero Background
    English
    Chinese
    French
    Japanese
    Korean
    German
    Spanish

    Fiber Drum Market Analysis

    ID: MRFR/PNT/7060-HCR
    188 Pages
    Snehal Singh
    October 2025

    Fiber Drum Market Research Report Information by Closure (Metal Closure, Plastic Closure, and Fiber/Cardboard Closure), Capacity (Up to 25 Gallons, 26–50 Gallons, 51–75 Gallons, and Above 75 Gallons), End-Use Industry (Chemical, Food & Beverage, Pharmaceuticals), And By Region (North America, Europe, Asia-Pacific, And Rest Of The World) –Market Forecast Till 2035

    Share:
    Download PDF ×

    We do not share your information with anyone. However, we may send you emails based on your report interest from time to time. You may contact us at any time to opt-out.

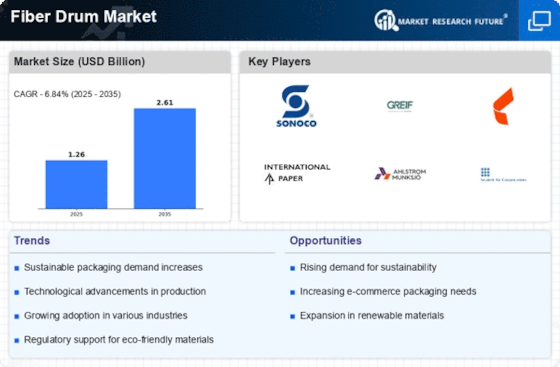
    Fiber Drum Market Infographic
    Purchase Options

    Market Analysis

    In-depth Analysis of Fiber Drum Market Industry Landscape

    The Fiber Drum Market operates within a dynamic environment influenced by various factors that shape its growth, trends, and competition. One significant dynamic is the increasing demand for eco-friendly and sustainable packaging solutions. As businesses and consumers become more environmentally conscious, there is a growing preference for packaging materials that are biodegradable, recyclable, and renewable. Fiber drums, made from recycled paperboard or renewable fibers such as kraft paper, offer a sustainable alternative to traditional packaging options such as plastic or metal drums. Companies in the Fiber Drum Market are responding to this demand by offering a wide range of fiber drum solutions that meet the sustainability requirements of customers while providing reliable and cost-effective packaging for various industries.

    Another key market dynamic is the expanding industrial and chemical sectors, which drive growth in the Fiber Drum Market. As manufacturing activities increase and global trade grows, there is a rising demand for robust and secure packaging solutions to transport chemicals, pharmaceuticals, food products, and other industrial goods. Fiber drums offer advantages such as strength, durability, and resistance to moisture and impact, making them suitable for storing and transporting a wide range of products. Companies are capitalizing on this trend by providing fiber drum solutions tailored to the specific requirements of industrial and chemical applications, such as UN certification, tamper-evident closures, and inner linings for product protection. The global fiber drum market based on the closure type segmented into three types as metal closure fiber drums, plastic closure fiber drums, and fiber closure fiber drums. Out of these, the metal closure fiber drums hold the largest share of the fiber drum industry in 2018 and during the forecast period, it is expected to have the highest growth.

    Furthermore, regulatory standards and safety requirements play a significant role in shaping market dynamics in the Fiber Drum Market. Government regulations related to packaging materials, transportation safety, and hazardous goods handling impact the design, manufacturing, and use of fiber drums. Companies must comply with these regulations to ensure the quality, safety, and performance of their fiber drum products while also addressing concerns related to environmental impact and product integrity. As a result, there is a growing focus on developing fiber drum solutions that meet regulatory standards and address industry-specific requirements, such as FDA compliance, ATEX certification, and food-grade materials.

    Moreover, technological advancements and innovations drive market dynamics in the Fiber Drum Market. Advances in paperboard manufacturing processes, drum design, and closure systems have led to the development of high-performance fiber drum products with enhanced strength, durability, and functionality. Innovations such as moisture-resistant coatings, reinforced sidewalls, and tamper-proof closures are improving the performance and reliability of fiber drum solutions, making them more attractive to customers seeking robust packaging options. Companies that invest in research and development to drive innovation can gain a competitive edge and meet the evolving needs of customers in the Fiber Drum Market.

    Supply chain dynamics also play a crucial role in shaping market dynamics in the Fiber Drum Market. Factors such as raw material availability, manufacturing capabilities, and distribution networks impact the production and availability of fiber drum products. Companies must optimize their supply chain processes to ensure timely delivery, minimize costs, and maintain product quality. Fluctuations in raw material prices, transportation costs, and geopolitical factors can also influence production costs and pricing strategies within the market, requiring companies to remain agile and responsive to market dynamics.

    Furthermore, shifting consumer preferences and industry trends influence the demand for fiber drums in the market. As businesses seek packaging solutions that offer sustainability, reliability, and cost-effectiveness, there is a growing demand for fiber drums across various applications. Fiber drums are preferred for their eco-friendly attributes, robustness, and versatility, making them suitable for packaging a wide range of products, including chemicals, pharmaceuticals, food products, and consumer goods. Companies that innovate and differentiate themselves through product quality, customization options, and sustainability initiatives can succeed in capturing market share and maintaining a competitive position in the Fiber Drum Market.

    Author
    Snehal Singh
    Assistant Manager - Research

    High acumen in analyzing complex macro & micro markets with more than 6 years of work experience in the field of market research. By implementing her analytical skills in forecasting and estimation into market research reports, she has expertise in Packaging, Construction, and Equipment domains. She handles a team size of 20-25 resources and ensures smooth running of the projects, associated marketing activities, and client servicing.

    Leave a Comment

    FAQs

    How much is the Fiber Drum market?

    The Fiber Drum market size was valued at USD 1.18 Billion in 2023.

    What is the growth rate of the Fiber Drum market?

    The Fiber Drum market is projected to grow at a CAGR of 6.84% during the forecast period, 2025-2035.

    Which region held the largest market share in the Fiber Drum market?

    North America had the largest share of the Fiber Drum market

    Who are the key players in the Fiber Drum market?

    The key players in the Fiber Drum market are Grief (US), Fibrestar Drums (UK), Schutz Container Systems (US), Mauser Group (US), CL Smith (US), Industrial Container Services (ICS) (Florida), TPL Plastech (India), Sonoco Product (US), Three Rivers Packaging (US), Enviro-Pak (US), Orlando Drum & Container (US) and Great Western Container (Canada).

    Which Closure led the Fiber Drum market?

    The Metal Closure category dominated the Fiber Drum market in 2023.

    Which Capacity had the largest market share in the Fiber Drum market?

    The 51–75 Gallons had the largest share in the Fiber Drum market.

    Market Summary

    As per Market Research Future Analysis, the Global Fiber Drum Market was valued at USD 1.18 Billion in 2023 and is projected to reach USD 2.16 Billion by 2032, growing at a CAGR of 6.84% from 2024 to 2032. The market is driven by the increasing transport and warehousing of liquid items, the recyclability of fiber drums, and the expansion of the retail sector. The Food & Beverage segment accounted for 39% of market revenue in 2022, while the metal closure segment dominated with 54% market share. The Asia-Pacific region is expected to witness the highest growth due to rising production facilities and demand for packaging solutions.

    Key Market Trends & Highlights

    Key trends driving the Fiber Drum Market include increased demand for sustainable packaging and growth in various end-user sectors.

    • Market Size in 2023: USD 1.18 Billion
    • Projected Market Size by 2032: USD 2.16 Billion
    • CAGR from 2024 to 2032: 6.84%
    • Food & Beverage segment revenue in 2022: USD 0.43 Billion (39% market share)

    Market Size & Forecast

    2023 Market Size USD 1.18 Billion
    2024 Market Size USD 1.27 Billion
    2032 Market Size USD 2.16 Billion
    CAGR (2024-2032) 6.84%
    Largest Regional Market Share in 2024 North America

    Major Players

    Key players include Greif, Fibrestar Drums, Schutz Container Systems, Mauser Group, CL Smith, Industrial Container Services, TPL Plastech, Sonoco Product, Three Rivers Packaging, Enviro-Pak, Orlando Drum & Container, and Great Western Container.

    Market Trends

    Growing transport and warehousing of liquid items are driving the market growth.

    The rising transport and warehousing of liquid items drive the market CAGR for fiber drum. Fiber barrels are easily accepted with marine containers and vehicles due to their mobility and ease of handling. The lightweight drum is suitable for transporting and storing liquid items. These reasons drive up the need for fiber drum market research. The fiber drum business is fueled by the fact that it is 100% recyclable. Aside from that, the expanding retail sector and increased intercontinental commerce are driving the expansion of the fiber drum industry. used Fiber drums are a dry chemical packaging option in Asia-Pacific.

    Two essential tests are used to evaluate the condition of the fiber drum: the drop test and the process of stacking or compressing test.

    Additionally, Renowned players have improved the quality of fiber drums to meet the growing demand for packaging solutions. This boosts the worldwide fiber drum market's demand. It can be coated with various coverings or insoluble substances such as silicon, polyethylene, or polyester to move and store liquid items. The increasing retail sector and demand for compact containers for bulk goods are the primary factors influencing the fiber drum business. Fiber drums offer a significant advantage in that they are completely recyclable.

    Most fiber drums, for example, may be filled with various coverings or insoluble substances, including silicone, polyethylene, or polyester, which are used to transport and store liquid commodities such as adhesives and dyes. Food and medicines are key drivers of industry development. Fiber drums are used to store and carry a variety of things such as food, dyes & colorants, adhesives, and hazardous chemicals.

    Furthermore, supply networks gradually reestablish demand for food and pharmaceutical sectors for rising COVID-19 patients.

    For instance, Associations such as the SEFFI continue collaborating with European fiber drum producers to promote the benefits of fiber drums and represent the industry ly. Over 90% of European manufacturers are members of the organization, with a yearly production of 10 million fiber containers. Thus, it is anticipated that demand for Fiber Drum will increase throughout the projected timeframe due to the rising transport and warehousing of liquid items. Thus, driving the Fiber Drum market revenue.

    The ongoing shift towards sustainable packaging solutions appears to be driving an increased demand for fiber drums, as industries seek eco-friendly alternatives to traditional materials.

    U.S. Environmental Protection Agency

    Fiber Drum Market Market Drivers

    Growth in E-commerce and Logistics

    The expansion of e-commerce and logistics sectors significantly influences the Global Fiber Drum Market Industry. As online shopping continues to surge, the demand for efficient and reliable packaging solutions rises. Fiber drums, known for their durability and ability to protect products during transit, are becoming a preferred choice among logistics companies. This trend is expected to contribute to the market's growth, with projections indicating a market size of 2.63 USD Billion by 2035. The ability of fiber drums to accommodate various products, from bulk goods to fragile items, positions them as a versatile solution in the evolving landscape of e-commerce and logistics.

    Versatility Across Various Industries

    The versatility of fiber drums across multiple industries serves as a significant driver for the Global Fiber Drum Market Industry. These drums are utilized in sectors such as chemicals, food and beverage, pharmaceuticals, and construction, owing to their ability to safely store and transport a wide range of products. Their lightweight nature, coupled with robust construction, makes them an ideal choice for bulk packaging. As industries increasingly recognize the benefits of fiber drums, the market is expected to witness sustained growth. This adaptability positions fiber drums as a crucial component in diverse supply chains, further solidifying their role in the Global Fiber Drum Market Industry.

    Technological Advancements in Manufacturing

    Technological advancements in the manufacturing of fiber drums are enhancing the efficiency and quality of production processes within the Global Fiber Drum Market Industry. Innovations such as automated production lines and improved materials are enabling manufacturers to produce fiber drums that meet stringent quality standards while reducing costs. These advancements not only improve the durability and performance of fiber drums but also contribute to sustainability efforts by minimizing waste during production. As manufacturers adopt these technologies, the market is likely to experience increased competitiveness and growth, aligning with the projected market size of 1.27 USD Billion in 2024.

    Regulatory Support for Eco-Friendly Packaging

    Regulatory frameworks promoting eco-friendly packaging solutions are pivotal in shaping the Global Fiber Drum Market Industry. Governments worldwide are implementing policies that encourage the use of sustainable materials, thereby fostering a favorable environment for fiber drum adoption. For instance, regulations aimed at reducing plastic waste are driving manufacturers to explore alternative packaging options. This regulatory support is likely to enhance the market's growth trajectory, as companies seek compliance while meeting consumer demand for sustainable products. The Global Fiber Drum Market Industry stands to benefit from these initiatives, potentially achieving a compound annual growth rate of 6.86% from 2025 to 2035.

    Rising Demand for Sustainable Packaging Solutions

    The Global Fiber Drum Market Industry experiences a notable increase in demand for sustainable packaging solutions. As environmental concerns grow, businesses are shifting towards eco-friendly alternatives, such as fiber drums, which are recyclable and biodegradable. This trend is particularly evident in industries like food and beverage, chemicals, and pharmaceuticals, where packaging plays a crucial role in sustainability initiatives. The global market for fiber drums is projected to reach 1.27 USD Billion in 2024, reflecting a growing preference for sustainable materials. Companies are increasingly adopting fiber drums to align with corporate social responsibility goals, thereby driving growth in the Global Fiber Drum Market Industry.

    Market Segment Insights

    Fiber Drum Closure Insights

    The Fiber Drum market segmentation, based on closure, includes Metal Closure, Plastic Closure, and Fiberboard /Cardboard Closure. The metal closure segment dominated the market, accounting for 54% of market revenue (USD 0.6 Billion) in 2022. The metal closure reinforces the highest point & bottom sides of the drum. It increases the impact resilience of the drum while also making the rim easier to open and close.

    Figure 1:  Fiber Drum Market, by Closure, 2022 & 2032 (USD Billion)

    Source: Secondary Research, Primary Research, Market Research Future Database, and Analyst Review

    Fiber Drum Capacity Insights

    The Fiber Drum market segmentation, based on capacity, includes Up to 25 Gallons, 26–50 Gallons, 51–75 Gallons, and Above 75 Gallons. The 51–75-gallon category generated the highest market revenue of about 42% (USD 0.5 billion) in 2022. This category has an FDA-compliant container criterion, which fiber drums can meet.

    Fiber Drum End-User Insights

    The Fiber Drum market segmentation, based on end-user, includes Chemical, Food & Beverage, Pharmaceuticals. The Food & Beverage segment dominated the market, accounting for 39% of market revenue (USD 0.43 Billion) in 2022. Increased use of fiber drums in the food and beverage sector may boost the fiber drum market revenue.

    Get more detailed insights about Fiber Drum Market Research Report - Global Forecast 2035

    Regional Insights

    By region, the research provides market insights into North America, Europe, Asia-Pacific, and the Rest of the World. The North American Fiber Drum market area will dominate this market during the projected timeframe. It is booming with prominent chemical industries such as Dow Chemical Company, DuPont, and others, creating the demand for a reliable chemical delivery medium to boost the market growth in the North American region.

    Further, the major countries studied in the market report are the US, Canada, German, France, the UK, Italy, Spain, China, Japan, India, Australia, South Korea, and Brazil.

    Figure 2:  Fiber Drum Market Share by Region 2022 (USD Billion)

    Fiber Drum Market Share by Region

    Source: Secondary Research, Primary Research, Market Research Future Database, and Analyst Review

    Europe region’s Fiber Drum market accounts for the second-highest market share owing to the critical penetration of new items such as plastic containers in building and construction areas and growing food shortages due to major instances discovered in several food production enterprises in this region. Further, the German Fiber Drum market holds the largest market share, and the UK Fiber Drum market is expected to grow and expand significantly in the European region during the projected timeframe.

    The Asia-Pacific Fiber Drum Market is expected to grow quickly during the projected timeframe. Manufacturers use this facility for the packaging sector due to the rising number of production facilities and developing economies in nations, cheap labor costs, and the availability of indigenous raw materials. Moreover, China’s Fiber Drum market dominates the market share, and the Indian Fiber Drum market is expected to expand and grow steadily in the Asia-Pacific region during the projected timeframe.

    Key Players and Competitive Insights

    Leading market players invested heavily in research and Development (R&D) to scale up their manufacturing units and develop technologically advanced solutions, which will help the Fiber Drum market grow worldwide. Market participants are also undertaking various organic or inorganic strategic approaches to strengthen and expand their footprint, with significant market developments including new product portfolios, contractual deals, mergers and acquisitions, capital expenditure, higher investments, and strategic alliances with other organizations. Businesses are also coming up with marketing strategies such as digital marketing, social media influencing, and content marketing to increase their scope of profit earnings.

    The Fiber Drum industry must offer cost-effective and sustainable options to survive in a highly fragmented and dynamic market climate.

    Manufacturing locally to minimize operational expenses and offer aftermarket services to customers is one of the critical business strategies organizations use in the Fiber Drum industry to benefit customers and capture untapped market share and revenue. The Fiber Drum industry has recently offered significant advantages to the Packaging & Transport industry. Moreover, more industry participants are utilizing and adopting cutting-edge Technology has grown substantially.

    Major players in the Fiber Drum market, including Grief (US), Fibrestar Drums (UK), Schutz Container Systems (US), Mauser Group (US), CL Smith (US), Industrial Container Services (ICS) (Florida), TPL Plastech (India), Sonoco Product (US), Three Rivers Packaging (US), Enviro-Pak (US), Orlando Drum & Container (US) and Great Western Container (Canada), are attempting to expand market share and demand by investing in R&D operations to produce sustainable and affordable solutions.

    Greif is an international innovator in packaging for commercial goods and services, with 235 locations worldwide, 188 of which are manufacturing facilities. The company's 12,280 employees are spread throughout 37 countries, with its main office in Delaware, Ohio. They began a new plastic manufacturing development on the USA's West Coast in February 2020. In its Merced, California factory, they are building a plastic drum blow molding machine. It is scheduled to begin operations in the subsequent quarter of 2020.

    Steel containers, commercial greases, specialty fluids, and business travel and logistical services are among the items offered by Balmer Lawrie & Co. It is involved in performance chemicals as well as logistical infrastructure. It is India's largest steel barrel maker. The organization is based in Calcutta and has locations around India and in Bedford, England. They opened a new manufacturing factory for steel drums in Vadodara, Gujarat, in June 2019. With a 34% market share, this firm is India's biggest 210L MS Drum maker. Its goal is to provide the chemical industry with quality products and services.

    Key Companies in the Fiber Drum Market market include

    Industry Developments

    March 2022: Expanding the new SCHUTS carrier technology installations in Toronto, Montreal, and Ottawa. As a result of environmental measures, the fiber drum industry is likely to grow even faster.

    February 2020: Grief began a new development of plastic manufacturing on the West Coast of the USA in February 2020. In its Merced, California factory, they are building a plastic drum blow molding machine. It is scheduled to begin operations in the subsequent quarter of 2020.

    June 2019: Balmer Lawrie & Co.Ltd opened a new manufacturing factory for steel drums in Vadodara, Gujarat, in June 2019. With a 34% market share, this firm is India's biggest 210L MS Drum maker. Its goal is to provide the chemical industry with quality products and services.

    Future Outlook

    Fiber Drum Market Future Outlook

    The Fiber Drum Market is projected to grow at a 6.86% CAGR from 2024 to 2035, driven by increasing demand for sustainable packaging solutions and innovations in manufacturing processes.

    New opportunities lie in:

    • Develop eco-friendly fiber drum alternatives to attract environmentally conscious consumers.
    • Invest in automation technologies to enhance production efficiency and reduce operational costs.
    • Expand distribution networks in emerging markets to capture new customer segments.

    By 2035, the Fiber Drum Market is expected to achieve robust growth, solidifying its position as a leader in sustainable packaging solutions.

    Market Segmentation

    Fiber Drum Closure Outlook

    • Metal Closure
    • Plastic Closure
    • Fiber/Cardboard Closure

    Fiber Drum Capacity Outlook

    • Up to 25 Gallons
    • 26–50 Gallons
    • 51–75 Gallons
    • Above 75 Gallons

    Fiber Drum End-User Outlook

    • Chemical
    • Food & Beverage
    • Pharmaceuticals

    Fiber Drum Regional Outlook

    North America
    • US
    • Canada

    Report Scope

    Report Attribute/Metric Details
    Market Size 2023 USD 1.18 Billion
    Market Size 2024 USD 1.27 Billion
    Market Size 2032 USD 2.16 Billion
    Compound Annual Growth Rate (CAGR) 6.84 % (2023-2032)
    Base Year 2023
    Market Forecast Period 2024-2032
    Historical Data 2018- 2022
    Market Forecast Units Value (USD Billion)
    Report Coverage Revenue Forecast, Market Competitive Landscape, Growth Factors, and Trends
    Segments Covered Closure, Capacity, End-User, and Region
    Geographies Covered North America, Europe, Asia Pacific, and the Rest of the World
    Countries Covered The US, Canada, German, France, UK, Italy, Spain, China, Japan, India, Australia, South Korea, and Brazil
    Key Companies Profiled  Grief (US), Fibrestar Drums (UK), Schutz Container Systems (US), Mauser Group (US), CL Smith (US), Industrial Container Services (ICS) (Florida), TPL Plastech (India), Sonoco Product (US), Three Rivers Packaging (US), Enviro-Pak (US), Orlando Drum & Container (US) and Great Western Container (Canada)
    Key Market Opportunities Renowned organizations have improved the quality of fiber drums New product introductions and research and development by significant stakeholders
    Key Market Dynamics With marine containers & trucks, mobility, and simplicity of handling may be implemented. Transport and warehousing of liquid items

    FAQs

    How much is the Fiber Drum market?

    The Fiber Drum market size was valued at USD 1.18 Billion in 2023.

    What is the growth rate of the Fiber Drum market?

    The Fiber Drum market is projected to grow at a CAGR of 6.84% during the forecast period, 2025-2035.

    Which region held the largest market share in the Fiber Drum market?

    North America had the largest share of the Fiber Drum market

    Who are the key players in the Fiber Drum market?

    The key players in the Fiber Drum market are Grief (US), Fibrestar Drums (UK), Schutz Container Systems (US), Mauser Group (US), CL Smith (US), Industrial Container Services (ICS) (Florida), TPL Plastech (India), Sonoco Product (US), Three Rivers Packaging (US), Enviro-Pak (US), Orlando Drum & Container (US) and Great Western Container (Canada).

    Which Closure led the Fiber Drum market?

    The Metal Closure category dominated the Fiber Drum market in 2023.

    Which Capacity had the largest market share in the Fiber Drum market?

    The 51–75 Gallons had the largest share in the Fiber Drum market.

    1. SECTION I: EXECUTIVE SUMMARY AND KEY HIGHLIGHTS
      1. | 1.1 EXECUTIVE SUMMARY
      2. | | 1.1.1 Market Overview
      3. | | 1.1.2 Key Findings
      4. | | 1.1.3 Market Segmentation
      5. | | 1.1.4 Competitive Landscape
      6. | | 1.1.5 Challenges and Opportunities
      7. | | 1.1.6 Future Outlook
    2. SECTION II: SCOPING, METHODOLOGY AND MARKET STRUCTURE
      1. | 2.1 MARKET INTRODUCTION
      2. | | 2.1.1 Definition
      3. | | 2.1.2 Scope of the study
      4. | | | 2.1.2.1 Research Objective
      5. | | | 2.1.2.2 Assumption
      6. | | | 2.1.2.3 Limitations
      7. | 2.2 RESEARCH METHODOLOGY
      8. | | 2.2.1 Overview
      9. | | 2.2.2 Data Mining
      10. | | 2.2.3 Secondary Research
      11. | | 2.2.4 Primary Research
      12. | | | 2.2.4.1 Primary Interviews and Information Gathering Process
      13. | | | 2.2.4.2 Breakdown of Primary Respondents
      14. | | 2.2.5 Forecasting Model
      15. | | 2.2.6 Market Size Estimation
      16. | | | 2.2.6.1 Bottom-Up Approach
      17. | | | 2.2.6.2 Top-Down Approach
      18. | | 2.2.7 Data Triangulation
      19. | | 2.2.8 Validation
    3. SECTION III: QUALITATIVE ANALYSIS
      1. | 3.1 MARKET DYNAMICS
      2. | | 3.1.1 Overview
      3. | | 3.1.2 Drivers
      4. | | 3.1.3 Restraints
      5. | | 3.1.4 Opportunities
      6. | 3.2 MARKET FACTOR ANALYSIS
      7. | | 3.2.1 Value chain Analysis
      8. | | 3.2.2 Porter's Five Forces Analysis
      9. | | | 3.2.2.1 Bargaining Power of Suppliers
      10. | | | 3.2.2.2 Bargaining Power of Buyers
      11. | | | 3.2.2.3 Threat of New Entrants
      12. | | | 3.2.2.4 Threat of Substitutes
      13. | | | 3.2.2.5 Intensity of Rivalry
      14. | | 3.2.3 COVID-19 Impact Analysis
      15. | | | 3.2.3.1 Market Impact Analysis
      16. | | | 3.2.3.2 Regional Impact
      17. | | | 3.2.3.3 Opportunity and Threat Analysis
    4. SECTION IV: QUANTITATIVE ANALYSIS
      1. | 4.1 Packaging & Transport, BY Closure (USD Billion)
      2. | | 4.1.1 Metal Closure
      3. | | 4.1.2 Plastic Closure
      4. | | 4.1.3 Fiberboard/Cardboard Closure
      5. | 4.2 Packaging & Transport, BY Capacity (USD Billion)
      6. | | 4.2.1 Up to 25 Gallons
      7. | | 4.2.2 26–50 Gallons
      8. | | 4.2.3 51–75 Gallons
      9. | | 4.2.4 Above 75 Gallons
      10. | 4.3 Packaging & Transport, BY End-User (USD Billion)
      11. | | 4.3.1 Chemical
      12. | | 4.3.2 Food & Beverage
      13. | | 4.3.3 Pharmaceuticals
      14. | 4.4 Packaging & Transport, BY Region (USD Billion)
      15. | | 4.4.1 North America
      16. | | | 4.4.1.1 US
      17. | | | 4.4.1.2 Canada
      18. | | 4.4.2 Europe
      19. | | | 4.4.2.1 Germany
      20. | | | 4.4.2.2 UK
      21. | | | 4.4.2.3 France
      22. | | | 4.4.2.4 Russia
      23. | | | 4.4.2.5 Italy
      24. | | | 4.4.2.6 Spain
      25. | | | 4.4.2.7 Rest of Europe
      26. | | 4.4.3 APAC
      27. | | | 4.4.3.1 China
      28. | | | 4.4.3.2 India
      29. | | | 4.4.3.3 Japan
      30. | | | 4.4.3.4 South Korea
      31. | | | 4.4.3.5 Malaysia
      32. | | | 4.4.3.6 Thailand
      33. | | | 4.4.3.7 Indonesia
      34. | | | 4.4.3.8 Rest of APAC
      35. | | 4.4.4 South America
      36. | | | 4.4.4.1 Brazil
      37. | | | 4.4.4.2 Mexico
      38. | | | 4.4.4.3 Argentina
      39. | | | 4.4.4.4 Rest of South America
      40. | | 4.4.5 MEA
      41. | | | 4.4.5.1 GCC Countries
      42. | | | 4.4.5.2 South Africa
      43. | | | 4.4.5.3 Rest of MEA
    5. SECTION V: COMPETITIVE ANALYSIS
      1. | 5.1 Competitive Landscape
      2. | | 5.1.1 Overview
      3. | | 5.1.2 Competitive Analysis
      4. | | 5.1.3 Market share Analysis
      5. | | 5.1.4 Major Growth Strategy in the Packaging & Transport
      6. | | 5.1.5 Competitive Benchmarking
      7. | | 5.1.6 Leading Players in Terms of Number of Developments in the Packaging & Transport
      8. | | 5.1.7 Key developments and growth strategies
      9. | | | 5.1.7.1 New Product Launch/Service Deployment
      10. | | | 5.1.7.2 Merger & Acquisitions
      11. | | | 5.1.7.3 Joint Ventures
      12. | | 5.1.8 Major Players Financial Matrix
      13. | | | 5.1.8.1 Sales and Operating Income
      14. | | | 5.1.8.2 Major Players R&D Expenditure. 2023
      15. | 5.2 Company Profiles
      16. | | 5.2.1 Sonoco Products Company (US)
      17. | | | 5.2.1.1 Financial Overview
      18. | | | 5.2.1.2 Products Offered
      19. | | | 5.2.1.3 Key Developments
      20. | | | 5.2.1.4 SWOT Analysis
      21. | | | 5.2.1.5 Key Strategies
      22. | | 5.2.2 Greif, Inc. (US)
      23. | | | 5.2.2.1 Financial Overview
      24. | | | 5.2.2.2 Products Offered
      25. | | | 5.2.2.3 Key Developments
      26. | | | 5.2.2.4 SWOT Analysis
      27. | | | 5.2.2.5 Key Strategies
      28. | | 5.2.3 Mondi Group (GB)
      29. | | | 5.2.3.1 Financial Overview
      30. | | | 5.2.3.2 Products Offered
      31. | | | 5.2.3.3 Key Developments
      32. | | | 5.2.3.4 SWOT Analysis
      33. | | | 5.2.3.5 Key Strategies
      34. | | 5.2.4 International Paper Company (US)
      35. | | | 5.2.4.1 Financial Overview
      36. | | | 5.2.4.2 Products Offered
      37. | | | 5.2.4.3 Key Developments
      38. | | | 5.2.4.4 SWOT Analysis
      39. | | | 5.2.4.5 Key Strategies
      40. | | 5.2.5 Ahlstrom-Munksjö (FI)
      41. | | | 5.2.5.1 Financial Overview
      42. | | | 5.2.5.2 Products Offered
      43. | | | 5.2.5.3 Key Developments
      44. | | | 5.2.5.4 SWOT Analysis
      45. | | | 5.2.5.5 Key Strategies
      46. | | 5.2.6 Sealed Air Corporation (US)
      47. | | | 5.2.6.1 Financial Overview
      48. | | | 5.2.6.2 Products Offered
      49. | | | 5.2.6.3 Key Developments
      50. | | | 5.2.6.4 SWOT Analysis
      51. | | | 5.2.6.5 Key Strategies
      52. | | 5.2.7 Smurfit Kappa Group (IE)
      53. | | | 5.2.7.1 Financial Overview
      54. | | | 5.2.7.2 Products Offered
      55. | | | 5.2.7.3 Key Developments
      56. | | | 5.2.7.4 SWOT Analysis
      57. | | | 5.2.7.5 Key Strategies
      58. | | 5.2.8 Schutz Container Systems (DE)
      59. | | | 5.2.8.1 Financial Overview
      60. | | | 5.2.8.2 Products Offered
      61. | | | 5.2.8.3 Key Developments
      62. | | | 5.2.8.4 SWOT Analysis
      63. | | | 5.2.8.5 Key Strategies
      64. | | 5.2.9 BWAY Corporation (US)
      65. | | | 5.2.9.1 Financial Overview
      66. | | | 5.2.9.2 Products Offered
      67. | | | 5.2.9.3 Key Developments
      68. | | | 5.2.9.4 SWOT Analysis
      69. | | | 5.2.9.5 Key Strategies
      70. | 5.3 Appendix
      71. | | 5.3.1 References
      72. | | 5.3.2 Related Reports
    6. LIST OF FIGURES
      1. | 6.1 MARKET SYNOPSIS
      2. | 6.2 NORTH AMERICA MARKET ANALYSIS
      3. | 6.3 US MARKET ANALYSIS BY CLOSURE
      4. | 6.4 US MARKET ANALYSIS BY CAPACITY
      5. | 6.5 US MARKET ANALYSIS BY END-USER
      6. | 6.6 CANADA MARKET ANALYSIS BY CLOSURE
      7. | 6.7 CANADA MARKET ANALYSIS BY CAPACITY
      8. | 6.8 CANADA MARKET ANALYSIS BY END-USER
      9. | 6.9 EUROPE MARKET ANALYSIS
      10. | 6.10 GERMANY MARKET ANALYSIS BY CLOSURE
      11. | 6.11 GERMANY MARKET ANALYSIS BY CAPACITY
      12. | 6.12 GERMANY MARKET ANALYSIS BY END-USER
      13. | 6.13 UK MARKET ANALYSIS BY CLOSURE
      14. | 6.14 UK MARKET ANALYSIS BY CAPACITY
      15. | 6.15 UK MARKET ANALYSIS BY END-USER
      16. | 6.16 FRANCE MARKET ANALYSIS BY CLOSURE
      17. | 6.17 FRANCE MARKET ANALYSIS BY CAPACITY
      18. | 6.18 FRANCE MARKET ANALYSIS BY END-USER
      19. | 6.19 RUSSIA MARKET ANALYSIS BY CLOSURE
      20. | 6.20 RUSSIA MARKET ANALYSIS BY CAPACITY
      21. | 6.21 RUSSIA MARKET ANALYSIS BY END-USER
      22. | 6.22 ITALY MARKET ANALYSIS BY CLOSURE
      23. | 6.23 ITALY MARKET ANALYSIS BY CAPACITY
      24. | 6.24 ITALY MARKET ANALYSIS BY END-USER
      25. | 6.25 SPAIN MARKET ANALYSIS BY CLOSURE
      26. | 6.26 SPAIN MARKET ANALYSIS BY CAPACITY
      27. | 6.27 SPAIN MARKET ANALYSIS BY END-USER
      28. | 6.28 REST OF EUROPE MARKET ANALYSIS BY CLOSURE
      29. | 6.29 REST OF EUROPE MARKET ANALYSIS BY CAPACITY
      30. | 6.30 REST OF EUROPE MARKET ANALYSIS BY END-USER
      31. | 6.31 APAC MARKET ANALYSIS
      32. | 6.32 CHINA MARKET ANALYSIS BY CLOSURE
      33. | 6.33 CHINA MARKET ANALYSIS BY CAPACITY
      34. | 6.34 CHINA MARKET ANALYSIS BY END-USER
      35. | 6.35 INDIA MARKET ANALYSIS BY CLOSURE
      36. | 6.36 INDIA MARKET ANALYSIS BY CAPACITY
      37. | 6.37 INDIA MARKET ANALYSIS BY END-USER
      38. | 6.38 JAPAN MARKET ANALYSIS BY CLOSURE
      39. | 6.39 JAPAN MARKET ANALYSIS BY CAPACITY
      40. | 6.40 JAPAN MARKET ANALYSIS BY END-USER
      41. | 6.41 SOUTH KOREA MARKET ANALYSIS BY CLOSURE
      42. | 6.42 SOUTH KOREA MARKET ANALYSIS BY CAPACITY
      43. | 6.43 SOUTH KOREA MARKET ANALYSIS BY END-USER
      44. | 6.44 MALAYSIA MARKET ANALYSIS BY CLOSURE
      45. | 6.45 MALAYSIA MARKET ANALYSIS BY CAPACITY
      46. | 6.46 MALAYSIA MARKET ANALYSIS BY END-USER
      47. | 6.47 THAILAND MARKET ANALYSIS BY CLOSURE
      48. | 6.48 THAILAND MARKET ANALYSIS BY CAPACITY
      49. | 6.49 THAILAND MARKET ANALYSIS BY END-USER
      50. | 6.50 INDONESIA MARKET ANALYSIS BY CLOSURE
      51. | 6.51 INDONESIA MARKET ANALYSIS BY CAPACITY
      52. | 6.52 INDONESIA MARKET ANALYSIS BY END-USER
      53. | 6.53 REST OF APAC MARKET ANALYSIS BY CLOSURE
      54. | 6.54 REST OF APAC MARKET ANALYSIS BY CAPACITY
      55. | 6.55 REST OF APAC MARKET ANALYSIS BY END-USER
      56. | 6.56 SOUTH AMERICA MARKET ANALYSIS
      57. | 6.57 BRAZIL MARKET ANALYSIS BY CLOSURE
      58. | 6.58 BRAZIL MARKET ANALYSIS BY CAPACITY
      59. | 6.59 BRAZIL MARKET ANALYSIS BY END-USER
      60. | 6.60 MEXICO MARKET ANALYSIS BY CLOSURE
      61. | 6.61 MEXICO MARKET ANALYSIS BY CAPACITY
      62. | 6.62 MEXICO MARKET ANALYSIS BY END-USER
      63. | 6.63 ARGENTINA MARKET ANALYSIS BY CLOSURE
      64. | 6.64 ARGENTINA MARKET ANALYSIS BY CAPACITY
      65. | 6.65 ARGENTINA MARKET ANALYSIS BY END-USER
      66. | 6.66 REST OF SOUTH AMERICA MARKET ANALYSIS BY CLOSURE
      67. | 6.67 REST OF SOUTH AMERICA MARKET ANALYSIS BY CAPACITY
      68. | 6.68 REST OF SOUTH AMERICA MARKET ANALYSIS BY END-USER
      69. | 6.69 MEA MARKET ANALYSIS
      70. | 6.70 GCC COUNTRIES MARKET ANALYSIS BY CLOSURE
      71. | 6.71 GCC COUNTRIES MARKET ANALYSIS BY CAPACITY
      72. | 6.72 GCC COUNTRIES MARKET ANALYSIS BY END-USER
      73. | 6.73 SOUTH AFRICA MARKET ANALYSIS BY CLOSURE
      74. | 6.74 SOUTH AFRICA MARKET ANALYSIS BY CAPACITY
      75. | 6.75 SOUTH AFRICA MARKET ANALYSIS BY END-USER
      76. | 6.76 REST OF MEA MARKET ANALYSIS BY CLOSURE
      77. | 6.77 REST OF MEA MARKET ANALYSIS BY CAPACITY
      78. | 6.78 REST OF MEA MARKET ANALYSIS BY END-USER
      79. | 6.79 KEY BUYING CRITERIA OF PACKAGING & TRANSPORT
      80. | 6.80 RESEARCH PROCESS OF MRFR
      81. | 6.81 DRO ANALYSIS OF PACKAGING & TRANSPORT
      82. | 6.82 DRIVERS IMPACT ANALYSIS: PACKAGING & TRANSPORT
      83. | 6.83 RESTRAINTS IMPACT ANALYSIS: PACKAGING & TRANSPORT
      84. | 6.84 SUPPLY / VALUE CHAIN: PACKAGING & TRANSPORT
      85. | 6.85 PACKAGING & TRANSPORT, BY CLOSURE, 2024 (% SHARE)
      86. | 6.86 PACKAGING & TRANSPORT, BY CLOSURE, 2024 TO 2035 (USD Billion)
      87. | 6.87 PACKAGING & TRANSPORT, BY CAPACITY, 2024 (% SHARE)
      88. | 6.88 PACKAGING & TRANSPORT, BY CAPACITY, 2024 TO 2035 (USD Billion)
      89. | 6.89 PACKAGING & TRANSPORT, BY END-USER, 2024 (% SHARE)
      90. | 6.90 PACKAGING & TRANSPORT, BY END-USER, 2024 TO 2035 (USD Billion)
      91. | 6.91 BENCHMARKING OF MAJOR COMPETITORS
    7. LIST OF TABLES
      1. | 7.1 LIST OF ASSUMPTIONS
      2. | | 7.1.1
      3. | 7.2 North America MARKET SIZE ESTIMATES; FORECAST
      4. | | 7.2.1 BY CLOSURE, 2025-2035 (USD Billion)
      5. | | 7.2.2 BY CAPACITY, 2025-2035 (USD Billion)
      6. | | 7.2.3 BY END-USER, 2025-2035 (USD Billion)
      7. | 7.3 US MARKET SIZE ESTIMATES; FORECAST
      8. | | 7.3.1 BY CLOSURE, 2025-2035 (USD Billion)
      9. | | 7.3.2 BY CAPACITY, 2025-2035 (USD Billion)
      10. | | 7.3.3 BY END-USER, 2025-2035 (USD Billion)
      11. | 7.4 Canada MARKET SIZE ESTIMATES; FORECAST
      12. | | 7.4.1 BY CLOSURE, 2025-2035 (USD Billion)
      13. | | 7.4.2 BY CAPACITY, 2025-2035 (USD Billion)
      14. | | 7.4.3 BY END-USER, 2025-2035 (USD Billion)
      15. | 7.5 Europe MARKET SIZE ESTIMATES; FORECAST
      16. | | 7.5.1 BY CLOSURE, 2025-2035 (USD Billion)
      17. | | 7.5.2 BY CAPACITY, 2025-2035 (USD Billion)
      18. | | 7.5.3 BY END-USER, 2025-2035 (USD Billion)
      19. | 7.6 Germany MARKET SIZE ESTIMATES; FORECAST
      20. | | 7.6.1 BY CLOSURE, 2025-2035 (USD Billion)
      21. | | 7.6.2 BY CAPACITY, 2025-2035 (USD Billion)
      22. | | 7.6.3 BY END-USER, 2025-2035 (USD Billion)
      23. | 7.7 UK MARKET SIZE ESTIMATES; FORECAST
      24. | | 7.7.1 BY CLOSURE, 2025-2035 (USD Billion)
      25. | | 7.7.2 BY CAPACITY, 2025-2035 (USD Billion)
      26. | | 7.7.3 BY END-USER, 2025-2035 (USD Billion)
      27. | 7.8 France MARKET SIZE ESTIMATES; FORECAST
      28. | | 7.8.1 BY CLOSURE, 2025-2035 (USD Billion)
      29. | | 7.8.2 BY CAPACITY, 2025-2035 (USD Billion)
      30. | | 7.8.3 BY END-USER, 2025-2035 (USD Billion)
      31. | 7.9 Russia MARKET SIZE ESTIMATES; FORECAST
      32. | | 7.9.1 BY CLOSURE, 2025-2035 (USD Billion)
      33. | | 7.9.2 BY CAPACITY, 2025-2035 (USD Billion)
      34. | | 7.9.3 BY END-USER, 2025-2035 (USD Billion)
      35. | 7.10 Italy MARKET SIZE ESTIMATES; FORECAST
      36. | | 7.10.1 BY CLOSURE, 2025-2035 (USD Billion)
      37. | | 7.10.2 BY CAPACITY, 2025-2035 (USD Billion)
      38. | | 7.10.3 BY END-USER, 2025-2035 (USD Billion)
      39. | 7.11 Spain MARKET SIZE ESTIMATES; FORECAST
      40. | | 7.11.1 BY CLOSURE, 2025-2035 (USD Billion)
      41. | | 7.11.2 BY CAPACITY, 2025-2035 (USD Billion)
      42. | | 7.11.3 BY END-USER, 2025-2035 (USD Billion)
      43. | 7.12 Rest of Europe MARKET SIZE ESTIMATES; FORECAST
      44. | | 7.12.1 BY CLOSURE, 2025-2035 (USD Billion)
      45. | | 7.12.2 BY CAPACITY, 2025-2035 (USD Billion)
      46. | | 7.12.3 BY END-USER, 2025-2035 (USD Billion)
      47. | 7.13 APAC MARKET SIZE ESTIMATES; FORECAST
      48. | | 7.13.1 BY CLOSURE, 2025-2035 (USD Billion)
      49. | | 7.13.2 BY CAPACITY, 2025-2035 (USD Billion)
      50. | | 7.13.3 BY END-USER, 2025-2035 (USD Billion)
      51. | 7.14 China MARKET SIZE ESTIMATES; FORECAST
      52. | | 7.14.1 BY CLOSURE, 2025-2035 (USD Billion)
      53. | | 7.14.2 BY CAPACITY, 2025-2035 (USD Billion)
      54. | | 7.14.3 BY END-USER, 2025-2035 (USD Billion)
      55. | 7.15 India MARKET SIZE ESTIMATES; FORECAST
      56. | | 7.15.1 BY CLOSURE, 2025-2035 (USD Billion)
      57. | | 7.15.2 BY CAPACITY, 2025-2035 (USD Billion)
      58. | | 7.15.3 BY END-USER, 2025-2035 (USD Billion)
      59. | 7.16 Japan MARKET SIZE ESTIMATES; FORECAST
      60. | | 7.16.1 BY CLOSURE, 2025-2035 (USD Billion)
      61. | | 7.16.2 BY CAPACITY, 2025-2035 (USD Billion)
      62. | | 7.16.3 BY END-USER, 2025-2035 (USD Billion)
      63. | 7.17 South Korea MARKET SIZE ESTIMATES; FORECAST
      64. | | 7.17.1 BY CLOSURE, 2025-2035 (USD Billion)
      65. | | 7.17.2 BY CAPACITY, 2025-2035 (USD Billion)
      66. | | 7.17.3 BY END-USER, 2025-2035 (USD Billion)
      67. | 7.18 Malaysia MARKET SIZE ESTIMATES; FORECAST
      68. | | 7.18.1 BY CLOSURE, 2025-2035 (USD Billion)
      69. | | 7.18.2 BY CAPACITY, 2025-2035 (USD Billion)
      70. | | 7.18.3 BY END-USER, 2025-2035 (USD Billion)
      71. | 7.19 Thailand MARKET SIZE ESTIMATES; FORECAST
      72. | | 7.19.1 BY CLOSURE, 2025-2035 (USD Billion)
      73. | | 7.19.2 BY CAPACITY, 2025-2035 (USD Billion)
      74. | | 7.19.3 BY END-USER, 2025-2035 (USD Billion)
      75. | 7.20 Indonesia MARKET SIZE ESTIMATES; FORECAST
      76. | | 7.20.1 BY CLOSURE, 2025-2035 (USD Billion)
      77. | | 7.20.2 BY CAPACITY, 2025-2035 (USD Billion)
      78. | | 7.20.3 BY END-USER, 2025-2035 (USD Billion)
      79. | 7.21 Rest of APAC MARKET SIZE ESTIMATES; FORECAST
      80. | | 7.21.1 BY CLOSURE, 2025-2035 (USD Billion)
      81. | | 7.21.2 BY CAPACITY, 2025-2035 (USD Billion)
      82. | | 7.21.3 BY END-USER, 2025-2035 (USD Billion)
      83. | 7.22 South America MARKET SIZE ESTIMATES; FORECAST
      84. | | 7.22.1 BY CLOSURE, 2025-2035 (USD Billion)
      85. | | 7.22.2 BY CAPACITY, 2025-2035 (USD Billion)
      86. | | 7.22.3 BY END-USER, 2025-2035 (USD Billion)
      87. | 7.23 Brazil MARKET SIZE ESTIMATES; FORECAST
      88. | | 7.23.1 BY CLOSURE, 2025-2035 (USD Billion)
      89. | | 7.23.2 BY CAPACITY, 2025-2035 (USD Billion)
      90. | | 7.23.3 BY END-USER, 2025-2035 (USD Billion)
      91. | 7.24 Mexico MARKET SIZE ESTIMATES; FORECAST
      92. | | 7.24.1 BY CLOSURE, 2025-2035 (USD Billion)
      93. | | 7.24.2 BY CAPACITY, 2025-2035 (USD Billion)
      94. | | 7.24.3 BY END-USER, 2025-2035 (USD Billion)
      95. | 7.25 Argentina MARKET SIZE ESTIMATES; FORECAST
      96. | | 7.25.1 BY CLOSURE, 2025-2035 (USD Billion)
      97. | | 7.25.2 BY CAPACITY, 2025-2035 (USD Billion)
      98. | | 7.25.3 BY END-USER, 2025-2035 (USD Billion)
      99. | 7.26 Rest of South America MARKET SIZE ESTIMATES; FORECAST
      100. | | 7.26.1 BY CLOSURE, 2025-2035 (USD Billion)
      101. | | 7.26.2 BY CAPACITY, 2025-2035 (USD Billion)
      102. | | 7.26.3 BY END-USER, 2025-2035 (USD Billion)
      103. | 7.27 MEA MARKET SIZE ESTIMATES; FORECAST
      104. | | 7.27.1 BY CLOSURE, 2025-2035 (USD Billion)
      105. | | 7.27.2 BY CAPACITY, 2025-2035 (USD Billion)
      106. | | 7.27.3 BY END-USER, 2025-2035 (USD Billion)
      107. | 7.28 GCC Countries MARKET SIZE ESTIMATES; FORECAST
      108. | | 7.28.1 BY CLOSURE, 2025-2035 (USD Billion)
      109. | | 7.28.2 BY CAPACITY, 2025-2035 (USD Billion)
      110. | | 7.28.3 BY END-USER, 2025-2035 (USD Billion)
      111. | 7.29 South Africa MARKET SIZE ESTIMATES; FORECAST
      112. | | 7.29.1 BY CLOSURE, 2025-2035 (USD Billion)
      113. | | 7.29.2 BY CAPACITY, 2025-2035 (USD Billion)
      114. | | 7.29.3 BY END-USER, 2025-2035 (USD Billion)
      115. | 7.30 Rest of MEA MARKET SIZE ESTIMATES; FORECAST
      116. | | 7.30.1 BY CLOSURE, 2025-2035 (USD Billion)
      117. | | 7.30.2 BY CAPACITY, 2025-2035 (USD Billion)
      118. | | 7.30.3 BY END-USER, 2025-2035 (USD Billion)
      119. | 7.31 PRODUCT LAUNCH/PRODUCT DEVELOPMENT/APPROVAL
      120. | | 7.31.1
      121. | 7.32 ACQUISITION/PARTNERSHIP
      122. | | 7.32.1

    Fiber Drum Closure Outlook (USD Billion, 2018-2032)

    • Metal Closure
    • Plastic Closure
    • Fiber/Cardboard Closure

    Fiber Drum Capacity Outlook (USD Billion, 2018-2032)

    • Up to 25 Gallons
    • 26–50 Gallons
    • 51–75 Gallons
    • Above 75 Gallons

    Fiber Drum End-User Outlook (USD Billion, 2018-2032)

    • Chemical
    • Food & Beverage
    • Pharmaceuticals

    Fiber Drum Regional Outlook (USD Billion, 2018-2032)

    • North America Outlook (USD Billion, 2018-2032)

      • North America Fiber Drum by Closure
        • Metal Closure
        • Plastic Closure
        • Fiber/Cardboard Closure
      • North America Fiber Drum by Capacity
        • Up to 25 Gallons
        • 26–50 Gallons
        • 51–75 Gallons
        • Above 75 Gallons
      • North America Fiber Drum by End-User
        • Chemical
        • Food & Beverage
        • Pharmaceuticals
      • US Outlook (USD Billion, 2018-2032)

      • US Fiber Drum by Closure
        • Metal Closure
        • Plastic Closure
        • Fiber/Cardboard Closure
      • US Fiber Drum by Capacity
        • Up to 25 Gallons
        • 26–50 Gallons
        • 51–75 Gallons
        • Above 75 Gallons
      • US Fiber Drum by End-User
        • Chemical
        • Food & Beverage
        • Pharmaceuticals
      • Canada Outlook (USD Billion, 2018-2032)

      • Canada Fiber Drum by Closure
        • Metal Closure
        • Plastic Closure
        • Fiber/Cardboard Closure
      • Canada Fiber Drum by Capacity
        • Up to 25 Gallons
        • 26–50 Gallons
        • 51–75 Gallons
        • Above 75 Gallons
      • Canada Fiber Drum by End-User
        • Chemical
        • Food & Beverage
        • Pharmaceuticals
    • Europe Outlook (USD Billion, 2018-2032)

      • Europe Fiber Drum by Closure
        • Metal Closure
        • Plastic Closure
        • Fiber/Cardboard Closure
      • Europe Fiber Drum by Capacity
        • Up to 25 Gallons
        • 26–50 Gallons
        • 51–75 Gallons
        • Above 75 Gallons
      • Europe Fiber Drum by End-User
        • Chemical
        • Food & Beverage
        • Pharmaceuticals
      • Germany Outlook (USD Billion, 2018-2032)

      • Germany Fiber Drum by Closure
        • Metal Closure
        • Plastic Closure
        • Fiber/Cardboard Closure
      • Germany Fiber Drum by Capacity
        • Up to 25 Gallons
        • 26–50 Gallons
        • 51–75 Gallons
        • Above 75 Gallons
      • Germany Fiber Drum by End-User
        • Chemical
        • Food & Beverage
        • Pharmaceuticals
      • France Outlook (USD Billion, 2018-2032)

      • France Fiber Drum by Closure
        • Metal Closure
        • Plastic Closure
        • Fiber/Cardboard Closure
      • France Fiber Drum by Capacity
        • Up to 25 Gallons
        • 26–50 Gallons
        • 51–75 Gallons
        • Above 75 Gallons
      • France Fiber Drum by End-User
        • Chemical
        • Food & Beverage
        • Pharmaceuticals
      • UK Outlook (USD Billion, 2018-2032)

      • UK Fiber Drum by Closure
        • Metal Closure
        • Plastic Closure
        • Fiber/Cardboard Closure
      • UK Fiber Drum by Capacity
        • Up to 25 Gallons
        • 26–50 Gallons
        • 51–75 Gallons
        • Above 75 Gallons
      • UK Fiber Drum by End-User
        • Chemical
        • Food & Beverage
        • Pharmaceuticals
      • Italy Outlook (USD Billion, 2018-2032)

      • Italy Fiber Drum by Closure
        • Metal Closure
        • Plastic Closure
        • Fiber/Cardboard Closure
      • Italy Fiber Drum by Capacity
        • Up to 25 Gallons
        • 26–50 Gallons
        • 51–75 Gallons
        • Above 75 Gallons
      • Italy Fiber Drum by End-User
        • Chemical
        • Food & Beverage
        • Pharmaceuticals
      • Spain Outlook (USD Billion, 2018-2032)

      • Spain Fiber Drum by Closure
        • Metal Closure
        • Plastic Closure
        • Fiber/Cardboard Closure
      • Spain Fiber Drum by Capacity
        • Up to 25 Gallons
        • 26–50 Gallons
        • 51–75 Gallons
        • Above 75 Gallons
      • Spain Fiber Drum by End-User

        • Chemical
        • Food & Beverage
        • Pharmaceuticals
      • Rest Of Europe Outlook (USD Billion, 2018-2032)

      • Rest Of Europe Fiber Drum by Closure
        • Metal Closure
        • Plastic Closure
        • Fiber/Cardboard Closure
      • Rest Of Europe Fiber Drum by Capacity
        • Up to 25 Gallons
        • 26–50 Gallons
        • 51–75 Gallons
        • Above 75 Gallons
      • Rest Of Europe Fiber Drum by End-User
        • Chemical
        • Food & Beverage
        • Pharmaceuticals
    • Asia-Pacific Outlook (USD Billion, 2018-2032)

      • Asia-Pacific Fiber Drum by Closure
        • Metal Closure
        • Plastic Closure
        • Fiber/Cardboard Closure
      • Asia-Pacific Fiber Drum by Capacity
        • Up to 25 Gallons
        • 26–50 Gallons
        • 51–75 Gallons
        • Above 75 Gallons
      • Asia-Pacific Fiber Drum by End-User
        • Chemical
        • Food & Beverage
        • Pharmaceuticals
      • China Outlook (USD Billion, 2018-2032)

      • China Fiber Drum by Closure
        • Metal Closure
        • Plastic Closure
        • Fiber/Cardboard Closure
      • China Fiber Drum by Capacity
        • Up to 25 Gallons
        • 26–50 Gallons
        • 51–75 Gallons
        • Above 75 Gallons
      • China Fiber Drum by End-User
        • Chemical
        • Food & Beverage
        • Pharmaceuticals
      • Japan Outlook (USD Billion, 2018-2032)

      • Japan Fiber Drum by Closure
        • Metal Closure
        • Plastic Closure
        • Fiber/Cardboard Closure
      • Japan Fiber Drum by Capacity
        • Up to 25 Gallons
        • 26–50 Gallons
        • 51–75 Gallons
        • Above 75 Gallons
      • Japan Fiber Drum by End-User
        • Chemical
        • Food & Beverage
        • Pharmaceuticals
      • India Outlook (USD Billion, 2018-2032)

      • India Fiber Drum by Closure
        • Metal Closure
        • Plastic Closure
        • Fiber/Cardboard Closure
      • India Fiber Drum by Capacity
        • Up to 25 Gallons
        • 26–50 Gallons
        • 51–75 Gallons
        • Above 75 Gallons
      • India Fiber Drum by End-User
        • Chemical
        • Food & Beverage
        • Pharmaceuticals
      • Australia Outlook (USD Billion, 2018-2032)

      • Australia Fiber Drum by Closure
        • Metal Closure
        • Plastic Closure
        • Fiber/Cardboard Closure
      • Australia Fiber Drum by Capacity
        • Up to 25 Gallons
        • 26–50 Gallons
        • 51–75 Gallons
        • Above 75 Gallons
      • Australia Fiber Drum by End-User
        • Chemical
        • Food & Beverage
        • Pharmaceuticals
      • Rest of Asia-Pacific Outlook (USD Billion, 2018-2032)

      • Rest of Asia-Pacific Fiber Drum by Closure
        • Metal Closure
        • Plastic Closure
        • Fiber/Cardboard Closure
      • Rest of Asia-Pacific Fiber Drum by Capacity
        • Up to 25 Gallons
        • 26–50 Gallons
        • 51–75 Gallons
        • Above 75 Gallons
      • Rest of Asia-Pacific Fiber Drum by End-User
        • Chemical
        • Food & Beverage
        • Pharmaceuticals
    • Rest of the World Outlook (USD Billion, 2018-2032)

      • Rest of the World Fiber Drum by Closure
        • Metal Closure
        • Plastic Closure
        • Fiber/Cardboard Closure
      • Rest of the World Fiber Drum by Capacity
        • Up to 25 Gallons
        • 26–50 Gallons
        • 51–75 Gallons
        • Above 75 Gallons
      • Rest of the World Fiber Drum by End-User
        • Chemical
        • Food & Beverage
        • Pharmaceuticals
      • Middle East Outlook (USD Billion, 2018-2032)

      • Middle East Fiber Drum by Closure
        • Metal Closure
        • Plastic Closure
        • Fiber/Cardboard Closure
      • Middle East Fiber Drum by Capacity
        • Up to 25 Gallons
        • 26–50 Gallons
        • 51–75 Gallons
        • Above 75 Gallons
      • Middle East Fiber Drum by End-User
        • Chemical
        • Food & Beverage
        • Pharmaceuticals
      • Africa Outlook (USD Billion, 2018-2032)

      • Africa Fiber Drum by Closure
        • Metal Closure
        • Plastic Closure
        • Fiber/Cardboard Closure
      • Africa Fiber Drum by Capacity
        • Up to 25 Gallons
        • 26–50 Gallons
        • 51–75 Gallons
        • Above 75 Gallons
      • Africa Fiber Drum by End-User
        • Chemical
        • Food & Beverage
        • Pharmaceuticals
      • Latin America Outlook (USD Billion, 2018-2032)

      • Latin America Fiber Drum by Closure
        • Metal Closure
        • Plastic Closure
        • Fiber/Cardboard Closure
      • Latin America Fiber Drum by Capacity
        • Up to 25 Gallons
        • 26–50 Gallons
        • 51–75 Gallons
        • Above 75 Gallons
      • Latin America Fiber Drum by End-User
        • Chemical
        • Food & Beverage
        • Pharmaceuticals
    Infographic

    Free Sample Request

    Kindly complete the form below to receive a free sample of this Report

    Get Free Sample

    Customer Strories

    “I am very pleased with how market segments have been defined in a relevant way for my purposes (such as "Portable Freezers & refrigerators" and "last-mile"). In general the report is well structured. Thanks very much for your efforts.”

    Victoria Milne

    Founder
    Case Study
    Chemicals and Materials

    Compare Licence

    ×
    Features License Type
    Single User Multiuser License Enterprise User
    Price $4,950 $5,950 $7,250
    Maximum User Access Limit 1 User Upto 10 Users Unrestricted Access Throughout the Organization
    Free Customization
    Direct Access to Analyst
    Deliverable Format
    Platform Access
    Discount on Next Purchase 10% 15% 15%
    Printable Versions