×
  • Cat-intel
  • MedIntelliX
  • Resources
  • About Us
  • Hero Background
    English
    Chinese
    French
    Japanese
    Korean
    German
    Spanish

    Europe PV Inverter Market Analysis

    ID: MRFR/EnP/14674-HCR
    128 Pages
    Garvit Vyas
    October 2025

    Europe PV Inverter Market Research Report Information By Product (String, Micro, Central, Hybrid, and Others), By Phase (Single Phase, Two Phase and Three Phase), By Connectivity (Standalone, On-grid and Battery backup), By Output Power (Up to 1 kW, 1-5kW, 5-30kW, 30-70kW, 70-100kW and Above 100kW), By Output Rating (Up to 250V, 250-330V, 330-415V, 415-600V and More than 600V), By End-user Indu...

    Share:
    Download PDF ×

    We do not share your information with anyone. However, we may send you emails based on your report interest from time to time. You may contact us at any time to opt-out.

    Europe PV Inverter Market Infographic
    Purchase Options

    Market Analysis

    Europe PV Inverter Market (Europe, 2025)

    Introduction

    In Europe, the photovoltaic inverter market is expected to grow significantly as a result of the region’s focus on energy independence and green energy. Demand for photovoltaic (PV) systems, especially in the residential and commercial sectors, is on the rise. The trend is being bolstered by government support, technological developments, and growing awareness of the advantages of solar energy. The photovoltaic inverter is an essential component in the system. It converts the direct current (DC) generated by the solar cells into alternating current (AC) for use in households and industry. The changing relationship between energy generation and consumption in Europe and the innovations in inverter technology will influence the market dynamic and the competitive landscape.

    PESTLE Analysis

    Political
    By the year 2025 the Green Plan of the European Union, aims at reducing by 55% the amount of the emissions of the greenhouse gases as compared with the year ’90, and it is on the basis of this reduction that the promotion of the use of all the forms of energy, especially the solar, is being carried out. For this purpose the European Union has earmarked approximately one thousand billions of re for the promotion of sustainable investments, amongst which is the promotion of the projects and the construction of the solar energy and its related structures. In addition to this, in several of the member States there are in place subsidies and feed-in tariffs, which in Germany for example reach up to eight cents per kilowatt-hour.
    Economic
    The European inverter market is influenced by the general economic climate. The European Commission expects the European economy to grow by 2.1% in 2025. This growth is expected to increase investments in the field of green energy, including inverters. Also, the average price of a solar photovoltaic system in Europe will fall by about 30% from 2020 to 2025. The average cost of a residential photovoltaic system will be about € 1,200 per kW in 2025, which makes solar energy more accessible to consumers and companies.
    Social
    In Europe, the awareness of the need for a change to a sustainable economy has grown dramatically. Recent polls have shown that over 75% of Europeans support a shift to a renewable energy system as a way of combating climate change. It is estimated that by 2025 around 40% of European households will have installed solar systems, which will increase the demand for inverters. The trend towards energy independence is also promoting the installation of inverters and solar panels, as individuals look to reduce their dependence on conventional energy.
    Technological
    The use of inverters is expected to increase the efficiency and performance of the photovoltaic system by 2025. In this case, the average efficiency of the string inverters is expected to reach 98.5%, while the efficiency of the microinverters is expected to reach 97%. The use of smart inverters, which can communicate with the network and optimize energy use, will become more common. By 2025, about one quarter of new photovoltaic systems will have these advanced inverters. This change is expected to increase the overall reliability and functionality of the photovoltaic system.
    Legal
    In 2025, the framework for the European inverter market will be set by the European Commission's Renewable Energy Directive, which stipulates that by then at least 32% of the total energy consumed in the EU must come from renewable sources. The compliance with these regulations is crucial for manufacturers and operators of photovoltaic inverters. In addition, the EU will probably introduce new regulations on energy efficiency and safety. All inverters will have to meet the IEC 62109 safety standard.
    Environmental
    The enviromental impact of photovoltaic inverters is becoming an increasingly important issue, and as the EU strives for a circular economy by 2025, the enviromental impact of PV inverters is becoming an increasingly important issue. To ensure that 85% of waste from photovoltaics is recycled, the enviromental impact of photovoltaic inverters is directly influenced by the disposal of photovoltaic panels. Also, the enviromental impact of manufacturing photovoltaic inverters is being reviewed, with the aim of reducing the CO2 emissions in production by 30 % by 2025. The enviromental benefits of solar energy, a reduction of around one billion tons of CO2 annually in Europe, illustrate the importance of photovoltaic inverters in achieving a circular economy.

    Porter's Five Forces

    Threat of New Entrants
    The barriers to entry in the European PV inverter market in 2025 are moderate. The market is growing due to increasing demand for renewable energy, but the barriers to entry are high, because of the high level of capital investment, the need for high-level technical knowledge and the need to comply with strict regulations. Brand loyalty and customer recognition are high among the established companies, which can deter new entrants. However, technological development and the enabling regulatory environment can encourage new entrants.
    Bargaining Power of Suppliers
    Suppliers have low bargaining power in the Europe PV inverter market due to the presence of many manufacturers and the easy availability of a variety of products. The market is characterized by the presence of a wide range of suppliers offering different components, which limits the influence of any single supplier. Supplier power has also been weakened by the trend toward vertical integration among some manufacturers, as companies seek to reduce their dependence on external suppliers.
    Bargaining Power of Buyers
    The buyers in the Europe photovoltaic inverter market are in a strong position to negotiate due to the increasing number of choices available and the competitive nature of the market. There are many similar products from different suppliers and it is easy to switch suppliers if there are better prices or features. Also, buyers are becoming more informed and demanding as a result of the growing focus on sustainability and energy efficiency, which is strengthening their bargaining position.
    Threat of Substitutes
    The threat of substitutes in the Europe PV inverter market is moderate. There are other energy solutions such as batteries and other alternative energy systems, but the unique function of PV inverters to convert solar energy into usable electricity makes them somewhat unique. However, as technology evolves and new energy solutions emerge, the threat of substitutes will increase, and manufacturers will have to keep up with innovation and differentiation.
    Competitive Rivalry
    Competition in the Europe PV inverter market is intense, mainly because of the presence of many established players and new entrants. The companies compete with one another through aggressive marketing strategies, product innovations, and price competition. The rapid growth of the renewable energy sector and the increasing adoption of solar energy are also increasing the competition. The companies are focusing on developing newer products and improving their customer services to gain a competitive advantage.

    SWOT Analysis

    Strengths

    • Strong regulatory support for renewable energy initiatives across Europe.
    • Technological advancements leading to higher efficiency and lower costs of PV inverters.
    • Growing consumer awareness and demand for sustainable energy solutions.

    Weaknesses

    • High initial investment costs for solar PV systems including inverters.
    • Dependence on government incentives which may fluctuate.
    • Limited availability of skilled labor for installation and maintenance.

    Opportunities

    • Expansion of solar energy projects driven by EU climate goals.
    • Emerging markets within Eastern Europe showing potential for growth.
    • Increased investment in energy storage solutions complementing PV inverter technology.

    Threats

    • Intense competition leading to price wars among manufacturers.
    • Potential supply chain disruptions affecting component availability.
    • Changing regulatory landscapes that could impact market dynamics.

    Summary

    The Europe photovoltaic inverter market will be characterized by strong government support and technological advancements that enhance efficiency and reduce costs. The market will also be constrained by high initial investment costs and a reliance on government subsidies. Opportunities for growth will include new emerging markets and the integration of energy storage solutions. Threats will include intensifying competition and supply disruptions. Strategic focus on innovation and market expansion will be crucial for companies to thrive in this environment.

    Author
    Garvit Vyas
    Analyst

    Explore the profile of Garvit Vyas, one of our esteemed authors at Market Research Future, and access their expert research contributions in the field of market research and industry analysis

    Leave a Comment

    FAQs

    What is the current valuation of the Europe PV Inverter Market as of 2024?

    <p>The overall market valuation was 3.152 USD Billion in 2024.</p>

    What is the projected market size for the Europe PV Inverter Market by 2035?

    <p>The projected valuation for the Europe PV Inverter Market is 9.176 USD Billion by 2035.</p>

    What is the expected CAGR for the Europe PV Inverter Market during the forecast period 2025 - 2035?

    <p>The expected CAGR for the Europe PV Inverter Market during the forecast period 2025 - 2035 is 10.2%.</p>

    Which companies are considered key players in the Europe PV Inverter Market?

    <p>Key players in the market include SMA Solar Technology AG, Fronius International GmbH, SolarEdge Technologies Inc, and Huawei Technologies Co Ltd.</p>

    What are the segment valuations for different product types in the Europe PV Inverter Market?

    <p>Product segment valuations include Micro at 2.2 USD Billion, Central at 2.5 USD Billion, and Hybrid at 1.5 USD Billion.</p>

    How does the output power segment perform in the Europe PV Inverter Market?

    <p>The output power segment shows valuations such as 3.6704 USD Billion for 5-30kW and 2.7528 USD Billion for 30-70kW.</p>

    What is the valuation of the residential end-user industry segment in the Europe PV Inverter Market?

    <p>The residential end-user industry segment is valued at 2.234 USD Billion.</p>

    What are the connectivity options available in the Europe PV Inverter Market?

    <p>Connectivity options include On-grid at 4.688 USD Billion and Battery Backup at 2.51 USD Billion.</p>

    What is the performance of the three-phase segment in the Europe PV Inverter Market?

    <p>The three-phase segment is valued at 4.176 USD Billion, indicating strong market demand.</p>

    Market Summary

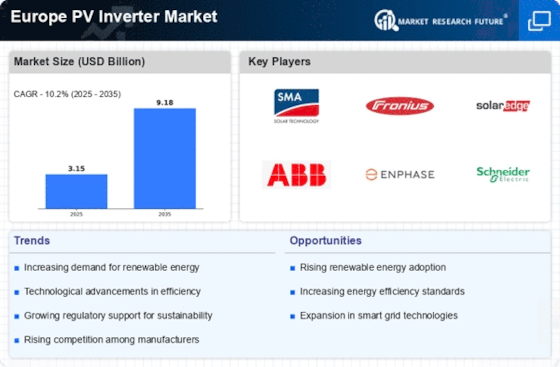
    As per MRFR analysis, the Europe PV Inverter Market Size was estimated at 3.152 USD Billion in 2024. The Europe PV Inverter industry is projected to grow from 3.473 USD Billion in 2025 to 9.176 USD Billion by 2035, exhibiting a compound annual growth rate (CAGR) of 10.2 during the forecast period 2025 - 2035.

    Key Market Trends & Highlights

    The Europe PV Inverter Market is poised for substantial growth driven by technological advancements and regulatory support.

    • Technological advancements in inverter design are enhancing efficiency and performance across the market.
    • Regulatory support is fostering a favorable environment for renewable energy adoption in Europe.
    • The string inverter segment remains the largest, while the micro inverter segment is experiencing rapid growth.
    • Increasing renewable energy adoption and rising energy costs are key drivers propelling market expansion.

    Market Size & Forecast

    2024 Market Size 3.152 (USD Billion)
    2035 Market Size 9.176 (USD Billion)
    CAGR (2025 - 2035) 10.2%
    Largest Regional Market Share in 2024 Europe

    Major Players

    <p>SMA Solar Technology AG (DE), Fronius International GmbH (AT), SolarEdge Technologies Inc (IL), Huawei Technologies Co Ltd (CN), ABB Ltd (CH), Enphase Energy Inc (US), Schneider Electric SE (FR), KACO new energy GmbH (DE), GoodWe Power Supply Technology Co Ltd (CN)</p>

    Market Trends

    The Europe PV Inverter Market is currently experiencing a transformative phase, driven by the increasing adoption of renewable energy sources across the continent. This shift is largely influenced by stringent environmental regulations and a growing awareness of climate change. As nations strive to meet their sustainability goals, the demand for efficient photovoltaic systems is on the rise. Consequently, the role of inverters, which convert solar energy into usable electricity, becomes increasingly critical. Innovations in inverter technology, such as enhanced efficiency and smart grid integration, are shaping the competitive landscape. Moreover, the market appears to be benefiting from advancements in energy storage solutions, which complement solar installations. The integration of battery systems with inverters allows for better energy management and utilization, thus appealing to both residential and commercial sectors. As the Europe PV Inverter Market evolves, it seems poised for further growth, with potential expansions in product offerings and service capabilities. The ongoing investments in research and development may lead to breakthroughs that enhance performance and reduce costs, ultimately fostering wider adoption of solar technologies across Europe.

    Technological Advancements

    The Europe PV Inverter Market is witnessing rapid technological advancements that enhance inverter efficiency and functionality. Innovations such as hybrid inverters and smart inverters are becoming more prevalent, allowing for better integration with energy management systems. These developments not only improve energy conversion rates but also facilitate real-time monitoring and control, which is essential for optimizing solar energy usage.

    Regulatory Support

    Regulatory frameworks across Europe are increasingly supportive of renewable energy initiatives, which positively impacts the PV inverter sector. Governments are implementing policies that promote solar energy adoption, including incentives for installation and usage of efficient inverters. This regulatory backing is likely to stimulate market growth and encourage investments in solar technologies.

    Growing Demand for Energy Storage

    The rising demand for energy storage solutions is significantly influencing the Europe PV Inverter Market. As consumers and businesses seek to maximize their energy independence, the integration of storage systems with solar inverters is becoming more common. This trend not only enhances energy reliability but also allows users to optimize their energy consumption patterns, thereby increasing the overall appeal of solar installations.

    Europe PV Inverter Market Market Drivers

    Supportive Regulatory Frameworks

    The Europe PV Inverter Market benefits from a robust regulatory framework that encourages the deployment of solar technologies. Various European nations have implemented policies and incentives aimed at promoting solar energy installations, including feed-in tariffs and tax credits. The European Union's commitment to achieving climate neutrality by 2050 further solidifies the importance of solar energy, with specific targets set for renewable energy contributions. This regulatory support not only stimulates market growth but also fosters innovation in PV inverter technologies, ensuring that they meet the evolving demands of the energy landscape.

    Increasing Renewable Energy Adoption

    The Europe PV Inverter Market is experiencing a notable surge due to the increasing adoption of renewable energy sources across the continent. Governments and private sectors are investing heavily in solar energy projects, driven by the need to reduce carbon emissions and combat climate change. In 2025, solar energy is projected to account for a significant portion of the energy mix in Europe, with estimates suggesting that solar capacity could reach over 300 GW. This growing capacity necessitates advanced PV inverters to optimize energy conversion and enhance system efficiency, thereby propelling the market forward.

    Growing Interest in Energy Storage Solutions

    The Europe PV Inverter Market is witnessing a growing interest in energy storage solutions, which are increasingly being paired with solar installations. As the need for reliable and consistent energy supply rises, the integration of battery storage systems with PV inverters is becoming more common. This trend is driven by advancements in battery technology and decreasing costs, making energy storage more accessible. In 2025, it is projected that the combination of PV inverters and energy storage will enhance the overall efficiency of solar energy systems, thereby attracting more consumers to invest in renewable energy.

    Technological Innovations in Inverter Design

    Technological advancements in inverter design are significantly influencing the Europe PV Inverter Market. Innovations such as smart inverters, which incorporate advanced features like grid support and real-time monitoring, are becoming increasingly prevalent. These technologies enhance the efficiency and reliability of solar energy systems, making them more attractive to consumers and investors alike. In 2025, it is anticipated that the market will see a rise in the adoption of these sophisticated inverters, driven by their ability to optimize energy production and facilitate integration with energy storage solutions.

    Rising Energy Costs and Demand for Efficiency

    The Europe PV Inverter Market is also driven by rising energy costs and an increasing demand for energy efficiency. As traditional energy prices fluctuate, consumers and businesses are seeking alternative energy solutions that offer cost savings and sustainability. The integration of PV inverters in solar energy systems allows for greater energy independence and reduced reliance on grid electricity. In 2025, the demand for efficient energy solutions is expected to grow, further propelling the adoption of PV inverters as a viable option for both residential and commercial applications.

    Market Segment Insights

    By Product: String (Largest) vs. Micro (Fastest-Growing)

    <p>In the Europe PV Inverter Market, the market share distribution reveals that the String inverter segment holds the largest proportion, predominantly due to its widespread adoption in residential and commercial solar projects. String inverters are favored for their cost-effectiveness and ease of installation, making them a preferred choice among installers and consumers alike. Meanwhile, the Micro inverter segment is emerging as a significant player, experiencing rapid growth as consumers seek optimized energy production and panel-level monitoring capabilities. The growth trends in this segment are influenced by several factors, including government incentives for solar adoption, advancements in inverter technology, and rising awareness of renewable energy benefits. The increasing demand for distributed generation systems has propelled the popularity of Micro inverters, as they offer enhanced performance in partially shaded conditions. Additionally, the trend towards energy independence among consumers is driving the shift towards Hybrid inverters, which combine functionalities from different inverter types to optimize energy consumption and storage.</p>

    <p>String (Dominant) vs. Micro (Emerging)</p>

    <p>The String inverter segment remains dominant in the Europe PV Inverter Market, recognized for its reliability and efficiency in converting solar energy into usable electricity. These inverters connect multiple solar panels in series, providing a balanced performance suitable for various applications. Their established presence is supported by extensive adoption across residential rooftops and commercial solar farms, where cost efficiency is a significant consideration. In contrast, Micro inverters are gaining traction as an emerging technology. They are installed on each solar panel individually, allowing for superior energy harvesting and monitoring capabilities. This technology is particularly advantageous in scenarios with shading or varying panel orientations, leading to increased energy output and system reliability for users.</p>

    By Phase: Three Phase (Largest) vs. Single Phase (Fastest-Growing)

    <p>In the Europe PV Inverter Market, the distribution among the three phase, single phase, and two phase segment values reveals a clear hierarchy in market dominance. The three phase inverters hold a significant share, primarily due to their efficiency and suitability for larger installations, making them a preferred choice for commercial and utility-scale applications. On the other hand, the single phase inverters, while currently less dominant, are witnessing a surge in interest among residential customers, contributing to a shifting landscape in market preferences. As the market evolves, two phase inverters remain a niche segment, catering to specific applications that require a balance between performance and cost. Growth trends indicate a robust increase in the demand for single phase inverters, attributed to the rising number of residential solar installations across Europe. This segment is largely driven by the increased focus on renewable energy and favorable government policies. In contrast, three phase inverters are benefiting from advancements in technology and the need for higher efficiency in larger scale projects. The emergence of smart inverters further enhances the growth prospects for this segment, as they offer enhanced functionalities such as grid support and energy management capabilities, appealing to a diverse range of end-users.</p>

    <p>Three Phase (Dominant) vs. Single Phase (Emerging)</p>

    <p>Three phase inverters are characterized by their ability to handle higher power outputs and deliver enhanced performance, making them the dominant choice for large-scale installations such as commercial and industrial solar projects. Known for their efficiency, they minimize energy losses and provide better load balancing, which is critical in extensive setups. In contrast, single phase inverters, although previously regarded as more basic units for residential applications, are emerging rapidly due to rising consumer awareness and the increasing affordability of solar technologies. As more homeowners transition to solar energy, the demand for single phase inverters is surging, positioning them as an emerging preference in the European market, reflecting shifting consumer dynamics and energy efficiency goals.</p>

    By Connectivity: On-grid (Largest) vs. Battery Backup (Fastest-Growing)

    <p>In the Europe PV Inverter Market, connectivity options exhibit diverse applications, with the on-grid segment taking the lead by commanding the largest share due to its ability to efficiently connect solar systems to the main power grid. This connectivity allows for seamless energy flow and utilization, making it the predominant choice for residential and commercial installations. Conversely, the battery backup segment is catching up quickly, enjoying significant growth as consumers become increasingly aware of energy resilience and storage solutions in their energy plans.</p>

    <p>Connectivity: On-grid (Dominant) vs. Battery Backup (Emerging)</p>

    <p>The On-grid connectivity segment is characterized by its established infrastructure and cost-effectiveness, allowing users to benefit from real-time electricity access and lower electricity bills. This segment appeals significantly to users looking for integration with the grid, providing a straightforward solution for solar energy consumption. On the other hand, Battery Backup systems are emerging stronger, driven by innovations in battery technology and increasing demand for energy independence among consumers. This segment caters to a niche but growing market segment of users who prioritize energy security, especially in areas prone to outages. The rapid advancements in battery efficiency and reductions in costs further bolster this segment's growth.</p>

    By Output Power: 1-5kW (Largest) vs. 5-30kW (Fastest-Growing)

    <p>In the Europe PV Inverter Market, the output power segment is characterized by diverse performance levels, with the '1-5kW' category capturing the largest share. This dominance can be attributed to its suitability for residential applications and small-scale installations. The '5-30kW' segment is noted for being the fastest-growing, driven by the increasing demand for commercial installations and the trend toward greater energy efficiency.</p>

    <p>Output Power: 1-5kW (Dominant) vs. 5-30kW (Emerging)</p>

    <p>The '1-5kW' output power segment is predominantly favored for its versatility and compatibility with residential solar systems, allowing homeowners to adopt renewable energy solutions easily. This segment leads the market due to its widespread applicability and affordability. Conversely, the '5-30kW' segment is emerging rapidly, appealing to medium-sized commercial enterprises seeking reliable performance. With advancements in technology and increasing awareness of sustainability, this segment is attracting investments, making it a pivotal area for future growth.</p>

    By Output Rating: Up to 250V (Largest) vs. 250-330V (Fastest-Growing)

    <p>In the Europe PV Inverter Market, the output rating segment is primarily characterized by diverse voltage ranges, where 'Up to 250V' holds the largest market share, followed closely by '250-330V'. The demand for these lower voltage segments is driven by residential and small commercial applications due to their efficiency and affordability. As consumer preferences shift towards more compact and sustainable solutions, these two segments continue to dominate the market landscape, reflecting a trend towards accessibility in solar energy options. On the other hand, the segment of '250-330V' is recognized as the fastest-growing output range, largely due to the increasing integration of renewable energy sources into grid systems. The adaptability of inverters in this range encourages usage in varied applications, including larger residential installations and commercial setups. Innovations in technology and enhanced inverter features are also fueling the growth of this segment, as consumers look for reliable and efficient energy solutions.</p>

    <p>Output Rating: Up to 250V (Dominant) vs. 330-415V (Emerging)</p>

    <p>The 'Up to 250V' output rating segment remains dominant in the Europe PV Inverter Market, appealing to individuals and businesses seeking cost-effective and efficient solar solutions. Typically utilized in small-scale residential PV installations, inverters in this segment are characterized by their user-friendliness and compact designs. Meanwhile, the '330-415V' output range is emerging as a formidable competitor, primarily fueled by its application in larger commercial setups and utility-scale projects. While these inverters are generally more expensive, their ability to handle higher loads and deliver enhanced performance makes them increasingly attractive for modern energy demands. The continual advancements in inverter technology, such as improved power conversion efficiencies and smart functionalities, position this emerging segment as a viable alternative for customers seeking scalability and maximum energy output.</p>

    By End-user Industry: Residential (Largest) vs. Commercial (Fastest-Growing)

    <p>In the Europe PV inverter market, the end-user industry segment is crucial as it reveals consumer preferences and usage patterns. The residential segment holds the largest market share due to the increasing adoption of solar energy solutions by homeowners seeking sustainability and energy independence. In contrast, the commercial segment is rapidly gaining traction, benefitting from corporate sustainability initiatives and favorable policies promoting solar energy use in businesses. Growth trends indicate that demand for PV inverters is expanding across all end-user segments. The residential sector thrives as consumers invest in renewable energy technologies amid rising electricity costs. The commercial sector, labeled as the fastest-growing segment, is propelled by the need for businesses to reduce operational costs and meet regulatory targets for carbon emissions. This dynamic is supported by advancements in solar technology that improve efficiency and lower installation costs, appealing to both segments.</p>

    <p>Residential (Dominant) vs. Utility (Emerging)</p>

    <p>In the Europe PV inverter market, the residential segment is distinctly dominant, characterized by a significant uptake among homeowners who prioritize energy independence and sustainability. This segment benefits from governmental incentives and financing options, making solar installations more accessible. In contrast, the utility segment, while emerging, is becoming increasingly significant as energy providers shift towards renewable sources. Utilities recognize the long-term benefits of integrating solar energy into their portfolios, driven by regulatory pressures and a global push towards decarbonization. Both segments face unique challenges: while residential installations can be influenced by consumer behavior, utility projects require substantial capital investment and coordination with grid infrastructure. As these segments evolve, their interdependence is likely to shape the future landscape of the PV inverter market in Europe.</p>

    Get more detailed insights about Europe PV Inverter Market Research Report – Forecast till 2035

    Regional Insights

    North America : Renewable Energy Leader

    The North American PV inverter market is driven by increasing investments in renewable energy and supportive government policies. The U.S. is the largest market, holding approximately 70% of the regional share, followed by Canada with around 20%. The push for energy independence and sustainability is fueling demand for solar technologies, including inverters, as states implement stricter renewable energy mandates. Key players in this market include Enphase Energy and SolarEdge Technologies, which dominate the landscape with innovative products. The competitive environment is characterized by rapid technological advancements and a focus on efficiency and reliability. As the market matures, partnerships and collaborations among manufacturers and installers are becoming more common, enhancing service delivery and customer satisfaction.

    Europe : Innovation and Sustainability Hub

    Europe is witnessing a significant surge in the PV inverter market, driven by ambitious renewable energy targets and regulatory frameworks. Germany and France are the largest markets, accounting for approximately 35% and 25% of the regional share, respectively. The European Green Deal and national policies are catalyzing investments in solar energy, leading to increased demand for efficient inverter technologies. Leading countries like Germany, France, and Italy are home to key players such as SMA Solar Technology and Fronius International. The competitive landscape is marked by innovation, with companies focusing on smart inverter technologies and grid integration solutions. The presence of established manufacturers and a growing number of startups is fostering a dynamic market environment, enhancing the region's position as a global leader in solar energy solutions.

    Asia-Pacific : Emerging Market Potential

    The Asia-Pacific region is rapidly emerging as a significant player in the PV inverter market, driven by increasing energy demands and government initiatives promoting solar energy. China is the largest market, holding approximately 60% of the regional share, followed by Japan with around 15%. The region's focus on reducing carbon emissions and enhancing energy security is propelling investments in solar technologies, including inverters. Countries like India and Australia are also witnessing substantial growth, with a rising number of solar installations. The competitive landscape features major players such as Huawei and GoodWe, who are innovating to meet the diverse needs of the market. The presence of local manufacturers and international companies is fostering a competitive environment, driving advancements in inverter technology and efficiency.

    Middle East and Africa : Resource-Rich Opportunities

    The Middle East and Africa region is beginning to tap into its vast solar potential, with the PV inverter market gaining traction due to favorable climatic conditions and increasing energy needs. The United Arab Emirates and South Africa are the largest markets, holding approximately 40% and 25% of the regional share, respectively. Government initiatives and international investments are catalyzing the growth of solar energy projects, leading to a rising demand for efficient inverter solutions. Countries like Saudi Arabia and Kenya are also emerging as key players in the solar landscape. The competitive environment is characterized by a mix of local and international companies, with a focus on cost-effective and reliable inverter technologies. As the region continues to develop its renewable energy infrastructure, the demand for innovative solar solutions is expected to grow significantly.

    Key Players and Competitive Insights

    The Europe PV Inverter Market is currently characterized by a dynamic competitive landscape, driven by increasing demand for renewable energy solutions and stringent regulatory frameworks aimed at reducing carbon emissions. Key players such as SMA Solar Technology AG (DE), SolarEdge Technologies Inc (IL), and Huawei Technologies Co Ltd (CN) are strategically positioned to leverage their technological advancements and market expertise. SMA Solar Technology AG (DE) focuses on innovation in energy management systems, while SolarEdge Technologies Inc (IL) emphasizes its cutting-edge optimization technologies. Meanwhile, Huawei Technologies Co Ltd (CN) is expanding its footprint through aggressive investments in R&D and partnerships, collectively shaping a competitive environment that prioritizes technological superiority and market responsiveness.

    In terms of business tactics, companies are increasingly localizing manufacturing to mitigate supply chain disruptions and enhance responsiveness to regional market demands. The competitive structure of the Europe PV Inverter Market appears moderately fragmented, with several players vying for market share. This fragmentation is indicative of a landscape where innovation and customer-centric solutions are paramount, allowing key players to exert considerable influence over market dynamics.

    In August 2025, SMA Solar Technology AG (DE) announced the launch of its new generation of inverters designed specifically for large-scale solar projects. This strategic move is significant as it positions the company to capture a larger share of the utility-scale segment, which is expected to grow substantially in the coming years. By enhancing its product offerings, SMA aims to solidify its leadership in the market and respond effectively to the increasing demand for efficient energy solutions.

    In September 2025, SolarEdge Technologies Inc (IL) unveiled a partnership with a leading European energy provider to integrate its inverter technology with smart grid solutions. This collaboration is noteworthy as it not only enhances SolarEdge's product portfolio but also aligns with the growing trend of digitalization in the energy sector. By integrating advanced inverter technology with smart grid capabilities, SolarEdge is likely to improve energy management and efficiency for its customers, thereby reinforcing its competitive edge.

    In July 2025, Huawei Technologies Co Ltd (CN) expanded its European operations by establishing a new manufacturing facility in Germany. This strategic investment is indicative of Huawei's commitment to localizing production and enhancing supply chain reliability. By establishing a manufacturing base within Europe, Huawei aims to reduce lead times and improve service delivery, which could significantly bolster its competitive position in the region.

    As of October 2025, the competitive trends in the Europe PV Inverter Market are increasingly defined by digitalization, sustainability, and the integration of artificial intelligence. Strategic alliances are becoming more prevalent, as companies recognize the value of collaboration in driving innovation and enhancing market reach. Looking ahead, it appears that competitive differentiation will evolve from traditional price-based competition to a focus on technological innovation, reliability in supply chains, and the ability to deliver sustainable energy solutions. This shift underscores the importance of adaptability and forward-thinking strategies in navigating the complexities of the evolving energy landscape.

    Key Companies in the Europe PV Inverter Market market include

    Industry Developments

    • Q2 2025: Restrict Remote Access of PV Inverters from High-Risk Vendors On April 30, 2025, the ESMC issued a warning about cybersecurity risks posed by remote access capabilities in PV inverters from non-European manufacturers, particularly those from China, highlighting the potential for deliberate interference or mass shutdowns in Europe's electricity infrastructure.

    Future Outlook

    Europe PV Inverter Market Future Outlook

    <p>The Europe PV Inverter Market is poised for growth at a 10.2% CAGR from 2024 to 2035, driven by renewable energy policies, technological advancements, and increasing energy demands.</p>

    New opportunities lie in:

    • <p>Expansion into energy storage integration solutions</p>
    • <p>Development of smart inverter technologies for grid management</p>
    • <p>Partnerships with electric vehicle manufacturers for charging infrastructure</p>

    <p>By 2035, the market is expected to solidify its position as a leader in renewable energy solutions.</p>

    Market Segmentation

    Europe PV Inverter Market Phase Outlook

    • Single Phase
    • Two Phase
    • Three Phase

    Europe PV Inverter Market Product Outlook

    • String
    • Micro
    • Central
    • Hybrid
    • Others

    Europe PV Inverter Market Connectivity Outlook

    • Standalone
    • On-grid
    • Battery Backup

    Europe PV Inverter Market Output Power Outlook

    • Up to 1 kW
    • 1-5kW
    • 5-30kW
    • 30-70kW
    • 70-100kW
    • Above 100kW

    Europe PV Inverter Market Output Rating Outlook

    • Up to 250V
    • 250-330V
    • 330-415V
    • 415-600V
    • More than 600V

    Europe PV Inverter Market End-user Industry Outlook

    • Residential
    • Commercial
    • Industrial
    • Utility

    Report Scope

    MARKET SIZE 20243.152(USD Billion)
    MARKET SIZE 20253.473(USD Billion)
    MARKET SIZE 20359.176(USD Billion)
    COMPOUND ANNUAL GROWTH RATE (CAGR)10.2% (2024 - 2035)
    REPORT COVERAGERevenue Forecast, Competitive Landscape, Growth Factors, and Trends
    BASE YEAR2024
    Market Forecast Period2025 - 2035
    Historical Data2019 - 2024
    Market Forecast UnitsUSD Billion
    Key Companies ProfiledMarket analysis in progress
    Segments CoveredMarket segmentation analysis in progress
    Key Market OpportunitiesIntegration of smart grid technologies enhances efficiency in the Europe PV Inverter Market.
    Key Market DynamicsRising demand for renewable energy drives innovation and competition in the Europe PV Inverter Market.
    Countries CoveredNorth America, Europe, APAC, South America, MEA

    FAQs

    What is the current valuation of the Europe PV Inverter Market as of 2024?

    <p>The overall market valuation was 3.152 USD Billion in 2024.</p>

    What is the projected market size for the Europe PV Inverter Market by 2035?

    <p>The projected valuation for the Europe PV Inverter Market is 9.176 USD Billion by 2035.</p>

    What is the expected CAGR for the Europe PV Inverter Market during the forecast period 2025 - 2035?

    <p>The expected CAGR for the Europe PV Inverter Market during the forecast period 2025 - 2035 is 10.2%.</p>

    Which companies are considered key players in the Europe PV Inverter Market?

    <p>Key players in the market include SMA Solar Technology AG, Fronius International GmbH, SolarEdge Technologies Inc, and Huawei Technologies Co Ltd.</p>

    What are the segment valuations for different product types in the Europe PV Inverter Market?

    <p>Product segment valuations include Micro at 2.2 USD Billion, Central at 2.5 USD Billion, and Hybrid at 1.5 USD Billion.</p>

    How does the output power segment perform in the Europe PV Inverter Market?

    <p>The output power segment shows valuations such as 3.6704 USD Billion for 5-30kW and 2.7528 USD Billion for 30-70kW.</p>

    What is the valuation of the residential end-user industry segment in the Europe PV Inverter Market?

    <p>The residential end-user industry segment is valued at 2.234 USD Billion.</p>

    What are the connectivity options available in the Europe PV Inverter Market?

    <p>Connectivity options include On-grid at 4.688 USD Billion and Battery Backup at 2.51 USD Billion.</p>

    What is the performance of the three-phase segment in the Europe PV Inverter Market?

    <p>The three-phase segment is valued at 4.176 USD Billion, indicating strong market demand.</p>

    1. SECTION I: EXECUTIVE SUMMARY AND KEY HIGHLIGHTS
      1. EXECUTIVE SUMMARY
        1. Market Overview
        2. Key Findings
        3. Market Segmentation
        4. Competitive Landscape
        5. Challenges and Opportunities
        6. Future Outlook
    2. SECTION II: SCOPING, METHODOLOGY AND MARKET STRUCTURE
      1. MARKET INTRODUCTION
        1. Definition
        2. Scope of the study
      2. RESEARCH METHODOLOGY
        1. Overview
        2. Data Mining
        3. Secondary Research
        4. Primary Research
        5. Forecasting Model
        6. Market Size Estimation
        7. Data Triangulation
        8. Validation
    3. SECTION III: QUALITATIVE ANALYSIS
      1. MARKET DYNAMICS
        1. Overview
        2. Drivers
        3. Restraints
        4. Opportunities
      2. MARKET FACTOR ANALYSIS
        1. Value chain Analysis
        2. Porter's Five Forces Analysis
        3. COVID-19 Impact Analysis
    4. SECTION IV: QUANTITATIVE ANALYSIS
      1. Energy & Power, BY Product (USD Billion)
        1. String
        2. Micro
        3. Central
        4. Hybrid
        5. Others
      2. Energy & Power, BY Phase (USD Billion)
        1. Single Phase
        2. Two Phase
        3. Three Phase
      3. Energy & Power, BY Connectivity (USD Billion)
        1. Standalone
        2. On-grid
        3. Battery Backup
      4. Energy & Power, BY Output Power (USD Billion)
        1. Up to 1 kW
        2. 1-5kW
        3. 5-30kW
        4. 30-70kW
        5. 70-100kW
        6. Above 100kW
      5. Energy & Power, BY Output Rating (USD Billion)
        1. Up to 250V
        2. 250-330V
        3. 330-415V
        4. 415-600V
        5. More than 600V
      6. Energy & Power, BY End-user Industry (USD Billion)
        1. Residential
        2. Commercial
        3. Industrial
        4. Utility
      7. Energy & Power, BY Region (USD Billion)
        1. North America
        2. Europe
        3. APAC
        4. South America
        5. MEA
    5. SECTION V: COMPETITIVE ANALYSIS
      1. Competitive Landscape
        1. Overview
        2. Competitive Analysis
        3. Market share Analysis
        4. Major Growth Strategy in the Energy & Power
        5. Competitive Benchmarking
        6. Leading Players in Terms of Number of Developments in the Energy & Power
        7. Key developments and growth strategies
        8. Major Players Financial Matrix
      2. Company Profiles
        1. SMA Solar Technology AG (DE)
        2. Fronius International GmbH (AT)
        3. SolarEdge Technologies Inc (IL)
        4. Huawei Technologies Co Ltd (CN)
        5. ABB Ltd (CH)
        6. Enphase Energy Inc (US)
        7. Schneider Electric SE (FR)
        8. KACO new energy GmbH (DE)
        9. GoodWe Power Supply Technology Co Ltd (CN)
      3. Appendix
        1. References
        2. Related Reports
    6. LIST OF FIGURES
      1. MARKET SYNOPSIS
      2. NORTH AMERICA MARKET ANALYSIS
      3. US MARKET ANALYSIS BY PRODUCT
      4. US MARKET ANALYSIS BY PHASE
      5. US MARKET ANALYSIS BY CONNECTIVITY
      6. US MARKET ANALYSIS BY OUTPUT POWER
      7. US MARKET ANALYSIS BY OUTPUT RATING
      8. US MARKET ANALYSIS BY END-USER INDUSTRY
      9. CANADA MARKET ANALYSIS BY PRODUCT
      10. CANADA MARKET ANALYSIS BY PHASE
      11. CANADA MARKET ANALYSIS BY CONNECTIVITY
      12. CANADA MARKET ANALYSIS BY OUTPUT POWER
      13. CANADA MARKET ANALYSIS BY OUTPUT RATING
      14. CANADA MARKET ANALYSIS BY END-USER INDUSTRY
      15. EUROPE MARKET ANALYSIS
      16. GERMANY MARKET ANALYSIS BY PRODUCT
      17. GERMANY MARKET ANALYSIS BY PHASE
      18. GERMANY MARKET ANALYSIS BY CONNECTIVITY
      19. GERMANY MARKET ANALYSIS BY OUTPUT POWER
      20. GERMANY MARKET ANALYSIS BY OUTPUT RATING
      21. GERMANY MARKET ANALYSIS BY END-USER INDUSTRY
      22. UK MARKET ANALYSIS BY PRODUCT
      23. UK MARKET ANALYSIS BY PHASE
      24. UK MARKET ANALYSIS BY CONNECTIVITY
      25. UK MARKET ANALYSIS BY OUTPUT POWER
      26. UK MARKET ANALYSIS BY OUTPUT RATING
      27. UK MARKET ANALYSIS BY END-USER INDUSTRY
      28. FRANCE MARKET ANALYSIS BY PRODUCT
      29. FRANCE MARKET ANALYSIS BY PHASE
      30. FRANCE MARKET ANALYSIS BY CONNECTIVITY
      31. FRANCE MARKET ANALYSIS BY OUTPUT POWER
      32. FRANCE MARKET ANALYSIS BY OUTPUT RATING
      33. FRANCE MARKET ANALYSIS BY END-USER INDUSTRY
      34. RUSSIA MARKET ANALYSIS BY PRODUCT
      35. RUSSIA MARKET ANALYSIS BY PHASE
      36. RUSSIA MARKET ANALYSIS BY CONNECTIVITY
      37. RUSSIA MARKET ANALYSIS BY OUTPUT POWER
      38. RUSSIA MARKET ANALYSIS BY OUTPUT RATING
      39. RUSSIA MARKET ANALYSIS BY END-USER INDUSTRY
      40. ITALY MARKET ANALYSIS BY PRODUCT
      41. ITALY MARKET ANALYSIS BY PHASE
      42. ITALY MARKET ANALYSIS BY CONNECTIVITY
      43. ITALY MARKET ANALYSIS BY OUTPUT POWER
      44. ITALY MARKET ANALYSIS BY OUTPUT RATING
      45. ITALY MARKET ANALYSIS BY END-USER INDUSTRY
      46. SPAIN MARKET ANALYSIS BY PRODUCT
      47. SPAIN MARKET ANALYSIS BY PHASE
      48. SPAIN MARKET ANALYSIS BY CONNECTIVITY
      49. SPAIN MARKET ANALYSIS BY OUTPUT POWER
      50. SPAIN MARKET ANALYSIS BY OUTPUT RATING
      51. SPAIN MARKET ANALYSIS BY END-USER INDUSTRY
      52. REST OF EUROPE MARKET ANALYSIS BY PRODUCT
      53. REST OF EUROPE MARKET ANALYSIS BY PHASE
      54. REST OF EUROPE MARKET ANALYSIS BY CONNECTIVITY
      55. REST OF EUROPE MARKET ANALYSIS BY OUTPUT POWER
      56. REST OF EUROPE MARKET ANALYSIS BY OUTPUT RATING
      57. REST OF EUROPE MARKET ANALYSIS BY END-USER INDUSTRY
      58. APAC MARKET ANALYSIS
      59. CHINA MARKET ANALYSIS BY PRODUCT
      60. CHINA MARKET ANALYSIS BY PHASE
      61. CHINA MARKET ANALYSIS BY CONNECTIVITY
      62. CHINA MARKET ANALYSIS BY OUTPUT POWER
      63. CHINA MARKET ANALYSIS BY OUTPUT RATING
      64. CHINA MARKET ANALYSIS BY END-USER INDUSTRY
      65. INDIA MARKET ANALYSIS BY PRODUCT
      66. INDIA MARKET ANALYSIS BY PHASE
      67. INDIA MARKET ANALYSIS BY CONNECTIVITY
      68. INDIA MARKET ANALYSIS BY OUTPUT POWER
      69. INDIA MARKET ANALYSIS BY OUTPUT RATING
      70. INDIA MARKET ANALYSIS BY END-USER INDUSTRY
      71. JAPAN MARKET ANALYSIS BY PRODUCT
      72. JAPAN MARKET ANALYSIS BY PHASE
      73. JAPAN MARKET ANALYSIS BY CONNECTIVITY
      74. JAPAN MARKET ANALYSIS BY OUTPUT POWER
      75. JAPAN MARKET ANALYSIS BY OUTPUT RATING
      76. JAPAN MARKET ANALYSIS BY END-USER INDUSTRY
      77. SOUTH KOREA MARKET ANALYSIS BY PRODUCT
      78. SOUTH KOREA MARKET ANALYSIS BY PHASE
      79. SOUTH KOREA MARKET ANALYSIS BY CONNECTIVITY
      80. SOUTH KOREA MARKET ANALYSIS BY OUTPUT POWER
      81. SOUTH KOREA MARKET ANALYSIS BY OUTPUT RATING
      82. SOUTH KOREA MARKET ANALYSIS BY END-USER INDUSTRY
      83. MALAYSIA MARKET ANALYSIS BY PRODUCT
      84. MALAYSIA MARKET ANALYSIS BY PHASE
      85. MALAYSIA MARKET ANALYSIS BY CONNECTIVITY
      86. MALAYSIA MARKET ANALYSIS BY OUTPUT POWER
      87. MALAYSIA MARKET ANALYSIS BY OUTPUT RATING
      88. MALAYSIA MARKET ANALYSIS BY END-USER INDUSTRY
      89. THAILAND MARKET ANALYSIS BY PRODUCT
      90. THAILAND MARKET ANALYSIS BY PHASE
      91. THAILAND MARKET ANALYSIS BY CONNECTIVITY
      92. THAILAND MARKET ANALYSIS BY OUTPUT POWER
      93. THAILAND MARKET ANALYSIS BY OUTPUT RATING
      94. THAILAND MARKET ANALYSIS BY END-USER INDUSTRY
      95. INDONESIA MARKET ANALYSIS BY PRODUCT
      96. INDONESIA MARKET ANALYSIS BY PHASE
      97. INDONESIA MARKET ANALYSIS BY CONNECTIVITY
      98. INDONESIA MARKET ANALYSIS BY OUTPUT POWER
      99. INDONESIA MARKET ANALYSIS BY OUTPUT RATING
      100. INDONESIA MARKET ANALYSIS BY END-USER INDUSTRY
      101. REST OF APAC MARKET ANALYSIS BY PRODUCT
      102. REST OF APAC MARKET ANALYSIS BY PHASE
      103. REST OF APAC MARKET ANALYSIS BY CONNECTIVITY
      104. REST OF APAC MARKET ANALYSIS BY OUTPUT POWER
      105. REST OF APAC MARKET ANALYSIS BY OUTPUT RATING
      106. REST OF APAC MARKET ANALYSIS BY END-USER INDUSTRY
      107. SOUTH AMERICA MARKET ANALYSIS
      108. BRAZIL MARKET ANALYSIS BY PRODUCT
      109. BRAZIL MARKET ANALYSIS BY PHASE
      110. BRAZIL MARKET ANALYSIS BY CONNECTIVITY
      111. BRAZIL MARKET ANALYSIS BY OUTPUT POWER
      112. BRAZIL MARKET ANALYSIS BY OUTPUT RATING
      113. BRAZIL MARKET ANALYSIS BY END-USER INDUSTRY
      114. MEXICO MARKET ANALYSIS BY PRODUCT
      115. MEXICO MARKET ANALYSIS BY PHASE
      116. MEXICO MARKET ANALYSIS BY CONNECTIVITY
      117. MEXICO MARKET ANALYSIS BY OUTPUT POWER
      118. MEXICO MARKET ANALYSIS BY OUTPUT RATING
      119. MEXICO MARKET ANALYSIS BY END-USER INDUSTRY
      120. ARGENTINA MARKET ANALYSIS BY PRODUCT
      121. ARGENTINA MARKET ANALYSIS BY PHASE
      122. ARGENTINA MARKET ANALYSIS BY CONNECTIVITY
      123. ARGENTINA MARKET ANALYSIS BY OUTPUT POWER
      124. ARGENTINA MARKET ANALYSIS BY OUTPUT RATING
      125. ARGENTINA MARKET ANALYSIS BY END-USER INDUSTRY
      126. REST OF SOUTH AMERICA MARKET ANALYSIS BY PRODUCT
      127. REST OF SOUTH AMERICA MARKET ANALYSIS BY PHASE
      128. REST OF SOUTH AMERICA MARKET ANALYSIS BY CONNECTIVITY
      129. REST OF SOUTH AMERICA MARKET ANALYSIS BY OUTPUT POWER
      130. REST OF SOUTH AMERICA MARKET ANALYSIS BY OUTPUT RATING
      131. REST OF SOUTH AMERICA MARKET ANALYSIS BY END-USER INDUSTRY
      132. MEA MARKET ANALYSIS
      133. GCC COUNTRIES MARKET ANALYSIS BY PRODUCT
      134. GCC COUNTRIES MARKET ANALYSIS BY PHASE
      135. GCC COUNTRIES MARKET ANALYSIS BY CONNECTIVITY
      136. GCC COUNTRIES MARKET ANALYSIS BY OUTPUT POWER
      137. GCC COUNTRIES MARKET ANALYSIS BY OUTPUT RATING
      138. GCC COUNTRIES MARKET ANALYSIS BY END-USER INDUSTRY
      139. SOUTH AFRICA MARKET ANALYSIS BY PRODUCT
      140. SOUTH AFRICA MARKET ANALYSIS BY PHASE
      141. SOUTH AFRICA MARKET ANALYSIS BY CONNECTIVITY
      142. SOUTH AFRICA MARKET ANALYSIS BY OUTPUT POWER
      143. SOUTH AFRICA MARKET ANALYSIS BY OUTPUT RATING
      144. SOUTH AFRICA MARKET ANALYSIS BY END-USER INDUSTRY
      145. REST OF MEA MARKET ANALYSIS BY PRODUCT
      146. REST OF MEA MARKET ANALYSIS BY PHASE
      147. REST OF MEA MARKET ANALYSIS BY CONNECTIVITY
      148. REST OF MEA MARKET ANALYSIS BY OUTPUT POWER
      149. REST OF MEA MARKET ANALYSIS BY OUTPUT RATING
      150. REST OF MEA MARKET ANALYSIS BY END-USER INDUSTRY
      151. KEY BUYING CRITERIA OF ENERGY & POWER
      152. RESEARCH PROCESS OF MRFR
      153. DRO ANALYSIS OF ENERGY & POWER
      154. DRIVERS IMPACT ANALYSIS: ENERGY & POWER
      155. RESTRAINTS IMPACT ANALYSIS: ENERGY & POWER
      156. SUPPLY / VALUE CHAIN: ENERGY & POWER
      157. ENERGY & POWER, BY PRODUCT, 2024 (% SHARE)
      158. ENERGY & POWER, BY PRODUCT, 2024 TO 2035 (USD Billion)
      159. ENERGY & POWER, BY PHASE, 2024 (% SHARE)
      160. ENERGY & POWER, BY PHASE, 2024 TO 2035 (USD Billion)
      161. ENERGY & POWER, BY CONNECTIVITY, 2024 (% SHARE)
      162. ENERGY & POWER, BY CONNECTIVITY, 2024 TO 2035 (USD Billion)
      163. ENERGY & POWER, BY OUTPUT POWER, 2024 (% SHARE)
      164. ENERGY & POWER, BY OUTPUT POWER, 2024 TO 2035 (USD Billion)
      165. ENERGY & POWER, BY OUTPUT RATING, 2024 (% SHARE)
      166. ENERGY & POWER, BY OUTPUT RATING, 2024 TO 2035 (USD Billion)
      167. ENERGY & POWER, BY END-USER INDUSTRY, 2024 (% SHARE)
      168. ENERGY & POWER, BY END-USER INDUSTRY, 2024 TO 2035 (USD Billion)
      169. BENCHMARKING OF MAJOR COMPETITORS
    7. LIST OF TABLES
      1. LIST OF ASSUMPTIONS
      2. 7.1.1
      3. North America MARKET SIZE ESTIMATES; FORECAST
        1. BY PRODUCT, 2025-2035 (USD Billion)
        2. BY PHASE, 2025-2035 (USD Billion)
        3. BY CONNECTIVITY, 2025-2035 (USD Billion)
        4. BY OUTPUT POWER, 2025-2035 (USD Billion)
        5. BY OUTPUT RATING, 2025-2035 (USD Billion)
        6. BY END-USER INDUSTRY, 2025-2035 (USD Billion)
      4. US MARKET SIZE ESTIMATES; FORECAST
        1. BY PRODUCT, 2025-2035 (USD Billion)
        2. BY PHASE, 2025-2035 (USD Billion)
        3. BY CONNECTIVITY, 2025-2035 (USD Billion)
        4. BY OUTPUT POWER, 2025-2035 (USD Billion)
        5. BY OUTPUT RATING, 2025-2035 (USD Billion)
        6. BY END-USER INDUSTRY, 2025-2035 (USD Billion)
      5. Canada MARKET SIZE ESTIMATES; FORECAST
        1. BY PRODUCT, 2025-2035 (USD Billion)
        2. BY PHASE, 2025-2035 (USD Billion)
        3. BY CONNECTIVITY, 2025-2035 (USD Billion)
        4. BY OUTPUT POWER, 2025-2035 (USD Billion)
        5. BY OUTPUT RATING, 2025-2035 (USD Billion)
        6. BY END-USER INDUSTRY, 2025-2035 (USD Billion)
      6. Europe MARKET SIZE ESTIMATES; FORECAST
        1. BY PRODUCT, 2025-2035 (USD Billion)
        2. BY PHASE, 2025-2035 (USD Billion)
        3. BY CONNECTIVITY, 2025-2035 (USD Billion)
        4. BY OUTPUT POWER, 2025-2035 (USD Billion)
        5. BY OUTPUT RATING, 2025-2035 (USD Billion)
        6. BY END-USER INDUSTRY, 2025-2035 (USD Billion)
      7. Germany MARKET SIZE ESTIMATES; FORECAST
        1. BY PRODUCT, 2025-2035 (USD Billion)
        2. BY PHASE, 2025-2035 (USD Billion)
        3. BY CONNECTIVITY, 2025-2035 (USD Billion)
        4. BY OUTPUT POWER, 2025-2035 (USD Billion)
        5. BY OUTPUT RATING, 2025-2035 (USD Billion)
        6. BY END-USER INDUSTRY, 2025-2035 (USD Billion)
      8. UK MARKET SIZE ESTIMATES; FORECAST
        1. BY PRODUCT, 2025-2035 (USD Billion)
        2. BY PHASE, 2025-2035 (USD Billion)
        3. BY CONNECTIVITY, 2025-2035 (USD Billion)
        4. BY OUTPUT POWER, 2025-2035 (USD Billion)
        5. BY OUTPUT RATING, 2025-2035 (USD Billion)
        6. BY END-USER INDUSTRY, 2025-2035 (USD Billion)
      9. France MARKET SIZE ESTIMATES; FORECAST
        1. BY PRODUCT, 2025-2035 (USD Billion)
        2. BY PHASE, 2025-2035 (USD Billion)
        3. BY CONNECTIVITY, 2025-2035 (USD Billion)
        4. BY OUTPUT POWER, 2025-2035 (USD Billion)
        5. BY OUTPUT RATING, 2025-2035 (USD Billion)
        6. BY END-USER INDUSTRY, 2025-2035 (USD Billion)
      10. Russia MARKET SIZE ESTIMATES; FORECAST
        1. BY PRODUCT, 2025-2035 (USD Billion)
        2. BY PHASE, 2025-2035 (USD Billion)
        3. BY CONNECTIVITY, 2025-2035 (USD Billion)
        4. BY OUTPUT POWER, 2025-2035 (USD Billion)
        5. BY OUTPUT RATING, 2025-2035 (USD Billion)
        6. BY END-USER INDUSTRY, 2025-2035 (USD Billion)
      11. Italy MARKET SIZE ESTIMATES; FORECAST
        1. BY PRODUCT, 2025-2035 (USD Billion)
        2. BY PHASE, 2025-2035 (USD Billion)
        3. BY CONNECTIVITY, 2025-2035 (USD Billion)
        4. BY OUTPUT POWER, 2025-2035 (USD Billion)
        5. BY OUTPUT RATING, 2025-2035 (USD Billion)
        6. BY END-USER INDUSTRY, 2025-2035 (USD Billion)
      12. Spain MARKET SIZE ESTIMATES; FORECAST
        1. BY PRODUCT, 2025-2035 (USD Billion)
        2. BY PHASE, 2025-2035 (USD Billion)
        3. BY CONNECTIVITY, 2025-2035 (USD Billion)
        4. BY OUTPUT POWER, 2025-2035 (USD Billion)
        5. BY OUTPUT RATING, 2025-2035 (USD Billion)
        6. BY END-USER INDUSTRY, 2025-2035 (USD Billion)
      13. Rest of Europe MARKET SIZE ESTIMATES; FORECAST
        1. BY PRODUCT, 2025-2035 (USD Billion)
        2. BY PHASE, 2025-2035 (USD Billion)
        3. BY CONNECTIVITY, 2025-2035 (USD Billion)
        4. BY OUTPUT POWER, 2025-2035 (USD Billion)
        5. BY OUTPUT RATING, 2025-2035 (USD Billion)
        6. BY END-USER INDUSTRY, 2025-2035 (USD Billion)
      14. APAC MARKET SIZE ESTIMATES; FORECAST
        1. BY PRODUCT, 2025-2035 (USD Billion)
        2. BY PHASE, 2025-2035 (USD Billion)
        3. BY CONNECTIVITY, 2025-2035 (USD Billion)
        4. BY OUTPUT POWER, 2025-2035 (USD Billion)
        5. BY OUTPUT RATING, 2025-2035 (USD Billion)
        6. BY END-USER INDUSTRY, 2025-2035 (USD Billion)
      15. China MARKET SIZE ESTIMATES; FORECAST
        1. BY PRODUCT, 2025-2035 (USD Billion)
        2. BY PHASE, 2025-2035 (USD Billion)
        3. BY CONNECTIVITY, 2025-2035 (USD Billion)
        4. BY OUTPUT POWER, 2025-2035 (USD Billion)
        5. BY OUTPUT RATING, 2025-2035 (USD Billion)
        6. BY END-USER INDUSTRY, 2025-2035 (USD Billion)
      16. India MARKET SIZE ESTIMATES; FORECAST
        1. BY PRODUCT, 2025-2035 (USD Billion)
        2. BY PHASE, 2025-2035 (USD Billion)
        3. BY CONNECTIVITY, 2025-2035 (USD Billion)
        4. BY OUTPUT POWER, 2025-2035 (USD Billion)
        5. BY OUTPUT RATING, 2025-2035 (USD Billion)
        6. BY END-USER INDUSTRY, 2025-2035 (USD Billion)
      17. Japan MARKET SIZE ESTIMATES; FORECAST
        1. BY PRODUCT, 2025-2035 (USD Billion)
        2. BY PHASE, 2025-2035 (USD Billion)
        3. BY CONNECTIVITY, 2025-2035 (USD Billion)
        4. BY OUTPUT POWER, 2025-2035 (USD Billion)
        5. BY OUTPUT RATING, 2025-2035 (USD Billion)
        6. BY END-USER INDUSTRY, 2025-2035 (USD Billion)
      18. South Korea MARKET SIZE ESTIMATES; FORECAST
        1. BY PRODUCT, 2025-2035 (USD Billion)
        2. BY PHASE, 2025-2035 (USD Billion)
        3. BY CONNECTIVITY, 2025-2035 (USD Billion)
        4. BY OUTPUT POWER, 2025-2035 (USD Billion)
        5. BY OUTPUT RATING, 2025-2035 (USD Billion)
        6. BY END-USER INDUSTRY, 2025-2035 (USD Billion)
      19. Malaysia MARKET SIZE ESTIMATES; FORECAST
        1. BY PRODUCT, 2025-2035 (USD Billion)
        2. BY PHASE, 2025-2035 (USD Billion)
        3. BY CONNECTIVITY, 2025-2035 (USD Billion)
        4. BY OUTPUT POWER, 2025-2035 (USD Billion)
        5. BY OUTPUT RATING, 2025-2035 (USD Billion)
        6. BY END-USER INDUSTRY, 2025-2035 (USD Billion)
      20. Thailand MARKET SIZE ESTIMATES; FORECAST
        1. BY PRODUCT, 2025-2035 (USD Billion)
        2. BY PHASE, 2025-2035 (USD Billion)
        3. BY CONNECTIVITY, 2025-2035 (USD Billion)
        4. BY OUTPUT POWER, 2025-2035 (USD Billion)
        5. BY OUTPUT RATING, 2025-2035 (USD Billion)
        6. BY END-USER INDUSTRY, 2025-2035 (USD Billion)
      21. Indonesia MARKET SIZE ESTIMATES; FORECAST
        1. BY PRODUCT, 2025-2035 (USD Billion)
        2. BY PHASE, 2025-2035 (USD Billion)
        3. BY CONNECTIVITY, 2025-2035 (USD Billion)
        4. BY OUTPUT POWER, 2025-2035 (USD Billion)
        5. BY OUTPUT RATING, 2025-2035 (USD Billion)
        6. BY END-USER INDUSTRY, 2025-2035 (USD Billion)
      22. Rest of APAC MARKET SIZE ESTIMATES; FORECAST
        1. BY PRODUCT, 2025-2035 (USD Billion)
        2. BY PHASE, 2025-2035 (USD Billion)
        3. BY CONNECTIVITY, 2025-2035 (USD Billion)
        4. BY OUTPUT POWER, 2025-2035 (USD Billion)
        5. BY OUTPUT RATING, 2025-2035 (USD Billion)
        6. BY END-USER INDUSTRY, 2025-2035 (USD Billion)
      23. South America MARKET SIZE ESTIMATES; FORECAST
        1. BY PRODUCT, 2025-2035 (USD Billion)
        2. BY PHASE, 2025-2035 (USD Billion)
        3. BY CONNECTIVITY, 2025-2035 (USD Billion)
        4. BY OUTPUT POWER, 2025-2035 (USD Billion)
        5. BY OUTPUT RATING, 2025-2035 (USD Billion)
        6. BY END-USER INDUSTRY, 2025-2035 (USD Billion)
      24. Brazil MARKET SIZE ESTIMATES; FORECAST
        1. BY PRODUCT, 2025-2035 (USD Billion)
        2. BY PHASE, 2025-2035 (USD Billion)
        3. BY CONNECTIVITY, 2025-2035 (USD Billion)
        4. BY OUTPUT POWER, 2025-2035 (USD Billion)
        5. BY OUTPUT RATING, 2025-2035 (USD Billion)
        6. BY END-USER INDUSTRY, 2025-2035 (USD Billion)
      25. Mexico MARKET SIZE ESTIMATES; FORECAST
        1. BY PRODUCT, 2025-2035 (USD Billion)
        2. BY PHASE, 2025-2035 (USD Billion)
        3. BY CONNECTIVITY, 2025-2035 (USD Billion)
        4. BY OUTPUT POWER, 2025-2035 (USD Billion)
        5. BY OUTPUT RATING, 2025-2035 (USD Billion)
        6. BY END-USER INDUSTRY, 2025-2035 (USD Billion)
      26. Argentina MARKET SIZE ESTIMATES; FORECAST
        1. BY PRODUCT, 2025-2035 (USD Billion)
        2. BY PHASE, 2025-2035 (USD Billion)
        3. BY CONNECTIVITY, 2025-2035 (USD Billion)
        4. BY OUTPUT POWER, 2025-2035 (USD Billion)
        5. BY OUTPUT RATING, 2025-2035 (USD Billion)
        6. BY END-USER INDUSTRY, 2025-2035 (USD Billion)
      27. Rest of South America MARKET SIZE ESTIMATES; FORECAST
        1. BY PRODUCT, 2025-2035 (USD Billion)
        2. BY PHASE, 2025-2035 (USD Billion)
        3. BY CONNECTIVITY, 2025-2035 (USD Billion)
        4. BY OUTPUT POWER, 2025-2035 (USD Billion)
        5. BY OUTPUT RATING, 2025-2035 (USD Billion)
        6. BY END-USER INDUSTRY, 2025-2035 (USD Billion)
      28. MEA MARKET SIZE ESTIMATES; FORECAST
        1. BY PRODUCT, 2025-2035 (USD Billion)
        2. BY PHASE, 2025-2035 (USD Billion)
        3. BY CONNECTIVITY, 2025-2035 (USD Billion)
        4. BY OUTPUT POWER, 2025-2035 (USD Billion)
        5. BY OUTPUT RATING, 2025-2035 (USD Billion)
        6. BY END-USER INDUSTRY, 2025-2035 (USD Billion)
      29. GCC Countries MARKET SIZE ESTIMATES; FORECAST
        1. BY PRODUCT, 2025-2035 (USD Billion)
        2. BY PHASE, 2025-2035 (USD Billion)
        3. BY CONNECTIVITY, 2025-2035 (USD Billion)
        4. BY OUTPUT POWER, 2025-2035 (USD Billion)
        5. BY OUTPUT RATING, 2025-2035 (USD Billion)
        6. BY END-USER INDUSTRY, 2025-2035 (USD Billion)
      30. South Africa MARKET SIZE ESTIMATES; FORECAST
        1. BY PRODUCT, 2025-2035 (USD Billion)
        2. BY PHASE, 2025-2035 (USD Billion)
        3. BY CONNECTIVITY, 2025-2035 (USD Billion)
        4. BY OUTPUT POWER, 2025-2035 (USD Billion)
        5. BY OUTPUT RATING, 2025-2035 (USD Billion)
        6. BY END-USER INDUSTRY, 2025-2035 (USD Billion)
      31. Rest of MEA MARKET SIZE ESTIMATES; FORECAST
        1. BY PRODUCT, 2025-2035 (USD Billion)
        2. BY PHASE, 2025-2035 (USD Billion)
        3. BY CONNECTIVITY, 2025-2035 (USD Billion)
        4. BY OUTPUT POWER, 2025-2035 (USD Billion)
        5. BY OUTPUT RATING, 2025-2035 (USD Billion)
        6. BY END-USER INDUSTRY, 2025-2035 (USD Billion)
      32. PRODUCT LAUNCH/PRODUCT DEVELOPMENT/APPROVAL
      33. 7.31.1
      34. ACQUISITION/PARTNERSHIP
      35. 7.32.1

    Europe PV Inverter Market Segmentation

    Market Segmentation Overview

    • Detailed segmentation data will be available in the full report
    • Comprehensive analysis by multiple parameters
    • Regional and country-level breakdowns
    • Market size forecasts by segment
    Infographic

    Free Sample Request

    Kindly complete the form below to receive a free sample of this Report

    Get Free Sample

    Customer Strories

    “I am very pleased with how market segments have been defined in a relevant way for my purposes (such as "Portable Freezers & refrigerators" and "last-mile"). In general the report is well structured. Thanks very much for your efforts.”

    Victoria Milne

    Founder
    Case Study
    Chemicals and Materials

    Compare Licence

    ×
    Features License Type
    Single User Multiuser License Enterprise User
    Price $4,950 $5,950 $7,250
    Maximum User Access Limit 1 User Upto 10 Users Unrestricted Access Throughout the Organization
    Free Customization
    Direct Access to Analyst
    Deliverable Format
    Platform Access
    Discount on Next Purchase 10% 15% 15%
    Printable Versions