• Cat-intel
  • MedIntelliX
  • Resources
  • About Us
  • Request Free Sample ×

    Kindly complete the form below to receive a free sample of this Report

    Leading companies partner with us for data-driven Insights

    clients tt-cursor

    Europe Magic Wall Interactive Surfaces Market

    ID: MRFR/ICT/62886-HCR
    200 Pages
    Aarti Dhapte
    September 2025

    Europe Magic Wall Interactive Surfaces Market Research Report By Application (Advertising, Education, Entertainment, Retail, Healthcare), By End Use (Commercial, Residential, Institutional), By Technology (Touch Technology, Gesture Technology, Projection Technology), By Component (Hardware, Software, Services) and By Regional (Germany, UK, France, Russia, Italy, Spain, Rest of Europe) - Forecast to 2035

    Share:
    Download PDF ×

    We do not share your information with anyone. However, we may send you emails based on your report interest from time to time. You may contact us at any time to opt-out.

    Europe Magic Wall Interactive Surfaces Market Research Report - Forecast to 2035 Infographic
    Purchase Options
    $ 4,950.0
    $ 5,950.0
    $ 7,250.0
    Table of Contents

    Europe Magic Wall Interactive Surfaces Market Summary

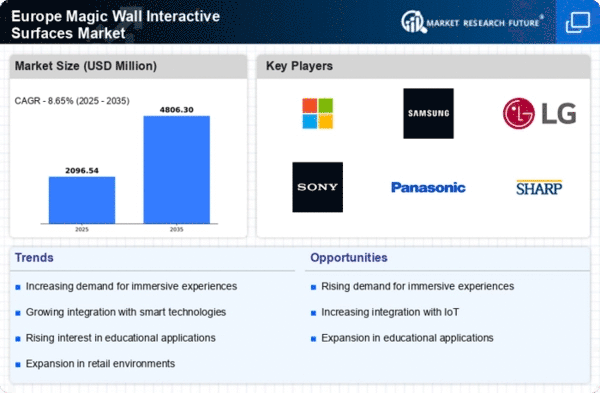
    The Europe Magic Wall Interactive Surfaces market is projected to grow significantly from 1.63 USD Billion in 2024 to 4.01 USD Billion by 2035.

    Key Market Trends & Highlights

    Europe Magic Wall Interactive Surfaces Key Trends and Highlights

    • The market is expected to experience a compound annual growth rate (CAGR) of 8.53 percent from 2025 to 2035.
    • By 2035, the market valuation is anticipated to reach 4.01 USD Billion, indicating robust growth potential.
    • In 2024, the market is valued at 1.63 USD Billion, reflecting a strong foundation for future expansion.
    • Growing adoption of interactive technology due to increasing demand for immersive experiences is a major market driver.

    Market Size & Forecast

    2024 Market Size 1.63 (USD Billion)
    2035 Market Size 4.01 (USD Billion)
    CAGR (2025-2035) 8.53%

    Major Players

    NEC, Qube, Cisco, Samsung, Infocus, Smart Technologies, Epson, BenQ, Oblong Industries, Vitria, Microsoft, ViewSonic, Mimio, Sharp

    Europe Magic Wall Interactive Surfaces Market Trends

    The Europe Magic Wall Interactive Surfaces Market is experiencing valuable trends that are being driven by technological advancements and increased user engagement. In a variety of sectors, including education, retail, and corporate environments, the increasing integration of virtual reality (VR) and augmented reality (AR) technologies in interactive surfaces is improving user experiences. For example, educational institutions in Europe are implementing these interactive surfaces to enhance the learning and collaboration of students and instructors. Moreover, the increasing environmental consciousness of both consumers and businesses is influencing the development of products by emphasizing sustainable and eco-friendly materials.

    The potential for customization and personalization of interactive surfaces is among the opportunities to be investigated in this market. Businesses in Europe have the opportunity to capitalize on the increasing demand for customized solutions that cater to the unique requirements of their users. Furthermore, the integration of AI-driven analytics into these surfaces enables companies to evaluate user interactions and enhance their offerings accordingly, thereby establishing a competitive advantage in the current market. In recent years, there has been a trend toward multi-functional interactive surfaces that serve a variety of purposes beyond ordinary display, such as promoting communication and interaction in smart homes and offices.

    The modern workforce in Europe is also in alignment with the demand for collaborative workspaces and improved user interfaces. This trend toward connectivity and interactivity is revolutionizing the manner in which businesses interact with their clients and enhance operational efficiency. Consequently, the Magic Wall Interactive Surfaces Market in Europe is characterized by a consistent evolution, which suggests that there are promising opportunities for growth as technological adoption expands across a variety of sectors.

    Europe Magic Wall Interactive Surfaces Market Drivers

    Market Segment Insights

    Europe Magic Wall Interactive Surfaces Market Segment Insights

    Europe Magic Wall Interactive Surfaces Market Segment Insights

    Magic Wall Interactive Surfaces Market Application Insights

    Magic Wall Interactive Surfaces Market Application Insights

    The Europe Magic Wall Interactive Surfaces Market exhibits significant growth potential within its Application segment, which encompasses various critical industries such as Advertising, Education, Entertainment, Retail, and Healthcare. Each of these industries is increasingly leveraging interactive surfaces to enhance engagement and effectiveness. In Advertising, the integration of interactive surfaces allows for dynamic and immersive campaigns that can attract consumer attention more effectively than traditional media, leading to higher conversion rates.

    Meanwhile, Education is embracing these technologies to foster innovative teaching approaches, enabling interactive learning experiences that enhance student engagement and retention of knowledge. The Entertainment industry benefits from Magic Wall Interactive Surfaces by offering audiences novel experiences, making events and exhibitions more engaging and memorable. In the Retail sector, these surfaces serve as powerful tools for visual merchandising and customer interaction, allowing brands to create a captivating shopping experience that aligns with modern consumer behavior trends toward immersive experiences. Finally, in Healthcare, interactive surfaces are utilized to assist in patient education and facilitate communication between patients and healthcare providers, enhancing overall care and improving patient outcomes.

    This segment is propelled by several factors, including increasing demand for interactive and engaging content across diverse platforms, technological advancements in display and touch technologies, and a growing awareness of the benefits provided by interactive surfaces in various sectors. Challenges exist, such as the costs associated with the deployment and integration of these surfaces within existing frameworks, yet the opportunities for innovation within these industries remain vast. As European nations push for digital transformation and modernization, the Magic Wall Interactive Surfaces Market is well-positioned to play a pivotal role in shaping the future landscape of interaction across these applications. The ongoing development and adoption of these technologies suggest a promising trajectory for their impact within Europe, as businesses and educators seek to leverage these interactive solutions to meet the evolving demands of their respective audiences.

    Source: Primary Research, Secondary Research, MRFR Database and Analyst Review

    Magic Wall Interactive Surfaces Market End Use Insights

    Magic Wall Interactive Surfaces Market End Use Insights

    The Europe Magic Wall Interactive Surfaces Market shows significant diversity within its End Use segment, encompassing Commercial, Residential, and Institutional applications. The Commercial sector often leads in adoption due to the growing need for interactive and engaging environments in retail, hospitality, and corporate settings. This demand is driven by the rising focus on customer engagement and interactive experiences, which enhance brand visibility and consumer interaction. Meanwhile, the Residential segment is gaining traction as smart home technology becomes more prevalent, with homeowners seeking innovative solutions for enhanced living experiences.

    The rise of interactive surfaces in homes offers potential for improved entertainment and connectivity. Institutional applications, particularly in education and healthcare, emphasize the importance of interactive surfaces in fostering collaboration and improving learning outcomes. This segment benefits from increased governmental support for digital technology integration in schools and healthcare facilities. Overall, the importance of these segments is underscored by the ongoing trends of digital transformation, fostering a strong growth environment within the Europe Magic Wall Interactive Surfaces Market, reflective of broader market dynamics and consumer preferences.

    Magic Wall Interactive Surfaces Market Technology Insights

    Magic Wall Interactive Surfaces Market Technology Insights

    The Technology segment of the Europe Magic Wall Interactive Surfaces Market is evolving rapidly, driven by innovations that enhance user interaction experiences across various applications. Touch Technology remains a key driver in this landscape, allowing for intuitive engagement and fostering user-friendly interfaces in diverse environments from retail to education. Gesture Technology is gaining traction by facilitating touchless interactions, increasingly relevant in health-sensitive settings and public spaces where hygiene is a priority.

    Meanwhile, Projection Technology is significant in enabling immersive experiences, transforming ordinary surfaces into dynamic displays, which is particularly beneficial in exhibitions and events.As the demand for interactive solutions continues to rise, advancements in these technologies will likely shape the future of engagement, emphasizing the importance of seamless integration into everyday settings in Europe. The increasing adoption of interactive surfaces in smart cities and digital marketing further illustrates the critical role of these technologies in enhancing user interactivity and engagement.

    Magic Wall Interactive Surfaces Market Component Insights

    Magic Wall Interactive Surfaces Market Component Insights

    The Component segment of the Europe Magic Wall Interactive Surfaces Market represents a crucial area for growth and innovation, encompassing Hardware, Software, and Services. Hardware plays a pivotal role, as it includes the physical devices necessary for interactive surfaces, which are increasingly used in educational institutions and corporate environments to enhance communication and collaboration. Software solutions contribute significantly by providing the necessary applications and interfaces that enable interactivity and user engagement, thereby facilitating a more immersive experience.

    Meanwhile, Services encompass installation, maintenance, and technical support, ensuring that users can fully leverage the interactive capabilities of the technology. This segment is essential for addressing various industry needs, such as the growing demand for digital education tools and smart enterprises, highlighting its significance in the market dynamics. The increasing focus on user experience and interactive solutions positions the Component segment as a fundamental pillar in shaping the future of the Europe Magic Wall Interactive Surfaces Market.

    Get more detailed insights about Europe Magic Wall Interactive Surfaces Market Research Report - Forecast to 2035

    Regional Insights

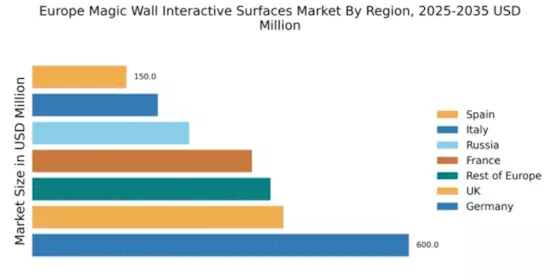
    The Europe Magic Wall Interactive Surfaces Market is experiencing robust growth, driven by the increasing demand for innovative display solutions across various sectors such as education, retail, and corporate environments. Among the leading nations, Germany holds a significant position within the market due to its strong technological infrastructure and emphasis on digital transformation. The UK's market presence is also notable, fueled by a focus on interactive technologies in various public and private sectors, enhancing user engagement. France demonstrates similar trends, with growing adoption in educational institutions and public displays.

    Russia, while maintaining a smaller share, shows potential for growth owing to investments in smart technology and urban development projects. Italy and Spain, focusing on enhancing customer experience in retail and tourism, are gradually contributing to the overall market dynamics. Additionally, the rest of Europe is embracing this technology, marking a shift towards more interactive communication methods. The increasing trend towards digitalization and the need for immersive experiences are key factors boosting the adoption of magic wall interactive surfaces across the region, making it a vital area of focus within the broader Europe Magic Wall Interactive Surfaces Market landscape.

    Europe Magic Wall Interactive Surfaces Market Region

    Source: Primary Research, Secondary Research, MRFR Database and Analyst Review

    Key Players and Competitive Insights

    The Europe Magic Wall Interactive Surfaces Market is characterized by rapid technological advancements and diverse applications across various sectors. This innovative market is witnessing substantial growth due to the increasing adoption of interactive surfaces in education, corporate, and entertainment settings. With various players operating in this landscape, understanding competitive dynamics and market positioning is crucial. Companies within the Magic Wall segment are continually strategizing to enhance their product offerings, incorporate cutting-edge technology, and expand market reach. The competitive insights reflect on the continuous evolution and the vigorous rivalry among established firms and new entrants aiming to capture larger portions of the market share. This sector is marked by increasing customer demands for more interactive and engaging experiences, prompting companies to innovate and differentiate their products effectively.

    NEC has distinguished itself in the Europe Magic Wall Interactive Surfaces Market through its rich portfolio of high-quality display and interactive solutions tailored for diverse applications. With a robust presence in the region, NEC leverages its experienced workforce and advanced technological capabilities to remain competitive. The company focuses on providing superior product performance, reliability, and exceptional customer service, which significantly strengthens its market position. Moreover, NEC’s extensive research and development initiatives lead to innovative solutions that meet the evolving needs of various industries. These strengths not only enhance NEC's brand recognition but also solidify its reputation as a trusted provider of interactive surface technologies in the European market.Qube, focusing on the Europe Magic Wall Interactive Surfaces Market, has established itself as a notable player through innovative product offerings designed to enhance interactivity and user engagement.

    Qube's key products include interactive touchscreens and collaborative surfaces, tailored for both educational and corporate environments. The company's strategic market presence is bolstered by its dedication to delivering cutting-edge solutions that optimize user experiences. Qube's strengths lie in its adaptability to emerging trends, ability to foster partnerships, and agile approach to product development. Recent expansions and collaborations in the European region highlight Qube's commitment to growth and customer satisfaction, allowing the company to capture significant market opportunities. Mergers and acquisitions also contribute to the company's strength, enabling it to integrate complementary technologies and expand its market reach.

    Key Companies in the Europe Magic Wall Interactive Surfaces Market market include

    Industry Developments

    Recent developments in the Europe Magic Wall Interactive Surfaces Market have seen significant strides, particularly in partnership and technological innovation among leading companies such as NEC, Cisco, Samsung, and Microsoft. For instance, in October 2023, NEC launched a new series of advanced interactive displays aimed at enhancing collaborative experiences in corporate environments. Notably, BenQ also unveiled an upgraded lineup of interactive whiteboards in September 2023, catering to the evolving needs of educational institutions across Europe. The current market environment has also been buoyed by growth in interactive solutions due to increased demand for remote collaboration tools, catalyzed by ongoing hybrid working trends.

    In terms of mergers and acquisitions, a significant move was observed when Cisco announced its acquisition of a European software startup focused on interactive display technology in July 2023 to bolster its product offerings in interactive conferencing tools. Additionally, companies like Epson and Smart Technologies have reported increased market valuations due to expanded product ranges and enhanced features, influencing competition and innovation within the sector. These developments are reflective of broader industry trends towards integrating connectivity and interactivity in shared workspaces across Europe.

    Market Segmentation

    Report Scope


    Report Attribute/Metric Source: Details
    MARKET SIZE 2023 1.48(USD Billion)
    MARKET SIZE 2024 1.63(USD Billion)
    MARKET SIZE 2035 4.01(USD Billion)
    COMPOUND ANNUAL GROWTH RATE (CAGR) 8.538% (2025 - 2035)
    REPORT COVERAGE Revenue Forecast, Competitive Landscape, Growth Factors, and Trends
    BASE YEAR 2024
    MARKET FORECAST PERIOD 2025 - 2035
    HISTORICAL DATA 2019 - 2024
    MARKET FORECAST UNITS USD Billion
    KEY COMPANIES PROFILED NEC, Qube, Cisco, Samsung, Infocus, Smart Technologies, Epson, BenQ, EPSON, Oblong Industries, Vitria, Microsoft, ViewSonic, Mimio, Sharp
    SEGMENTS COVERED Application, End Use, Technology, Component, Regional
    KEY MARKET OPPORTUNITIES Growing demand in education sectors, Expansion in retail and advertising, Integration with smart home technology, Increasing use in corporate environments, Rising interest in interactive gaming.
    KEY MARKET DYNAMICS Technological advancements, Increasing adoption in retail, Rising demand for interactive advertising, Growth in educational applications, Enhanced user engagement
    COUNTRIES COVERED Germany, UK, France, Russia, Italy, Spain, Rest of Europe

    Market Highlights

    Author
    Aarti Dhapte
    Team Lead - Research

    She holds an experience of about 6+ years in Market Research and Business Consulting, working under the spectrum of Information Communication Technology, Telecommunications and Semiconductor domains. Aarti conceptualizes and implements a scalable business strategy and provides strategic leadership to the clients. Her expertise lies in market estimation, competitive intelligence, pipeline analysis, customer assessment, etc.

    Leave a Comment

    FAQs

    What is the expected market size of the Europe Magic Wall Interactive Surfaces Market in 2024?

    The Europe Magic Wall Interactive Surfaces Market is expected to be valued at 1.63 billion USD in 2024.

    What is the projected value of the market by 2035?

    By 2035, the market is expected to reach a value of 4.01 billion USD.

    What is the expected CAGR for the Europe Magic Wall Interactive Surfaces Market from 2025 to 2035?

    The market is projected to grow at a CAGR of 8.538 percent from 2025 to 2035.

    Which region is anticipated to hold the largest market share in 2024?

    Germany is expected to hold the largest market share with a value of 0.5 billion USD in 2024.

    How much will the market in the UK be valued at in 2035?

    The market in the UK is projected to be valued at 0.83 billion USD by 2035.

    What are the key application segments of the Europe Magic Wall Interactive Surfaces Market?

    Key application segments include Advertising, Education, Entertainment, Retail, and Healthcare.

    What is the estimated market size for the Advertising segment in 2024?

    The Advertising segment is expected to be valued at 0.4 billion USD in 2024.

    Who are the major players in the Europe Magic Wall Interactive Surfaces Market?

    Key players in the market include NEC, Cisco, Samsung, and Microsoft among others.

    What will the Healthcare application's market size be in 2035?

    The Healthcare application's market size is expected to reach 0.76 billion USD by 2035.

    What anticipated growth opportunity exists for the Entertainment segment from 2024 to 2035?

    The Entertainment segment is projected to grow from 0.3 billion USD in 2024 to 0.74 billion USD in 2035.

    1. EXECUTIVE
    2. SUMMARY
    3. Market Overview
    4. Key Findings
    5. Market Segmentation
    6. Competitive Landscape
    7. Challenges and Opportunities
    8. Future Outlook
    9. MARKET INTRODUCTION
    10. Definition
    11. Scope of the study
    12. Research Objective
    13. Assumption
    14. Limitations
    15. RESEARCH
    16. METHODOLOGY
    17. Overview
    18. Data
    19. Mining
    20. Secondary Research
    21. Primary
    22. Research
    23. Primary Interviews and Information Gathering
    24. Process
    25. Breakdown of Primary Respondents
    26. Forecasting
    27. Model
    28. Market Size Estimation
    29. Bottom-Up
    30. Approach
    31. Top-Down Approach
    32. Data
    33. Triangulation
    34. Validation
    35. MARKET
    36. DYNAMICS
    37. Overview
    38. Drivers
    39. Restraints
    40. Opportunities
    41. MARKET FACTOR ANALYSIS
    42. Value chain Analysis
    43. Porter's
    44. Five Forces Analysis
    45. Bargaining Power of Suppliers
    46. Bargaining
    47. Power of Buyers
    48. Threat of New Entrants
    49. Threat
    50. of Substitutes
    51. Intensity of Rivalry
    52. COVID-19
    53. Impact Analysis
    54. Market Impact Analysis
    55. Regional
    56. Impact
    57. Opportunity and Threat Analysis
    58. Europe
    59. Magic Wall Interactive Surfaces Market, BY Application (USD Billion)
    60. Advertising
    61. Education
    62. Entertainment
    63. Retail
    64. Healthcare
    65. Europe
    66. Magic Wall Interactive Surfaces Market, BY End Use (USD Billion)
    67. Commercial
    68. Residential
    69. Institutional
    70. Europe
    71. Magic Wall Interactive Surfaces Market, BY Technology (USD Billion)
    72. Touch
    73. Technology
    74. Gesture Technology
    75. Projection
    76. Technology
    77. Europe Magic Wall
    78. Interactive Surfaces Market, BY Component (USD Billion)
    79. Hardware
    80. Software
    81. Services
    82. Europe
    83. Magic Wall Interactive Surfaces Market, BY Regional (USD Billion)
    84. Germany
    85. UK
    86. France
    87. Russia
    88. Italy
    89. Spain
    90. Rest
    91. of Europe
    92. Competitive Landscape
    93. Overview
    94. Competitive
    95. Analysis
    96. Market share Analysis
    97. Major
    98. Growth Strategy in the Magic Wall Interactive Surfaces Market
    99. Competitive
    100. Benchmarking
    101. Leading Players in Terms of Number of Developments
    102. in the Magic Wall Interactive Surfaces Market
    103. Key developments
    104. and growth strategies
    105. New Product Launch/Service Deployment
    106. Merger
    107. & Acquisitions
    108. Joint Ventures
    109. Major
    110. Players Financial Matrix
    111. Sales and Operating Income
    112. Major
    113. Players R&D Expenditure. 2023
    114. Company
    115. Profiles
    116. NEC
    117. Financial
    118. Overview
    119. Products Offered
    120. Key
    121. Developments
    122. SWOT Analysis
    123. Key
    124. Strategies
    125. Qube
    126. Financial
    127. Overview
    128. Products Offered
    129. Key
    130. Developments
    131. SWOT Analysis
    132. Key
    133. Strategies
    134. Cisco
    135. Financial
    136. Overview
    137. Products Offered
    138. Key
    139. Developments
    140. SWOT Analysis
    141. Key
    142. Strategies
    143. Samsung
    144. Financial
    145. Overview
    146. Products Offered
    147. Key
    148. Developments
    149. SWOT Analysis
    150. Key
    151. Strategies
    152. Infocus
    153. Financial
    154. Overview
    155. Products Offered
    156. Key
    157. Developments
    158. SWOT Analysis
    159. Key
    160. Strategies
    161. Smart Technologies
    162. Financial
    163. Overview
    164. Products Offered
    165. Key
    166. Developments
    167. SWOT Analysis
    168. Key
    169. Strategies
    170. Epson
    171. Financial
    172. Overview
    173. Products Offered
    174. Key
    175. Developments
    176. SWOT Analysis
    177. Key
    178. Strategies
    179. BenQ
    180. Financial
    181. Overview
    182. Products Offered
    183. Key
    184. Developments
    185. SWOT Analysis
    186. Key
    187. Strategies
    188. EPSON
    189. Financial
    190. Overview
    191. Products Offered
    192. Key
    193. Developments
    194. SWOT Analysis
    195. Key
    196. Strategies
    197. Oblong Industries
    198. Financial
    199. Overview
    200. Products Offered
    201. Key
    202. Developments
    203. SWOT Analysis
    204. Key
    205. Strategies
    206. Vitria
    207. Financial
    208. Overview
    209. Products Offered
    210. Key
    211. Developments
    212. SWOT Analysis
    213. Key
    214. Strategies
    215. Microsoft
    216. Financial
    217. Overview
    218. Products Offered
    219. Key
    220. Developments
    221. SWOT Analysis
    222. Key
    223. Strategies
    224. ViewSonic
    225. Financial
    226. Overview
    227. Products Offered
    228. Key
    229. Developments
    230. SWOT Analysis
    231. Key
    232. Strategies
    233. Mimio
    234. Financial
    235. Overview
    236. Products Offered
    237. Key
    238. Developments
    239. SWOT Analysis
    240. Key
    241. Strategies
    242. Sharp
    243. Financial
    244. Overview
    245. Products Offered
    246. Key
    247. Developments
    248. SWOT Analysis
    249. Key
    250. Strategies
    251. References
    252. Related
    253. Reports
    254. LIST
    255. OF ASSUMPTIONS
    256. Europe Magic Wall Interactive Surfaces
    257. Market SIZE ESTIMATES & FORECAST, BY APPLICATION, 2019-2035 (USD Billions)
    258. Europe
    259. Magic Wall Interactive Surfaces Market SIZE ESTIMATES & FORECAST, BY END USE,
    260. 2035 (USD Billions)
    261. Europe Magic Wall Interactive
    262. Surfaces Market SIZE ESTIMATES & FORECAST, BY TECHNOLOGY, 2019-2035 (USD Billions)
    263. Europe
    264. Magic Wall Interactive Surfaces Market SIZE ESTIMATES & FORECAST, BY COMPONENT,
    265. 2035 (USD Billions)
    266. Europe Magic Wall Interactive
    267. Surfaces Market SIZE ESTIMATES & FORECAST, BY REGIONAL, 2019-2035 (USD Billions)
    268. PRODUCT
    269. LAUNCH/PRODUCT DEVELOPMENT/APPROVAL
    270. ACQUISITION/PARTNERSHIP
    271. LIST
    272. Of figures
    273. MARKET SYNOPSIS
    274. EUROPE
    275. MAGIC WALL INTERACTIVE SURFACES MARKET ANALYSIS BY APPLICATION
    276. EUROPE
    277. MAGIC WALL INTERACTIVE SURFACES MARKET ANALYSIS BY END USE
    278. EUROPE
    279. MAGIC WALL INTERACTIVE SURFACES MARKET ANALYSIS BY TECHNOLOGY
    280. EUROPE
    281. MAGIC WALL INTERACTIVE SURFACES MARKET ANALYSIS BY COMPONENT
    282. EUROPE
    283. MAGIC WALL INTERACTIVE SURFACES MARKET ANALYSIS BY REGIONAL
    284. KEY
    285. BUYING CRITERIA OF MAGIC WALL INTERACTIVE SURFACES MARKET
    286. RESEARCH
    287. PROCESS OF MRFR
    288. DRO ANALYSIS OF MAGIC WALL INTERACTIVE
    289. SURFACES MARKET
    290. DRIVERS IMPACT ANALYSIS: MAGIC WALL INTERACTIVE
    291. SURFACES MARKET
    292. RESTRAINTS IMPACT ANALYSIS: MAGIC WALL
    293. INTERACTIVE SURFACES MARKET
    294. SUPPLY / VALUE CHAIN: MAGIC
    295. WALL INTERACTIVE SURFACES MARKET
    296. MAGIC WALL INTERACTIVE
    297. SURFACES MARKET, BY APPLICATION, 2025 (% SHARE)
    298. MAGIC
    299. WALL INTERACTIVE SURFACES MARKET, BY APPLICATION, 2019 TO 2035 (USD Billions)
    300. MAGIC
    301. WALL INTERACTIVE SURFACES MARKET, BY END USE, 2025 (% SHARE)
    302. MAGIC
    303. WALL INTERACTIVE SURFACES MARKET, BY END USE, 2019 TO 2035 (USD Billions)
    304. MAGIC
    305. WALL INTERACTIVE SURFACES MARKET, BY TECHNOLOGY, 2025 (% SHARE)
    306. MAGIC
    307. WALL INTERACTIVE SURFACES MARKET, BY TECHNOLOGY, 2019 TO 2035 (USD Billions)
    308. MAGIC
    309. WALL INTERACTIVE SURFACES MARKET, BY COMPONENT, 2025 (% SHARE)
    310. MAGIC
    311. WALL INTERACTIVE SURFACES MARKET, BY COMPONENT, 2019 TO 2035 (USD Billions)
    312. MAGIC
    313. WALL INTERACTIVE SURFACES MARKET, BY REGIONAL, 2025 (% SHARE)
    314. MAGIC
    315. WALL INTERACTIVE SURFACES MARKET, BY REGIONAL, 2019 TO 2035 (USD Billions)
    316. BENCHMARKING
    317. OF MAJOR COMPETITORS

    Europe Magic Wall Interactive Surfaces Market Segmentation

    • Magic Wall Interactive Surfaces Market By Application (USD Billion, 2019-2035)

      • Advertising
      • Education
      • Entertainment
      • Retail
      • Healthcare


    • Magic Wall Interactive Surfaces Market By End Use (USD Billion, 2019-2035)

      • Commercial
      • Residential
      • Institutional


    • Magic Wall Interactive Surfaces Market By Technology (USD Billion, 2019-2035)

      • Touch Technology
      • Gesture Technology
      • Projection Technology


    • Magic Wall Interactive Surfaces Market By Component (USD Billion, 2019-2035)

      • Hardware
      • Software
      • Services


    • Magic Wall Interactive Surfaces Market By Regional (USD Billion, 2019-2035)

      • Germany
      • UK
      • France
      • Russia
      • Italy
      • Spain
      • Rest of Europe


    Magic Wall Interactive Surfaces Market Regional Outlook (USD Billion, 2019-2035)


    • Europe Outlook (USD Billion, 2019-2035)

      • Europe Magic Wall Interactive Surfaces Market by Application Type

        • Advertising
        • Education
        • Entertainment
        • Retail
        • Healthcare
      • Europe Magic Wall Interactive Surfaces Market by End Use Type

        • Commercial
        • Residential
        • Institutional
      • Europe Magic Wall Interactive Surfaces Market by Technology Type

        • Touch Technology
        • Gesture Technology
        • Projection Technology
      • Europe Magic Wall Interactive Surfaces Market by Component Type

        • Hardware
        • Software
        • Services
      • Europe Magic Wall Interactive Surfaces Market by Regional Type

        • Germany
        • UK
        • France
        • Russia
        • Italy
        • Spain
        • Rest of Europe
      • GERMANY Outlook (USD Billion, 2019-2035)
      • GERMANY Magic Wall Interactive Surfaces Market by Application Type

        • Advertising
        • Education
        • Entertainment
        • Retail
        • Healthcare
      • GERMANY Magic Wall Interactive Surfaces Market by End Use Type

        • Commercial
        • Residential
        • Institutional
      • GERMANY Magic Wall Interactive Surfaces Market by Technology Type

        • Touch Technology
        • Gesture Technology
        • Projection Technology
      • GERMANY Magic Wall Interactive Surfaces Market by Component Type

        • Hardware
        • Software
        • Services
      • UK Outlook (USD Billion, 2019-2035)
      • UK Magic Wall Interactive Surfaces Market by Application Type

        • Advertising
        • Education
        • Entertainment
        • Retail
        • Healthcare
      • UK Magic Wall Interactive Surfaces Market by End Use Type

        • Commercial
        • Residential
        • Institutional
      • UK Magic Wall Interactive Surfaces Market by Technology Type

        • Touch Technology
        • Gesture Technology
        • Projection Technology
      • UK Magic Wall Interactive Surfaces Market by Component Type

        • Hardware
        • Software
        • Services
      • FRANCE Outlook (USD Billion, 2019-2035)
      • FRANCE Magic Wall Interactive Surfaces Market by Application Type

        • Advertising
        • Education
        • Entertainment
        • Retail
        • Healthcare
      • FRANCE Magic Wall Interactive Surfaces Market by End Use Type

        • Commercial
        • Residential
        • Institutional
      • FRANCE Magic Wall Interactive Surfaces Market by Technology Type

        • Touch Technology
        • Gesture Technology
        • Projection Technology
      • FRANCE Magic Wall Interactive Surfaces Market by Component Type

        • Hardware
        • Software
        • Services
      • RUSSIA Outlook (USD Billion, 2019-2035)
      • RUSSIA Magic Wall Interactive Surfaces Market by Application Type

        • Advertising
        • Education
        • Entertainment
        • Retail
        • Healthcare
      • RUSSIA Magic Wall Interactive Surfaces Market by End Use Type

        • Commercial
        • Residential
        • Institutional
      • RUSSIA Magic Wall Interactive Surfaces Market by Technology Type

        • Touch Technology
        • Gesture Technology
        • Projection Technology
      • RUSSIA Magic Wall Interactive Surfaces Market by Component Type

        • Hardware
        • Software
        • Services
      • ITALY Outlook (USD Billion, 2019-2035)
      • ITALY Magic Wall Interactive Surfaces Market by Application Type

        • Advertising
        • Education
        • Entertainment
        • Retail
        • Healthcare
      • ITALY Magic Wall Interactive Surfaces Market by End Use Type

        • Commercial
        • Residential
        • Institutional
      • ITALY Magic Wall Interactive Surfaces Market by Technology Type

        • Touch Technology
        • Gesture Technology
        • Projection Technology
      • ITALY Magic Wall Interactive Surfaces Market by Component Type

        • Hardware
        • Software
        • Services
      • SPAIN Outlook (USD Billion, 2019-2035)
      • SPAIN Magic Wall Interactive Surfaces Market by Application Type

        • Advertising
        • Education
        • Entertainment
        • Retail
        • Healthcare
      • SPAIN Magic Wall Interactive Surfaces Market by End Use Type

        • Commercial
        • Residential
        • Institutional
      • SPAIN Magic Wall Interactive Surfaces Market by Technology Type

        • Touch Technology
        • Gesture Technology
        • Projection Technology
      • SPAIN Magic Wall Interactive Surfaces Market by Component Type

        • Hardware
        • Software
        • Services
      • REST OF EUROPE Outlook (USD Billion, 2019-2035)
      • REST OF EUROPE Magic Wall Interactive Surfaces Market by Application Type

        • Advertising
        • Education
        • Entertainment
        • Retail
        • Healthcare
      • REST OF EUROPE Magic Wall Interactive Surfaces Market by End Use Type

        • Commercial
        • Residential
        • Institutional
      • REST OF EUROPE Magic Wall Interactive Surfaces Market by Technology Type

        • Touch Technology
        • Gesture Technology
        • Projection Technology
      • REST OF EUROPE Magic Wall Interactive Surfaces Market by Component Type

        • Hardware
        • Software
        • Services


    Report Infographic
    Free Sample Request

    Kindly complete the form below to receive a free sample of this Report

    Customer Strories

    “I am very pleased with how market segments have been defined in a relevant way for my purposes (such as "Portable Freezers & refrigerators" and "last-mile"). In general the report is well structured. Thanks very much for your efforts.”

    Victoria Milne Founder
    Case Study

    Chemicals and Materials