• Cat-intel
  • MedIntelliX
  • Resources
  • About Us
  • Request Free Sample ×

    Kindly complete the form below to receive a free sample of this Report

    Leading companies partner with us for data-driven Insights

    clients tt-cursor

    Ethylene Acrylic Acid Copolymers Market

    ID: MRFR/CnM/23576-HCR
    111 Pages
    Chitranshi Jaiswal
    September 2025

    Ethylene Acrylic Acid (EAA) Copolymers Market Research Report: By Grade (Automotive, Packaging, Medical, Construction, Industrial), By Application (Blow Molding, Film Extrusion, Injection Molding, Coextrusion, Blending), By End-Use Industry (Automotive & Transportation, Food & Beverage, Medical & Healthcare, Construction, Electronics), By Manufacturing Process (Free Radical Solution Polymerization, Ethylene Oxide Comonomer Polymerization), By Molecular Weight (Low Molecular Weight, Medium Molecular Weight, High Molecular Weight) ...

    Share:
    Download PDF ×

    We do not share your information with anyone. However, we may send you emails based on your report interest from time to time. You may contact us at any time to opt-out.

    Ethylene Acrylic Acid (EAA) Copolymers  Market Research Report - Global Forecast by 2034 Infographic
    Purchase Options
    $ 4,950.0
    $ 5,950.0
    $ 7,250.0
    Table of Contents

    Ethylene Acrylic Acid Copolymers Market Summary

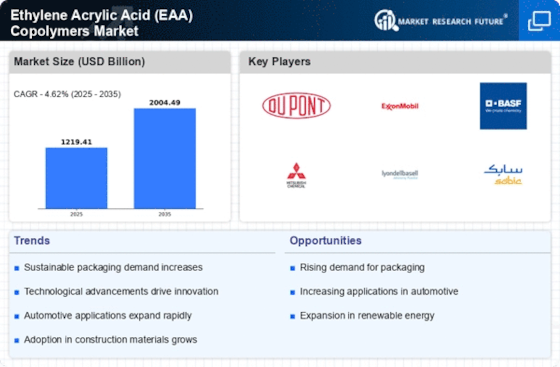
    The Global Ethylene Acrylic Acid (EAA) Copolymers Market is projected to grow from 1219.4 USD Billion in 2024 to 2004.1 USD Billion by 2035.

    Key Market Trends & Highlights

    Ethylene Acrylic Acid (EAA) Copolymers Key Trends and Highlights

    • The market is expected to experience a compound annual growth rate (CAGR) of 4.62 percent from 2025 to 2035.
    • By 2035, the market valuation is anticipated to reach 2004.1 USD Billion, indicating robust growth potential.
    • In 2024, the market is valued at 1219.4 USD Billion, reflecting a strong foundation for future expansion.
    • Growing adoption of EAA copolymers in packaging applications due to their excellent barrier properties is a major market driver.

    Market Size & Forecast

    2024 Market Size 1219.4 (USD Billion)
    2035 Market Size 2004.1 (USD Billion)
    CAGR (2025-2035) 4.62%

    Major Players

    DuPont, ExxonMobil, Mitsubishi Chemical Corporation, Jiangsu Yangnong Chemical Group Co., Ltd., Formosa Plastics Corporation, Toray Industries, Inc., Lanxess AG, Arkema S.A., LyondellBasell Industries Holdings, Dow Chemical Company, Chevron Phillips Chemical Company LLC, LG Chem, Kuraray Co., Ltd., Mitsui Chemicals, Inc., SABIC

    Ethylene Acrylic Acid Copolymers Market Trends

    The ethylene acrylic acid (EAA) copolymers market is projected to witness steady growth in the coming years, owing to the rising demand for performance-oriented polymers in various industries.The key market drivers include the increasing adoption of EAA copolymers in automotive, packaging, and construction applications due to their exceptional properties, such as high strength, flexibility, and resistance to chemicals and weathering.Additionally, the growing trend towards lightweight and cost-effective materials is further driving the demand for EAA copolymers.Opportunities for market expansion lie in the exploration of new applications for EAA copolymers in industries such as healthcare and electronics, where demand for high-performance and biocompatible materials is increasing.Recent trends in the market include the development of advanced EAA copolymers with enhanced properties, such as improved barrier performance and adhesion strength, which cater to specific industry requirements.The use of sustainable feedstocks and environmentally friendly production processes is also gaining momentum, creating opportunities for the development of green EAA copolymers.

    The demand for Ethylene Acrylic Acid copolymers is poised to expand as industries increasingly recognize their versatility and performance in applications ranging from packaging to automotive components.

    U.S. Department of Energy

    Ethylene Acrylic Acid Copolymers Market Drivers

    Market Growth Projections

    The Global Ethylene Acrylic Acid EAA Copolymers Market Industry is projected to experience substantial growth over the next decade. With a market value expected to reach 1219.4 USD Billion in 2024 and 2004.1 USD Billion by 2035, the industry is poised for a robust expansion. The anticipated CAGR of 4.62% from 2025 to 2035 indicates a steady increase in demand across various sectors, including packaging, automotive, and construction. This growth is likely driven by the rising need for high-performance materials that offer durability, sustainability, and versatility, positioning EAA copolymers as a key player in the global materials market.

    Growth in Automotive Sector

    The automotive industry is a significant driver for the Global Ethylene Acrylic Acid EAA Copolymers Market Industry, as manufacturers increasingly seek lightweight materials to improve fuel efficiency. EAA copolymers are utilized in various automotive applications, including adhesives, coatings, and interior components, due to their durability and resistance to environmental factors. The shift towards electric vehicles is also likely to bolster demand, as these vehicles require advanced materials for battery encapsulation and insulation. This trend aligns with the projected growth of the market, which is expected to expand at a CAGR of 4.62% from 2025 to 2035, reaching 2004.1 USD Billion by 2035.

    Expansion in Electronics Sector

    The electronics sector is emerging as a vital driver for the Global Ethylene Acrylic Acid EAA Copolymers Market Industry, as these materials are increasingly used in the production of electronic components. EAA copolymers offer excellent electrical insulation properties, making them suitable for applications in wire and cable coatings, connectors, and circuit boards. As the demand for consumer electronics continues to rise, driven by technological advancements and increased connectivity, the need for high-performance materials like EAA copolymers is likely to grow. This trend may further solidify the market's position, contributing to its anticipated expansion in the coming years.

    Increasing Applications in Construction

    The construction industry is increasingly adopting Ethylene Acrylic Acid EAA Copolymers due to their superior adhesion and weather resistance properties. These copolymers are utilized in sealants, adhesives, and coatings, which are essential for ensuring the longevity and durability of construction materials. As urbanization continues to rise globally, the demand for high-performance construction materials is expected to grow. The Global Ethylene Acrylic Acid EAA Copolymers Market Industry stands to benefit from this trend, as EAA copolymers provide solutions that enhance the performance of construction applications. This growing demand may contribute to the market's projected growth trajectory in the coming years.

    Rising Demand in Packaging Applications

    The Global Ethylene Acrylic Acid EAA Copolymers Market Industry is experiencing a surge in demand driven by the packaging sector. EAA copolymers are increasingly utilized in flexible packaging due to their excellent adhesion properties and moisture barrier capabilities. This trend is particularly evident in food packaging, where the need for extended shelf life is paramount. The market is projected to reach 1219.4 USD Billion in 2024, reflecting the growing preference for high-performance materials in packaging. As sustainability becomes a focal point, EAA copolymers are also favored for their recyclability, further enhancing their appeal in the packaging industry.

    Technological Advancements in Production

    Technological innovations in the production of Ethylene Acrylic Acid EAA Copolymers are enhancing the efficiency and quality of these materials. Advanced polymerization techniques and improved catalysts are enabling manufacturers to produce EAA copolymers with tailored properties, meeting specific industry requirements. This development is crucial for the Global Ethylene Acrylic Acid EAA Copolymers Market Industry, as it allows for the creation of high-performance products that can compete with traditional materials. Furthermore, the adoption of sustainable production methods is gaining traction, which may attract environmentally conscious consumers and businesses alike, thereby expanding the market's reach.

    Market Segment Insights

    Ethylene Acrylic Acid (EAA) Copolymers Market Grade Insights

    The automotive segment held the largest market share of 32.4% in 2023 and is projected to reach USD 570.43 billion by 2024, growing at a CAGR of 4.8%. The growth of the automotive segment can be attributed to the increasing demand for lightweight and fuel-efficient vehicles.Ethylene acrylic acid copolymers are used in automotive applications such as bumpers, dashboards, and interior trim.The packaging segment is expected to be the second-largest segment in the Ethylene Acrylic Acid (EAA) Copolymers Market.

    The segment is projected to reach USD 356.87 billion by 2024, growing at a CAGR of 5.2%.The growth of the packaging segment can be attributed to the increasing demand for flexible and lightweight packaging solutions. Ethylene acrylic acid copolymers are used in packaging applications such as films, bags, and bottles.The medical segment is expected to be the third-largest segment in the market. The segment is projected to reach USD 270.85 billion by 2024, growing at a CAGR of 5.6%.The growth of the medical segment can be attributed to the increasing demand for medical devices and equipment.

    Ethylene acrylic acid copolymers are used in medical applications such as catheters, tubing, and surgical drapes.The construction segment is expected to be the fourth-largest segment in the market. The segment is projected to reach USD 225.98 billion by 2024, growing at a CAGR of 5.3%. The growth of the construction segment can be attributed to the increasing demand for building and construction materials.Ethylene acrylic acid copolymers are used in construction applications such as roofing membranes, flooring, and wall coverings. The industrial segment is expected to be the fifth-largest segment in the market.

    The segment is projected to reach USD 209.76 billion by 2024, growing at a CAGR of 5.1%.The growth of the industrial segment can be attributed to the increasing demand for industrial products and equipment. Ethylene acrylic acid copolymers are used in industrial applications such as wires and cables, hoses, and belts. 

    Source: Primary Research, Secondary Research, Market Research Future Database and Analyst Review

    Ethylene Acrylic Acid (EAA) Copolymers Market Application Insights

    The major application segments of the Ethylene Acrylic Acid (EAA) Copolymers Market are blow molding, film extrusion, injection molding, coextrusion, and blending.

    Of these, the blow molding segment accounted for the largest revenue share in 2023 and is projected to retain its dominance throughout the forecast period.The growth of this segment can be attributed to the increasing demand for EAA copolymers in the manufacture of bottles, containers, and other hollow objects.Film extrusion also accounted for a sizeable share of the market, owing to the increasing use of EAA copolymers in the manufacture of films and sheets used in packaging and construction.Injection molding is likely to register the highest growth as the use of EAA copolymers in automotive and consumer electronics is increasing.

    Coextrusion and blending are niche application segments but are likely to grow at a moderate pace due to their unique properties and uses in a range of industries.

    Ethylene Acrylic Acid (EAA) Copolymers Market End-Use Industry Insights

    The Ethylene Acrylic Acid (EAA) Copolymers Market segmentation by End-Use Industry offers valuable insights into the market dynamics and growth potential of various end-use industries that utilize Ethylene Acrylic Acid (EAA) Copolymers.The key end-use industries include Automotive Transportation, Food Beverage, Medical Healthcare, Construction, and Electronics.In 2023, the Automotive Transportation segment held the largest market share, driven by the increasing production of lightweight vehicles and the growing demand for durable and versatile materials in the automotive sector.The Food Beverage segment is expected to witness significant growth over the forecast period due to the rising consumption of packaged food and beverages and the need for safe and compliant packaging solutions.The Medical Healthcare segment is projected to expand at a steady pace, fueled by the aging population and the rising demand for advanced medical devices and healthcare products.The Construction segment is expected to show moderate growth, driven by the increasing construction activities in emerging economies and the growing adoption of energy-efficient building materials.The Electronics segment is anticipated to grow at a promising rate due to the increasing demand for electronic devices and the adoption of Ethylene Acrylic Acid (EAA) Copolymers in electronic components.Overall, the segmentation of the Ethylene Acrylic Acid (EAA) Copolymers Market by End-Use Industry provides a comprehensive understanding of the market dynamics and growth opportunities across various industries.

    Ethylene Acrylic Acid (EAA) Copolymers Market Manufacturing Process Insights

    The manufacturing process is a crucial aspect of the Ethylene Acrylic Acid (EAA) Copolymers Market as it determines the properties and quality of the final product.Among the key manufacturing processes employed in the Ethylene Acrylic Acid (EAA) Copolymers Market are Free Radical Solution Polymerization and Ethylene Oxide Comonomer Polymerization.Free Radical Solution Polymerization is a widely adopted technique that involves the use of free radical initiators to trigger the polymerization reaction.

    It offers advantages such as high conversion rates and the ability to produce copolymers with tailored properties.The Ethylene Acrylic Acid (EAA) Copolymers Market revenue generated through Free Radical Solution Polymerization is substantial and is projected to grow steadily in the coming years.Ethylene Oxide Comonomer Polymerization, on the other hand, utilizes ethylene oxide as a comonomer to enhance the copolymer's properties.

    This process allows for the incorporation of specific functional groups, leading to improved adhesion, flexibility, and other desirable characteristics.The Ethylene Acrylic Acid (EAA) Copolymers Market share attributed to Ethylene Oxide Comonomer Polymerization is significant and is expected to increase in the future, driven by the growing demand for high-performance copolymers in various industries.

    Ethylene Acrylic Acid (EAA) Copolymers Market Molecular Weight Insights

    The Ethylene Acrylic Acid (EAA) Copolymers Market is segmented by molecular weight into low molecular weight, medium molecular weight, and high molecular weight. The low molecular weight segment accounted for the largest share of the market in 2023, with a valuation of 623.4 (USD Billion).This is due to the increasing demand for low molecular weight EAA copolymers in various applications, such as adhesives, sealants, and coatings.

    The medium molecular weight segment is expected to grow at a CAGR of 4.8% during the forecast period, reaching a valuation of 453.7 (USD Billion) by 2032.The high molecular weight segment is expected to grow at a CAGR of 4.5% during the forecast period, reaching a valuation of 384.1 (USD Billion) by 2032.The growth of the Ethylene Acrylic Acid (EAA) Copolymers Market is driven by several factors, including the increasing demand for lightweight and durable materials in various industries, such as automotive, construction, and packaging.EAA copolymers are also used in a variety of medical applications, such as drug delivery and tissue engineering.

    The market is expected to continue to grow in the coming years, driven by the increasing demand for these materials in various applications.

    Get more detailed insights about Ethylene Acrylic Acid (EAA) Copolymers Market Research Report - Global Forecast by 2034

    Regional Insights

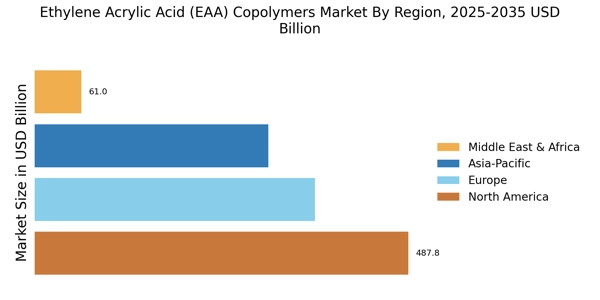
    The Ethylene Acrylic Acid (EAA) Copolymers Market is segmented into North America, Europe, APAC, South America, and MEA. Regionally, APAC accounted for the largest revenue share in the Ethylene Acrylic Acid (EAA) Copolymers Market in 2023.The increasing demand for EAA copolymers in the automotive and packaging industries in the region is driving the growth of the market.Moreover, the presence of many automotive and packaging manufacturers in the region is also contributing to the growth of the market.

    The market in Europe is expected to witness a steady growth rate during the forecast period.This is due to the increasing demand for EAA copolymers in the construction and automotive industries in the region. The North American market is also expected to grow at a significant rate during the forecast period.The increasing demand for EAA copolymers in the packaging and consumer goods industries is driving the growth of the market in this region.

    The market in South America is expected to witness a moderate growth rate during the forecast period.The increasing demand for EAA copolymers in the automotive and packaging industries is driving the growth of the market in this region.The market in MEA is expected to witness a slow growth rate during the forecast period. The increasing demand for EAA copolymers in the construction and automotive industries is driving the growth of the market in this region. 

    Source: Primary Research, Secondary Research, Market Research Future Database and Analyst Review

    Key Players and Competitive Insights

    As part of the current Ethylene Acrylic Acid (EAA) Copolymers Market industrial environment, major players are frequently aiming to bolster their market prospects through relationship, acquisition and collaboration actions.In addition, major Ethylene Acrylic Acid (EAA) Copolymers Market industrial providers are making a substantial commitment to the analysis and development of novel products, thus expanding the product's own offerings.The Ethylene Acrylic Acid (EAA) Copolymers Market industrial activity is expected to grow meaningfully in the upcoming future as a function of the growth in demand across a high number of other industrial end-use sectors, together with automotive, packaging, and building applications.Both local and Ethylene Acrylic Acid (EAA) Copolymers Market leading providers are operating in the industrial environment, comprising of both a high degree of competition and a profusion of growth possibilities.Hence, key industry players are actively escalating their addressing of geographically distant markets and sales channels development to cater to growing Ethylene Acrylic Acid (EAA) Copolymers demand.The leading Ethylene Acrylic Acid (EAA) Copolymers Market provider across the designated industrial environment is the DuPont enterprise.The company is the world’s leading provider of Ethylene Acrylic Acid (EAA) Copolymers, distributing both its in-house Elvax, Nucrel and Bynel products.

    The company possesses a strong industrial foothold across automotive, packaging, and building industries’ end-use sectors.Key enterprise to the Ethylene Acrylic Acid (EAA) Copolymers Market, DuPont is in addition duly considering the significant role of sustainability, developing a richness of novel innovative products.The competitor enterprise within the addressed Ethylene Acrylic Acid (EAA) Copolymers Market is the ExxonMobil enterprise.

    ExxonMobil, a energy and petrochemical concern, currently owns a profound interest in Ethylene Acrylic Acid (EAA) Copolymers, providing both Exxelor and Exact products.ExxonMobil possesses a strong presence across the automotive, packaging, and building industrial sectors.The vast involvement of ExxonMobil in the enterprise’s industrial activity is supported by a substantial share of patented technologies of Ethylene Acrylic, along with the active pursuit of R solutions for developing novel products.

    Key Companies in the Ethylene Acrylic Acid Copolymers Market market include

    Industry Developments

    The growing demand for EAA copolymers in various end-use industries, such as automotive, packaging, and construction, is driving market growth.The increasing adoption of lightweight materials in the automotive industry to improve fuel efficiency and reduce emissions is contributing to the demand for EAA copolymers.Additionally, the growing trend of sustainable packaging is fueling the demand for bio-based EAA copolymers.Recent developments include the launch of new grades of EAA copolymers with improved properties and the expansion of production capacities by major manufacturers.

    Future Outlook

    Ethylene Acrylic Acid Copolymers Market Future Outlook

    The Ethylene Acrylic Acid (EAA) Copolymers Market is projected to grow at a 4.62% CAGR from 2024 to 2035, driven by increasing demand in packaging and automotive applications.

    New opportunities lie in:

    • Develop bio-based EAA copolymers to cater to sustainability trends.
    • Invest in advanced manufacturing technologies to enhance production efficiency.
    • Expand applications in the medical sector for innovative packaging solutions.

    By 2035, the Ethylene Acrylic Acid (EAA) Copolymers Market is expected to achieve robust growth, reflecting evolving industry needs.

    Market Segmentation

    Ethylene Acrylic Acid (EAA) Copolymers Market Grade Outlook

    • Automotive
    • Packaging
    • Medical
    • Construction
    • Industrial

    Ethylene Acrylic Acid (EAA) Copolymers Market Regional Outlook

    • North America
    • Europe
    • South America
    • Asia-Pacific
    • Middle East and Africa

    Ethylene Acrylic Acid (EAA) Copolymers Market Application Outlook

    • Blow Molding
    • Film Extrusion
    • Injection Molding
    • Coextrusion
    • Blending

    Ethylene Acrylic Acid (EAA) Copolymers Market End-Use Industry Outlook

    • Automotive Transportation
    • Food Beverage
    • Medical Healthcare
    • Construction
    • Electronics

    Ethylene Acrylic Acid (EAA) Copolymers Market Molecular Weight Outlook

    • Low Molecular Weight
    • Medium Molecular Weight
    • High Molecular Weight

    Ethylene Acrylic Acid (EAA) Copolymers Market Manufacturing Process Outlook

    • Free Radical Solution Polymerization
    • Ethylene Oxide Comonomer Polymerization

    Report Scope

    Report Attribute/Metric Details
    Market Size 2024 1,219.41 (USD Billion)
    Market Size 2025 1,275.77 (USD Billion)
    Market Size 2034 1,915.94 (USD Billion)
    Compound Annual Growth Rate (CAGR) 4.6% (2025 - 2034)
    Report Coverage Revenue Forecast, Competitive Landscape, Growth Factors, and Trends
    Base Year 2024
    Market Forecast Period 2025 - 2034
    Historical Data 2020 - 2024
    Market Forecast Units USD Billion
    Key Companies Profiled Mitsubishi Chemical Corporation, Jiangsu Yangnong Chemical Group Co., Ltd., Formosa Plastics Corporation, Toray Industries, Inc., ExxonMobil Chemical Company, Lanxess AG, Arkema SA, LyondellBasell Industries Holdings, Dow Chemical Company, Chevron Phillips Chemical Company LLC, LG Chem, Kuraray Co., Ltd., Mitsui Chemicals, Inc., SABIC
    Segments Covered Grade, Application, End-Use Industry, Manufacturing Process, Molecular Weight, Regional
    Key Market Opportunities Growing demand in packaging, increasing use in the automotive industry, expanding medical applications, rising adoption in consumer electronics, surging construction industry
    Key Market Dynamics Rising demand Technological advancements Growing applications Environmental concerns Increased focus on sustainability
    Countries Covered North America, Europe, APAC, South America, MEA

    Market Highlights

    Author
    Chitranshi Jaiswal
    Research Analyst Level I

    In her 3 years of experience in the market research field, she has handled critical cross-domain projects. She has an in-depth knowledge of market estimation & analysis, problem-solving, primary as well as secondary research, and team management.She holds an engineering degree and is an MBA professional from a well-known university, capable of evaluating the market and competitive conditions. An exceptional strategist with excellent communication skills and a passion for delivering cutting-edge & practical insights for the market. Proficient in multi-tasking, and can successfully deal with competing demands, while maintaining complete confidentiality. Generated business through active client and project development, networking, and high-quality responses. Her knowledge and skills have helped in making solid business decisions, securing funding from investors, and avoiding business failures.

    Leave a Comment

    FAQs

    What is the current size of the Ethylene Acrylic Acid (EAA) Copolymers Market?

    The Ethylene Acrylic Acid (EAA) Copolymers Market is expected to reach a valuation of 1,275.77 billion USD by 2025.

    What is the projected CAGR of the Ethylene Acrylic Acid (EAA) Copolymers Market?

    The Ethylene Acrylic Acid (EAA) Copolymers Market is anticipated to grow at a CAGR of 4.6% from 2025 to 2034.

    Which region is expected to dominate the Ethylene Acrylic Acid (EAA) Copolymers Market?

    The Asia-Pacific region is projected to dominate the Ethylene Acrylic Acid (EAA) Copolymers Market, owing to increasing demand from the automotive and packaging industries.

    What are the major applications of Ethylene Acrylic Acid (EAA) Copolymers?

    Ethylene Acrylic Acid (EAA) Copolymers are primarily used in the manufacturing of automotive parts, packaging materials, and construction materials.

    Who are the key competitors in the Ethylene Acrylic Acid (EAA) Copolymers Market?

    Major players in the Ethylene Acrylic Acid (EAA) Copolymers Market include The Dow Chemical Company, ExxonMobil Chemical Company, and LG Chem.

    What are the growth drivers of the Ethylene Acrylic Acid (EAA) Copolymers Market?

    The growth of the Ethylene Acrylic Acid (EAA) Copolymers Market is primarily driven by increasing demand from the automotive industry, rising awareness of lightweight and durable materials, and expanding applications in packaging and construction.

    What are the challenges faced by the Ethylene Acrylic Acid (EAA) Copolymers Market?

    The Ethylene Acrylic Acid (EAA) Copolymers Market faces challenges such as fluctuating raw material prices, intense competition, and stringent environmental regulations.

    What are the opportunities for the Ethylene Acrylic Acid (EAA) Copolymers Market?

    Opportunities in the Ethylene Acrylic Acid (EAA) Copolymers Market lie in the development of new applications in the medical and healthcare sectors, expansion into emerging markets, and collaborations for product innovation.

    What are the key trends shaping the Ethylene Acrylic Acid (EAA) Copolymers Market?

    Key trends shaping the Ethylene Acrylic Acid (EAA) Copolymers Market include the adoption of sustainable and eco-friendly materials, increasing demand for lightweight and high-performance polymers, and the development of advanced technologies for polymer processing.

    What is the expected market value of the Ethylene Acrylic Acid (EAA) Copolymers Market in 2034?

    The Ethylene Acrylic Acid (EAA) Copolymers Market is projected to reach a valuation of 1,915.94 billion USD by 2034.

    1.   1. EXECUTIVE SUMMARY 
    2.         1.1. Market Overview 
    3.         1.2. Key Findings 
    4.   1.3. Market Segmentation 
    5.         1.4. Competitive Landscape 
    6.         1.5. Challenges and Opportunities 
    7.         1.6. Future Outlook 
    8.     2. MARKET INTRODUCTION 
    9.   2.1. Definition 
    10.         2.2. Scope of the study 
    11.             2.2.1. Research Objective 
    12.             2.2.2. Assumption 
    13.           2.2.3. Limitations 
    14. RESEARCH METHODOLOGY 
    15.         3.1. Overview 
    16.         3.2. Data Mining 
      1. Secondary Research 
    17.         3.4. Primary Research 
    18.             3.4.1. Primary Interviews and Information
    19. Gathering Process 
    20.             3.4.2. Breakdown
    21. of Primary Respondents 
    22.         3.5. Forecasting Model 
    23.         3.6. Market Size Estimation 
    24.         3.6.1. Bottom-Up Approach 
    25.       3.6.2. Top-Down Approach 
      1. Data Triangulation 
    26.         3.8. Validation 
    27.     4. MARKET DYNAMICS 
    28.         4.1. Overview 
      1. Drivers 
    29.         4.3. Restraints 
    30.       4.4. Opportunities 
    31.     5. MARKET FACTOR ANALYSIS 
    32.         5.1. Value chain Analysis 
    33.         5.2. Porter's Five Forces Analysis 
    34.           5.2.1. Bargaining Power of Suppliers 
    35.             5.2.2. Bargaining Power of Buyers 
    36.             5.2.3. Threat of New Entrants 
    37.             5.2.4. Threat of Substitutes 
    38.             5.2.5. Intensity of Rivalry 
    39.         5.3. COVID-19 Impact Analysis 
    40.         5.3.1. Market Impact Analysis 
    41.         5.3.2. Regional Impact 
    42.       5.3.3. Opportunity and Threat Analysis 
    43.     6. Ethylene Acrylic Acid Eaa Copolymers
    44. Market, BY Grade (USD Billion) 
    45.         6.1. Automotive 
    46.         6.2. Packaging 
      1. Medical 
    47.         6.4. Construction 
    48.       6.5. Industrial 
    49.     7. Ethylene Acrylic
    50. Acid Eaa Copolymers Market, BY Application (USD Billion) 
    51.     7.1. Blow Molding 
    52.         7.2. Film
    53. Extrusion 
    54.         7.3. Injection Molding 
    55.         7.4. Coextrusion 
      1. Blending 
    56.     8. Ethylene Acrylic Acid Eaa Copolymers Market,
    57. BY End-Use Industry (USD Billion) 
    58.         8.1. Automotive
    59. & Transportation 
    60.         8.2. Food & Beverage 
    61.         8.3. Medical & Healthcare 
    62.     8.4. Construction 
    63.         8.5. Electronics 
    64.     9. Ethylene Acrylic Acid Eaa Copolymers Market, BY Manufacturing
    65. Process (USD Billion) 
    66.         9.1. Free Radical Solution
    67. Polymerization 
    68.         9.2. Ethylene Oxide Comonomer
    69. Polymerization 
    70.     10. Ethylene Acrylic Acid Eaa Copolymers
    71. Market, BY Molecular Weight (USD Billion) 
      1. Low Molecular Weight 
    72.         10.2. Medium Molecular
    73. Weight 
    74.         10.3. High Molecular Weight 
    75.     11. Ethylene Acrylic Acid Eaa Copolymers Market, BY Regional (USD
    76. Billion) 
    77.         11.1. North America 
    78.           11.1.1. US 
    79.     11.1.2. Canada 
    80.         11.2. Europe 
    81.             11.2.1. Germany 
    82.         11.2.2. UK 
    83.   11.2.3. France 
    84. Russia 
    85.             11.2.5. Italy 
    86.             11.2.6. Spain 
    87.         11.2.7. Rest of Europe 
    88.   11.3. APAC 
    89.             11.3.1. China 
    90.             11.3.2. India 
    91.         11.3.3. Japan 
    92.     11.3.4. South Korea 
    93.   11.3.5. Malaysia 
    94. Thailand 
    95.             11.3.7. Indonesia 
    96.             11.3.8. Rest of APAC 
    97.       11.4. South America 
    98.     11.4.1. Brazil 
      1. Mexico 
    99.             11.4.3. Argentina 
    100.             11.4.4. Rest of South America 
    101.         11.5. MEA 
    102.   11.5.1. GCC Countries 
      1. South Africa 
    103. Rest of MEA 
    104.     12. Competitive Landscape 
    105.         12.1. Overview 
    106.       12.2. Competitive Analysis 
    107.   12.3. Market share Analysis 
    108. Major Growth Strategy in the Ethylene Acrylic Acid Eaa Copolymers Market 
    109.         12.5. Competitive Benchmarking 
    110.     12.6. Leading Players in Terms of Number of Developments in the Ethylene
    111. Acrylic Acid Eaa Copolymers Market 
    112. Key developments and growth strategies 
    113.   12.7.1. New Product Launch/Service Deployment 
    114.       12.7.2. Merger & Acquisitions 
    115.         12.7.3. Joint Ventures 
    116.   12.8. Major Players Financial Matrix 
    117.     12.8.1. Sales and Operating Income 
    118.       12.8.2. Major Players R&D Expenditure. 2023 
    119.   13. Company Profiles 
    120.         13.1. Mitsubishi
    121. Chemical Corporation 
    122. Financial Overview 
    123. Products Offered 
    124.             13.1.3. Key
    125. Developments 
    126.             13.1.4. SWOT Analysis 
    127.             13.1.5. Key Strategies 
    128.       13.2. Jiangsu Yangnong Chemical Group Co., Ltd. 
    129.           13.2.1. Financial Overview 
    130.           13.2.2. Products Offered 
    131.         13.2.3. Key Developments 
    132.       13.2.4. SWOT Analysis 
    133.     13.2.5. Key Strategies 
    134. Formosa Plastics Corporation 
      1. Financial Overview 
        1. Products Offered 
    135. Key Developments 
    136.             13.3.4. SWOT
    137. Analysis 
    138.             13.3.5. Key Strategies 
    139.         13.4. Toray Industries, Inc. 
    140.         13.4.1. Financial Overview 
    141.         13.4.2. Products Offered 
    142.       13.4.3. Key Developments 
    143.     13.4.4. SWOT Analysis 
    144.   13.4.5. Key Strategies 
    145.         13.5. ExxonMobil
    146. Chemical Company 
    147.             13.5.1. Financial
    148. Overview 
    149.             13.5.2. Products Offered 
    150.             13.5.3. Key Developments 
    151.           13.5.4. SWOT Analysis 
    152.         13.5.5. Key Strategies 
    153.   13.6. Lanxess AG 
    154. Financial Overview 
    155. Products Offered 
    156.             13.6.3. Key
    157. Developments 
    158.             13.6.4. SWOT Analysis 
    159.             13.6.5. Key Strategies 
    160.       13.7. Arkema SA 
    161.   13.7.1. Financial Overview 
    162.   13.7.2. Products Offered 
      1. Key Developments 
    163. SWOT Analysis 
    164.             13.7.5. Key Strategies 
    165.         13.8. LyondellBasell Industries Holdings 
    166.             13.8.1. Financial Overview 
    167.             13.8.2. Products Offered 
    168.           13.8.3. Key Developments 
    169.         13.8.4. SWOT Analysis 
    170.       13.8.5. Key Strategies 
      1. Dow Chemical Company 
        1. Financial Overview 
        2. Products Offered 
    171. Key Developments 
    172.             13.9.4. SWOT
    173. Analysis 
    174.             13.9.5. Key Strategies 
    175.         13.10. Chevron Phillips Chemical Company LLC 
    176.             13.10.1. Financial Overview 
    177.             13.10.2. Products Offered 
    178.           13.10.3. Key Developments 
    179.         13.10.4. SWOT Analysis 
    180.       13.10.5. Key Strategies 
      1. LG Chem 
    181.             13.11.1. Financial
    182. Overview 
    183.             13.11.2. Products
    184. Offered 
    185.             13.11.3. Key Developments 
    186.             13.11.4. SWOT Analysis 
    187.           13.11.5. Key Strategies 
    188.     13.12. Kuraray Co., Ltd. 
    189.   13.12.1. Financial Overview 
    190.   13.12.2. Products Offered 
      1. Key Developments 
    191. SWOT Analysis 
    192.             13.12.5. Key
    193. Strategies 
    194.         13.13. Mitsui Chemicals, Inc. 
    195.             13.13.1. Financial Overview 
    196.             13.13.2. Products Offered 
    197.           13.13.3. Key Developments 
    198.         13.13.4. SWOT Analysis 
    199.       13.13.5. Key Strategies 
      1. SABIC 
    200.             13.14.1. Financial
    201. Overview 
    202.             13.14.2. Products
    203. Offered 
    204.             13.14.3. Key Developments 
    205.             13.14.4. SWOT Analysis 
    206.           13.14.5. Key Strategies 
    207. Appendix 
    208.         14.1. References 
    209.       14.2. Related Reports 
    210.     Table 1. LIST OF ASSUMPTIONS 
    211.     Table 2. North
    212. America Ethylene Acrylic Acid Eaa Copolymers Market SIZE ESTIMATES & FORECAST,
    213. BY GRADE, 2025 - 2034 (USD Billions) 
    214.     Table 3. North America
    215. Ethylene Acrylic Acid Eaa Copolymers Market SIZE ESTIMATES & FORECAST, BY APPLICATION,
    216. 2034 (USD Billions) 
    217.     Table 4. North America Ethylene
    218. Acrylic Acid Eaa Copolymers Market SIZE ESTIMATES & FORECAST, BY END-USE INDUSTRY,
    219. 2034 (USD Billions) 
    220.     Table 5. North America Ethylene
    221. Acrylic Acid Eaa Copolymers Market SIZE ESTIMATES & FORECAST, BY MANUFACTURING
    222. PROCESS, 2025 - 2034 (USD Billions) 
    223.     Table 6. North America
    224. Ethylene Acrylic Acid Eaa Copolymers Market SIZE ESTIMATES & FORECAST, BY MOLECULAR
    225. WEIGHT, 2025 - 2034 (USD Billions) 
    226.     Table 7. North America
    227. Ethylene Acrylic Acid Eaa Copolymers Market SIZE ESTIMATES & FORECAST, BY REGIONAL,
    228. 2034 (USD Billions) 
    229.     Table 8. US Ethylene Acrylic
    230. Acid Eaa Copolymers Market SIZE ESTIMATES & FORECAST, BY GRADE, 2025 - 2034
    231. (USD Billions) 
    232.     Table 9. US Ethylene Acrylic Acid Eaa Copolymers
    233. Market SIZE ESTIMATES & FORECAST, BY APPLICATION, 2025 - 2034 (USD Billions) 
    234.     Table 10. US Ethylene Acrylic Acid Eaa Copolymers Market SIZE ESTIMATES
    235. & FORECAST, BY END-USE INDUSTRY, 2025 - 2034 (USD Billions) 
    236.   Table 11. US Ethylene Acrylic Acid Eaa Copolymers Market SIZE ESTIMATES &
    237. FORECAST, BY MANUFACTURING PROCESS, 2025 - 2034 (USD Billions) 
    238.   Table 12. US Ethylene Acrylic Acid Eaa Copolymers Market SIZE ESTIMATES &
    239. FORECAST, BY MOLECULAR WEIGHT, 2025 - 2034 (USD Billions) 
    240. BY REGIONAL, 2025 - 2034 (USD Billions) 
    241.     Table 14. Canada
    242. Ethylene Acrylic Acid Eaa Copolymers Market SIZE ESTIMATES & FORECAST, BY GRADE,
    243. 2034 (USD Billions) 
    244.     Table 15. Canada Ethylene Acrylic
    245. Acid Eaa Copolymers Market SIZE ESTIMATES & FORECAST, BY APPLICATION, 2025 -
    246. (USD Billions) 
    247.     Table 16. Canada Ethylene Acrylic Acid
    248. Eaa Copolymers Market SIZE ESTIMATES & FORECAST, BY END-USE INDUSTRY, 2025 -
    249. (USD Billions) 
    250.     Table 17. Canada Ethylene Acrylic Acid
    251. Eaa Copolymers Market SIZE ESTIMATES & FORECAST, BY MANUFACTURING PROCESS, 2025
    252. - 2034 (USD Billions) 
    253.     Table 18. Canada Ethylene Acrylic
    254. Acid Eaa Copolymers Market SIZE ESTIMATES & FORECAST, BY MOLECULAR WEIGHT, 2025
    255. - 2034 (USD Billions) 
    256.     Table 19. Canada Ethylene Acrylic
    257. Acid Eaa Copolymers Market SIZE ESTIMATES & FORECAST, BY REGIONAL, 2025 - 2034
    258. (USD Billions) 
    259.     Table 20. Europe Ethylene Acrylic Acid Eaa
    260. Copolymers Market SIZE ESTIMATES & FORECAST, BY GRADE, 2025 - 2034 (USD Billions) 
    261.     Table 21. Europe Ethylene Acrylic Acid Eaa Copolymers Market SIZE
    262. ESTIMATES & FORECAST, BY APPLICATION, 2025 - 2034 (USD Billions) 
    263.   Table 22. Europe Ethylene Acrylic Acid Eaa Copolymers Market SIZE ESTIMATES
    264. & FORECAST, BY END-USE INDUSTRY, 2025 - 2034 (USD Billions) 
    265.   Table 23. Europe Ethylene Acrylic Acid Eaa Copolymers Market SIZE ESTIMATES
    266. & FORECAST, BY MANUFACTURING PROCESS, 2025 - 2034 (USD Billions) 
    267.   Table 24. Europe Ethylene Acrylic Acid Eaa Copolymers Market SIZE ESTIMATES
    268. & FORECAST, BY MOLECULAR WEIGHT, 2025 - 2034 (USD Billions) 
    269.   Table 25. Europe Ethylene Acrylic Acid Eaa Copolymers Market SIZE ESTIMATES
    270. & FORECAST, BY REGIONAL, 2025 - 2034 (USD Billions) 
    271. FORECAST, BY GRADE, 2025 - 2034 (USD Billions) 
    272.     Table 27.
    273. Germany Ethylene Acrylic Acid Eaa Copolymers Market SIZE ESTIMATES & FORECAST,
    274. BY APPLICATION, 2025 - 2034 (USD Billions) 
    275.     Table 28. Germany
    276. Ethylene Acrylic Acid Eaa Copolymers Market SIZE ESTIMATES & FORECAST, BY END-USE
    277. INDUSTRY, 2025 - 2034 (USD Billions) 
    278.     Table 29. Germany
    279. Ethylene Acrylic Acid Eaa Copolymers Market SIZE ESTIMATES & FORECAST, BY MANUFACTURING
    280. PROCESS, 2025 - 2034 (USD Billions) 
    281.     Table 30. Germany Ethylene
    282. Acrylic Acid Eaa Copolymers Market SIZE ESTIMATES & FORECAST, BY MOLECULAR WEIGHT,
    283. 2034 (USD Billions) 
    284.     Table 31. Germany Ethylene Acrylic
    285. Acid Eaa Copolymers Market SIZE ESTIMATES & FORECAST, BY REGIONAL, 2025 - 2034
    286. (USD Billions) 
    287.     Table 32. UK Ethylene Acrylic Acid Eaa Copolymers
    288. Market SIZE ESTIMATES & FORECAST, BY GRADE, 2025 - 2034 (USD Billions) 
    289.     Table 33. UK Ethylene Acrylic Acid Eaa Copolymers Market SIZE ESTIMATES
    290. & FORECAST, BY APPLICATION, 2025 - 2034 (USD Billions) 
    291. BY END-USE INDUSTRY, 2025 - 2034 (USD Billions) 
    292.     Table 35.
    293. UK Ethylene Acrylic Acid Eaa Copolymers Market SIZE ESTIMATES & FORECAST, BY
    294. MANUFACTURING PROCESS, 2025 - 2034 (USD Billions) 
    295.     Table
    296. UK Ethylene Acrylic Acid Eaa Copolymers Market SIZE ESTIMATES & FORECAST,
    297. BY MOLECULAR WEIGHT, 2025 - 2034 (USD Billions) 
    298.     Table 37.
    299. UK Ethylene Acrylic Acid Eaa Copolymers Market SIZE ESTIMATES & FORECAST, BY
    300. REGIONAL, 2025 - 2034 (USD Billions) 
    301.     Table 38. France Ethylene
    302. Acrylic Acid Eaa Copolymers Market SIZE ESTIMATES & FORECAST, BY GRADE, 2025
    303. - 2034 (USD Billions) 
    304.     Table 39. France Ethylene Acrylic
    305. Acid Eaa Copolymers Market SIZE ESTIMATES & FORECAST, BY APPLICATION, 2025 -
    306. (USD Billions) 
    307.     Table 40. France Ethylene Acrylic Acid
    308. Eaa Copolymers Market SIZE ESTIMATES & FORECAST, BY END-USE INDUSTRY, 2025 -
    309. (USD Billions) 
    310.     Table 41. France Ethylene Acrylic Acid
    311. Eaa Copolymers Market SIZE ESTIMATES & FORECAST, BY MANUFACTURING PROCESS, 2025
    312. - 2034 (USD Billions) 
    313.     Table 42. France Ethylene Acrylic
    314. Acid Eaa Copolymers Market SIZE ESTIMATES & FORECAST, BY MOLECULAR WEIGHT, 2025
    315. - 2034 (USD Billions) 
    316.     Table 43. France Ethylene Acrylic
    317. Acid Eaa Copolymers Market SIZE ESTIMATES & FORECAST, BY REGIONAL, 2025 - 2034
    318. (USD Billions) 
    319.     Table 44. Russia Ethylene Acrylic Acid Eaa
    320. Copolymers Market SIZE ESTIMATES & FORECAST, BY GRADE, 2025 - 2034 (USD Billions) 
    321.     Table 45. Russia Ethylene Acrylic Acid Eaa Copolymers Market SIZE
    322. ESTIMATES & FORECAST, BY APPLICATION, 2025 - 2034 (USD Billions) 
    323.   Table 46. Russia Ethylene Acrylic Acid Eaa Copolymers Market SIZE ESTIMATES
    324. & FORECAST, BY END-USE INDUSTRY, 2025 - 2034 (USD Billions) 
    325.   Table 47. Russia Ethylene Acrylic Acid Eaa Copolymers Market SIZE ESTIMATES
    326. & FORECAST, BY MANUFACTURING PROCESS, 2025 - 2034 (USD Billions) 
    327.   Table 48. Russia Ethylene Acrylic Acid Eaa Copolymers Market SIZE ESTIMATES
    328. & FORECAST, BY MOLECULAR WEIGHT, 2025 - 2034 (USD Billions) 
    329.   Table 49. Russia Ethylene Acrylic Acid Eaa Copolymers Market SIZE ESTIMATES
    330. & FORECAST, BY REGIONAL, 2025 - 2034 (USD Billions) 
    331. FORECAST, BY GRADE, 2025 - 2034 (USD Billions) 
    332.     Table 51.
    333. Italy Ethylene Acrylic Acid Eaa Copolymers Market SIZE ESTIMATES & FORECAST,
    334. BY APPLICATION, 2025 - 2034 (USD Billions) 
    335.     Table 52. Italy
    336. Ethylene Acrylic Acid Eaa Copolymers Market SIZE ESTIMATES & FORECAST, BY END-USE
    337. INDUSTRY, 2025 - 2034 (USD Billions) 
    338.     Table 53. Italy Ethylene
    339. Acrylic Acid Eaa Copolymers Market SIZE ESTIMATES & FORECAST, BY MANUFACTURING
    340. PROCESS, 2025 - 2034 (USD Billions) 
    341.     Table 54. Italy Ethylene
    342. Acrylic Acid Eaa Copolymers Market SIZE ESTIMATES & FORECAST, BY MOLECULAR WEIGHT,
    343. 2034 (USD Billions) 
    344.     Table 55. Italy Ethylene Acrylic
    345. Acid Eaa Copolymers Market SIZE ESTIMATES & FORECAST, BY REGIONAL, 2025 - 2034
    346. (USD Billions) 
    347.     Table 56. Spain Ethylene Acrylic Acid Eaa
    348. Copolymers Market SIZE ESTIMATES & FORECAST, BY GRADE, 2025 - 2034 (USD Billions) 
    349.     Table 57. Spain Ethylene Acrylic Acid Eaa Copolymers Market SIZE
    350. ESTIMATES & FORECAST, BY APPLICATION, 2025 - 2034 (USD Billions) 
    351.   Table 58. Spain Ethylene Acrylic Acid Eaa Copolymers Market SIZE ESTIMATES
    352. & FORECAST, BY END-USE INDUSTRY, 2025 - 2034 (USD Billions) 
    353.   Table 59. Spain Ethylene Acrylic Acid Eaa Copolymers Market SIZE ESTIMATES
    354. & FORECAST, BY MANUFACTURING PROCESS, 2025 - 2034 (USD Billions) 
    355.   Table 60. Spain Ethylene Acrylic Acid Eaa Copolymers Market SIZE ESTIMATES
    356. & FORECAST, BY MOLECULAR WEIGHT, 2025 - 2034 (USD Billions) 
    357.   Table 61. Spain Ethylene Acrylic Acid Eaa Copolymers Market SIZE ESTIMATES
    358. & FORECAST, BY REGIONAL, 2025 - 2034 (USD Billions) 
    359. & FORECAST, BY GRADE, 2025 - 2034 (USD Billions) 
    360.     Table
    361. Rest of Europe Ethylene Acrylic Acid Eaa Copolymers Market SIZE ESTIMATES &
    362. FORECAST, BY APPLICATION, 2025 - 2034 (USD Billions) 
    363.     Table
    364. Rest of Europe Ethylene Acrylic Acid Eaa Copolymers Market SIZE ESTIMATES &
    365. FORECAST, BY END-USE INDUSTRY, 2025 - 2034 (USD Billions) 
    366. & FORECAST, BY MANUFACTURING PROCESS, 2025 - 2034 (USD Billions) 
    367.   Table 66. Rest of Europe Ethylene Acrylic Acid Eaa Copolymers Market SIZE
    368. ESTIMATES & FORECAST, BY MOLECULAR WEIGHT, 2025 - 2034 (USD Billions) 
    369.     Table 67. Rest of Europe Ethylene Acrylic Acid Eaa Copolymers Market
    370. SIZE ESTIMATES & FORECAST, BY REGIONAL, 2025 - 2034 (USD Billions) 
    371.     Table 68. APAC Ethylene Acrylic Acid Eaa Copolymers Market SIZE
    372. ESTIMATES & FORECAST, BY GRADE, 2025 - 2034 (USD Billions) 
    373.   Table 69. APAC Ethylene Acrylic Acid Eaa Copolymers Market SIZE ESTIMATES
    374. & FORECAST, BY APPLICATION, 2025 - 2034 (USD Billions) 
    375. FORECAST, BY END-USE INDUSTRY, 2025 - 2034 (USD Billions) 
    376. FORECAST, BY MANUFACTURING PROCESS, 2025 - 2034 (USD Billions) 
    377.   Table 72. APAC Ethylene Acrylic Acid Eaa Copolymers Market SIZE ESTIMATES
    378. & FORECAST, BY MOLECULAR WEIGHT, 2025 - 2034 (USD Billions) 
    379.   Table 73. APAC Ethylene Acrylic Acid Eaa Copolymers Market SIZE ESTIMATES
    380. & FORECAST, BY REGIONAL, 2025 - 2034 (USD Billions) 
    381. FORECAST, BY GRADE, 2025 - 2034 (USD Billions) 
    382.     Table 75.
    383. China Ethylene Acrylic Acid Eaa Copolymers Market SIZE ESTIMATES & FORECAST,
    384. BY APPLICATION, 2025 - 2034 (USD Billions) 
    385.     Table 76. China
    386. Ethylene Acrylic Acid Eaa Copolymers Market SIZE ESTIMATES & FORECAST, BY END-USE
    387. INDUSTRY, 2025 - 2034 (USD Billions) 
    388.     Table 77. China Ethylene
    389. Acrylic Acid Eaa Copolymers Market SIZE ESTIMATES & FORECAST, BY MANUFACTURING
    390. PROCESS, 2025 - 2034 (USD Billions) 
    391.     Table 78. China Ethylene
    392. Acrylic Acid Eaa Copolymers Market SIZE ESTIMATES & FORECAST, BY MOLECULAR WEIGHT,
    393. 2034 (USD Billions) 
    394.     Table 79. China Ethylene Acrylic
    395. Acid Eaa Copolymers Market SIZE ESTIMATES & FORECAST, BY REGIONAL, 2025 - 2034
    396. (USD Billions) 
    397.     Table 80. India Ethylene Acrylic Acid Eaa
    398. Copolymers Market SIZE ESTIMATES & FORECAST, BY GRADE, 2025 - 2034 (USD Billions) 
    399.     Table 81. India Ethylene Acrylic Acid Eaa Copolymers Market SIZE
    400. ESTIMATES & FORECAST, BY APPLICATION, 2025 - 2034 (USD Billions) 
    401.   Table 82. India Ethylene Acrylic Acid Eaa Copolymers Market SIZE ESTIMATES
    402. & FORECAST, BY END-USE INDUSTRY, 2025 - 2034 (USD Billions) 
    403.   Table 83. India Ethylene Acrylic Acid Eaa Copolymers Market SIZE ESTIMATES
    404. & FORECAST, BY MANUFACTURING PROCESS, 2025 - 2034 (USD Billions) 
    405.   Table 84. India Ethylene Acrylic Acid Eaa Copolymers Market SIZE ESTIMATES
    406. & FORECAST, BY MOLECULAR WEIGHT, 2025 - 2034 (USD Billions) 
    407.   Table 85. India Ethylene Acrylic Acid Eaa Copolymers Market SIZE ESTIMATES
    408. & FORECAST, BY REGIONAL, 2025 - 2034 (USD Billions) 
    409. FORECAST, BY GRADE, 2025 - 2034 (USD Billions) 
    410.     Table 87.
    411. Japan Ethylene Acrylic Acid Eaa Copolymers Market SIZE ESTIMATES & FORECAST,
    412. BY APPLICATION, 2025 - 2034 (USD Billions) 
    413.     Table 88. Japan
    414. Ethylene Acrylic Acid Eaa Copolymers Market SIZE ESTIMATES & FORECAST, BY END-USE
    415. INDUSTRY, 2025 - 2034 (USD Billions) 
    416.     Table 89. Japan Ethylene
    417. Acrylic Acid Eaa Copolymers Market SIZE ESTIMATES & FORECAST, BY MANUFACTURING
    418. PROCESS, 2025 - 2034 (USD Billions) 
    419.     Table 90. Japan Ethylene
    420. Acrylic Acid Eaa Copolymers Market SIZE ESTIMATES & FORECAST, BY MOLECULAR WEIGHT,
    421. 2034 (USD Billions) 
    422.     Table 91. Japan Ethylene Acrylic
    423. Acid Eaa Copolymers Market SIZE ESTIMATES & FORECAST, BY REGIONAL, 2025 - 2034
    424. (USD Billions) 
    425.     Table 92. South Korea Ethylene Acrylic Acid
    426. Eaa Copolymers Market SIZE ESTIMATES & FORECAST, BY GRADE, 2025 - 2034 (USD
    427. Billions) 
    428.     Table 93. South Korea Ethylene Acrylic Acid Eaa
    429. Copolymers Market SIZE ESTIMATES & FORECAST, BY APPLICATION, 2025 - 2034 (USD
    430. Billions) 
    431.     Table 94. South Korea Ethylene Acrylic Acid Eaa
    432. Copolymers Market SIZE ESTIMATES & FORECAST, BY END-USE INDUSTRY, 2025 - 2034
    433. (USD Billions) 
    434.     Table 95. South Korea Ethylene Acrylic Acid
    435. Eaa Copolymers Market SIZE ESTIMATES & FORECAST, BY MANUFACTURING PROCESS, 2025
    436. - 2034 (USD Billions) 
    437.     Table 96. South Korea Ethylene Acrylic
    438. Acid Eaa Copolymers Market SIZE ESTIMATES & FORECAST, BY MOLECULAR WEIGHT, 2025
    439. - 2034 (USD Billions) 
    440.     Table 97. South Korea Ethylene Acrylic
    441. Acid Eaa Copolymers Market SIZE ESTIMATES & FORECAST, BY REGIONAL, 2025 - 2034
    442. (USD Billions) 
    443.     Table 98. Malaysia Ethylene Acrylic Acid
    444. Eaa Copolymers Market SIZE ESTIMATES & FORECAST, BY GRADE, 2025 - 2034 (USD
    445. Billions) 
    446.     Table 99. Malaysia Ethylene Acrylic Acid Eaa
    447. Copolymers Market SIZE ESTIMATES & FORECAST, BY APPLICATION, 2025 - 2034 (USD
    448. Billions) 
    449.     Table 100. Malaysia Ethylene Acrylic Acid Eaa
    450. Copolymers Market SIZE ESTIMATES & FORECAST, BY END-USE INDUSTRY, 2025 - 2034
    451. (USD Billions) 
    452.     Table 101. Malaysia Ethylene Acrylic Acid
    453. Eaa Copolymers Market SIZE ESTIMATES & FORECAST, BY MANUFACTURING PROCESS, 2025
    454. - 2034 (USD Billions) 
    455.     Table 102. Malaysia Ethylene Acrylic
    456. Acid Eaa Copolymers Market SIZE ESTIMATES & FORECAST, BY MOLECULAR WEIGHT, 2025
    457. - 2034 (USD Billions) 
    458.     Table 103. Malaysia Ethylene Acrylic
    459. Acid Eaa Copolymers Market SIZE ESTIMATES & FORECAST, BY REGIONAL, 2025 - 2034
    460. (USD Billions) 
    461.     Table 104. Thailand Ethylene Acrylic Acid
    462. Eaa Copolymers Market SIZE ESTIMATES & FORECAST, BY GRADE, 2025 - 2034 (USD
    463. Billions) 
    464.     Table 105. Thailand Ethylene Acrylic Acid Eaa
    465. Copolymers Market SIZE ESTIMATES & FORECAST, BY APPLICATION, 2025 - 2034 (USD
    466. Billions) 
    467.     Table 106. Thailand Ethylene Acrylic Acid Eaa
    468. Copolymers Market SIZE ESTIMATES & FORECAST, BY END-USE INDUSTRY, 2025 - 2034
    469. (USD Billions) 
    470.     Table 107. Thailand Ethylene Acrylic Acid
    471. Eaa Copolymers Market SIZE ESTIMATES & FORECAST, BY MANUFACTURING PROCESS, 2025
    472. - 2034 (USD Billions) 
    473.     Table 108. Thailand Ethylene Acrylic
    474. Acid Eaa Copolymers Market SIZE ESTIMATES & FORECAST, BY MOLECULAR WEIGHT, 2025
    475. - 2034 (USD Billions) 
    476.     Table 109. Thailand Ethylene Acrylic
    477. Acid Eaa Copolymers Market SIZE ESTIMATES & FORECAST, BY REGIONAL, 2025 - 2034
    478. (USD Billions) 
    479.     Table 110. Indonesia Ethylene Acrylic Acid
    480. Eaa Copolymers Market SIZE ESTIMATES & FORECAST, BY GRADE, 2025 - 2034 (USD
    481. Billions) 
    482.     Table 111. Indonesia Ethylene Acrylic Acid Eaa
    483. Copolymers Market SIZE ESTIMATES & FORECAST, BY APPLICATION, 2025 - 2034 (USD
    484. Billions) 
    485.     Table 112. Indonesia Ethylene Acrylic Acid Eaa
    486. Copolymers Market SIZE ESTIMATES & FORECAST, BY END-USE INDUSTRY, 2025 - 2034
    487. (USD Billions) 
    488.     Table 113. Indonesia Ethylene Acrylic Acid
    489. Eaa Copolymers Market SIZE ESTIMATES & FORECAST, BY MANUFACTURING PROCESS, 2025
    490. - 2034 (USD Billions) 
    491.     Table 114. Indonesia Ethylene Acrylic
    492. Acid Eaa Copolymers Market SIZE ESTIMATES & FORECAST, BY MOLECULAR WEIGHT, 2025
    493. - 2034 (USD Billions) 
    494.     Table 115. Indonesia Ethylene Acrylic
    495. Acid Eaa Copolymers Market SIZE ESTIMATES & FORECAST, BY REGIONAL, 2025 - 2034
    496. (USD Billions) 
    497.     Table 116. Rest of APAC Ethylene Acrylic
    498. Acid Eaa Copolymers Market SIZE ESTIMATES & FORECAST, BY GRADE, 2025 - 2034
    499. (USD Billions) 
    500.     Table 117. Rest of APAC Ethylene Acrylic
    501. Acid Eaa Copolymers Market SIZE ESTIMATES & FORECAST, BY APPLICATION, 2025 -
    502. (USD Billions) 
    503.     Table 118. Rest of APAC Ethylene Acrylic
    504. Acid Eaa Copolymers Market SIZE ESTIMATES & FORECAST, BY END-USE INDUSTRY, 2025
    505. - 2034 (USD Billions) 
    506.     Table 119. Rest of APAC Ethylene
    507. Acrylic Acid Eaa Copolymers Market SIZE ESTIMATES & FORECAST, BY MANUFACTURING
    508. PROCESS, 2025 - 2034 (USD Billions) 
    509.     Table 120. Rest of
    510. APAC Ethylene Acrylic Acid Eaa Copolymers Market SIZE ESTIMATES & FORECAST,
    511. BY MOLECULAR WEIGHT, 2025 - 2034 (USD Billions) 
    512.     Table 121.
    513. Rest of APAC Ethylene Acrylic Acid Eaa Copolymers Market SIZE ESTIMATES & FORECAST,
    514. BY REGIONAL, 2025 - 2034 (USD Billions) 
    515.     Table 122. South
    516. America Ethylene Acrylic Acid Eaa Copolymers Market SIZE ESTIMATES & FORECAST,
    517. BY GRADE, 2025 - 2034 (USD Billions) 
    518.     Table 123. South America
    519. Ethylene Acrylic Acid Eaa Copolymers Market SIZE ESTIMATES & FORECAST, BY APPLICATION,
    520. 2034 (USD Billions) 
    521.     Table 124. South America Ethylene
    522. Acrylic Acid Eaa Copolymers Market SIZE ESTIMATES & FORECAST, BY END-USE INDUSTRY,
    523. 2034 (USD Billions) 
    524.     Table 125. South America Ethylene
    525. Acrylic Acid Eaa Copolymers Market SIZE ESTIMATES & FORECAST, BY MANUFACTURING
    526. PROCESS, 2025 - 2034 (USD Billions) 
    527.     Table 126. South America
    528. Ethylene Acrylic Acid Eaa Copolymers Market SIZE ESTIMATES & FORECAST, BY MOLECULAR
    529. WEIGHT, 2025 - 2034 (USD Billions) 
    530.     Table 127. South America
    531. Ethylene Acrylic Acid Eaa Copolymers Market SIZE ESTIMATES & FORECAST, BY REGIONAL,
    532. 2034 (USD Billions) 
    533.     Table 128. Brazil Ethylene Acrylic
    534. Acid Eaa Copolymers Market SIZE ESTIMATES & FORECAST, BY GRADE, 2025 - 2034
    535. (USD Billions) 
    536.     Table 129. Brazil Ethylene Acrylic Acid
    537. Eaa Copolymers Market SIZE ESTIMATES & FORECAST, BY APPLICATION, 2025 - 2034
    538. (USD Billions) 
    539.     Table 130. Brazil Ethylene Acrylic Acid
    540. Eaa Copolymers Market SIZE ESTIMATES & FORECAST, BY END-USE INDUSTRY, 2025 -
    541. (USD Billions) 
    542.     Table 131. Brazil Ethylene Acrylic
    543. Acid Eaa Copolymers Market SIZE ESTIMATES & FORECAST, BY MANUFACTURING PROCESS,
    544. 2034 (USD Billions) 
    545.     Table 132. Brazil Ethylene Acrylic
    546. Acid Eaa Copolymers Market SIZE ESTIMATES & FORECAST, BY MOLECULAR WEIGHT, 2025
    547. - 2034 (USD Billions) 
    548.     Table 133. Brazil Ethylene Acrylic
    549. Acid Eaa Copolymers Market SIZE ESTIMATES & FORECAST, BY REGIONAL, 2025 - 2034
    550. (USD Billions) 
    551.     Table 134. Mexico Ethylene Acrylic Acid
    552. Eaa Copolymers Market SIZE ESTIMATES & FORECAST, BY GRADE, 2025 - 2034 (USD
    553. Billions) 
    554.     Table 135. Mexico Ethylene Acrylic Acid Eaa Copolymers
    555. Market SIZE ESTIMATES & FORECAST, BY APPLICATION, 2025 - 2034 (USD Billions) 
    556.     Table 136. Mexico Ethylene Acrylic Acid Eaa Copolymers Market SIZE
    557. ESTIMATES & FORECAST, BY END-USE INDUSTRY, 2025 - 2034 (USD Billions) 
    558.     Table 137. Mexico Ethylene Acrylic Acid Eaa Copolymers Market SIZE
    559. ESTIMATES & FORECAST, BY MANUFACTURING PROCESS, 2025 - 2034 (USD Billions) 
    560.     Table 138. Mexico Ethylene Acrylic Acid Eaa Copolymers Market SIZE
    561. ESTIMATES & FORECAST, BY MOLECULAR WEIGHT, 2025 - 2034 (USD Billions) 
    562.     Table 139. Mexico Ethylene Acrylic Acid Eaa Copolymers Market SIZE
    563. ESTIMATES & FORECAST, BY REGIONAL, 2025 - 2034 (USD Billions) 
    564.   Table 140. Argentina Ethylene Acrylic Acid Eaa Copolymers Market SIZE ESTIMATES
    565. & FORECAST, BY GRADE, 2025 - 2034 (USD Billions) 
    566.     Table
    567. Argentina Ethylene Acrylic Acid Eaa Copolymers Market SIZE ESTIMATES &
    568. FORECAST, BY APPLICATION, 2025 - 2034 (USD Billions) 
    569.     Table
    570. Argentina Ethylene Acrylic Acid Eaa Copolymers Market SIZE ESTIMATES &
    571. FORECAST, BY END-USE INDUSTRY, 2025 - 2034 (USD Billions) 
    572. & FORECAST, BY MANUFACTURING PROCESS, 2025 - 2034 (USD Billions) 
    573.   Table 144. Argentina Ethylene Acrylic Acid Eaa Copolymers Market SIZE ESTIMATES
    574. & FORECAST, BY MOLECULAR WEIGHT, 2025 - 2034 (USD Billions) 
    575.   Table 145. Argentina Ethylene Acrylic Acid Eaa Copolymers Market SIZE ESTIMATES
    576. & FORECAST, BY REGIONAL, 2025 - 2034 (USD Billions) 
    577. ESTIMATES & FORECAST, BY GRADE, 2025 - 2034 (USD Billions) 
    578.   Table 147. Rest of South America Ethylene Acrylic Acid Eaa Copolymers Market
    579. SIZE ESTIMATES & FORECAST, BY APPLICATION, 2025 - 2034 (USD Billions) 
    580.     Table 148. Rest of South America Ethylene Acrylic Acid Eaa Copolymers
    581. Market SIZE ESTIMATES & FORECAST, BY END-USE INDUSTRY, 2025 - 2034 (USD Billions) 
    582.     Table 149. Rest of South America Ethylene Acrylic Acid Eaa Copolymers
    583. Market SIZE ESTIMATES & FORECAST, BY MANUFACTURING PROCESS, 2025 - 2034 (USD
    584. Billions) 
    585.     Table 150. Rest of South America Ethylene Acrylic
    586. Acid Eaa Copolymers Market SIZE ESTIMATES & FORECAST, BY MOLECULAR WEIGHT, 2025
    587. - 2034 (USD Billions) 
    588.     Table 151. Rest of South America
    589. Ethylene Acrylic Acid Eaa Copolymers Market SIZE ESTIMATES & FORECAST, BY REGIONAL,
    590. 2034 (USD Billions) 
    591.     Table 152. MEA Ethylene Acrylic
    592. Acid Eaa Copolymers Market SIZE ESTIMATES & FORECAST, BY GRADE, 2025 - 2034
    593. (USD Billions) 
    594.     Table 153. MEA Ethylene Acrylic Acid Eaa
    595. Copolymers Market SIZE ESTIMATES & FORECAST, BY APPLICATION, 2025 - 2034 (USD
    596. Billions) 
    597.     Table 154. MEA Ethylene Acrylic Acid Eaa Copolymers
    598. Market SIZE ESTIMATES & FORECAST, BY END-USE INDUSTRY, 2025 - 2034 (USD Billions) 
    599.     Table 155. MEA Ethylene Acrylic Acid Eaa Copolymers Market SIZE
    600. ESTIMATES & FORECAST, BY MANUFACTURING PROCESS, 2025 - 2034 (USD Billions) 
    601.     Table 156. MEA Ethylene Acrylic Acid Eaa Copolymers Market SIZE
    602. ESTIMATES & FORECAST, BY MOLECULAR WEIGHT, 2025 - 2034 (USD Billions) 
    603.     Table 157. MEA Ethylene Acrylic Acid Eaa Copolymers Market SIZE
    604. ESTIMATES & FORECAST, BY REGIONAL, 2025 - 2034 (USD Billions) 
    605.   Table 158. GCC Countries Ethylene Acrylic Acid Eaa Copolymers Market SIZE
    606. ESTIMATES & FORECAST, BY GRADE, 2025 - 2034 (USD Billions) 
    607.   Table 159. GCC Countries Ethylene Acrylic Acid Eaa Copolymers Market SIZE
    608. ESTIMATES & FORECAST, BY APPLICATION, 2025 - 2034 (USD Billions) 
    609.   Table 160. GCC Countries Ethylene Acrylic Acid Eaa Copolymers Market SIZE
    610. ESTIMATES & FORECAST, BY END-USE INDUSTRY, 2025 - 2034 (USD Billions) 
    611.     Table 161. GCC Countries Ethylene Acrylic Acid Eaa Copolymers Market
    612. SIZE ESTIMATES & FORECAST, BY MANUFACTURING PROCESS, 2025 - 2034 (USD Billions) 
    613.     Table 162. GCC Countries Ethylene Acrylic Acid Eaa Copolymers Market
    614. SIZE ESTIMATES & FORECAST, BY MOLECULAR WEIGHT, 2025 - 2034 (USD Billions) 
    615.     Table 163. GCC Countries Ethylene Acrylic Acid Eaa Copolymers Market
    616. SIZE ESTIMATES & FORECAST, BY REGIONAL, 2025 - 2034 (USD Billions) 
    617.     Table 164. South Africa Ethylene Acrylic Acid Eaa Copolymers Market
    618. SIZE ESTIMATES & FORECAST, BY GRADE, 2025 - 2034 (USD Billions) 
    619.   Table 165. South Africa Ethylene Acrylic Acid Eaa Copolymers Market SIZE
    620. ESTIMATES & FORECAST, BY APPLICATION, 2025 - 2034 (USD Billions) 
    621.   Table 166. South Africa Ethylene Acrylic Acid Eaa Copolymers Market SIZE
    622. ESTIMATES & FORECAST, BY END-USE INDUSTRY, 2025 - 2034 (USD Billions) 
    623.     Table 167. South Africa Ethylene Acrylic Acid Eaa Copolymers Market
    624. SIZE ESTIMATES & FORECAST, BY MANUFACTURING PROCESS, 2025 - 2034 (USD Billions) 
    625.     Table 168. South Africa Ethylene Acrylic Acid Eaa Copolymers Market
    626. SIZE ESTIMATES & FORECAST, BY MOLECULAR WEIGHT, 2025 - 2034 (USD Billions) 
    627.     Table 169. South Africa Ethylene Acrylic Acid Eaa Copolymers Market
    628. SIZE ESTIMATES & FORECAST, BY REGIONAL, 2025 - 2034 (USD Billions) 
    629.     Table 170. Rest of MEA Ethylene Acrylic Acid Eaa Copolymers Market
    630. SIZE ESTIMATES & FORECAST, BY GRADE, 2025 - 2034 (USD Billions) 
    631.   Table 171. Rest of MEA Ethylene Acrylic Acid Eaa Copolymers Market SIZE ESTIMATES
    632. & FORECAST, BY APPLICATION, 2025 - 2034 (USD Billions) 
    633. & FORECAST, BY END-USE INDUSTRY, 2025 - 2034 (USD Billions) 
    634.   Table 173. Rest of MEA Ethylene Acrylic Acid Eaa Copolymers Market SIZE ESTIMATES
    635. & FORECAST, BY MANUFACTURING PROCESS, 2025 - 2034 (USD Billions) 
    636.   Table 174. Rest of MEA Ethylene Acrylic Acid Eaa Copolymers Market SIZE ESTIMATES
    637. & FORECAST, BY MOLECULAR WEIGHT, 2025 - 2034 (USD Billions) 
    638.   Table 175. Rest of MEA Ethylene Acrylic Acid Eaa Copolymers Market SIZE ESTIMATES
    639. & FORECAST, BY REGIONAL, 2025 - 2034 (USD Billions) 
    640.     Figure 1. MARKET SYNOPSIS 
    641.     Figure
    642. NORTH AMERICA ETHYLENE ACRYLIC ACID EAA COPOLYMERS MARKET ANALYSIS 
    643.   Figure 3. US ETHYLENE ACRYLIC ACID EAA COPOLYMERS MARKET ANALYSIS BY GRADE 
    644.     Figure 4. US ETHYLENE ACRYLIC ACID EAA COPOLYMERS MARKET ANALYSIS
    645. BY APPLICATION 
    646.     Figure 5. US ETHYLENE ACRYLIC ACID EAA COPOLYMERS
    647. MARKET ANALYSIS BY END-USE INDUSTRY 
    648.     Figure 6. US ETHYLENE
    649. ACRYLIC ACID EAA COPOLYMERS MARKET ANALYSIS BY MANUFACTURING PROCESS 
    650.   Figure 7. US ETHYLENE ACRYLIC ACID EAA COPOLYMERS MARKET ANALYSIS BY MOLECULAR
    651. WEIGHT 
    652.     Figure 8. US ETHYLENE ACRYLIC ACID EAA COPOLYMERS
    653. MARKET ANALYSIS BY REGIONAL 
    654.     Figure 9. CANADA ETHYLENE ACRYLIC
    655. ACID EAA COPOLYMERS MARKET ANALYSIS BY GRADE 
    656.     Figure 10.
    657. CANADA ETHYLENE ACRYLIC ACID EAA COPOLYMERS MARKET ANALYSIS BY APPLICATION 
    658.     Figure 11. CANADA ETHYLENE ACRYLIC ACID EAA COPOLYMERS MARKET ANALYSIS
    659. BY END-USE INDUSTRY 
    660.     Figure 12. CANADA ETHYLENE ACRYLIC
    661. ACID EAA COPOLYMERS MARKET ANALYSIS BY MANUFACTURING PROCESS 
    662. WEIGHT 
    663.     Figure 14. CANADA ETHYLENE ACRYLIC ACID EAA COPOLYMERS
    664. MARKET ANALYSIS BY REGIONAL 
    665.     Figure 15. EUROPE ETHYLENE
    666. ACRYLIC ACID EAA COPOLYMERS MARKET ANALYSIS 
    667.     Figure 16.
    668. GERMANY ETHYLENE ACRYLIC ACID EAA COPOLYMERS MARKET ANALYSIS BY GRADE 
    669.   Figure 17. GERMANY ETHYLENE ACRYLIC ACID EAA COPOLYMERS MARKET ANALYSIS BY
    670. APPLICATION 
    671.     Figure 18. GERMANY ETHYLENE ACRYLIC ACID EAA
    672. COPOLYMERS MARKET ANALYSIS BY END-USE INDUSTRY 
    673.     Figure 19.
    674. GERMANY ETHYLENE ACRYLIC ACID EAA COPOLYMERS MARKET ANALYSIS BY MANUFACTURING PROCESS 
    675.     Figure 20. GERMANY ETHYLENE ACRYLIC ACID EAA COPOLYMERS MARKET ANALYSIS
    676. BY MOLECULAR WEIGHT 
    677.     Figure 21. GERMANY ETHYLENE ACRYLIC
    678. ACID EAA COPOLYMERS MARKET ANALYSIS BY REGIONAL 
    679.     Figure
    680. UK ETHYLENE ACRYLIC ACID EAA COPOLYMERS MARKET ANALYSIS BY GRADE 
    681.   Figure 23. UK ETHYLENE ACRYLIC ACID EAA COPOLYMERS MARKET ANALYSIS BY APPLICATION 
    682.     Figure 24. UK ETHYLENE ACRYLIC ACID EAA COPOLYMERS MARKET ANALYSIS
    683. BY END-USE INDUSTRY 
    684.     Figure 25. UK ETHYLENE ACRYLIC ACID
    685. EAA COPOLYMERS MARKET ANALYSIS BY MANUFACTURING PROCESS 
    686. WEIGHT 
    687.     Figure 27. UK ETHYLENE ACRYLIC ACID EAA COPOLYMERS
    688. MARKET ANALYSIS BY REGIONAL 
    689.     Figure 28. FRANCE ETHYLENE
    690. ACRYLIC ACID EAA COPOLYMERS MARKET ANALYSIS BY GRADE 
    691.     Figure
    692. FRANCE ETHYLENE ACRYLIC ACID EAA COPOLYMERS MARKET ANALYSIS BY APPLICATION 
    693.     Figure 30. FRANCE ETHYLENE ACRYLIC ACID EAA COPOLYMERS MARKET ANALYSIS
    694. BY END-USE INDUSTRY 
    695.     Figure 31. FRANCE ETHYLENE ACRYLIC
    696. ACID EAA COPOLYMERS MARKET ANALYSIS BY MANUFACTURING PROCESS 
    697. WEIGHT 
    698.     Figure 33. FRANCE ETHYLENE ACRYLIC ACID EAA COPOLYMERS
    699. MARKET ANALYSIS BY REGIONAL 
    700.     Figure 34. RUSSIA ETHYLENE
    701. ACRYLIC ACID EAA COPOLYMERS MARKET ANALYSIS BY GRADE 
    702.     Figure
    703. RUSSIA ETHYLENE ACRYLIC ACID EAA COPOLYMERS MARKET ANALYSIS BY APPLICATION 
    704.     Figure 36. RUSSIA ETHYLENE ACRYLIC ACID EAA COPOLYMERS MARKET ANALYSIS
    705. BY END-USE INDUSTRY 
    706.     Figure 37. RUSSIA ETHYLENE ACRYLIC
    707. ACID EAA COPOLYMERS MARKET ANALYSIS BY MANUFACTURING PROCESS 
    708. WEIGHT 
    709.     Figure 39. RUSSIA ETHYLENE ACRYLIC ACID EAA COPOLYMERS
    710. MARKET ANALYSIS BY REGIONAL 
    711.     Figure 40. ITALY ETHYLENE ACRYLIC
    712. ACID EAA COPOLYMERS MARKET ANALYSIS BY GRADE 
    713.     Figure 41.
    714. ITALY ETHYLENE ACRYLIC ACID EAA COPOLYMERS MARKET ANALYSIS BY APPLICATION 
    715.     Figure 42. ITALY ETHYLENE ACRYLIC ACID EAA COPOLYMERS MARKET ANALYSIS
    716. BY END-USE INDUSTRY 
    717.     Figure 43. ITALY ETHYLENE ACRYLIC ACID
    718. EAA COPOLYMERS MARKET ANALYSIS BY MANUFACTURING PROCESS 
    719. WEIGHT 
    720.     Figure 45. ITALY ETHYLENE ACRYLIC ACID EAA COPOLYMERS
    721. MARKET ANALYSIS BY REGIONAL 
    722.     Figure 46. SPAIN ETHYLENE ACRYLIC
    723. ACID EAA COPOLYMERS MARKET ANALYSIS BY GRADE 
    724.     Figure 47.
    725. SPAIN ETHYLENE ACRYLIC ACID EAA COPOLYMERS MARKET ANALYSIS BY APPLICATION 
    726.     Figure 48. SPAIN ETHYLENE ACRYLIC ACID EAA COPOLYMERS MARKET ANALYSIS
    727. BY END-USE INDUSTRY 
    728.     Figure 49. SPAIN ETHYLENE ACRYLIC ACID
    729. EAA COPOLYMERS MARKET ANALYSIS BY MANUFACTURING PROCESS 
    730. WEIGHT 
    731.     Figure 51. SPAIN ETHYLENE ACRYLIC ACID EAA COPOLYMERS
    732. MARKET ANALYSIS BY REGIONAL 
    733.     Figure 52. REST OF EUROPE ETHYLENE
    734. ACRYLIC ACID EAA COPOLYMERS MARKET ANALYSIS BY GRADE 
    735.     Figure
    736. REST OF EUROPE ETHYLENE ACRYLIC ACID EAA COPOLYMERS MARKET ANALYSIS BY APPLICATION 
    737.     Figure 54. REST OF EUROPE ETHYLENE ACRYLIC ACID EAA COPOLYMERS MARKET
    738. ANALYSIS BY END-USE INDUSTRY 
    739.     Figure 55. REST OF EUROPE
    740. ETHYLENE ACRYLIC ACID EAA COPOLYMERS MARKET ANALYSIS BY MANUFACTURING PROCESS 
    741.     Figure 56. REST OF EUROPE ETHYLENE ACRYLIC ACID EAA COPOLYMERS MARKET
    742. ANALYSIS BY MOLECULAR WEIGHT 
    743.     Figure 57. REST OF EUROPE
    744. ETHYLENE ACRYLIC ACID EAA COPOLYMERS MARKET ANALYSIS BY REGIONAL 
    745.   Figure 58. APAC ETHYLENE ACRYLIC ACID EAA COPOLYMERS MARKET ANALYSIS 
    746.     Figure 59. CHINA ETHYLENE ACRYLIC ACID EAA COPOLYMERS MARKET ANALYSIS
    747. BY GRADE 
    748.     Figure 60. CHINA ETHYLENE ACRYLIC ACID EAA COPOLYMERS
    749. MARKET ANALYSIS BY APPLICATION 
    750.     Figure 61. CHINA ETHYLENE
    751. ACRYLIC ACID EAA COPOLYMERS MARKET ANALYSIS BY END-USE INDUSTRY 
    752.   Figure 62. CHINA ETHYLENE ACRYLIC ACID EAA COPOLYMERS MARKET ANALYSIS BY
    753. MANUFACTURING PROCESS 
    754.     Figure 63. CHINA ETHYLENE ACRYLIC
    755. ACID EAA COPOLYMERS MARKET ANALYSIS BY MOLECULAR WEIGHT 
    756.     Figure 65. INDIA ETHYLENE ACRYLIC ACID EAA COPOLYMERS MARKET ANALYSIS
    757. BY GRADE 
    758.     Figure 66. INDIA ETHYLENE ACRYLIC ACID EAA COPOLYMERS
    759. MARKET ANALYSIS BY APPLICATION 
    760.     Figure 67. INDIA ETHYLENE
    761. ACRYLIC ACID EAA COPOLYMERS MARKET ANALYSIS BY END-USE INDUSTRY 
    762.   Figure 68. INDIA ETHYLENE ACRYLIC ACID EAA COPOLYMERS MARKET ANALYSIS BY
    763. MANUFACTURING PROCESS 
    764.     Figure 69. INDIA ETHYLENE ACRYLIC
    765. ACID EAA COPOLYMERS MARKET ANALYSIS BY MOLECULAR WEIGHT 
    766.     Figure 71. JAPAN ETHYLENE ACRYLIC ACID EAA COPOLYMERS MARKET ANALYSIS
    767. BY GRADE 
    768.     Figure 72. JAPAN ETHYLENE ACRYLIC ACID EAA COPOLYMERS
    769. MARKET ANALYSIS BY APPLICATION 
    770.     Figure 73. JAPAN ETHYLENE
    771. ACRYLIC ACID EAA COPOLYMERS MARKET ANALYSIS BY END-USE INDUSTRY 
    772.   Figure 74. JAPAN ETHYLENE ACRYLIC ACID EAA COPOLYMERS MARKET ANALYSIS BY
    773. MANUFACTURING PROCESS 
    774.     Figure 75. JAPAN ETHYLENE ACRYLIC
    775. ACID EAA COPOLYMERS MARKET ANALYSIS BY MOLECULAR WEIGHT 
    776.     Figure 77. SOUTH KOREA ETHYLENE ACRYLIC ACID EAA COPOLYMERS MARKET
    777. ANALYSIS BY GRADE 
    778.     Figure 78. SOUTH KOREA ETHYLENE ACRYLIC
    779. ACID EAA COPOLYMERS MARKET ANALYSIS BY APPLICATION 
    780.     Figure
    781. SOUTH KOREA ETHYLENE ACRYLIC ACID EAA COPOLYMERS MARKET ANALYSIS BY END-USE
    782. INDUSTRY 
    783.     Figure 80. SOUTH KOREA ETHYLENE ACRYLIC ACID EAA
    784. COPOLYMERS MARKET ANALYSIS BY MANUFACTURING PROCESS 
    785.     Figure
    786. SOUTH KOREA ETHYLENE ACRYLIC ACID EAA COPOLYMERS MARKET ANALYSIS BY MOLECULAR
    787. WEIGHT 
    788.     Figure 82. SOUTH KOREA ETHYLENE ACRYLIC ACID EAA
    789. COPOLYMERS MARKET ANALYSIS BY REGIONAL 
    790.     Figure 83. MALAYSIA
    791. ETHYLENE ACRYLIC ACID EAA COPOLYMERS MARKET ANALYSIS BY GRADE 
    792.   Figure 84. MALAYSIA ETHYLENE ACRYLIC ACID EAA COPOLYMERS MARKET ANALYSIS
    793. BY APPLICATION 
    794.     Figure 85. MALAYSIA ETHYLENE ACRYLIC ACID
    795. EAA COPOLYMERS MARKET ANALYSIS BY END-USE INDUSTRY 
    796.     Figure
    797. MALAYSIA ETHYLENE ACRYLIC ACID EAA COPOLYMERS MARKET ANALYSIS BY MANUFACTURING
    798. PROCESS 
    799.     Figure 87. MALAYSIA ETHYLENE ACRYLIC ACID EAA COPOLYMERS
    800. MARKET ANALYSIS BY MOLECULAR WEIGHT 
    801.     Figure 88. MALAYSIA
    802. ETHYLENE ACRYLIC ACID EAA COPOLYMERS MARKET ANALYSIS BY REGIONAL 
    803.   Figure 89. THAILAND ETHYLENE ACRYLIC ACID EAA COPOLYMERS MARKET ANALYSIS
    804. BY GRADE 
    805.     Figure 90. THAILAND ETHYLENE ACRYLIC ACID EAA
    806. COPOLYMERS MARKET ANALYSIS BY APPLICATION 
    807.     Figure 91. THAILAND
    808. ETHYLENE ACRYLIC ACID EAA COPOLYMERS MARKET ANALYSIS BY END-USE INDUSTRY 
    809.     Figure 92. THAILAND ETHYLENE ACRYLIC ACID EAA COPOLYMERS MARKET
    810. ANALYSIS BY MANUFACTURING PROCESS 
    811.     Figure 93. THAILAND ETHYLENE
    812. ACRYLIC ACID EAA COPOLYMERS MARKET ANALYSIS BY MOLECULAR WEIGHT 
    813.   Figure 94. THAILAND ETHYLENE ACRYLIC ACID EAA COPOLYMERS MARKET ANALYSIS
    814. BY REGIONAL 
    815.     Figure 95. INDONESIA ETHYLENE ACRYLIC ACID
    816. EAA COPOLYMERS MARKET ANALYSIS BY GRADE 
    817.     Figure 96. INDONESIA
    818. ETHYLENE ACRYLIC ACID EAA COPOLYMERS MARKET ANALYSIS BY APPLICATION 
    819.   Figure 97. INDONESIA ETHYLENE ACRYLIC ACID EAA COPOLYMERS MARKET ANALYSIS
    820. BY END-USE INDUSTRY 
    821.     Figure 98. INDONESIA ETHYLENE ACRYLIC
    822. ACID EAA COPOLYMERS MARKET ANALYSIS BY MANUFACTURING PROCESS 
    823. WEIGHT 
    824.     Figure 100. INDONESIA ETHYLENE ACRYLIC ACID EAA
    825. COPOLYMERS MARKET ANALYSIS BY REGIONAL 
    826.     Figure 101. REST
    827. OF APAC ETHYLENE ACRYLIC ACID EAA COPOLYMERS MARKET ANALYSIS BY GRADE 
    828.   Figure 102. REST OF APAC ETHYLENE ACRYLIC ACID EAA COPOLYMERS MARKET ANALYSIS
    829. BY APPLICATION 
    830.     Figure 103. REST OF APAC ETHYLENE ACRYLIC
    831. ACID EAA COPOLYMERS MARKET ANALYSIS BY END-USE INDUSTRY 
    832. MANUFACTURING PROCESS 
    833.     Figure 105. REST OF APAC ETHYLENE
    834. ACRYLIC ACID EAA COPOLYMERS MARKET ANALYSIS BY MOLECULAR WEIGHT 
    835.   Figure 106. REST OF APAC ETHYLENE ACRYLIC ACID EAA COPOLYMERS MARKET ANALYSIS
    836. BY REGIONAL 
    837.     Figure 107. SOUTH AMERICA ETHYLENE ACRYLIC
    838. ACID EAA COPOLYMERS MARKET ANALYSIS 
    839.     Figure 108. BRAZIL
    840. ETHYLENE ACRYLIC ACID EAA COPOLYMERS MARKET ANALYSIS BY GRADE 
    841.   Figure 109. BRAZIL ETHYLENE ACRYLIC ACID EAA COPOLYMERS MARKET ANALYSIS BY
    842. APPLICATION 
    843.     Figure 110. BRAZIL ETHYLENE ACRYLIC ACID EAA
    844. COPOLYMERS MARKET ANALYSIS BY END-USE INDUSTRY 
    845.     Figure 111.
    846. BRAZIL ETHYLENE ACRYLIC ACID EAA COPOLYMERS MARKET ANALYSIS BY MANUFACTURING PROCESS 
    847.     Figure 112. BRAZIL ETHYLENE ACRYLIC ACID EAA COPOLYMERS MARKET ANALYSIS
    848. BY MOLECULAR WEIGHT 
    849.     Figure 113. BRAZIL ETHYLENE ACRYLIC
    850. ACID EAA COPOLYMERS MARKET ANALYSIS BY REGIONAL 
    851.     Figure
    852. MEXICO ETHYLENE ACRYLIC ACID EAA COPOLYMERS MARKET ANALYSIS BY GRADE 
    853.     Figure 115. MEXICO ETHYLENE ACRYLIC ACID EAA COPOLYMERS MARKET ANALYSIS
    854. BY APPLICATION 
    855.     Figure 116. MEXICO ETHYLENE ACRYLIC ACID
    856. EAA COPOLYMERS MARKET ANALYSIS BY END-USE INDUSTRY 
    857.     Figure
    858. MEXICO ETHYLENE ACRYLIC ACID EAA COPOLYMERS MARKET ANALYSIS BY MANUFACTURING
    859. PROCESS 
    860.     Figure 118. MEXICO ETHYLENE ACRYLIC ACID EAA COPOLYMERS
    861. MARKET ANALYSIS BY MOLECULAR WEIGHT 
    862.     Figure 119. MEXICO
    863. ETHYLENE ACRYLIC ACID EAA COPOLYMERS MARKET ANALYSIS BY REGIONAL 
    864.   Figure 120. ARGENTINA ETHYLENE ACRYLIC ACID EAA COPOLYMERS MARKET ANALYSIS
    865. BY GRADE 
    866.     Figure 121. ARGENTINA ETHYLENE ACRYLIC ACID EAA
    867. COPOLYMERS MARKET ANALYSIS BY APPLICATION 
    868.     Figure 122. ARGENTINA
    869. ETHYLENE ACRYLIC ACID EAA COPOLYMERS MARKET ANALYSIS BY END-USE INDUSTRY 
    870.     Figure 123. ARGENTINA ETHYLENE ACRYLIC ACID EAA COPOLYMERS MARKET
    871. ANALYSIS BY MANUFACTURING PROCESS 
    872.     Figure 124. ARGENTINA
    873. ETHYLENE ACRYLIC ACID EAA COPOLYMERS MARKET ANALYSIS BY MOLECULAR WEIGHT 
    874.     Figure 125. ARGENTINA ETHYLENE ACRYLIC ACID EAA COPOLYMERS MARKET
    875. ANALYSIS BY REGIONAL 
    876.     Figure 126. REST OF SOUTH AMERICA
    877. ETHYLENE ACRYLIC ACID EAA COPOLYMERS MARKET ANALYSIS BY GRADE 
    878.   Figure 127. REST OF SOUTH AMERICA ETHYLENE ACRYLIC ACID EAA COPOLYMERS MARKET
    879. ANALYSIS BY APPLICATION 
    880.     Figure 128. REST OF SOUTH AMERICA
    881. ETHYLENE ACRYLIC ACID EAA COPOLYMERS MARKET ANALYSIS BY END-USE INDUSTRY 
    882.     Figure 129. REST OF SOUTH AMERICA ETHYLENE ACRYLIC ACID EAA COPOLYMERS
    883. MARKET ANALYSIS BY MANUFACTURING PROCESS 
    884.     Figure 130. REST
    885. OF SOUTH AMERICA ETHYLENE ACRYLIC ACID EAA COPOLYMERS MARKET ANALYSIS BY MOLECULAR
    886. WEIGHT 
    887.     Figure 131. REST OF SOUTH AMERICA ETHYLENE ACRYLIC
    888. ACID EAA COPOLYMERS MARKET ANALYSIS BY REGIONAL 
    889.     Figure
    890. MEA ETHYLENE ACRYLIC ACID EAA COPOLYMERS MARKET ANALYSIS 
    891.   Figure 133. GCC COUNTRIES ETHYLENE ACRYLIC ACID EAA COPOLYMERS MARKET ANALYSIS
    892. BY GRADE 
    893.     Figure 134. GCC COUNTRIES ETHYLENE ACRYLIC ACID
    894. EAA COPOLYMERS MARKET ANALYSIS BY APPLICATION 
    895.     Figure 135.
    896. GCC COUNTRIES ETHYLENE ACRYLIC ACID EAA COPOLYMERS MARKET ANALYSIS BY END-USE INDUSTRY 
    897.     Figure 136. GCC COUNTRIES ETHYLENE ACRYLIC ACID EAA COPOLYMERS MARKET
    898. ANALYSIS BY MANUFACTURING PROCESS 
    899.     Figure 137. GCC COUNTRIES
    900. ETHYLENE ACRYLIC ACID EAA COPOLYMERS MARKET ANALYSIS BY MOLECULAR WEIGHT 
    901.     Figure 138. GCC COUNTRIES ETHYLENE ACRYLIC ACID EAA COPOLYMERS MARKET
    902. ANALYSIS BY REGIONAL 
    903.     Figure 139. SOUTH AFRICA ETHYLENE
    904. ACRYLIC ACID EAA COPOLYMERS MARKET ANALYSIS BY GRADE 
    905.     Figure
    906. SOUTH AFRICA ETHYLENE ACRYLIC ACID EAA COPOLYMERS MARKET ANALYSIS BY APPLICATION 
    907.     Figure 141. SOUTH AFRICA ETHYLENE ACRYLIC ACID EAA COPOLYMERS MARKET
    908. ANALYSIS BY END-USE INDUSTRY 
    909.     Figure 142. SOUTH AFRICA ETHYLENE
    910. ACRYLIC ACID EAA COPOLYMERS MARKET ANALYSIS BY MANUFACTURING PROCESS 
    911.   Figure 143. SOUTH AFRICA ETHYLENE ACRYLIC ACID EAA COPOLYMERS MARKET ANALYSIS
    912. BY MOLECULAR WEIGHT 
    913.     Figure 144. SOUTH AFRICA ETHYLENE ACRYLIC
    914. ACID EAA COPOLYMERS MARKET ANALYSIS BY REGIONAL 
    915.     Figure
    916. REST OF MEA ETHYLENE ACRYLIC ACID EAA COPOLYMERS MARKET ANALYSIS BY GRADE 
    917.     Figure 146. REST OF MEA ETHYLENE ACRYLIC ACID EAA COPOLYMERS MARKET
    918. ANALYSIS BY APPLICATION 
    919.     Figure 147. REST OF MEA ETHYLENE
    920. ACRYLIC ACID EAA COPOLYMERS MARKET ANALYSIS BY END-USE INDUSTRY 
    921.   Figure 148. REST OF MEA ETHYLENE ACRYLIC ACID EAA COPOLYMERS MARKET ANALYSIS
    922. BY MANUFACTURING PROCESS 
    923.     Figure 149. REST OF MEA ETHYLENE
    924. ACRYLIC ACID EAA COPOLYMERS MARKET ANALYSIS BY MOLECULAR WEIGHT 
    925.   Figure 150. REST OF MEA ETHYLENE ACRYLIC ACID EAA COPOLYMERS MARKET ANALYSIS
    926. BY REGIONAL 
    927.     Figure 151. KEY BUYING CRITERIA OF ETHYLENE
    928. ACRYLIC ACID EAA COPOLYMERS MARKET 
    929.     Figure 152. RESEARCH
    930. PROCESS OF MRFR 
    931.     Figure 153. DRO ANALYSIS OF ETHYLENE ACRYLIC
    932. ACID EAA COPOLYMERS MARKET 
    933.     Figure 154. DRIVERS IMPACT ANALYSIS:
    934. ETHYLENE ACRYLIC ACID EAA COPOLYMERS MARKET 
    935.     Figure 155.
    936. RESTRAINTS IMPACT ANALYSIS: ETHYLENE ACRYLIC ACID EAA COPOLYMERS MARKET 
    937.     Figure 156. SUPPLY / VALUE CHAIN: ETHYLENE ACRYLIC ACID EAA COPOLYMERS
    938. MARKET 
    939.     Figure 157. ETHYLENE ACRYLIC ACID EAA COPOLYMERS
    940. MARKET, BY GRADE, 2024 (% SHARE) 
    941.     Figure 158. ETHYLENE ACRYLIC
    942. ACID EAA COPOLYMERS MARKET, BY GRADE, 2025 - 2034 (USD Billions) 
    943.   Figure 159. ETHYLENE ACRYLIC ACID EAA COPOLYMERS MARKET, BY APPLICATION,
    944. (% SHARE) 
    945.     Figure 160. ETHYLENE ACRYLIC ACID EAA COPOLYMERS
    946. MARKET, BY APPLICATION, 2025 - 2034 (USD Billions) 
    947.     Figure
    948. ETHYLENE ACRYLIC ACID EAA COPOLYMERS MARKET, BY END-USE INDUSTRY, 2024 (% SHARE) 
    949.     Figure 162. ETHYLENE ACRYLIC ACID EAA COPOLYMERS MARKET, BY END-USE
    950. INDUSTRY, 2025 - 2034 (USD Billions) 
    951.     Figure 163. ETHYLENE
    952. ACRYLIC ACID EAA COPOLYMERS MARKET, BY MANUFACTURING PROCESS, 2024 (% SHARE) 
    953.     Figure 164. ETHYLENE ACRYLIC ACID EAA COPOLYMERS MARKET, BY MANUFACTURING
    954. PROCESS, 2025 - 2034 (USD Billions) 
    955.     Figure 165. ETHYLENE
    956. ACRYLIC ACID EAA COPOLYMERS MARKET, BY MOLECULAR WEIGHT, 2024 (% SHARE) 
    957.     Figure 166. ETHYLENE ACRYLIC ACID EAA COPOLYMERS MARKET, BY MOLECULAR
    958. WEIGHT, 2025 - 2034 (USD Billions) 
    959.     Figure 167. ETHYLENE
    960. ACRYLIC ACID EAA COPOLYMERS MARKET, BY REGIONAL, 2024 (% SHARE) 
    961.   Figure 168. ETHYLENE ACRYLIC ACID EAA COPOLYMERS MARKET, BY REGIONAL, 2025
    962. - 2034 (USD Billions) 
    963.     Figure 169. BENCHMARKING OF MAJOR
    964. COMPETITORS 

    Environmental Test Chamber Market Segmentation

    Environmental Test Chamber Market By Test Type (USD Billion, 2019-2032)

    • Temperature Test
    • Humidity Test
    • Altitude Test
    • Vibration Test
    • Rain Test
    • Dust Test
    • Salt Spray Test


    Environmental Test Chamber Market By Industry Application (USD Billion, 2019-2032)

    • Automotive
    • Electronics
    • Aerospace
    • Pharmaceuticals
    • Food & Beverage
    • Medical Devices


    Environmental Test Chamber Market By Capacity (USD Billion, 2019-2032)

    • Small
    • Medium
    • Large
    • Walk-in


    Environmental Test Chamber Market By Chamber Type (USD Billion, 2019-2032)

    • Benchtop
    • Floor-standing
    • Refrigerated
    • High-Temperature
    • Vacuum


    Environmental Test Chamber Market By Control System (USD Billion, 2019-2032)

    • Digital
    • Analog
    • Programmable


    Environmental Test Chamber Market By Regional (USD Billion, 2019-2032)

    • North America
    • Europe
    • South America
    • Asia Pacific
    • Middle East and Africa

    Environmental Test Chamber Market Regional Outlook (USD Billion, 2019-2032)


    • North America Outlook (USD Billion, 2019-2032)

      • North America Environmental Test Chamber Market by Test Type

        • Temperature Test
        • Humidity Test
        • Altitude Test
        • Vibration Test
        • Rain Test
        • Dust Test
        • Salt Spray Test
      • North America Environmental Test Chamber Market by Industry Application Type

        • Automotive
        • Electronics
        • Aerospace
        • Pharmaceuticals
        • Food & Beverage
        • Medical Devices
      • North America Environmental Test Chamber Market by Capacity Type

        • Small
        • Medium
        • Large
        • Walk-in
      • North America Environmental Test Chamber Market by Chamber Type

        • Benchtop
        • Floor-standing
        • Refrigerated
        • High-Temperature
        • Vacuum
      • North America Environmental Test Chamber Market by Control System Type

        • Digital
        • Analog
        • Programmable
      • North America Environmental Test Chamber Market by Regional Type

        • US
        • Canada
      • US Outlook (USD Billion, 2019-2032)
      • US Environmental Test Chamber Market by Test Type

        • Temperature Test
        • Humidity Test
        • Altitude Test
        • Vibration Test
        • Rain Test
        • Dust Test
        • Salt Spray Test
      • US Environmental Test Chamber Market by Industry Application Type

        • Automotive
        • Electronics
        • Aerospace
        • Pharmaceuticals
        • Food & Beverage
        • Medical Devices
      • US Environmental Test Chamber Market by Capacity Type

        • Small
        • Medium
        • Large
        • Walk-in
      • US Environmental Test Chamber Market by Chamber Type

        • Benchtop
        • Floor-standing
        • Refrigerated
        • High-Temperature
        • Vacuum
      • US Environmental Test Chamber Market by Control System Type

        • Digital
        • Analog
        • Programmable
      • CANADA Outlook (USD Billion, 2019-2032)
      • CANADA Environmental Test Chamber Market by Test Type

        • Temperature Test
        • Humidity Test
        • Altitude Test
        • Vibration Test
        • Rain Test
        • Dust Test
        • Salt Spray Test
      • CANADA Environmental Test Chamber Market by Industry Application Type

        • Automotive
        • Electronics
        • Aerospace
        • Pharmaceuticals
        • Food & Beverage
        • Medical Devices
      • CANADA Environmental Test Chamber Market by Capacity Type

        • Small
        • Medium
        • Large
        • Walk-in
      • CANADA Environmental Test Chamber Market by Chamber Type

        • Benchtop
        • Floor-standing
        • Refrigerated
        • High-Temperature
        • Vacuum
      • CANADA Environmental Test Chamber Market by Control System Type

        • Digital
        • Analog
        • Programmable
    • Europe Outlook (USD Billion, 2019-2032)

      • Europe Environmental Test Chamber Market by Test Type

        • Temperature Test
        • Humidity Test
        • Altitude Test
        • Vibration Test
        • Rain Test
        • Dust Test
        • Salt Spray Test
      • Europe Environmental Test Chamber Market by Industry Application Type

        • Automotive
        • Electronics
        • Aerospace
        • Pharmaceuticals
        • Food & Beverage
        • Medical Devices
      • Europe Environmental Test Chamber Market by Capacity Type

        • Small
        • Medium
        • Large
        • Walk-in
      • Europe Environmental Test Chamber Market by Chamber Type

        • Benchtop
        • Floor-standing
        • Refrigerated
        • High-Temperature
        • Vacuum
      • Europe Environmental Test Chamber Market by Control System Type

        • Digital
        • Analog
        • Programmable
      • Europe Environmental Test Chamber Market by Regional Type

        • Germany
        • UK
        • France
        • Russia
        • Italy
        • Spain
        • Rest of Europe
      • GERMANY Outlook (USD Billion, 2019-2032)
      • GERMANY Environmental Test Chamber Market by Test Type

        • Temperature Test
        • Humidity Test
        • Altitude Test
        • Vibration Test
        • Rain Test
        • Dust Test
        • Salt Spray Test
      • GERMANY Environmental Test Chamber Market by Industry Application Type

        • Automotive
        • Electronics
        • Aerospace
        • Pharmaceuticals
        • Food & Beverage
        • Medical Devices
      • GERMANY Environmental Test Chamber Market by Capacity Type

        • Small
        • Medium
        • Large
        • Walk-in
      • GERMANY Environmental Test Chamber Market by Chamber Type

        • Benchtop
        • Floor-standing
        • Refrigerated
        • High-Temperature
        • Vacuum
      • GERMANY Environmental Test Chamber Market by Control System Type

        • Digital
        • Analog
        • Programmable
      • UK Outlook (USD Billion, 2019-2032)
      • UK Environmental Test Chamber Market by Test Type

        • Temperature Test
        • Humidity Test
        • Altitude Test
        • Vibration Test
        • Rain Test
        • Dust Test
        • Salt Spray Test
      • UK Environmental Test Chamber Market by Industry Application Type

        • Automotive
        • Electronics
        • Aerospace
        • Pharmaceuticals
        • Food & Beverage
        • Medical Devices
      • UK Environmental Test Chamber Market by Capacity Type

        • Small
        • Medium
        • Large
        • Walk-in
      • UK Environmental Test Chamber Market by Chamber Type

        • Benchtop
        • Floor-standing
        • Refrigerated
        • High-Temperature
        • Vacuum
      • UK Environmental Test Chamber Market by Control System Type

        • Digital
        • Analog
        • Programmable
      • FRANCE Outlook (USD Billion, 2019-2032)
      • FRANCE Environmental Test Chamber Market by Test Type

        • Temperature Test
        • Humidity Test
        • Altitude Test
        • Vibration Test
        • Rain Test
        • Dust Test
        • Salt Spray Test
      • FRANCE Environmental Test Chamber Market by Industry Application Type

        • Automotive
        • Electronics
        • Aerospace
        • Pharmaceuticals
        • Food & Beverage
        • Medical Devices
      • FRANCE Environmental Test Chamber Market by Capacity Type

        • Small
        • Medium
        • Large
        • Walk-in
      • FRANCE Environmental Test Chamber Market by Chamber Type

        • Benchtop
        • Floor-standing
        • Refrigerated
        • High-Temperature
        • Vacuum
      • FRANCE Environmental Test Chamber Market by Control System Type

        • Digital
        • Analog
        • Programmable
      • RUSSIA Outlook (USD Billion, 2019-2032)
      • RUSSIA Environmental Test Chamber Market by Test Type

        • Temperature Test
        • Humidity Test
        • Altitude Test
        • Vibration Test
        • Rain Test
        • Dust Test
        • Salt Spray Test
      • RUSSIA Environmental Test Chamber Market by Industry Application Type

        • Automotive
        • Electronics
        • Aerospace
        • Pharmaceuticals
        • Food & Beverage
        • Medical Devices
      • RUSSIA Environmental Test Chamber Market by Capacity Type

        • Small
        • Medium
        • Large
        • Walk-in
      • RUSSIA Environmental Test Chamber Market by Chamber Type

        • Benchtop
        • Floor-standing
        • Refrigerated
        • High-Temperature
        • Vacuum
      • RUSSIA Environmental Test Chamber Market by Control System Type

        • Digital
        • Analog
        • Programmable
      • ITALY Outlook (USD Billion, 2019-2032)
      • ITALY Environmental Test Chamber Market by Test Type

        • Temperature Test
        • Humidity Test
        • Altitude Test
        • Vibration Test
        • Rain Test
        • Dust Test
        • Salt Spray Test
      • ITALY Environmental Test Chamber Market by Industry Application Type

        • Automotive
        • Electronics
        • Aerospace
        • Pharmaceuticals
        • Food & Beverage
        • Medical Devices
      • ITALY Environmental Test Chamber Market by Capacity Type

        • Small
        • Medium
        • Large
        • Walk-in
      • ITALY Environmental Test Chamber Market by Chamber Type

        • Benchtop
        • Floor-standing
        • Refrigerated
        • High-Temperature
        • Vacuum
      • ITALY Environmental Test Chamber Market by Control System Type

        • Digital
        • Analog
        • Programmable
      • SPAIN Outlook (USD Billion, 2019-2032)
      • SPAIN Environmental Test Chamber Market by Test Type

        • Temperature Test
        • Humidity Test
        • Altitude Test
        • Vibration Test
        • Rain Test
        • Dust Test
        • Salt Spray Test
      • SPAIN Environmental Test Chamber Market by Industry Application Type

        • Automotive
        • Electronics
        • Aerospace
        • Pharmaceuticals
        • Food & Beverage
        • Medical Devices
      • SPAIN Environmental Test Chamber Market by Capacity Type

        • Small
        • Medium
        • Large
        • Walk-in
      • SPAIN Environmental Test Chamber Market by Chamber Type

        • Benchtop
        • Floor-standing
        • Refrigerated
        • High-Temperature
        • Vacuum
      • SPAIN Environmental Test Chamber Market by Control System Type

        • Digital
        • Analog
        • Programmable
      • REST OF EUROPE Outlook (USD Billion, 2019-2032)
      • REST OF EUROPE Environmental Test Chamber Market by Test Type

        • Temperature Test
        • Humidity Test
        • Altitude Test
        • Vibration Test
        • Rain Test
        • Dust Test
        • Salt Spray Test
      • REST OF EUROPE Environmental Test Chamber Market by Industry Application Type

        • Automotive
        • Electronics
        • Aerospace
        • Pharmaceuticals
        • Food & Beverage
        • Medical Devices
      • REST OF EUROPE Environmental Test Chamber Market by Capacity Type

        • Small
        • Medium
        • Large
        • Walk-in
      • REST OF EUROPE Environmental Test Chamber Market by Chamber Type

        • Benchtop
        • Floor-standing
        • Refrigerated
        • High-Temperature
        • Vacuum
      • REST OF EUROPE Environmental Test Chamber Market by Control System Type

        • Digital
        • Analog
        • Programmable
    • APAC Outlook (USD Billion, 2019-2032)

      • APAC Environmental Test Chamber Market by Test Type

        • Temperature Test
        • Humidity Test
        • Altitude Test
        • Vibration Test
        • Rain Test
        • Dust Test
        • Salt Spray Test
      • APAC Environmental Test Chamber Market by Industry Application Type

        • Automotive
        • Electronics
        • Aerospace
        • Pharmaceuticals
        • Food & Beverage
        • Medical Devices
      • APAC Environmental Test Chamber Market by Capacity Type

        • Small
        • Medium
        • Large
        • Walk-in
      • APAC Environmental Test Chamber Market by Chamber Type

        • Benchtop
        • Floor-standing
        • Refrigerated
        • High-Temperature
        • Vacuum
      • APAC Environmental Test Chamber Market by Control System Type

        • Digital
        • Analog
        • Programmable
      • APAC Environmental Test Chamber Market by Regional Type

        • China
        • India
        • Japan
        • South Korea
        • Malaysia
        • Thailand
        • Indonesia
        • Rest of APAC
      • CHINA Outlook (USD Billion, 2019-2032)
      • CHINA Environmental Test Chamber Market by Test Type

        • Temperature Test
        • Humidity Test
        • Altitude Test
        • Vibration Test
        • Rain Test
        • Dust Test
        • Salt Spray Test
      • CHINA Environmental Test Chamber Market by Industry Application Type

        • Automotive
        • Electronics
        • Aerospace
        • Pharmaceuticals
        • Food & Beverage
        • Medical Devices
      • CHINA Environmental Test Chamber Market by Capacity Type

        • Small
        • Medium
        • Large
        • Walk-in
      • CHINA Environmental Test Chamber Market by Chamber Type

        • Benchtop
        • Floor-standing
        • Refrigerated
        • High-Temperature
        • Vacuum
      • CHINA Environmental Test Chamber Market by Control System Type

        • Digital
        • Analog
        • Programmable
      • INDIA Outlook (USD Billion, 2019-2032)
      • INDIA Environmental Test Chamber Market by Test Type

        • Temperature Test
        • Humidity Test
        • Altitude Test
        • Vibration Test
        • Rain Test
        • Dust Test
        • Salt Spray Test
      • INDIA Environmental Test Chamber Market by Industry Application Type

        • Automotive
        • Electronics
        • Aerospace
        • Pharmaceuticals
        • Food & Beverage
        • Medical Devices
      • INDIA Environmental Test Chamber Market by Capacity Type

        • Small
        • Medium
        • Large
        • Walk-in
      • INDIA Environmental Test Chamber Market by Chamber Type

        • Benchtop
        • Floor-standing
        • Refrigerated
        • High-Temperature
        • Vacuum
      • INDIA Environmental Test Chamber Market by Control System Type

        • Digital
        • Analog
        • Programmable
      • JAPAN Outlook (USD Billion, 2019-2032)
      • JAPAN Environmental Test Chamber Market by Test Type

        • Temperature Test
        • Humidity Test
        • Altitude Test
        • Vibration Test
        • Rain Test
        • Dust Test
        • Salt Spray Test
      • JAPAN Environmental Test Chamber Market by Industry Application Type

        • Automotive
        • Electronics
        • Aerospace
        • Pharmaceuticals
        • Food & Beverage
        • Medical Devices
      • JAPAN Environmental Test Chamber Market by Capacity Type

        • Small
        • Medium
        • Large
        • Walk-in
      • JAPAN Environmental Test Chamber Market by Chamber Type

        • Benchtop
        • Floor-standing
        • Refrigerated
        • High-Temperature
        • Vacuum
      • JAPAN Environmental Test Chamber Market by Control System Type

        • Digital
        • Analog
        • Programmable
      • SOUTH KOREA Outlook (USD Billion, 2019-2032)
      • SOUTH KOREA Environmental Test Chamber Market by Test Type

        • Temperature Test
        • Humidity Test
        • Altitude Test
        • Vibration Test
        • Rain Test
        • Dust Test
        • Salt Spray Test
      • SOUTH KOREA Environmental Test Chamber Market by Industry Application Type

        • Automotive
        • Electronics
        • Aerospace
        • Pharmaceuticals
        • Food & Beverage
        • Medical Devices
      • SOUTH KOREA Environmental Test Chamber Market by Capacity Type

        • Small
        • Medium
        • Large
        • Walk-in
      • SOUTH KOREA Environmental Test Chamber Market by Chamber Type

        • Benchtop
        • Floor-standing
        • Refrigerated
        • High-Temperature
        • Vacuum
      • SOUTH KOREA Environmental Test Chamber Market by Control System Type

        • Digital
        • Analog
        • Programmable
      • MALAYSIA Outlook (USD Billion, 2019-2032)
      • MALAYSIA Environmental Test Chamber Market by Test Type

        • Temperature Test
        • Humidity Test
        • Altitude Test
        • Vibration Test
        • Rain Test
        • Dust Test
        • Salt Spray Test
      • MALAYSIA Environmental Test Chamber Market by Industry Application Type

        • Automotive
        • Electronics
        • Aerospace
        • Pharmaceuticals
        • Food & Beverage
        • Medical Devices
      • MALAYSIA Environmental Test Chamber Market by Capacity Type

        • Small
        • Medium
        • Large
        • Walk-in
      • MALAYSIA Environmental Test Chamber Market by Chamber Type

        • Benchtop
        • Floor-standing
        • Refrigerated
        • High-Temperature
        • Vacuum
      • MALAYSIA Environmental Test Chamber Market by Control System Type

        • Digital
        • Analog
        • Programmable
      • THAILAND Outlook (USD Billion, 2019-2032)
      • THAILAND Environmental Test Chamber Market by Test Type

        • Temperature Test
        • Humidity Test
        • Altitude Test
        • Vibration Test
        • Rain Test
        • Dust Test
        • Salt Spray Test
      • THAILAND Environmental Test Chamber Market by Industry Application Type

        • Automotive
        • Electronics
        • Aerospace
        • Pharmaceuticals
        • Food & Beverage
        • Medical Devices
      • THAILAND Environmental Test Chamber Market by Capacity Type

        • Small
        • Medium
        • Large
        • Walk-in
      • THAILAND Environmental Test Chamber Market by Chamber Type

        • Benchtop
        • Floor-standing
        • Refrigerated
        • High-Temperature
        • Vacuum
      • THAILAND Environmental Test Chamber Market by Control System Type

        • Digital
        • Analog
        • Programmable
      • INDONESIA Outlook (USD Billion, 2019-2032)
      • INDONESIA Environmental Test Chamber Market by Test Type

        • Temperature Test
        • Humidity Test
        • Altitude Test
        • Vibration Test
        • Rain Test
        • Dust Test
        • Salt Spray Test
      • INDONESIA Environmental Test Chamber Market by Industry Application Type

        • Automotive
        • Electronics
        • Aerospace
        • Pharmaceuticals
        • Food & Beverage
        • Medical Devices
      • INDONESIA Environmental Test Chamber Market by Capacity Type

        • Small
        • Medium
        • Large
        • Walk-in
      • INDONESIA Environmental Test Chamber Market by Chamber Type

        • Benchtop
        • Floor-standing
        • Refrigerated
        • High-Temperature
        • Vacuum
      • INDONESIA Environmental Test Chamber Market by Control System Type

        • Digital
        • Analog
        • Programmable
      • REST OF APAC Outlook (USD Billion, 2019-2032)
      • REST OF APAC Environmental Test Chamber Market by Test Type

        • Temperature Test
        • Humidity Test
        • Altitude Test
        • Vibration Test
        • Rain Test
        • Dust Test
        • Salt Spray Test
      • REST OF APAC Environmental Test Chamber Market by Industry Application Type

        • Automotive
        • Electronics
        • Aerospace
        • Pharmaceuticals
        • Food & Beverage
        • Medical Devices
      • REST OF APAC Environmental Test Chamber Market by Capacity Type

        • Small
        • Medium
        • Large
        • Walk-in
      • REST OF APAC Environmental Test Chamber Market by Chamber Type

        • Benchtop
        • Floor-standing
        • Refrigerated
        • High-Temperature
        • Vacuum
      • REST OF APAC Environmental Test Chamber Market by Control System Type

        • Digital
        • Analog
        • Programmable
    • South America Outlook (USD Billion, 2019-2032)

      • South America Environmental Test Chamber Market by Test Type

        • Temperature Test
        • Humidity Test
        • Altitude Test
        • Vibration Test
        • Rain Test
        • Dust Test
        • Salt Spray Test
      • South America Environmental Test Chamber Market by Industry Application Type

        • Automotive
        • Electronics
        • Aerospace
        • Pharmaceuticals
        • Food & Beverage
        • Medical Devices
      • South America Environmental Test Chamber Market by Capacity Type

        • Small
        • Medium
        • Large
        • Walk-in
      • South America Environmental Test Chamber Market by Chamber Type

        • Benchtop
        • Floor-standing
        • Refrigerated
        • High-Temperature
        • Vacuum
      • South America Environmental Test Chamber Market by Control System Type

        • Digital
        • Analog
        • Programmable
      • South America Environmental Test Chamber Market by Regional Type

        • Brazil
        • Mexico
        • Argentina
        • Rest of South America
      • BRAZIL Outlook (USD Billion, 2019-2032)
      • BRAZIL Environmental Test Chamber Market by Test Type

        • Temperature Test
        • Humidity Test
        • Altitude Test
        • Vibration Test
        • Rain Test
        • Dust Test
        • Salt Spray Test
      • BRAZIL Environmental Test Chamber Market by Industry Application Type

        • Automotive
        • Electronics
        • Aerospace
        • Pharmaceuticals
        • Food & Beverage
        • Medical Devices
      • BRAZIL Environmental Test Chamber Market by Capacity Type

        • Small
        • Medium
        • Large
        • Walk-in
      • BRAZIL Environmental Test Chamber Market by Chamber Type

        • Benchtop
        • Floor-standing
        • Refrigerated
        • High-Temperature
        • Vacuum
      • BRAZIL Environmental Test Chamber Market by Control System Type

        • Digital
        • Analog
        • Programmable
      • MEXICO Outlook (USD Billion, 2019-2032)
      • MEXICO Environmental Test Chamber Market by Test Type

        • Temperature Test
        • Humidity Test
        • Altitude Test
        • Vibration Test
        • Rain Test
        • Dust Test
        • Salt Spray Test
      • MEXICO Environmental Test Chamber Market by Industry Application Type

        • Automotive
        • Electronics
        • Aerospace
        • Pharmaceuticals
        • Food & Beverage
        • Medical Devices
      • MEXICO Environmental Test Chamber Market by Capacity Type

        • Small
        • Medium
        • Large
        • Walk-in
      • MEXICO Environmental Test Chamber Market by Chamber Type

        • Benchtop
        • Floor-standing
        • Refrigerated
        • High-Temperature
        • Vacuum
      • MEXICO Environmental Test Chamber Market by Control System Type

        • Digital
        • Analog
        • Programmable
      • ARGENTINA Outlook (USD Billion, 2019-2032)
      • ARGENTINA Environmental Test Chamber Market by Test Type

        • Temperature Test
        • Humidity Test
        • Altitude Test
        • Vibration Test
        • Rain Test
        • Dust Test
        • Salt Spray Test
      • ARGENTINA Environmental Test Chamber Market by Industry Application Type

        • Automotive
        • Electronics
        • Aerospace
        • Pharmaceuticals
        • Food & Beverage
        • Medical Devices
      • ARGENTINA Environmental Test Chamber Market by Capacity Type

        • Small
        • Medium
        • Large
        • Walk-in
      • ARGENTINA Environmental Test Chamber Market by Chamber Type

        • Benchtop
        • Floor-standing
        • Refrigerated
        • High-Temperature
        • Vacuum
      • ARGENTINA Environmental Test Chamber Market by Control System Type

        • Digital
        • Analog
        • Programmable
      • REST OF SOUTH AMERICA Outlook (USD Billion, 2019-2032)
      • REST OF SOUTH AMERICA Environmental Test Chamber Market by Test Type

        • Temperature Test
        • Humidity Test
        • Altitude Test
        • Vibration Test
        • Rain Test
        • Dust Test
        • Salt Spray Test
      • REST OF SOUTH AMERICA Environmental Test Chamber Market by Industry Application Type

        • Automotive
        • Electronics
        • Aerospace
        • Pharmaceuticals
        • Food & Beverage
        • Medical Devices
      • REST OF SOUTH AMERICA Environmental Test Chamber Market by Capacity Type

        • Small
        • Medium
        • Large
        • Walk-in
      • REST OF SOUTH AMERICA Environmental Test Chamber Market by Chamber Type

        • Benchtop
        • Floor-standing
        • Refrigerated
        • High-Temperature
        • Vacuum
      • REST OF SOUTH AMERICA Environmental Test Chamber Market by Control System Type

        • Digital
        • Analog
        • Programmable
    • MEA Outlook (USD Billion, 2019-2032)

      • MEA Environmental Test Chamber Market by Test Type

        • Temperature Test
        • Humidity Test
        • Altitude Test
        • Vibration Test
        • Rain Test
        • Dust Test
        • Salt Spray Test
      • MEA Environmental Test Chamber Market by Industry Application Type

        • Automotive
        • Electronics
        • Aerospace
        • Pharmaceuticals
        • Food & Beverage
        • Medical Devices
      • MEA Environmental Test Chamber Market by Capacity Type

        • Small
        • Medium
        • Large
        • Walk-in
      • MEA Environmental Test Chamber Market by Chamber Type

        • Benchtop
        • Floor-standing
        • Refrigerated
        • High-Temperature
        • Vacuum
      • MEA Environmental Test Chamber Market by Control System Type

        • Digital
        • Analog
        • Programmable
      • MEA Environmental Test Chamber Market by Regional Type

        • GCC Countries
        • South Africa
        • Rest of MEA
      • GCC COUNTRIES Outlook (USD Billion, 2019-2032)
      • GCC COUNTRIES Environmental Test Chamber Market by Test Type

        • Temperature Test
        • Humidity Test
        • Altitude Test
        • Vibration Test
        • Rain Test
        • Dust Test
        • Salt Spray Test
      • GCC COUNTRIES Environmental Test Chamber Market by Industry Application Type

        • Automotive
        • Electronics
        • Aerospace
        • Pharmaceuticals
        • Food & Beverage
        • Medical Devices
      • GCC COUNTRIES Environmental Test Chamber Market by Capacity Type

        • Small
        • Medium
        • Large
        • Walk-in
      • GCC COUNTRIES Environmental Test Chamber Market by Chamber Type

        • Benchtop
        • Floor-standing
        • Refrigerated
        • High-Temperature
        • Vacuum
      • GCC COUNTRIES Environmental Test Chamber Market by Control System Type

        • Digital
        • Analog
        • Programmable
      • SOUTH AFRICA Outlook (USD Billion, 2019-2032)
      • SOUTH AFRICA Environmental Test Chamber Market by Test Type

        • Temperature Test
        • Humidity Test
        • Altitude Test
        • Vibration Test
        • Rain Test
        • Dust Test
        • Salt Spray Test
      • SOUTH AFRICA Environmental Test Chamber Market by Industry Application Type

        • Automotive
        • Electronics
        • Aerospace
        • Pharmaceuticals
        • Food & Beverage
        • Medical Devices
      • SOUTH AFRICA Environmental Test Chamber Market by Capacity Type

        • Small
        • Medium
        • Large
        • Walk-in
      • SOUTH AFRICA Environmental Test Chamber Market by Chamber Type

        • Benchtop
        • Floor-standing
        • Refrigerated
        • High-Temperature
        • Vacuum
      • SOUTH AFRICA Environmental Test Chamber Market by Control System Type

        • Digital
        • Analog
        • Programmable
      • REST OF MEA Outlook (USD Billion, 2019-2032)
      • REST OF MEA Environmental Test Chamber Market by Test Type

        • Temperature Test
        • Humidity Test
        • Altitude Test
        • Vibration Test
        • Rain Test
        • Dust Test
        • Salt Spray Test
      • REST OF MEA Environmental Test Chamber Market by Industry Application Type

        • Automotive
        • Electronics
        • Aerospace
        • Pharmaceuticals
        • Food & Beverage
        • Medical Devices
      • REST OF MEA Environmental Test Chamber Market by Capacity Type

        • Small
        • Medium
        • Large
        • Walk-in
      • REST OF MEA Environmental Test Chamber Market by Chamber Type

        • Benchtop
        • Floor-standing
        • Refrigerated
        • High-Temperature
        • Vacuum
      • REST OF MEA Environmental Test Chamber Market by Control System Type

        • Digital
        • Analog
        • Programmable


    Report Infographic
    Free Sample Request

    Kindly complete the form below to receive a free sample of this Report

    Customer Strories

    “I am very pleased with how market segments have been defined in a relevant way for my purposes (such as "Portable Freezers & refrigerators" and "last-mile"). In general the report is well structured. Thanks very much for your efforts.”

    Victoria Milne Founder
    Case Study

    Chemicals and Materials