• Cat-intel
  • MedIntelliX
  • Resources
  • About Us
  • Request Free Sample ×

    Kindly complete the form below to receive a free sample of this Report

    Leading companies partner with us for data-driven Insights

    clients tt-cursor

    Enterprise Mobility in Energy Sector Industry Market

    ID: MRFR/ICT/33861-HCR
    100 Pages
    Aarti Dhapte
    September 2025

    Enterprise Mobility in Energy Sector Industry Market Research Report By Application (Field Services Management, Asset Management, Workforce Management, Supply Chain Management), By Deployment Type (Cloud-Based, On-Premise), By End User (Utilities, Oil and Gas, Renewable Energy), By Device Type (Smartphones, Tablets, Laptops, Wearable Devices) and By Regional (North America, Europe, South America, Asia Pacific, Middle East and Africa) - Forecast to 2034

    Share:
    Download PDF ×

    We do not share your information with anyone. However, we may send you emails based on your report interest from time to time. You may contact us at any time to opt-out.

    Enterprise Mobility in Energy Sector Industry Market Research Report — Global Forecast till 2034 Infographic
    Purchase Options
    $ 4,950.0
    $ 5,950.0
    $ 7,250.0
    Table of Contents

    Enterprise Mobility in Energy Sector Industry Market Summary

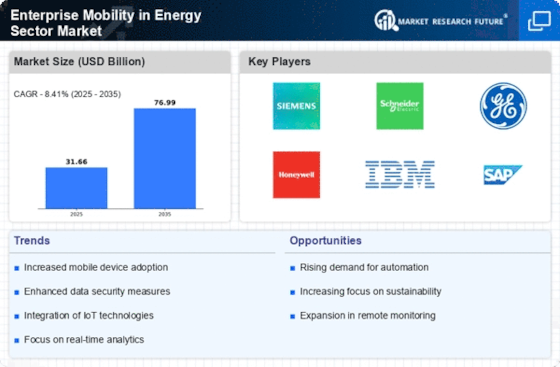
    The Global Enterprise Mobility in Energy Sector Industry is projected to grow significantly from 31.7 USD Billion in 2024 to 77.1 USD Billion by 2035.

    Key Market Trends & Highlights

    Enterprise Mobility in Energy Sector Industry Key Trends and Highlights

    • The market is expected to witness a compound annual growth rate (CAGR) of 8.43% from 2025 to 2035.
    • By 2035, the market valuation is anticipated to reach 77.1 USD Billion, indicating robust growth potential.
    • In 2024, the market is valued at 31.7 USD Billion, reflecting a strong foundation for future expansion.
    • Growing adoption of mobile technologies due to the increasing need for operational efficiency is a major market driver.

    Market Size & Forecast

    2024 Market Size 31.7 (USD Billion)
    2035 Market Size 77.1 (USD Billion)
    CAGR (2025-2035) 8.43%

    Major Players

    Oracle, Vodafone, Huawei, Accenture, SAP, Honeywell, Microsoft, AT&T, IBM, Ericsson, Capgemini, Dell Technologies, Schneider Electric, Siemens, Cisco

    Enterprise Mobility in Energy Sector Industry Market Trends

    The shift towards increased efficiency and the need for real-time data access are significant market drivers in the Global Enterprise Mobility in the energy sector. Companies are increasingly adopting mobile solutions to optimize operations, enhance workforce productivity, and improve communication across various functions. As digital transformation continues, the integration of mobile technologies is becoming crucial for companies to stay competitive, reduce downtime, and streamline processes.

    The need for secure data access and remote monitoring is pushing organizations to invest in enterprise mobility solutions that not only empower their workforce but also ensure operational continuity.There are numerous opportunities to be explored in this space, particularly with the rise of the Internet of Things (IoT) and advanced analytics. 

    Companies can leverage mobile applications to gain insights into energy consumption patterns, manage assets more effectively, and respond swiftly to incidents or anomalies. Additionally, as remote work becomes more prevalent, solutions that facilitate mobile access to enterprise systems will become increasingly vital. There is potential for developing tailored solutions that address specific challenges faced by energy companies, creating an environment ripe for innovation and collaboration. Recently, there has been a growing trend towards adopting artificial intelligence and machine learning technologies within enterprise mobility solutions.These advancements enable predictive maintenance, enhance decision-making, and provide actionable insights, further driving efficiency.

    Companies are also focusing on user-friendly mobile applications to increase employee adoption and maximize productivity. The emphasis on sustainability and green technology is shaping the development of mobile solutions that not only meet operational needs but also align with environmental goals. Overall, the landscape of enterprise mobility in the energy sector is continuously evolving, and companies need to stay ahead of these trends to seize the opportunities that arise.

     Figure 1: Enterprise Mobility in Energy Sector Industry Market size 2025-2034

    Source: Primary Research, Secondary Research, Market Research Future Database and Analyst Review

    The integration of mobile technologies within the energy sector is poised to enhance operational efficiency and facilitate real-time data access, thereby driving innovation and sustainability in energy management.

    U.S. Department of Energy

    Enterprise Mobility in Energy Sector Industry Market Drivers

    Market Growth Projections

    The Global Enterprise Mobility in Energy Sector Industry Market is poised for substantial growth, with projections indicating a market size of 31.7 USD Billion in 2024 and an anticipated increase to 77.1 USD Billion by 2035. This growth trajectory suggests a compound annual growth rate of 8.43% from 2025 to 2035. Such figures reflect the increasing adoption of mobile technologies across the energy sector, driven by factors such as regulatory support, technological advancements, and a focus on operational efficiency. The market's expansion is indicative of the broader trends towards digital transformation and sustainability in the energy industry.

    Regulatory Support and Incentives

    Regulatory frameworks and government incentives are crucial drivers of the Global Enterprise Mobility in Energy Sector Industry Market. Governments are increasingly recognizing the importance of energy mobility solutions in achieving energy efficiency and sustainability goals. Policies that provide financial support for mobile energy solutions encourage companies to invest in innovative technologies. For instance, tax credits and grants for adopting mobile energy management systems can significantly reduce operational costs. This regulatory support is likely to propel the Global Enterprise Mobility in Energy Sector Industry Market towards an estimated value of 77.1 USD Billion by 2035, as more companies seek to comply with evolving regulations.

    Increased Demand for Renewable Energy

    The Global Enterprise Mobility in Energy Sector Industry Market is witnessing a surge in demand for renewable energy solutions. This shift is driven by global initiatives aimed at reducing carbon emissions and promoting sustainable practices. Governments worldwide are implementing policies that encourage the adoption of renewable energy sources, such as solar and wind. For instance, the International Energy Agency reports that renewable energy capacity is expected to grow significantly, contributing to the overall market growth. The Global Enterprise Mobility in Energy Sector Industry Market is projected to reach 31.7 USD Billion in 2024, reflecting the increasing investment in clean energy technologies.

    Growing Focus on Operational Efficiency

    The pursuit of operational efficiency is a key driver in the Global Enterprise Mobility in Energy Sector Industry Market. Energy companies are under constant pressure to reduce costs while maintaining service quality. Mobile solutions enable organizations to streamline processes, enhance communication, and improve workforce productivity. For example, mobile workforce management applications allow field technicians to access real-time information, reducing downtime and improving response times. This focus on efficiency is expected to contribute to the growth of the Global Enterprise Mobility in Energy Sector Industry Market, as companies increasingly adopt mobile technologies to optimize their operations.

    Emergence of Smart Grids and Infrastructure

    The emergence of smart grids is transforming the Global Enterprise Mobility in Energy Sector Industry Market. Smart grids leverage digital technology to enhance the reliability and efficiency of energy distribution. This transformation requires robust mobile solutions to manage the complex data generated by smart meters and other devices. As energy providers invest in smart grid infrastructure, the demand for mobile applications that facilitate data analysis and management is likely to increase. This trend indicates a growing market potential, as companies seek to integrate mobility solutions into their smart grid initiatives.

    Technological Advancements in Mobile Solutions

    Technological innovations are playing a pivotal role in shaping the Global Enterprise Mobility in Energy Sector Industry Market. The integration of advanced mobile solutions, such as IoT and AI, enhances operational efficiency and decision-making processes. These technologies enable real-time data collection and analysis, allowing energy companies to optimize their operations. For example, mobile applications facilitate remote monitoring of energy production and consumption, leading to improved resource management. As a result, the Global Enterprise Mobility in Energy Sector Industry Market is expected to experience a compound annual growth rate of 8.43% from 2025 to 2035, driven by these technological advancements.

    Market Segment Insights

    Enterprise Mobility in Energy Sector Industry Market Application Insights  

    The Enterprise Mobility in Energy Sector Industry Market, focusing on the Application segment, reveals a promising growth trajectory driven by the increased adoption of mobility solutions in operational processes. In 2023, the overall market was valued at 26.93 USD Billion, with expectations to reach 55.7 USD Billion by 2032, showcasing the market growth trends. The segment encompasses various applications, including Field Services Management, Asset Management, Workforce Management, and Supply Chain Management, each contributing distinctly to the market's financial landscape and operational efficiencies.

    Field Services Management holds a substantial position, valued at 8.5 USD Billion in 2023, and is projected to increase to 17.5 USD Billion by 2032, highlighting its importance in enhancing service delivery and operational efficiency in the energy sector. 

    This application dominates due to its capability to optimize workforce productivity and streamline processes in real time, leading to reduced operational downtime and increased customer satisfaction.Following closely is Asset Management, which was valued at 7.0 USD Billion in 2023 and is anticipated to scale up to 15.0 USD Billion by 2032. This domain plays a significant role in asset tracking, monitoring equipment health, and ensuring regulatory compliance, which is crucial for risk management and extending asset lifespan in the energy sector.

    Workforce Management, valued at 6.0 USD Billion in 2023 and expected to grow to 12.5 USD Billion by 2032, emphasizes the effective allocation of human resources, thereby fostering efficiency in workforce deployment and management. 

    The ability to mobilize and manage the workforce effectively contributes significantly to the overall operational performance of energy companies, ensuring that skilled workers are where they are needed most. Lastly, Supply Chain Management, with a market value of 5.43 USD Billion in 2023, projected to rise to 10.7 USD Billion by 2032, offers essential solutions for enhancing supply chain visibility, improving logistics, and ensuring timely delivery of resources. The significance of this application stems from its capacity to minimize delays and optimize inventory management, which is vital in maintaining the continuous flow of operations in the energy sector.

    Enterprise Mobility in Energy Sector Industry Market Deployment Type Insights  

    The Enterprise Mobility in Energy Sector Industry Market, valued at 26.93 USD Billion in 2023, showcases significant potential for growth, particularly within the Deployment Type segment. This segment is primarily categorized into Cloud-Based and On-Premise solutions. Cloud-Based deployment holds a prominent position due to its scalability, cost-effectiveness, and ease of integration with existing infrastructure. Organizations in the energy sector are increasingly adopting Cloud-Based solutions to enhance operational efficiency and facilitate remote access to critical data.

    On the other hand, On-Premise deployment remains significant; companies choose it for reasons related to data control and security, responding to regulatory and operational demands. Both deployment types play pivotal roles in driving the Enterprise Mobility in Energy Sector Industry Market revenue, addressing the diverse needs of businesses while also presenting opportunities for tailored solutions to meet specific challenges within the energy sector. Rising demand for mobility solutions to improve workforce productivity further fuels market growth, leading to enhanced Enterprise Mobility in Energy Sector Industry Market Statistics.

    Enterprise Mobility in Energy Sector Industry Market End User Insights  

    The Enterprise Mobility in Energy Sector Industry Market is projected to be valued at 26.93 USD Billion in 2023 and is anticipated to witness substantial growth over the years. The End User segment of this market comprises key areas such as Utilities, Oil and Gas, and Renewable Energy, each playing a crucial role in market dynamics. Utilities dominate this space, facilitated by the ongoing shift towards smart solutions and digital integration, pushing the demand for efficient mobility solutions.

    The Oil and Gas sector is significant due to its vast geographical operations and need for real-time data access, enhancing operational efficiency and safety.

    Meanwhile, the Renewable Energy segment is gaining traction, driven by a global push for sustainable practices and technology adoption, indicating a substantial opportunity for growth. These segments contribute to the overall market growth by embracing innovative mobility solutions, thus creating a robust environment that caters to the evolving needs of the energy sector. With increasing investments and advancements in technology, the Enterprise Mobility in Energy Sector Industry Market continues to show promising trends and opportunities for expansion within its End User segment.

    Enterprise Mobility in Energy Sector Industry Market Device Type Insights  

    Enterprise Mobility in Energy Sector Industry Market Device Type Insights  

    The Enterprise Mobility in Energy Sector Industry Market demonstrates significant growth across various Device Types, contributing to its overall valuation of 26.93 USD Billion in 2023. Among the Device Types, Smartphones are vital due to their widespread usage and essential features that facilitate communication and mobile access to crucial data in real-time. Tablets also play a pivotal role, providing larger screens suited for more detailed tasks and presentations, thus enhancing productivity in the energy sector. 

    Laptops are fundamental for comprehensive technical operations and complex data analysis, serving professionals in the field effectively.Additionally, Wearable Devices are gaining traction, particularly for real-time monitoring and data collection, which enhances operational efficiency. The demand for these devices is driven by the need for improved connectivity, remote monitoring, and effective data management in the energy industry. As technologies evolve, the importance of integrating various devices for seamless operational workflows is becoming clear, positioning these Device Types as critical components in the broader Enterprise Mobility in Energy Sector Industry Market narrative

    Get more detailed insights about Enterprise Mobility in Energy Sector Industry Market Research Report — Global Forecast till 2034

    Regional Insights

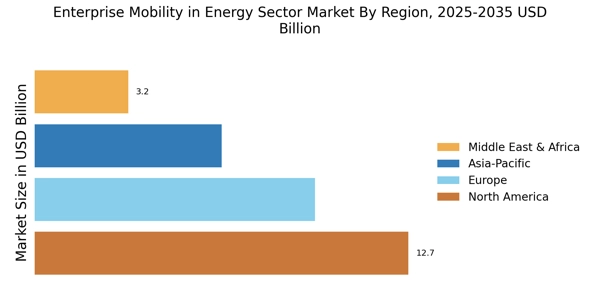
    The Enterprise Mobility in Energy Sector Industry Market is witnessing notable growth across various regions, with North America leading the market, valued at 10.8 USD Billion in 2023 and projected to reach 22.5 USD Billion by 2032. This region's dominance stems from its advanced technology adoption and significant investments in infrastructure. Europe follows closely with a valuation of 7.5 USD Billion in 2023 and an increase to 15.5 USD Billion by 2032, driven by regulatory support and a focus on sustainability initiatives.

    The APAC region, valued at 5.5 USD Billion in 2023, is expected to grow to 11.5 USD Billion, fueled by rapid digitization and increased energy demand in countries like China and India.

    South America shows a modest value of 1.5 USD Billion in 2023, anticipating growth to 3.0 USD Billion, supported by emerging market dynamics but facing challenges in infrastructure development. Meanwhile, the MEA region, starting at 1.6 USD Billion in 2023 and projected to double to 3.5 USD Billion, represents an opportunity with its increasing investment in energy efficiency. Collectively, these regions demonstrate varied market dynamics, driven by technological advancements, regulatory frameworks, and economic growth, participating significantly in the Enterprise Mobility in Energy Sector Industry Market revenue.

    Enterprise Mobility in Energy Sector Industry Market Regional Insights  

    Source: Primary Research, Secondary Research, Market Research Future Database and Analyst Review

    Key Players and Competitive Insights

    The Enterprise Mobility in Energy Sector Industry Market is a rapidly evolving landscape that encompasses a wide range of technologies and solutions designed to streamline operations, enhance productivity, and promote efficiency in energy companies. With energy stakeholders increasingly seeking to leverage mobile devices and applications, the competition among various market players is intensifying. Companies are focusing on innovative strategies and advanced technologies to offer cutting-edge solutions that meet the unique demands of the energy sector. In this environment, understanding competitive dynamics is vital for organizations aiming to establish or maintain a stronghold in the market. 

    Key players are not only competing on technology and service quality but are also looking to address regulatory compliance, cybersecurity challenges, and integration capabilities with existing systems.In the realm of Global Enterprise Mobility in the Energy Sector, Oracle stands out for its comprehensive suite of cloud applications tailored specifically for energy businesses. The company’s strong emphasis on integrating mobile technology with established enterprise systems allows for real-time data access and improved decision-making.

    Oracle’s solutions are designed to enhance project management, asset tracking, and operational efficiency, which are critical in an industry where minute-by-minute data can lead to significant cost savings and improved safety standards. The company’s robust data analytics capabilities also empower energy firms to gain actionable insights from mobile applications, granting them a competitive edge. 

    Furthermore, Oracle's commitment to security ensures that sensitive energy sector data is safeguarded against potential threats, thereby fostering trust among its clients.Vodafone holds a significant position in the Enterprise Mobility in Energy Sector Industry Market with its extensive communication infrastructure and tailored mobility solutions. The company leverages its strong telecommunications network to provide energy firms with reliable connectivity, which is crucial for operational efficiency. Vodafone excels in offering IoT solutions that enhance remote monitoring and fleet management, allowing companies to optimize resource use and minimize downtime.

    Its emphasis on innovative mobile technologies aids in driving efficient field operations, ultimately leading to enhanced service delivery and customer satisfaction. Additionally, Vodafone's expertise in integrating mobility solutions with cloud-based platforms enables energy organizations to improve collaboration and streamline processes, positioning the company as a formidable competitor in this dynamic market.

    Key Companies in the Enterprise Mobility in Energy Sector Industry Market market include

    Industry Developments

    Recent developments in the Global Enterprise Mobility in the Energy Sector Industry Market have highlighted a significant movement toward digital transformation, with companies like Oracle, Vodafone, and SAP enhancing their mobile solutions to improve operational efficiency. The demand for real-time data accessibility and workforce mobility has escalated, prompting innovations in cloud-based applications. Current affairs indicate strategic partnerships and technological advancements driving growth, particularly among major players like Microsoft and IBM, who are integrating AI and analytics into their mobility platforms. 

    Recent acquisition activity is notable, with Honeywell and Cisco exploring synergies through strategic mergers aimed at enhancing IoT capabilities within energy management. The market is experiencing growth in valuation, propelled by increasing investments in smart energy management solutions and mobile workforce applications, which are becoming critical for operational success. Furthermore, companies like Accenture and Siemens are addressing security concerns associated with mobile applications, thereby reinforcing their value proposition in this evolving marketplace. This trajectory is expected to stimulate competition and offer innovative solutions to an increasingly mobile workforce across the energy sector.

    Future Outlook

    Enterprise Mobility in Energy Sector Industry Market Future Outlook

    The Enterprise Mobility in Energy Sector Industry Market is projected to grow at 8.43% CAGR from 2024 to 2035, driven by technological advancements and increasing demand for operational efficiency.

    New opportunities lie in:

    • Invest in AI-driven analytics for predictive maintenance solutions.
    • Develop mobile applications for real-time energy management.
    • Enhance cybersecurity measures for mobile platforms in energy operations.

    By 2035, the market is expected to be robust, reflecting substantial growth and innovation.

    Market Segmentation

    Enterprise Mobility in Energy Sector Industry Market End User Outlook

    • Smartphones
    • Tablets
    • Laptops
    • Wearable Devices

    Enterprise Mobility in Energy Sector Industry Market Regional Outlook

    • North America
    • Europe
    • South America
    • Asia Pacific
    • Middle East and Africa

    Enterprise Mobility in Energy Sector Industry Market Application Outlook

    • Cloud-Based
    • On-Premise

    Enterprise Mobility in Energy Sector Industry Market Device Type Outlook

    • North America
    • Europe
    • South America
    • Asia Pacific
    • Middle East and Africa

    Enterprise Mobility in Energy Sector Industry Market Deployment Type Outlook

    • Utilities
    • Oil and Gas
    • Renewable Energy

    Report Scope

    Report Attribute/Metric Details
    Market Size 2024 31.66 (USD Billion)
    Market Size 2025 34.32 (USD Billion)
    Market Size 2034 71.12 (USD Billion)
    Compound Annual Growth Rate (CAGR) 8.41% (2025 - 2034)
    Report Coverage Revenue Forecast, Competitive Landscape, Growth Factors, and Trends
    Base Year 2024
    Market Forecast Period 2025 - 2034
    Historical Data 2019 - 2023
    Market Forecast Units USD Billion
    Key Companies Profiled Oracle, Vodafone, Huawei, Accenture, SAP, Honeywell, Microsoft, AT and T, IBM, Ericsson, Capgemini, Dell Technologies, Schneider Electric, Siemens, Cisco
    Segments Covered Application, Deployment Type, End User, Device Type, Regional
    Key Market Opportunities Increased remote workforce integration, Growing demand for real-time data access, Enhanced safety and compliance solutions, Adoption of IoT and automation technologies, Demand for cost-effective mobility solutions
    Key Market Dynamics Rising mobile workforce demand, Need for operational efficiency, Enhancing cybersecurity measures, Adoption of IoT technologies, Regulatory compliance requirements
    Countries Covered North America, Europe, APAC, South America, MEA

    Market Highlights

    Author
    Aarti Dhapte
    Team Lead - Research

    She holds an experience of about 6+ years in Market Research and Business Consulting, working under the spectrum of Information Communication Technology, Telecommunications and Semiconductor domains. Aarti conceptualizes and implements a scalable business strategy and provides strategic leadership to the clients. Her expertise lies in market estimation, competitive intelligence, pipeline analysis, customer assessment, etc.

    Leave a Comment

    FAQs

    What is the projected market size of the Enterprise Mobility in Energy Sector Industry Market by 2032?

    By 2034, the Enterprise Mobility in Energy Sector Industry Market is expected to reach a value of 71.12 billion USD.

    What is the expected compound annual growth rate (CAGR) for the market during the forecast period?

    The market is anticipated to grow at a CAGR of 8.41% from 2025 to 2034

    Which region holds the largest share of the market in 2023?

    North America is projected to hold the largest market share, valued at 10.8 billion USD in 2023.

    What will be the market size for Field Services Management by 2032?

    The market size for Field Services Management is expected to reach 17.5 billion USD by 2032.

    Who are the key players in the Enterprise Mobility in Energy Sector Industry Market?

    Major players in the market include Oracle, Vodafone, Huawei, Accenture, SAP, and Honeywell.

    How much is the Workforce Management segment valued in 2023?

    The Workforce Management segment is valued at 6.0 billion USD in 2023.

    What is the estimated market size for the South American region by 2032?

    The estimated market size for the South American region is expected to be 3.0 billion USD by 2032.

    What is the expected market value for Asset Management in 2023?

    The Asset Management segment is expected to be valued at 7.0 billion USD in the year 2023.

    How much is the Supply Chain Management segment projected to be worth in 2032?

    The Supply Chain Management segment is projected to be valued at 10.7 billion USD by 2032.

    What is the market size for the Asia-Pacific region in 2023?

    The Asia-Pacific region is valued at 5.5 billion USD in 2023.

    1. 'TABLE OF CONTENTS
    2. EXECUTIVE SUMMARY
    3. Market Overview
      1. Key Findings
      2. Market Segmentation
    4. Competitive Landscape
      1. Challenges and Opportunities
      2. Future Outlook
    5. MARKET INTRODUCTION
      1. Definition
      2. Scope of the study
        1. Research Objective
        2. Assumption
        3. Limitations
    6. RESEARCH METHODOLOGY
      1. Overview
    7. Data Mining
      1. Secondary Research
      2. Primary Research
    8. Primary Interviews and Information Gathering Process
      1. Breakdown of Primary
    9. Respondents
      1. Forecasting Model
      2. Market Size Estimation
    10. Bottom-Up Approach
      1. Top-Down Approach
      2. Data Triangulation
      3. Validation
    11. MARKET DYNAMICS
      1. Overview
      2. Drivers
      3. Restraints
      4. Opportunities
    12. MARKET FACTOR ANALYSIS
      1. Value chain Analysis
      2. Porter''s Five Forces
    13. Analysis
      1. Bargaining Power of Suppliers
        1. Bargaining Power
    14. of Buyers
      1. Threat of New Entrants
        1. Threat of Substitutes
        2. Intensity of Rivalry
      2. COVID-19 Impact Analysis
    15. Market Impact Analysis
      1. Regional Impact
        1. Opportunity and
    16. Threat Analysis
    17. ENTERPRISE MOBILITY IN ENERGY SECTOR
    18. INDUSTRY MARKET, BY APPLICATION (USD BILLION)
      1. Field Services Management
      2. Asset Management
      3. Workforce Management
      4. Supply Chain
    19. Management
    20. ENTERPRISE MOBILITY IN ENERGY SECTOR INDUSTRY MARKET, BY DEPLOYMENT
    21. TYPE (USD BILLION)
      1. Cloud-Based
      2. On-Premise
    22. ENTERPRISE
    23. MOBILITY IN ENERGY SECTOR INDUSTRY MARKET, BY END USER (USD BILLION)
    24. Utilities
      1. Oil and Gas
      2. Renewable Energy
    25. ENTERPRISE
    26. MOBILITY IN ENERGY SECTOR INDUSTRY MARKET, BY DEVICE TYPE (USD BILLION)
    27. Smartphones
      1. Tablets
      2. Laptops
      3. Wearable Devices
    28. ENTERPRISE MOBILITY IN ENERGY SECTOR INDUSTRY MARKET, BY REGIONAL (USD BILLION)
      1. North America
        1. US
        2. Canada
      2. Europe
        1. Germany
        2. UK
        3. France
        4. Russia
        5. Italy
        6. Spain
        7. Rest of Europe
    29. APAC
      1. China
        1. India
        2. Japan
        3. South
    30. Korea
      1. Malaysia
        1. Thailand
        2. Indonesia
        3. Rest of APAC
      2. South America
        1. Brazil
    31. Mexico
      1. Argentina
        1. Rest of South America
      2. MEA
        1. GCC Countries
        2. South Africa
        3. Rest of MEA
    32. COMPETITIVE LANDSCAPE
      1. Overview
    33. Competitive Analysis
      1. Market share Analysis
      2. Major Growth
    34. Strategy in the Enterprise Mobility in Energy Sector Industry Market
    35. Competitive Benchmarking
      1. Leading Players in Terms of Number of Developments
    36. in the Enterprise Mobility in Energy Sector Industry Market
      1. Key developments
    37. and growth strategies
      1. New Product Launch/Service Deployment
    38. Merger & Acquisitions
      1. Joint Ventures
      2. Major Players
    39. Financial Matrix
      1. Sales and Operating Income
        1. Major Players
    40. R&D Expenditure. 2023
    41. COMPANY PROFILES
      1. Oracle
    42. Financial Overview
      1. Products Offered
        1. Key Developments
        2. SWOT Analysis
        3. Key Strategies
      2. Vodafone
        1. Financial Overview
        2. Products Offered
        3. Key Developments
        4. SWOT Analysis
        5. Key Strategies
      3. Huawei
        1. Financial Overview
        2. Products Offered
        3. Key Developments
        4. SWOT Analysis
        5. Key Strategies
      4. Accenture
        1. Financial Overview
        2. Products Offered
        3. Key Developments
        4. SWOT Analysis
        5. Key Strategies
      5. SAP
    43. Financial Overview
      1. Products Offered
        1. Key Developments
        2. SWOT Analysis
        3. Key Strategies
      2. Honeywell
        1. Financial Overview
        2. Products Offered
        3. Key Developments
        4. SWOT Analysis
        5. Key Strategies
      3. Microsoft
        1. Financial Overview
        2. Products Offered
        3. Key Developments
        4. SWOT Analysis
        5. Key Strategies
      4. AT and T
        1. Financial Overview
        2. Products Offered
        3. Key Developments
        4. SWOT Analysis
        5. Key Strategies
      5. IBM
    44. Financial Overview
      1. Products Offered
        1. Key Developments
        2. SWOT Analysis
        3. Key Strategies
      2. Ericsson
        1. Financial Overview
        2. Products Offered
        3. Key
    45. Developments
      1. SWOT Analysis
        1. Key Strategies
    46. Capgemini
      1. Financial Overview
        1. Products Offered
        2. Key Developments
        3. SWOT Analysis
        4. Key Strategies
      2. Dell Technologies
        1. Financial Overview
    47. Products Offered
      1. Key Developments
        1. SWOT Analysis
        2. Key Strategies
      2. Schneider Electric
        1. Financial
    48. Overview
      1. Products Offered
        1. Key Developments
    49. SWOT Analysis
      1. Key Strategies
      2. Siemens
    50. Financial Overview
      1. Products Offered
        1. Key Developments
        2. SWOT Analysis
        3. Key Strategies
      2. Cisco
        1. Financial Overview
        2. Products Offered
        3. Key
    51. Developments
      1. SWOT Analysis
        1. Key Strategies
      2. References
      3. Related Reports
    52. IN ENERGY SECTOR INDUSTRY MARKET SIZE ESTIMATES & FORECAST, BY APPLICATION,
    53. 2032 (USD BILLIONS)
    54. SECTOR INDUSTRY MARKET SIZE ESTIMATES & FORECAST, BY DEPLOYMENT TYPE, 2019-2032
    55. (USD BILLIONS)
    56. INDUSTRY MARKET SIZE ESTIMATES & FORECAST, BY END USER, 2019-2032 (USD BILLIONS)
    57. SIZE ESTIMATES & FORECAST, BY DEVICE TYPE, 2019-2032 (USD BILLIONS)
    58. NORTH AMERICA ENTERPRISE MOBILITY IN ENERGY SECTOR INDUSTRY MARKET SIZE ESTIMATES
    59. & FORECAST, BY REGIONAL, 2019-2032 (USD BILLIONS)
    60. MOBILITY IN ENERGY SECTOR INDUSTRY MARKET SIZE ESTIMATES & FORECAST, BY APPLICATION,
    61. 2032 (USD BILLIONS)
    62. INDUSTRY MARKET SIZE ESTIMATES & FORECAST, BY DEPLOYMENT TYPE, 2019-2032 (USD
    63. BILLIONS)
    64. SIZE ESTIMATES & FORECAST, BY END USER, 2019-2032 (USD BILLIONS)
    65. US ENTERPRISE MOBILITY IN ENERGY SECTOR INDUSTRY MARKET SIZE ESTIMATES &
    66. FORECAST, BY DEVICE TYPE, 2019-2032 (USD BILLIONS)
    67. MOBILITY IN ENERGY SECTOR INDUSTRY MARKET SIZE ESTIMATES & FORECAST, BY REGIONAL,
    68. 2032 (USD BILLIONS)
    69. INDUSTRY MARKET SIZE ESTIMATES & FORECAST, BY APPLICATION, 2019-2032 (USD BILLIONS)
    70. ESTIMATES & FORECAST, BY DEPLOYMENT TYPE, 2019-2032 (USD BILLIONS)
    71. CANADA ENTERPRISE MOBILITY IN ENERGY SECTOR INDUSTRY MARKET SIZE ESTIMATES &
    72. FORECAST, BY END USER, 2019-2032 (USD BILLIONS)
    73. MOBILITY IN ENERGY SECTOR INDUSTRY MARKET SIZE ESTIMATES & FORECAST, BY DEVICE
    74. TYPE, 2019-2032 (USD BILLIONS)
    75. SECTOR INDUSTRY MARKET SIZE ESTIMATES & FORECAST, BY REGIONAL, 2019-2032 (USD
    76. BILLIONS)
    77. SIZE ESTIMATES & FORECAST, BY APPLICATION, 2019-2032 (USD BILLIONS)
    78. EUROPE ENTERPRISE MOBILITY IN ENERGY SECTOR INDUSTRY MARKET SIZE ESTIMATES &
    79. FORECAST, BY DEPLOYMENT TYPE, 2019-2032 (USD BILLIONS)
    80. MOBILITY IN ENERGY SECTOR INDUSTRY MARKET SIZE ESTIMATES & FORECAST, BY END
    81. USER, 2019-2032 (USD BILLIONS)
    82. SECTOR INDUSTRY MARKET SIZE ESTIMATES & FORECAST, BY DEVICE TYPE, 2019-2032
    83. (USD BILLIONS)
    84. MARKET SIZE ESTIMATES & FORECAST, BY REGIONAL, 2019-2032 (USD BILLIONS)
    85. & FORECAST, BY APPLICATION, 2019-2032 (USD BILLIONS)
    86. ENTERPRISE MOBILITY IN ENERGY SECTOR INDUSTRY MARKET SIZE ESTIMATES & FORECAST,
    87. BY DEPLOYMENT TYPE, 2019-2032 (USD BILLIONS)
    88. MOBILITY IN ENERGY SECTOR INDUSTRY MARKET SIZE ESTIMATES & FORECAST, BY END
    89. USER, 2019-2032 (USD BILLIONS)
    90. SECTOR INDUSTRY MARKET SIZE ESTIMATES & FORECAST, BY DEVICE TYPE, 2019-2032
    91. (USD BILLIONS)
    92. MARKET SIZE ESTIMATES & FORECAST, BY REGIONAL, 2019-2032 (USD BILLIONS)
    93. & FORECAST, BY APPLICATION, 2019-2032 (USD BILLIONS)
    94. MOBILITY IN ENERGY SECTOR INDUSTRY MARKET SIZE ESTIMATES & FORECAST, BY DEPLOYMENT
    95. TYPE, 2019-2032 (USD BILLIONS)
    96. SECTOR INDUSTRY MARKET SIZE ESTIMATES & FORECAST, BY END USER, 2019-2032 (USD
    97. BILLIONS)
    98. SIZE ESTIMATES & FORECAST, BY DEVICE TYPE, 2019-2032 (USD BILLIONS)
    99. UK ENTERPRISE MOBILITY IN ENERGY SECTOR INDUSTRY MARKET SIZE ESTIMATES &
    100. FORECAST, BY REGIONAL, 2019-2032 (USD BILLIONS)
    101. MOBILITY IN ENERGY SECTOR INDUSTRY MARKET SIZE ESTIMATES & FORECAST, BY APPLICATION,
    102. 2032 (USD BILLIONS)
    103. INDUSTRY MARKET SIZE ESTIMATES & FORECAST, BY DEPLOYMENT TYPE, 2019-2032 (USD
    104. BILLIONS)
    105. SIZE ESTIMATES & FORECAST, BY END USER, 2019-2032 (USD BILLIONS)
    106. FRANCE ENTERPRISE MOBILITY IN ENERGY SECTOR INDUSTRY MARKET SIZE ESTIMATES &
    107. FORECAST, BY DEVICE TYPE, 2019-2032 (USD BILLIONS)
    108. MOBILITY IN ENERGY SECTOR INDUSTRY MARKET SIZE ESTIMATES & FORECAST, BY REGIONAL,
    109. 2032 (USD BILLIONS)
    110. INDUSTRY MARKET SIZE ESTIMATES & FORECAST, BY APPLICATION, 2019-2032 (USD BILLIONS)
    111. ESTIMATES & FORECAST, BY DEPLOYMENT TYPE, 2019-2032 (USD BILLIONS)
    112. RUSSIA ENTERPRISE MOBILITY IN ENERGY SECTOR INDUSTRY MARKET SIZE ESTIMATES &
    113. FORECAST, BY END USER, 2019-2032 (USD BILLIONS)
    114. MOBILITY IN ENERGY SECTOR INDUSTRY MARKET SIZE ESTIMATES & FORECAST, BY DEVICE
    115. TYPE, 2019-2032 (USD BILLIONS)
    116. SECTOR INDUSTRY MARKET SIZE ESTIMATES & FORECAST, BY REGIONAL, 2019-2032 (USD
    117. BILLIONS)
    118. SIZE ESTIMATES & FORECAST, BY APPLICATION, 2019-2032 (USD BILLIONS)
    119. ITALY ENTERPRISE MOBILITY IN ENERGY SECTOR INDUSTRY MARKET SIZE ESTIMATES &
    120. FORECAST, BY DEPLOYMENT TYPE, 2019-2032 (USD BILLIONS)
    121. MOBILITY IN ENERGY SECTOR INDUSTRY MARKET SIZE ESTIMATES & FORECAST, BY END
    122. USER, 2019-2032 (USD BILLIONS)
    123. SECTOR INDUSTRY MARKET SIZE ESTIMATES & FORECAST, BY DEVICE TYPE, 2019-2032
    124. (USD BILLIONS)
    125. MARKET SIZE ESTIMATES & FORECAST, BY REGIONAL, 2019-2032 (USD BILLIONS)
    126. & FORECAST, BY APPLICATION, 2019-2032 (USD BILLIONS)
    127. MOBILITY IN ENERGY SECTOR INDUSTRY MARKET SIZE ESTIMATES & FORECAST, BY DEPLOYMENT
    128. TYPE, 2019-2032 (USD BILLIONS)
    129. SECTOR INDUSTRY MARKET SIZE ESTIMATES & FORECAST, BY END USER, 2019-2032 (USD
    130. BILLIONS)
    131. SIZE ESTIMATES & FORECAST, BY DEVICE TYPE, 2019-2032 (USD BILLIONS)
    132. SPAIN ENTERPRISE MOBILITY IN ENERGY SECTOR INDUSTRY MARKET SIZE ESTIMATES &
    133. FORECAST, BY REGIONAL, 2019-2032 (USD BILLIONS)
    134. MOBILITY IN ENERGY SECTOR INDUSTRY MARKET SIZE ESTIMATES & FORECAST, BY APPLICATION,
    135. 2032 (USD BILLIONS)
    136. SECTOR INDUSTRY MARKET SIZE ESTIMATES & FORECAST, BY DEPLOYMENT TYPE, 2019-2032
    137. (USD BILLIONS)
    138. INDUSTRY MARKET SIZE ESTIMATES & FORECAST, BY END USER, 2019-2032 (USD BILLIONS)
    139. SIZE ESTIMATES & FORECAST, BY DEVICE TYPE, 2019-2032 (USD BILLIONS)
    140. REST OF EUROPE ENTERPRISE MOBILITY IN ENERGY SECTOR INDUSTRY MARKET SIZE ESTIMATES
    141. & FORECAST, BY REGIONAL, 2019-2032 (USD BILLIONS)
    142. MOBILITY IN ENERGY SECTOR INDUSTRY MARKET SIZE ESTIMATES & FORECAST, BY APPLICATION,
    143. 2032 (USD BILLIONS)
    144. INDUSTRY MARKET SIZE ESTIMATES & FORECAST, BY DEPLOYMENT TYPE, 2019-2032 (USD
    145. BILLIONS)
    146. SIZE ESTIMATES & FORECAST, BY END USER, 2019-2032 (USD BILLIONS)
    147. APAC ENTERPRISE MOBILITY IN ENERGY SECTOR INDUSTRY MARKET SIZE ESTIMATES &
    148. FORECAST, BY DEVICE TYPE, 2019-2032 (USD BILLIONS)
    149. MOBILITY IN ENERGY SECTOR INDUSTRY MARKET SIZE ESTIMATES & FORECAST, BY REGIONAL,
    150. 2032 (USD BILLIONS)
    151. INDUSTRY MARKET SIZE ESTIMATES & FORECAST, BY APPLICATION, 2019-2032 (USD BILLIONS)
    152. ESTIMATES & FORECAST, BY DEPLOYMENT TYPE, 2019-2032 (USD BILLIONS)
    153. CHINA ENTERPRISE MOBILITY IN ENERGY SECTOR INDUSTRY MARKET SIZE ESTIMATES &
    154. FORECAST, BY END USER, 2019-2032 (USD BILLIONS)
    155. MOBILITY IN ENERGY SECTOR INDUSTRY MARKET SIZE ESTIMATES & FORECAST, BY DEVICE
    156. TYPE, 2019-2032 (USD BILLIONS)
    157. SECTOR INDUSTRY MARKET SIZE ESTIMATES & FORECAST, BY REGIONAL, 2019-2032 (USD
    158. BILLIONS)
    159. SIZE ESTIMATES & FORECAST, BY APPLICATION, 2019-2032 (USD BILLIONS)
    160. INDIA ENTERPRISE MOBILITY IN ENERGY SECTOR INDUSTRY MARKET SIZE ESTIMATES &
    161. FORECAST, BY DEPLOYMENT TYPE, 2019-2032 (USD BILLIONS)
    162. MOBILITY IN ENERGY SECTOR INDUSTRY MARKET SIZE ESTIMATES & FORECAST, BY END
    163. USER, 2019-2032 (USD BILLIONS)
    164. SECTOR INDUSTRY MARKET SIZE ESTIMATES & FORECAST, BY DEVICE TYPE, 2019-2032
    165. (USD BILLIONS)
    166. MARKET SIZE ESTIMATES & FORECAST, BY REGIONAL, 2019-2032 (USD BILLIONS)
    167. & FORECAST, BY APPLICATION, 2019-2032 (USD BILLIONS)
    168. MOBILITY IN ENERGY SECTOR INDUSTRY MARKET SIZE ESTIMATES & FORECAST, BY DEPLOYMENT
    169. TYPE, 2019-2032 (USD BILLIONS)
    170. SECTOR INDUSTRY MARKET SIZE ESTIMATES & FORECAST, BY END USER, 2019-2032 (USD
    171. BILLIONS)
    172. SIZE ESTIMATES & FORECAST, BY DEVICE TYPE, 2019-2032 (USD BILLIONS)
    173. JAPAN ENTERPRISE MOBILITY IN ENERGY SECTOR INDUSTRY MARKET SIZE ESTIMATES &
    174. FORECAST, BY REGIONAL, 2019-2032 (USD BILLIONS)
    175. MOBILITY IN ENERGY SECTOR INDUSTRY MARKET SIZE ESTIMATES & FORECAST, BY APPLICATION,
    176. 2032 (USD BILLIONS)
    177. SECTOR INDUSTRY MARKET SIZE ESTIMATES & FORECAST, BY DEPLOYMENT TYPE, 2019-2032
    178. (USD BILLIONS)
    179. INDUSTRY MARKET SIZE ESTIMATES & FORECAST, BY END USER, 2019-2032 (USD BILLIONS)
    180. SIZE ESTIMATES & FORECAST, BY DEVICE TYPE, 2019-2032 (USD BILLIONS)
    181. SOUTH KOREA ENTERPRISE MOBILITY IN ENERGY SECTOR INDUSTRY MARKET SIZE ESTIMATES
    182. & FORECAST, BY REGIONAL, 2019-2032 (USD BILLIONS)
    183. MOBILITY IN ENERGY SECTOR INDUSTRY MARKET SIZE ESTIMATES & FORECAST, BY APPLICATION,
    184. 2032 (USD BILLIONS)
    185. SECTOR INDUSTRY MARKET SIZE ESTIMATES & FORECAST, BY DEPLOYMENT TYPE, 2019-2032
    186. (USD BILLIONS)
    187. MARKET SIZE ESTIMATES & FORECAST, BY END USER, 2019-2032 (USD BILLIONS)
    188. & FORECAST, BY DEVICE TYPE, 2019-2032 (USD BILLIONS)
    189. ENTERPRISE MOBILITY IN ENERGY SECTOR INDUSTRY MARKET SIZE ESTIMATES & FORECAST,
    190. BY REGIONAL, 2019-2032 (USD BILLIONS)
    191. IN ENERGY SECTOR INDUSTRY MARKET SIZE ESTIMATES & FORECAST, BY APPLICATION,
    192. 2032 (USD BILLIONS)
    193. SECTOR INDUSTRY MARKET SIZE ESTIMATES & FORECAST, BY DEPLOYMENT TYPE, 2019-2032
    194. (USD BILLIONS)
    195. MARKET SIZE ESTIMATES & FORECAST, BY END USER, 2019-2032 (USD BILLIONS)
    196. & FORECAST, BY DEVICE TYPE, 2019-2032 (USD BILLIONS)
    197. ENTERPRISE MOBILITY IN ENERGY SECTOR INDUSTRY MARKET SIZE ESTIMATES & FORECAST,
    198. BY REGIONAL, 2019-2032 (USD BILLIONS)
    199. IN ENERGY SECTOR INDUSTRY MARKET SIZE ESTIMATES & FORECAST, BY APPLICATION,
    200. 2032 (USD BILLIONS)
    201. SECTOR INDUSTRY MARKET SIZE ESTIMATES & FORECAST, BY DEPLOYMENT TYPE, 2019-2032
    202. (USD BILLIONS)
    203. MARKET SIZE ESTIMATES & FORECAST, BY END USER, 2019-2032 (USD BILLIONS)
    204. ESTIMATES & FORECAST, BY DEVICE TYPE, 2019-2032 (USD BILLIONS)
    205. INDONESIA ENTERPRISE MOBILITY IN ENERGY SECTOR INDUSTRY MARKET SIZE ESTIMATES &
    206. FORECAST, BY REGIONAL, 2019-2032 (USD BILLIONS)
    207. MOBILITY IN ENERGY SECTOR INDUSTRY MARKET SIZE ESTIMATES & FORECAST, BY APPLICATION,
    208. 2032 (USD BILLIONS)
    209. SECTOR INDUSTRY MARKET SIZE ESTIMATES & FORECAST, BY DEPLOYMENT TYPE, 2019-2032
    210. (USD BILLIONS)
    211. INDUSTRY MARKET SIZE ESTIMATES & FORECAST, BY END USER, 2019-2032 (USD BILLIONS)
    212. SIZE ESTIMATES & FORECAST, BY DEVICE TYPE, 2019-2032 (USD BILLIONS)
    213. REST OF APAC ENTERPRISE MOBILITY IN ENERGY SECTOR INDUSTRY MARKET SIZE ESTIMATES
    214. & FORECAST, BY REGIONAL, 2019-2032 (USD BILLIONS)
    215. ENTERPRISE MOBILITY IN ENERGY SECTOR INDUSTRY MARKET SIZE ESTIMATES & FORECAST,
    216. BY APPLICATION, 2019-2032 (USD BILLIONS)
    217. MOBILITY IN ENERGY SECTOR INDUSTRY MARKET SIZE ESTIMATES & FORECAST, BY DEPLOYMENT
    218. TYPE, 2019-2032 (USD BILLIONS)
    219. IN ENERGY SECTOR INDUSTRY MARKET SIZE ESTIMATES & FORECAST, BY END USER, 2019-2032
    220. (USD BILLIONS)
    221. INDUSTRY MARKET SIZE ESTIMATES & FORECAST, BY DEVICE TYPE, 2019-2032 (USD BILLIONS)
    222. SIZE ESTIMATES & FORECAST, BY REGIONAL, 2019-2032 (USD BILLIONS)
    223. BRAZIL ENTERPRISE MOBILITY IN ENERGY SECTOR INDUSTRY MARKET SIZE ESTIMATES
    224. & FORECAST, BY APPLICATION, 2019-2032 (USD BILLIONS)
    225. ENTERPRISE MOBILITY IN ENERGY SECTOR INDUSTRY MARKET SIZE ESTIMATES & FORECAST,
    226. BY DEPLOYMENT TYPE, 2019-2032 (USD BILLIONS)
    227. MOBILITY IN ENERGY SECTOR INDUSTRY MARKET SIZE ESTIMATES & FORECAST, BY END
    228. USER, 2019-2032 (USD BILLIONS)
    229. SECTOR INDUSTRY MARKET SIZE ESTIMATES & FORECAST, BY DEVICE TYPE, 2019-2032
    230. (USD BILLIONS)
    231. MARKET SIZE ESTIMATES & FORECAST, BY REGIONAL, 2019-2032 (USD BILLIONS)
    232. & FORECAST, BY APPLICATION, 2019-2032 (USD BILLIONS)
    233. ENTERPRISE MOBILITY IN ENERGY SECTOR INDUSTRY MARKET SIZE ESTIMATES & FORECAST,
    234. BY DEPLOYMENT TYPE, 2019-2032 (USD BILLIONS)
    235. MOBILITY IN ENERGY SECTOR INDUSTRY MARKET SIZE ESTIMATES & FORECAST, BY END
    236. USER, 2019-2032 (USD BILLIONS)
    237. SECTOR INDUSTRY MARKET SIZE ESTIMATES & FORECAST, BY DEVICE TYPE, 2019-2032
    238. (USD BILLIONS)
    239. MARKET SIZE ESTIMATES & FORECAST, BY REGIONAL, 2019-2032 (USD BILLIONS)
    240. ESTIMATES & FORECAST, BY APPLICATION, 2019-2032 (USD BILLIONS)
    241. ARGENTINA ENTERPRISE MOBILITY IN ENERGY SECTOR INDUSTRY MARKET SIZE ESTIMATES &
    242. FORECAST, BY DEPLOYMENT TYPE, 2019-2032 (USD BILLIONS)
    243. ENTERPRISE MOBILITY IN ENERGY SECTOR INDUSTRY MARKET SIZE ESTIMATES & FORECAST,
    244. BY END USER, 2019-2032 (USD BILLIONS)
    245. IN ENERGY SECTOR INDUSTRY MARKET SIZE ESTIMATES & FORECAST, BY DEVICE TYPE,
    246. 2032 (USD BILLIONS)
    247. SECTOR INDUSTRY MARKET SIZE ESTIMATES & FORECAST, BY REGIONAL, 2019-2032 (USD
    248. BILLIONS)
    249. INDUSTRY MARKET SIZE ESTIMATES & FORECAST, BY APPLICATION, 2019-2032 (USD BILLIONS)
    250. MARKET SIZE ESTIMATES & FORECAST, BY DEPLOYMENT TYPE, 2019-2032 (USD BILLIONS)
    251. MARKET SIZE ESTIMATES & FORECAST, BY END USER, 2019-2032 (USD BILLIONS)
    252. MARKET SIZE ESTIMATES & FORECAST, BY DEVICE TYPE, 2019-2032 (USD BILLIONS)
    253. MARKET SIZE ESTIMATES & FORECAST, BY REGIONAL, 2019-2032 (USD BILLIONS)
    254. & FORECAST, BY APPLICATION, 2019-2032 (USD BILLIONS)
    255. MOBILITY IN ENERGY SECTOR INDUSTRY MARKET SIZE ESTIMATES & FORECAST, BY DEPLOYMENT
    256. TYPE, 2019-2032 (USD BILLIONS)
    257. SECTOR INDUSTRY MARKET SIZE ESTIMATES & FORECAST, BY END USER, 2019-2032 (USD
    258. BILLIONS)
    259. SIZE ESTIMATES & FORECAST, BY DEVICE TYPE, 2019-2032 (USD BILLIONS)
    260. MEA ENTERPRISE MOBILITY IN ENERGY SECTOR INDUSTRY MARKET SIZE ESTIMATES &
    261. FORECAST, BY REGIONAL, 2019-2032 (USD BILLIONS)
    262. MOBILITY IN ENERGY SECTOR INDUSTRY MARKET SIZE ESTIMATES & FORECAST, BY APPLICATION,
    263. 2032 (USD BILLIONS)
    264. SECTOR INDUSTRY MARKET SIZE ESTIMATES & FORECAST, BY DEPLOYMENT TYPE, 2019-2032
    265. (USD BILLIONS)
    266. INDUSTRY MARKET SIZE ESTIMATES & FORECAST, BY END USER, 2019-2032 (USD BILLIONS)
    267. SIZE ESTIMATES & FORECAST, BY DEVICE TYPE, 2019-2032 (USD BILLIONS)
    268. GCC COUNTRIES ENTERPRISE MOBILITY IN ENERGY SECTOR INDUSTRY MARKET SIZE ESTIMATES
    269. & FORECAST, BY REGIONAL, 2019-2032 (USD BILLIONS)
    270. ENTERPRISE MOBILITY IN ENERGY SECTOR INDUSTRY MARKET SIZE ESTIMATES & FORECAST,
    271. BY APPLICATION, 2019-2032 (USD BILLIONS)
    272. MOBILITY IN ENERGY SECTOR INDUSTRY MARKET SIZE ESTIMATES & FORECAST, BY DEPLOYMENT
    273. TYPE, 2019-2032 (USD BILLIONS)
    274. IN ENERGY SECTOR INDUSTRY MARKET SIZE ESTIMATES & FORECAST, BY END USER, 2019-2032
    275. (USD BILLIONS)
    276. INDUSTRY MARKET SIZE ESTIMATES & FORECAST, BY DEVICE TYPE, 2019-2032 (USD BILLIONS)
    277. SIZE ESTIMATES & FORECAST, BY REGIONAL, 2019-2032 (USD BILLIONS)
    278. REST OF MEA ENTERPRISE MOBILITY IN ENERGY SECTOR INDUSTRY MARKET SIZE ESTIMATES
    279. & FORECAST, BY APPLICATION, 2019-2032 (USD BILLIONS)
    280. MEA ENTERPRISE MOBILITY IN ENERGY SECTOR INDUSTRY MARKET SIZE ESTIMATES & FORECAST,
    281. BY DEPLOYMENT TYPE, 2019-2032 (USD BILLIONS)
    282. MOBILITY IN ENERGY SECTOR INDUSTRY MARKET SIZE ESTIMATES & FORECAST, BY END
    283. USER, 2019-2032 (USD BILLIONS)
    284. IN ENERGY SECTOR INDUSTRY MARKET SIZE ESTIMATES & FORECAST, BY DEVICE TYPE,
    285. 2032 (USD BILLIONS)
    286. SECTOR INDUSTRY MARKET SIZE ESTIMATES & FORECAST, BY REGIONAL, 2019-2032 (USD
    287. BILLIONS)
    288. ACQUISITION/PARTNERSHIP
    289. MARKET SYNOPSIS
    290. INDUSTRY MARKET ANALYSIS
    291. INDUSTRY MARKET ANALYSIS BY APPLICATION
    292. ENERGY SECTOR INDUSTRY MARKET ANALYSIS BY DEPLOYMENT TYPE
    293. MOBILITY IN ENERGY SECTOR INDUSTRY MARKET ANALYSIS BY END USER
    294. ENTERPRISE MOBILITY IN ENERGY SECTOR INDUSTRY MARKET ANALYSIS BY DEVICE TYPE
    295. REGIONAL
    296. ANALYSIS BY APPLICATION
    297. INDUSTRY MARKET ANALYSIS BY DEPLOYMENT TYPE
    298. IN ENERGY SECTOR INDUSTRY MARKET ANALYSIS BY END USER
    299. MOBILITY IN ENERGY SECTOR INDUSTRY MARKET ANALYSIS BY DEVICE TYPE
    300. CANADA ENTERPRISE MOBILITY IN ENERGY SECTOR INDUSTRY MARKET ANALYSIS BY REGIONAL
    301. BY APPLICATION
    302. MARKET ANALYSIS BY DEPLOYMENT TYPE
    303. IN ENERGY SECTOR INDUSTRY MARKET ANALYSIS BY END USER
    304. MOBILITY IN ENERGY SECTOR INDUSTRY MARKET ANALYSIS BY DEVICE TYPE
    305. GERMANY ENTERPRISE MOBILITY IN ENERGY SECTOR INDUSTRY MARKET ANALYSIS BY REGIONAL
    306. BY APPLICATION
    307. MARKET ANALYSIS BY DEPLOYMENT TYPE
    308. SECTOR INDUSTRY MARKET ANALYSIS BY END USER
    309. IN ENERGY SECTOR INDUSTRY MARKET ANALYSIS BY DEVICE TYPE
    310. MOBILITY IN ENERGY SECTOR INDUSTRY MARKET ANALYSIS BY REGIONAL
    311. FRANCE ENTERPRISE MOBILITY IN ENERGY SECTOR INDUSTRY MARKET ANALYSIS BY APPLICATION
    312. BY DEPLOYMENT TYPE
    313. INDUSTRY MARKET ANALYSIS BY END USER
    314. IN ENERGY SECTOR INDUSTRY MARKET ANALYSIS BY DEVICE TYPE
    315. ENTERPRISE MOBILITY IN ENERGY SECTOR INDUSTRY MARKET ANALYSIS BY REGIONAL
    316. RUSSIA ENTERPRISE MOBILITY IN ENERGY SECTOR INDUSTRY MARKET ANALYSIS BY APPLICATION
    317. BY DEPLOYMENT TYPE
    318. INDUSTRY MARKET ANALYSIS BY END USER
    319. IN ENERGY SECTOR INDUSTRY MARKET ANALYSIS BY DEVICE TYPE
    320. ENTERPRISE MOBILITY IN ENERGY SECTOR INDUSTRY MARKET ANALYSIS BY REGIONAL
    321. ITALY ENTERPRISE MOBILITY IN ENERGY SECTOR INDUSTRY MARKET ANALYSIS BY APPLICATION
    322. BY DEPLOYMENT TYPE
    323. MARKET ANALYSIS BY END USER
    324. SECTOR INDUSTRY MARKET ANALYSIS BY DEVICE TYPE
    325. MOBILITY IN ENERGY SECTOR INDUSTRY MARKET ANALYSIS BY REGIONAL
    326. SPAIN ENTERPRISE MOBILITY IN ENERGY SECTOR INDUSTRY MARKET ANALYSIS BY APPLICATION
    327. BY DEPLOYMENT TYPE
    328. MARKET ANALYSIS BY END USER
    329. SECTOR INDUSTRY MARKET ANALYSIS BY DEVICE TYPE
    330. MOBILITY IN ENERGY SECTOR INDUSTRY MARKET ANALYSIS BY REGIONAL
    331. REST OF EUROPE ENTERPRISE MOBILITY IN ENERGY SECTOR INDUSTRY MARKET ANALYSIS BY
    332. APPLICATION
    333. INDUSTRY MARKET ANALYSIS BY DEPLOYMENT TYPE
    334. MOBILITY IN ENERGY SECTOR INDUSTRY MARKET ANALYSIS BY END USER
    335. REST OF EUROPE ENTERPRISE MOBILITY IN ENERGY SECTOR INDUSTRY MARKET ANALYSIS BY
    336. DEVICE TYPE
    337. INDUSTRY MARKET ANALYSIS BY REGIONAL
    338. ENERGY SECTOR INDUSTRY MARKET ANALYSIS
    339. IN ENERGY SECTOR INDUSTRY MARKET ANALYSIS BY APPLICATION
    340. ENTERPRISE MOBILITY IN ENERGY SECTOR INDUSTRY MARKET ANALYSIS BY DEPLOYMENT TYPE
    341. BY END USER
    342. MARKET ANALYSIS BY DEVICE TYPE
    343. SECTOR INDUSTRY MARKET ANALYSIS BY REGIONAL
    344. IN ENERGY SECTOR INDUSTRY MARKET ANALYSIS BY APPLICATION
    345. ENTERPRISE MOBILITY IN ENERGY SECTOR INDUSTRY MARKET ANALYSIS BY DEPLOYMENT TYPE
    346. BY END USER
    347. MARKET ANALYSIS BY DEVICE TYPE
    348. SECTOR INDUSTRY MARKET ANALYSIS BY REGIONAL
    349. IN ENERGY SECTOR INDUSTRY MARKET ANALYSIS BY APPLICATION
    350. ENTERPRISE MOBILITY IN ENERGY SECTOR INDUSTRY MARKET ANALYSIS BY DEPLOYMENT TYPE
    351. BY END USER
    352. MARKET ANALYSIS BY DEVICE TYPE
    353. SECTOR INDUSTRY MARKET ANALYSIS BY REGIONAL
    354. MOBILITY IN ENERGY SECTOR INDUSTRY MARKET ANALYSIS BY APPLICATION
    355. SOUTH KOREA ENTERPRISE MOBILITY IN ENERGY SECTOR INDUSTRY MARKET ANALYSIS BY DEPLOYMENT
    356. TYPE
    357. MARKET ANALYSIS BY END USER
    358. ENERGY SECTOR INDUSTRY MARKET ANALYSIS BY DEVICE TYPE
    359. ENTERPRISE MOBILITY IN ENERGY SECTOR INDUSTRY MARKET ANALYSIS BY REGIONAL
    360. MALAYSIA ENTERPRISE MOBILITY IN ENERGY SECTOR INDUSTRY MARKET ANALYSIS BY APPLICATION
    361. BY DEPLOYMENT TYPE
    362. INDUSTRY MARKET ANALYSIS BY END USER
    363. IN ENERGY SECTOR INDUSTRY MARKET ANALYSIS BY DEVICE TYPE
    364. ENTERPRISE MOBILITY IN ENERGY SECTOR INDUSTRY MARKET ANALYSIS BY REGIONAL
    365. THAILAND ENTERPRISE MOBILITY IN ENERGY SECTOR INDUSTRY MARKET ANALYSIS BY APPLICATION
    366. BY DEPLOYMENT TYPE
    367. INDUSTRY MARKET ANALYSIS BY END USER
    368. IN ENERGY SECTOR INDUSTRY MARKET ANALYSIS BY DEVICE TYPE
    369. ENTERPRISE MOBILITY IN ENERGY SECTOR INDUSTRY MARKET ANALYSIS BY REGIONAL
    370. INDONESIA ENTERPRISE MOBILITY IN ENERGY SECTOR INDUSTRY MARKET ANALYSIS BY APPLICATION
    371. ANALYSIS BY DEPLOYMENT TYPE
    372. SECTOR INDUSTRY MARKET ANALYSIS BY END USER
    373. MOBILITY IN ENERGY SECTOR INDUSTRY MARKET ANALYSIS BY DEVICE TYPE
    374. INDONESIA ENTERPRISE MOBILITY IN ENERGY SECTOR INDUSTRY MARKET ANALYSIS BY REGIONAL
    375. ANALYSIS BY APPLICATION
    376. SECTOR INDUSTRY MARKET ANALYSIS BY DEPLOYMENT TYPE
    377. ENTERPRISE MOBILITY IN ENERGY SECTOR INDUSTRY MARKET ANALYSIS BY END USER
    378. REST OF APAC ENTERPRISE MOBILITY IN ENERGY SECTOR INDUSTRY MARKET ANALYSIS BY
    379. DEVICE TYPE
    380. MARKET ANALYSIS BY REGIONAL
    381. ENERGY SECTOR INDUSTRY MARKET ANALYSIS
    382. IN ENERGY SECTOR INDUSTRY MARKET ANALYSIS BY APPLICATION
    383. ENTERPRISE MOBILITY IN ENERGY SECTOR INDUSTRY MARKET ANALYSIS BY DEPLOYMENT TYPE
    384. BY END USER
    385. MARKET ANALYSIS BY DEVICE TYPE
    386. SECTOR INDUSTRY MARKET ANALYSIS BY REGIONAL
    387. IN ENERGY SECTOR INDUSTRY MARKET ANALYSIS BY APPLICATION
    388. ENTERPRISE MOBILITY IN ENERGY SECTOR INDUSTRY MARKET ANALYSIS BY DEPLOYMENT TYPE
    389. BY END USER
    390. MARKET ANALYSIS BY DEVICE TYPE
    391. SECTOR INDUSTRY MARKET ANALYSIS BY REGIONAL
    392. MOBILITY IN ENERGY SECTOR INDUSTRY MARKET ANALYSIS BY APPLICATION
    393. ARGENTINA ENTERPRISE MOBILITY IN ENERGY SECTOR INDUSTRY MARKET ANALYSIS BY DEPLOYMENT
    394. TYPE
    395. ANALYSIS BY END USER
    396. INDUSTRY MARKET ANALYSIS BY DEVICE TYPE
    397. IN ENERGY SECTOR INDUSTRY MARKET ANALYSIS BY REGIONAL
    398. SOUTH AMERICA ENTERPRISE MOBILITY IN ENERGY SECTOR INDUSTRY MARKET ANALYSIS BY APPLICATION
    399. MARKET ANALYSIS BY DEPLOYMENT TYPE
    400. MOBILITY IN ENERGY SECTOR INDUSTRY MARKET ANALYSIS BY END USER
    401. REST OF SOUTH AMERICA ENTERPRISE MOBILITY IN ENERGY SECTOR INDUSTRY MARKET ANALYSIS
    402. BY DEVICE TYPE
    403. SECTOR INDUSTRY MARKET ANALYSIS BY REGIONAL
    404. IN ENERGY SECTOR INDUSTRY MARKET ANALYSIS
    405. MOBILITY IN ENERGY SECTOR INDUSTRY MARKET ANALYSIS BY APPLICATION
    406. GCC COUNTRIES ENTERPRISE MOBILITY IN ENERGY SECTOR INDUSTRY MARKET ANALYSIS BY DEPLOYMENT
    407. TYPE
    408. MARKET ANALYSIS BY END USER
    409. IN ENERGY SECTOR INDUSTRY MARKET ANALYSIS BY DEVICE TYPE
    410. ENTERPRISE MOBILITY IN ENERGY SECTOR INDUSTRY MARKET ANALYSIS BY REGIONAL
    411. SOUTH AFRICA ENTERPRISE MOBILITY IN ENERGY SECTOR INDUSTRY MARKET ANALYSIS
    412. BY APPLICATION
    413. INDUSTRY MARKET ANALYSIS BY DEPLOYMENT TYPE
    414. MOBILITY IN ENERGY SECTOR INDUSTRY MARKET ANALYSIS BY END USER
    415. SOUTH AFRICA ENTERPRISE MOBILITY IN ENERGY SECTOR INDUSTRY MARKET ANALYSIS BY DEVICE
    416. TYPE
    417. MARKET ANALYSIS BY REGIONAL
    418. ENERGY SECTOR INDUSTRY MARKET ANALYSIS BY APPLICATION
    419. MEA ENTERPRISE MOBILITY IN ENERGY SECTOR INDUSTRY MARKET ANALYSIS BY DEPLOYMENT
    420. TYPE
    421. MARKET ANALYSIS BY END USER
    422. ENERGY SECTOR INDUSTRY MARKET ANALYSIS BY DEVICE TYPE
    423. MEA ENTERPRISE MOBILITY IN ENERGY SECTOR INDUSTRY MARKET ANALYSIS BY REGIONAL
    424. MARKET
    425. OF ENTERPRISE MOBILITY IN ENERGY SECTOR INDUSTRY MARKET
    426. IMPACT ANALYSIS: ENTERPRISE MOBILITY IN ENERGY SECTOR INDUSTRY MARKET
    427. RESTRAINTS IMPACT ANALYSIS: ENTERPRISE MOBILITY IN ENERGY SECTOR INDUSTRY MARKET
    428. MARKET
    429. APPLICATION, 2024 (% SHARE)
    430. INDUSTRY MARKET, BY APPLICATION, 2019 TO 2032 (USD Billions)
    431. MOBILITY IN ENERGY SECTOR INDUSTRY MARKET, BY DEPLOYMENT TYPE, 2024 (% SHARE)
    432. TYPE, 2019 TO 2032 (USD Billions)
    433. SECTOR INDUSTRY MARKET, BY END USER, 2024 (% SHARE)
    434. MOBILITY IN ENERGY SECTOR INDUSTRY MARKET, BY END USER, 2019 TO 2032 (USD Billions)
    435. TYPE, 2024 (% SHARE)
    436. MARKET, BY DEVICE TYPE, 2019 TO 2032 (USD Billions)
    437. MOBILITY IN ENERGY SECTOR INDUSTRY MARKET, BY REGIONAL, 2024 (% SHARE)
    438. ENTERPRISE MOBILITY IN ENERGY SECTOR INDUSTRY MARKET, BY REGIONAL, 2019 TO
    439. (USD Billions)

    Enterprise Mobility in Energy Sector Industry Market Segmentation


    • Enterprise Mobility in Energy Sector Industry Market By Application (USD Billion, 2019-2032)

      • Field Services Management
      • Asset Management
      • Workforce Management
      • Supply Chain Management

    • Enterprise Mobility in Energy Sector Industry Market By Deployment Type (USD Billion, 2019-2032)

      • Cloud-Based
      • On-Premise

    • Enterprise Mobility in Energy Sector Industry Market By End User (USD Billion, 2019-2032)

      • Utilities
      • Oil and Gas
      • Renewable Energy

    • Enterprise Mobility in Energy Sector Industry Market By Device Type (USD Billion, 2019-2032)

      • Smartphones
      • Tablets
      • Laptops
      • Wearable Devices

    • Enterprise Mobility in Energy Sector Industry Market By Regional (USD Billion, 2019-2032)

      • North America
      • Europe
      • South America
      • Asia Pacific
      • Middle East and Africa

    Enterprise Mobility in Energy Sector Industry Market Regional Outlook (USD Billion, 2019-2032)


    • North America Outlook (USD Billion, 2019-2032)

      • North America Enterprise Mobility in Energy Sector Industry Market by Application Type

        • Field Services Management
        • Asset Management
        • Workforce Management
        • Supply Chain Management
      • North America Enterprise Mobility in Energy Sector Industry Market by Deployment Type

        • Cloud-Based
        • On-Premise
      • North America Enterprise Mobility in Energy Sector Industry Market by End User Type

        • Utilities
        • Oil and Gas
        • Renewable Energy
      • North America Enterprise Mobility in Energy Sector Industry Market by Device Type

        • Smartphones
        • Tablets
        • Laptops
        • Wearable Devices
      • North America Enterprise Mobility in Energy Sector Industry Market by Regional Type

        • US
        • Canada
      • US Outlook (USD Billion, 2019-2032)
      • US Enterprise Mobility in Energy Sector Industry Market by Application Type

        • Field Services Management
        • Asset Management
        • Workforce Management
        • Supply Chain Management
      • US Enterprise Mobility in Energy Sector Industry Market by Deployment Type

        • Cloud-Based
        • On-Premise
      • US Enterprise Mobility in Energy Sector Industry Market by End User Type

        • Utilities
        • Oil and Gas
        • Renewable Energy
      • US Enterprise Mobility in Energy Sector Industry Market by Device Type

        • Smartphones
        • Tablets
        • Laptops
        • Wearable Devices
      • CANADA Outlook (USD Billion, 2019-2032)
      • CANADA Enterprise Mobility in Energy Sector Industry Market by Application Type

        • Field Services Management
        • Asset Management
        • Workforce Management
        • Supply Chain Management
      • CANADA Enterprise Mobility in Energy Sector Industry Market by Deployment Type

        • Cloud-Based
        • On-Premise
      • CANADA Enterprise Mobility in Energy Sector Industry Market by End User Type

        • Utilities
        • Oil and Gas
        • Renewable Energy
      • CANADA Enterprise Mobility in Energy Sector Industry Market by Device Type

        • Smartphones
        • Tablets
        • Laptops
        • Wearable Devices
    • Europe Outlook (USD Billion, 2019-2032)

      • Europe Enterprise Mobility in Energy Sector Industry Market by Application Type

        • Field Services Management
        • Asset Management
        • Workforce Management
        • Supply Chain Management
      • Europe Enterprise Mobility in Energy Sector Industry Market by Deployment Type

        • Cloud-Based
        • On-Premise
      • Europe Enterprise Mobility in Energy Sector Industry Market by End User Type

        • Utilities
        • Oil and Gas
        • Renewable Energy
      • Europe Enterprise Mobility in Energy Sector Industry Market by Device Type

        • Smartphones
        • Tablets
        • Laptops
        • Wearable Devices
      • Europe Enterprise Mobility in Energy Sector Industry Market by Regional Type

        • Germany
        • UK
        • France
        • Russia
        • Italy
        • Spain
        • Rest of Europe
      • GERMANY Outlook (USD Billion, 2019-2032)
      • GERMANY Enterprise Mobility in Energy Sector Industry Market by Application Type

        • Field Services Management
        • Asset Management
        • Workforce Management
        • Supply Chain Management
      • GERMANY Enterprise Mobility in Energy Sector Industry Market by Deployment Type

        • Cloud-Based
        • On-Premise
      • GERMANY Enterprise Mobility in Energy Sector Industry Market by End User Type

        • Utilities
        • Oil and Gas
        • Renewable Energy
      • GERMANY Enterprise Mobility in Energy Sector Industry Market by Device Type

        • Smartphones
        • Tablets
        • Laptops
        • Wearable Devices
      • UK Outlook (USD Billion, 2019-2032)
      • UK Enterprise Mobility in Energy Sector Industry Market by Application Type

        • Field Services Management
        • Asset Management
        • Workforce Management
        • Supply Chain Management
      • UK Enterprise Mobility in Energy Sector Industry Market by Deployment Type

        • Cloud-Based
        • On-Premise
      • UK Enterprise Mobility in Energy Sector Industry Market by End User Type

        • Utilities
        • Oil and Gas
        • Renewable Energy
      • UK Enterprise Mobility in Energy Sector Industry Market by Device Type

        • Smartphones
        • Tablets
        • Laptops
        • Wearable Devices
      • FRANCE Outlook (USD Billion, 2019-2032)
      • FRANCE Enterprise Mobility in Energy Sector Industry Market by Application Type

        • Field Services Management
        • Asset Management
        • Workforce Management
        • Supply Chain Management
      • FRANCE Enterprise Mobility in Energy Sector Industry Market by Deployment Type

        • Cloud-Based
        • On-Premise
      • FRANCE Enterprise Mobility in Energy Sector Industry Market by End User Type

        • Utilities
        • Oil and Gas
        • Renewable Energy
      • FRANCE Enterprise Mobility in Energy Sector Industry Market by Device Type

        • Smartphones
        • Tablets
        • Laptops
        • Wearable Devices
      • RUSSIA Outlook (USD Billion, 2019-2032)
      • RUSSIA Enterprise Mobility in Energy Sector Industry Market by Application Type

        • Field Services Management
        • Asset Management
        • Workforce Management
        • Supply Chain Management
      • RUSSIA Enterprise Mobility in Energy Sector Industry Market by Deployment Type

        • Cloud-Based
        • On-Premise
      • RUSSIA Enterprise Mobility in Energy Sector Industry Market by End User Type

        • Utilities
        • Oil and Gas
        • Renewable Energy
      • RUSSIA Enterprise Mobility in Energy Sector Industry Market by Device Type

        • Smartphones
        • Tablets
        • Laptops
        • Wearable Devices
      • ITALY Outlook (USD Billion, 2019-2032)
      • ITALY Enterprise Mobility in Energy Sector Industry Market by Application Type

        • Field Services Management
        • Asset Management
        • Workforce Management
        • Supply Chain Management
      • ITALY Enterprise Mobility in Energy Sector Industry Market by Deployment Type

        • Cloud-Based
        • On-Premise
      • ITALY Enterprise Mobility in Energy Sector Industry Market by End User Type

        • Utilities
        • Oil and Gas
        • Renewable Energy
      • ITALY Enterprise Mobility in Energy Sector Industry Market by Device Type

        • Smartphones
        • Tablets
        • Laptops
        • Wearable Devices
      • SPAIN Outlook (USD Billion, 2019-2032)
      • SPAIN Enterprise Mobility in Energy Sector Industry Market by Application Type

        • Field Services Management
        • Asset Management
        • Workforce Management
        • Supply Chain Management
      • SPAIN Enterprise Mobility in Energy Sector Industry Market by Deployment Type

        • Cloud-Based
        • On-Premise
      • SPAIN Enterprise Mobility in Energy Sector Industry Market by End User Type

        • Utilities
        • Oil and Gas
        • Renewable Energy
      • SPAIN Enterprise Mobility in Energy Sector Industry Market by Device Type

        • Smartphones
        • Tablets
        • Laptops
        • Wearable Devices
      • REST OF EUROPE Outlook (USD Billion, 2019-2032)
      • REST OF EUROPE Enterprise Mobility in Energy Sector Industry Market by Application Type

        • Field Services Management
        • Asset Management
        • Workforce Management
        • Supply Chain Management
      • REST OF EUROPE Enterprise Mobility in Energy Sector Industry Market by Deployment Type

        • Cloud-Based
        • On-Premise
      • REST OF EUROPE Enterprise Mobility in Energy Sector Industry Market by End User Type

        • Utilities
        • Oil and Gas
        • Renewable Energy
      • REST OF EUROPE Enterprise Mobility in Energy Sector Industry Market by Device Type

        • Smartphones
        • Tablets
        • Laptops
        • Wearable Devices
    • APAC Outlook (USD Billion, 2019-2032)

      • APAC Enterprise Mobility in Energy Sector Industry Market by Application Type

        • Field Services Management
        • Asset Management
        • Workforce Management
        • Supply Chain Management
      • APAC Enterprise Mobility in Energy Sector Industry Market by Deployment Type

        • Cloud-Based
        • On-Premise
      • APAC Enterprise Mobility in Energy Sector Industry Market by End User Type

        • Utilities
        • Oil and Gas
        • Renewable Energy
      • APAC Enterprise Mobility in Energy Sector Industry Market by Device Type

        • Smartphones
        • Tablets
        • Laptops
        • Wearable Devices
      • APAC Enterprise Mobility in Energy Sector Industry Market by Regional Type

        • China
        • India
        • Japan
        • South Korea
        • Malaysia
        • Thailand
        • Indonesia
        • Rest of APAC
      • CHINA Outlook (USD Billion, 2019-2032)
      • CHINA Enterprise Mobility in Energy Sector Industry Market by Application Type

        • Field Services Management
        • Asset Management
        • Workforce Management
        • Supply Chain Management
      • CHINA Enterprise Mobility in Energy Sector Industry Market by Deployment Type

        • Cloud-Based
        • On-Premise
      • CHINA Enterprise Mobility in Energy Sector Industry Market by End User Type

        • Utilities
        • Oil and Gas
        • Renewable Energy
      • CHINA Enterprise Mobility in Energy Sector Industry Market by Device Type

        • Smartphones
        • Tablets
        • Laptops
        • Wearable Devices
      • INDIA Outlook (USD Billion, 2019-2032)
      • INDIA Enterprise Mobility in Energy Sector Industry Market by Application Type

        • Field Services Management
        • Asset Management
        • Workforce Management
        • Supply Chain Management
      • INDIA Enterprise Mobility in Energy Sector Industry Market by Deployment Type

        • Cloud-Based
        • On-Premise
      • INDIA Enterprise Mobility in Energy Sector Industry Market by End User Type

        • Utilities
        • Oil and Gas
        • Renewable Energy
      • INDIA Enterprise Mobility in Energy Sector Industry Market by Device Type

        • Smartphones
        • Tablets
        • Laptops
        • Wearable Devices
      • JAPAN Outlook (USD Billion, 2019-2032)
      • JAPAN Enterprise Mobility in Energy Sector Industry Market by Application Type

        • Field Services Management
        • Asset Management
        • Workforce Management
        • Supply Chain Management
      • JAPAN Enterprise Mobility in Energy Sector Industry Market by Deployment Type

        • Cloud-Based
        • On-Premise
      • JAPAN Enterprise Mobility in Energy Sector Industry Market by End User Type

        • Utilities
        • Oil and Gas
        • Renewable Energy
      • JAPAN Enterprise Mobility in Energy Sector Industry Market by Device Type

        • Smartphones
        • Tablets
        • Laptops
        • Wearable Devices
      • SOUTH KOREA Outlook (USD Billion, 2019-2032)
      • SOUTH KOREA Enterprise Mobility in Energy Sector Industry Market by Application Type

        • Field Services Management
        • Asset Management
        • Workforce Management
        • Supply Chain Management
      • SOUTH KOREA Enterprise Mobility in Energy Sector Industry Market by Deployment Type

        • Cloud-Based
        • On-Premise
      • SOUTH KOREA Enterprise Mobility in Energy Sector Industry Market by End User Type

        • Utilities
        • Oil and Gas
        • Renewable Energy
      • SOUTH KOREA Enterprise Mobility in Energy Sector Industry Market by Device Type

        • Smartphones
        • Tablets
        • Laptops
        • Wearable Devices
      • MALAYSIA Outlook (USD Billion, 2019-2032)
      • MALAYSIA Enterprise Mobility in Energy Sector Industry Market by Application Type

        • Field Services Management
        • Asset Management
        • Workforce Management
        • Supply Chain Management
      • MALAYSIA Enterprise Mobility in Energy Sector Industry Market by Deployment Type

        • Cloud-Based
        • On-Premise
      • MALAYSIA Enterprise Mobility in Energy Sector Industry Market by End User Type

        • Utilities
        • Oil and Gas
        • Renewable Energy
      • MALAYSIA Enterprise Mobility in Energy Sector Industry Market by Device Type

        • Smartphones
        • Tablets
        • Laptops
        • Wearable Devices
      • THAILAND Outlook (USD Billion, 2019-2032)
      • THAILAND Enterprise Mobility in Energy Sector Industry Market by Application Type

        • Field Services Management
        • Asset Management
        • Workforce Management
        • Supply Chain Management
      • THAILAND Enterprise Mobility in Energy Sector Industry Market by Deployment Type

        • Cloud-Based
        • On-Premise
      • THAILAND Enterprise Mobility in Energy Sector Industry Market by End User Type

        • Utilities
        • Oil and Gas
        • Renewable Energy
      • THAILAND Enterprise Mobility in Energy Sector Industry Market by Device Type

        • Smartphones
        • Tablets
        • Laptops
        • Wearable Devices
      • INDONESIA Outlook (USD Billion, 2019-2032)
      • INDONESIA Enterprise Mobility in Energy Sector Industry Market by Application Type

        • Field Services Management
        • Asset Management
        • Workforce Management
        • Supply Chain Management
      • INDONESIA Enterprise Mobility in Energy Sector Industry Market by Deployment Type

        • Cloud-Based
        • On-Premise
      • INDONESIA Enterprise Mobility in Energy Sector Industry Market by End User Type

        • Utilities
        • Oil and Gas
        • Renewable Energy
      • INDONESIA Enterprise Mobility in Energy Sector Industry Market by Device Type

        • Smartphones
        • Tablets
        • Laptops
        • Wearable Devices
      • REST OF APAC Outlook (USD Billion, 2019-2032)
      • REST OF APAC Enterprise Mobility in Energy Sector Industry Market by Application Type

        • Field Services Management
        • Asset Management
        • Workforce Management
        • Supply Chain Management
      • REST OF APAC Enterprise Mobility in Energy Sector Industry Market by Deployment Type

        • Cloud-Based
        • On-Premise
      • REST OF APAC Enterprise Mobility in Energy Sector Industry Market by End User Type

        • Utilities
        • Oil and Gas
        • Renewable Energy
      • REST OF APAC Enterprise Mobility in Energy Sector Industry Market by Device Type

        • Smartphones
        • Tablets
        • Laptops
        • Wearable Devices
    • South America Outlook (USD Billion, 2019-2032)

      • South America Enterprise Mobility in Energy Sector Industry Market by Application Type

        • Field Services Management
        • Asset Management
        • Workforce Management
        • Supply Chain Management
      • South America Enterprise Mobility in Energy Sector Industry Market by Deployment Type

        • Cloud-Based
        • On-Premise
      • South America Enterprise Mobility in Energy Sector Industry Market by End User Type

        • Utilities
        • Oil and Gas
        • Renewable Energy
      • South America Enterprise Mobility in Energy Sector Industry Market by Device Type

        • Smartphones
        • Tablets
        • Laptops
        • Wearable Devices
      • South America Enterprise Mobility in Energy Sector Industry Market by Regional Type

        • Brazil
        • Mexico
        • Argentina
        • Rest of South America
      • BRAZIL Outlook (USD Billion, 2019-2032)
      • BRAZIL Enterprise Mobility in Energy Sector Industry Market by Application Type

        • Field Services Management
        • Asset Management
        • Workforce Management
        • Supply Chain Management
      • BRAZIL Enterprise Mobility in Energy Sector Industry Market by Deployment Type

        • Cloud-Based
        • On-Premise
      • BRAZIL Enterprise Mobility in Energy Sector Industry Market by End User Type

        • Utilities
        • Oil and Gas
        • Renewable Energy
      • BRAZIL Enterprise Mobility in Energy Sector Industry Market by Device Type

        • Smartphones
        • Tablets
        • Laptops
        • Wearable Devices
      • MEXICO Outlook (USD Billion, 2019-2032)
      • MEXICO Enterprise Mobility in Energy Sector Industry Market by Application Type

        • Field Services Management
        • Asset Management
        • Workforce Management
        • Supply Chain Management
      • MEXICO Enterprise Mobility in Energy Sector Industry Market by Deployment Type

        • Cloud-Based
        • On-Premise
      • MEXICO Enterprise Mobility in Energy Sector Industry Market by End User Type

        • Utilities
        • Oil and Gas
        • Renewable Energy
      • MEXICO Enterprise Mobility in Energy Sector Industry Market by Device Type

        • Smartphones
        • Tablets
        • Laptops
        • Wearable Devices
      • ARGENTINA Outlook (USD Billion, 2019-2032)
      • ARGENTINA Enterprise Mobility in Energy Sector Industry Market by Application Type

        • Field Services Management
        • Asset Management
        • Workforce Management
        • Supply Chain Management
      • ARGENTINA Enterprise Mobility in Energy Sector Industry Market by Deployment Type

        • Cloud-Based
        • On-Premise
      • ARGENTINA Enterprise Mobility in Energy Sector Industry Market by End User Type

        • Utilities
        • Oil and Gas
        • Renewable Energy
      • ARGENTINA Enterprise Mobility in Energy Sector Industry Market by Device Type

        • Smartphones
        • Tablets
        • Laptops
        • Wearable Devices
      • REST OF SOUTH AMERICA Outlook (USD Billion, 2019-2032)
      • REST OF SOUTH AMERICA Enterprise Mobility in Energy Sector Industry Market by Application Type

        • Field Services Management
        • Asset Management
        • Workforce Management
        • Supply Chain Management
      • REST OF SOUTH AMERICA Enterprise Mobility in Energy Sector Industry Market by Deployment Type

        • Cloud-Based
        • On-Premise
      • REST OF SOUTH AMERICA Enterprise Mobility in Energy Sector Industry Market by End User Type

        • Utilities
        • Oil and Gas
        • Renewable Energy
      • REST OF SOUTH AMERICA Enterprise Mobility in Energy Sector Industry Market by Device Type

        • Smartphones
        • Tablets
        • Laptops
        • Wearable Devices
    • MEA Outlook (USD Billion, 2019-2032)

      • MEA Enterprise Mobility in Energy Sector Industry Market by Application Type

        • Field Services Management
        • Asset Management
        • Workforce Management
        • Supply Chain Management
      • MEA Enterprise Mobility in Energy Sector Industry Market by Deployment Type

        • Cloud-Based
        • On-Premise
      • MEA Enterprise Mobility in Energy Sector Industry Market by End User Type

        • Utilities
        • Oil and Gas
        • Renewable Energy
      • MEA Enterprise Mobility in Energy Sector Industry Market by Device Type

        • Smartphones
        • Tablets
        • Laptops
        • Wearable Devices
      • MEA Enterprise Mobility in Energy Sector Industry Market by Regional Type

        • GCC Countries
        • South Africa
        • Rest of MEA
      • GCC COUNTRIES Outlook (USD Billion, 2019-2032)
      • GCC COUNTRIES Enterprise Mobility in Energy Sector Industry Market by Application Type

        • Field Services Management
        • Asset Management
        • Workforce Management
        • Supply Chain Management
      • GCC COUNTRIES Enterprise Mobility in Energy Sector Industry Market by Deployment Type

        • Cloud-Based
        • On-Premise
      • GCC COUNTRIES Enterprise Mobility in Energy Sector Industry Market by End User Type

        • Utilities
        • Oil and Gas
        • Renewable Energy
      • GCC COUNTRIES Enterprise Mobility in Energy Sector Industry Market by Device Type

        • Smartphones
        • Tablets
        • Laptops
        • Wearable Devices
      • SOUTH AFRICA Outlook (USD Billion, 2019-2032)
      • SOUTH AFRICA Enterprise Mobility in Energy Sector Industry Market by Application Type

        • Field Services Management
        • Asset Management
        • Workforce Management
        • Supply Chain Management
      • SOUTH AFRICA Enterprise Mobility in Energy Sector Industry Market by Deployment Type

        • Cloud-Based
        • On-Premise
      • SOUTH AFRICA Enterprise Mobility in Energy Sector Industry Market by End User Type

        • Utilities
        • Oil and Gas
        • Renewable Energy
      • SOUTH AFRICA Enterprise Mobility in Energy Sector Industry Market by Device Type

        • Smartphones
        • Tablets
        • Laptops
        • Wearable Devices
      • REST OF MEA Outlook (USD Billion, 2019-2032)
      • REST OF MEA Enterprise Mobility in Energy Sector Industry Market by Application Type

        • Field Services Management
        • Asset Management
        • Workforce Management
        • Supply Chain Management
      • REST OF MEA Enterprise Mobility in Energy Sector Industry Market by Deployment Type

        • Cloud-Based
        • On-Premise
      • REST OF MEA Enterprise Mobility in Energy Sector Industry Market by End User Type

        • Utilities
        • Oil and Gas
        • Renewable Energy
      • REST OF MEA Enterprise Mobility in Energy Sector Industry Market by Device Type

        • Smartphones
        • Tablets
        • Laptops
        • Wearable Devices
    Report Infographic
    Free Sample Request

    Kindly complete the form below to receive a free sample of this Report

    Customer Strories

    “I am very pleased with how market segments have been defined in a relevant way for my purposes (such as "Portable Freezers & refrigerators" and "last-mile"). In general the report is well structured. Thanks very much for your efforts.”

    Victoria Milne Founder
    Case Study

    Chemicals and Materials