• Cat-intel
  • MedIntelliX
  • Resources
  • About Us
  • Request Free Sample ×

    Kindly complete the form below to receive a free sample of this Report

    Leading companies partner with us for data-driven Insights

    clients tt-cursor

    Elemental Boron Market

    ID: MRFR/CnM/37352-HCR
    111 Pages
    Chitranshi Jaiswal
    September 2025

    Elemental Boron Market Research Report: By Application (Glass and Ceramics, Fertilizers, Metallurgy, Nuclear Energy, Personal Care Products), By End Use (Agriculture, Automotive, Electronics, Construction, Healthcare), By Form (Powder, Granule, Liquid, Paste), By Purity Level (Low Purity Boron, Medium Purity Boron, High Purity Boron) and By Regional (North America, Europe, South America, Asia Asia-Pacific, Middle East and Africa) - Forecast to 2034.

    Share:
    Download PDF ×

    We do not share your information with anyone. However, we may send you emails based on your report interest from time to time. You may contact us at any time to opt-out.

    Elemental Boron Market Research Report - Global Forecast by 2034 Infographic
    Purchase Options
    $ 4,950.0
    $ 5,950.0
    $ 7,250.0
    Table of Contents

    Elemental Boron Market Summary

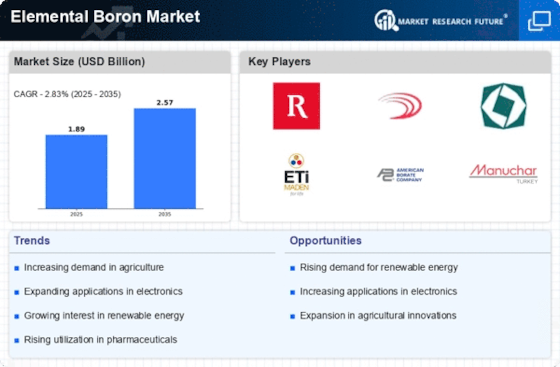
    The Global Elemental Boron Market is projected to grow from 1.89 USD Billion in 2024 to 2.57 USD Billion by 2035, reflecting a steady growth trajectory.

    Key Market Trends & Highlights

    Elemental Boron Key Trends and Highlights

    • The market is expected to reach a valuation of 2.57 USD Billion by 2035.
    • From 2025 to 2035, the market is anticipated to grow at a CAGR of 2.83 percent.
    • In 2024, the market is valued at 1.89 USD Billion, indicating a solid foundation for future growth.
    • Growing adoption of advanced materials due to increasing demand for high-performance applications is a major market driver.

    Market Size & Forecast

    2024 Market Size 1.89 (USD Billion)
    2035 Market Size 2.57 (USD Billion)
    CAGR (2025-2035) 2.83%

    Major Players

    Southern Ionics, Borax Argentina, Borax Europe, United Borax, Gujarat State Fertilizers and Chemicals, Minera BACOICL Group, Eti Maden, Dajin Resources, American Borate Company, Karnalyte Resources, Green Garden Products, Searles Valley Minerals, Rio Tinto, Duda Energy

    Elemental Boron Market Trends

    The Elemental Boron Market shows the presence of several key factors that are responsible for its growth. The most important reason is that there is an increase in the demand for boron for use in agriculture, more specifically as a micronutrient for crops. With the growth in the population, the focus now is to increase agricultural production which results in the increased use of boron in agricultural practices.

    Boron has great potential in aiding the manufacturing of glass and ceramics, detergents and pharmaceuticals, thereby driving up the demand for boron compounds.In the thick of these drivers, however, the scope for in-market participants to venture into the research and development of boron products comes into light. Boron has a potential application in the renewable energy technologies industry as there's engineered interest in material science for solar panels and batteries. Also, the use of boron in the electric vehicle industry for lightweight materials presents another avenue for growth.

    As the population grows, the need for higher agricultural output becomes vital, leading to increased adoption of boron in farming practices. Additionally, the rising demand for boron compounds in various industries such as glass and ceramics, detergents, and pharmaceuticals further fuels market expansion. Environmental concerns also contribute as boron is recognized for its role in sustainable agricultural practices.Amid these drivers, opportunities exist for market participants to explore the innovation and development of boron-based products. There is a growing interest in using boron in renewable energy technologies, specifically in the production of advanced materials for solar panels and batteries.

    As these trends continue to evolve, they will likely define the competitive landscape of the Elemental Boron Market in the years to come.

    The Global Elemental Boron Market appears poised for growth, driven by increasing demand in sectors such as agriculture and electronics, which suggests a robust trajectory for future applications.

    U.S. Geological Survey

    Elemental Boron Market Drivers

    Market Growth Projections

    The Global Elemental Boron Market Industry is projected to experience steady growth, with estimates indicating a market value of 1.89 USD Billion in 2024 and a potential increase to 2.57 USD Billion by 2035. This growth trajectory suggests a compound annual growth rate of 2.83% from 2025 to 2035. Various factors contribute to this growth, including the rising demand in agriculture, advancements in glass and ceramics, and increasing applications in electronics and nuclear sectors. These projections underscore the evolving landscape of the Global Elemental Boron Market Industry and its potential for expansion in the coming years.

    Rising Demand in Electronics

    The Global Elemental Boron Market Industry is influenced by the rising demand for boron in the electronics sector. Boron is utilized in semiconductor manufacturing and as a dopant in various electronic components, enhancing their performance and efficiency. With the proliferation of electronic devices and the push for advanced technologies, the need for boron is expected to increase. This growing demand is likely to support the market's expansion, aligning with the projected growth trajectory towards 2.57 USD Billion by 2035. The electronics industry's reliance on boron highlights its significance within the Global Elemental Boron Market Industry.

    Growing Demand in Agriculture

    The Global Elemental Boron Market Industry experiences a notable surge in demand due to its essential role in agriculture. Boron is a critical micronutrient that enhances plant growth, improves crop yield, and increases resistance to diseases. As global populations rise, the need for efficient agricultural practices intensifies. In 2024, the market is projected to reach 1.89 USD Billion, driven by the increasing adoption of boron-based fertilizers. Countries like the United States and Brazil are leading in boron utilization, indicating a robust growth trajectory for the Global Elemental Boron Market Industry in the agricultural sector.

    Advancements in Glass and Ceramics

    The Global Elemental Boron Market Industry benefits significantly from advancements in the glass and ceramics sector. Boron compounds are integral in producing high-strength glass and ceramics, which are increasingly utilized in various applications, including electronics and automotive industries. The demand for boron in these sectors is expected to grow as manufacturers seek to enhance product durability and performance. This trend is likely to contribute to the market's expansion, with projections indicating a growth to 2.57 USD Billion by 2035. The integration of boron in innovative materials suggests a promising future for the Global Elemental Boron Market Industry.

    Increasing Use in Nuclear Applications

    The Global Elemental Boron Market Industry is poised for growth due to the increasing use of boron in nuclear applications. Boron is utilized as a neutron absorber in nuclear reactors, enhancing safety and efficiency. As nations focus on sustainable energy solutions, the demand for nuclear power is likely to rise, subsequently increasing the need for boron. This trend may lead to a compound annual growth rate of 2.83% from 2025 to 2035, reflecting the strategic importance of boron in energy production. The integration of boron in nuclear technology underscores its critical role in the Global Elemental Boron Market Industry.

    Market Dynamics and Regulatory Framework

    The Global Elemental Boron Market Industry is shaped by various market dynamics and regulatory frameworks. Governments worldwide are implementing regulations to ensure the safe use of boron in industrial applications, which could influence market growth. Compliance with environmental standards and safety regulations may drive innovation and the development of new boron applications. As industries adapt to these regulations, the market may experience shifts in demand patterns. Understanding these dynamics is crucial for stakeholders in the Global Elemental Boron Market Industry, as they navigate the complexities of regulatory compliance and market opportunities.

    Market Segment Insights

    Elemental Boron Market Segment Insights

    Elemental Boron Market Segment Insights

    Elemental Boron Market Application Insights

    Elemental Boron Market Application Insights

    The Elemental Boron Market, particularly concerning its Application segment, showcases a diverse range of uses across various industries. In 2023, this segment is was contributing to a market valuation of approximately 1.79 USD Billion. Within this broad Application segment, the Glass and Ceramics application stands out with a valuation of around 0.65 USD Billion in 2023, and it is projected to grow to 0.85 USD Billion by 2032.

    This represents a significant portion of the overall market, indicating its importance, as boron is crucial in enhancing the strength and thermal shock resistance of glass products.Following closely, the Fertilizers fertilizer application accounts for 0.45 USD Billion in 2023, anticipated to rise to 0.60 USD Billion by 2032. The significance of this segment lies in boron's role as a micronutrient essential for plant growth, thereby sustaining its demand in agricultural practices.

    The Metallurgy segment, contributing 0.35 USD Billion in 2023 and rising to 0.50 USD Billion by 2032, showcases boron’s boron's essential role in improving material properties, particularly in steel and other alloys, making this segment significant in manufacturing sectors.Meanwhile, the Nuclear Energy segment, though smaller in scale, was at 0.15 USD Billion in 2023. is set to, expected to reach 0.20 USD Billion by 2032, uses boron for neutron absorption, indicating its critical importance for safety in nuclear reactors.

    Lastly, the Personal Care Products segment starts at 0.19 USD Billion in 2023 and is expected to grow to 0.25 USD Billion by 2032. Boron’s Boron's incorporation into this segment enhances product qualities, emphasizing its versatility.

    Elemental Boron Market End End-Use Insights

    Elemental Boron Market End End-Use Insights

    The Elemental Boron Market is projected to achieve significant revenue growth across various end-use applications, valued at 1.79 USD Billion in 2023, with expectations to grow as diverse industries recognize its benefits. The market shows strong segmentation in multiple sectors, notably Agriculture, Automotive, Electronics, Construction, and Healthcare. In the Agriculture sector, elemental boron plays a crucial role in crop production and soil health, enhancing nutrient uptake and yield, which is essential for food security.

    The Automotive industry utilizes boron for manufacturing components that improve safety and performance, exemplifying its significance in modern vehicle designs.The Electronics sector increasingly depends on boron for the production of high-performance semiconductors and glass materials, reflecting the demand for innovation in technology. In Construction, boron is valued for its properties that enhance durability and resistance, making it a favorable choice for environmentally conscious building materials. The Healthcare segment benefits from boron's antimicrobial properties, leading to its use in various medical applications.

    This diverse end-use landscape contributes to the market's robust dynamics, driven by growth factors like increasing demand for sustainable materials and technological advancements in multiple fields, thereby presenting a wealth of opportunities within the Elemental Boron Market.

    Elemental Boron Market Form Insights

    Elemental Boron Market Form Insights

    The Elemental Boron Market, with a projected valuation of 1.79 USD Billion in 2023, has shown stable growth, with various forms being essential in different applications. The market segmentation reveals that forms such as Powder, Granule, Liquid, and Paste play significant roles across industries ranging from agriculture to glass manufacturing. The Powder form is particularly important due to its high purity and versatility in applications, while Granules are often favored for ease of handling and application.

    Liquid forms provide a convenient solution for precise applications and are gaining traction in specialized sectors.Paste forms are significant for specific use cases where controlled application is necessary. As the market evolves, trends such as increasing demand for fertilizers and innovations in material science are driving growth, although challenges like regulatory restrictions regarding boron materials remain. The Elemental Boron Market statistics indicate that companies are focusing on sustainability and improved boron applications, pointing towards considerable opportunities for future expansion within this diverse market.

    Market growth is expected to be influenced by continuous advancements in the industry, steering innovations and applications in various sectors while catering to the increasing demand for environmentally friendly products.

    Elemental Boron Market Purity Level Insights

    Elemental Boron Market Purity Level Insights

    The Elemental Boron Market has showcased a notable evolution in the Purity Level segment, encapsulating various categories that cater to diverse industrial needs and applications. In 2023, the market was valued at 1.79 USD Billion, reflecting a steady growth trajectory driven by increasing demand across sectors such as agriculture, glass, and ceramics. The market encompasses Low- Purity Boron, Medium Purity Boron, and High- Purity Boron, each playing a critical role in different applications.

    Low- Purity Bpurity boron, with its cost-effectiveness, finds extensive use in less demanding applications, thereby holding a significant share within of the market.Medium- Purity Bpurity boron caters to sectors that require moderate-quality boron, enhancing its relevance in specific industries. In contrast, High Purity Bhigh-purity boron is essential for advanced applications, particularly in electronics and pharmaceuticals, contributing to its dominance in the industry. Notably, the emphasis on sustainability and innovation is propelling market growth while presenting challenges related to sourcing and production processes.

    As the Elemental Boron Market data suggests, the segmentation by Purity Level is crucial in understanding the overall market dynamics and trends, thus driving strategic decisions and investments in the sector.

    Get more detailed insights about Elemental Boron Market Research Report - Global Forecast by 2034

    Regional Insights

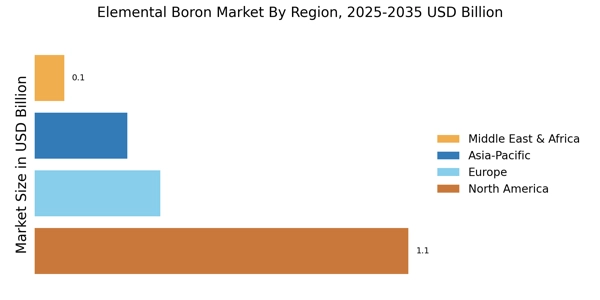
    The Elemental Boron Market revenue reached 1.79 USD Billion in 2023, reflecting diverse regional dynamics. North America holds a majority market share with a valuation of 0.55 USD Billion, projected to grow to 0.7 USD Billion by 2032, primarily driven by technological advancements and an expanding demand in agriculture and manufacturing industries. Europe follows with a significant valuation of 0.4 USD Billion in 2023, expected to rise to 0.5 USD Billion, influenced by increasing applications in glass and ceramic products.

    The APAC region, valued at 0.6 USD Billion, is on a growth trajectory, anticipating a rise to 0.85 USD Billion due to rapid industrialization and urbanization.South America and MEA are smaller players, with South America valued at 0.15 USD Billion and MEA at 0.09 USD Billion in 2023, b. Both are expected to see gradual growth, reflecting emerging opportunities in mining and agriculture. The market growth across these regions is supported by rising awareness of boron's benefits, although challenges such as supply chain disruptions and environmental regulations may impact overall performance.

    The Elemental Boron Market Statistics reveal a vital regional segmentation that highlights varied opportunities and growth potential across different markets.

    Source: Primary Research, Secondary Research, Market Research Future Database and Analyst Review

    Key Players and Competitive Insights

    The Elemental Boron Market has been experiencing significant evolution as demand for boron-based products continues to rise across various industries, including agriculture, ceramics, and glass manufacturing. This market is characterized by a steady increase in production and usage due to the unique properties of boron, such as its role in plant growth and as an essential micronutrient. Competitive dynamics within this market are driven by advancements in production techniques, increasing applications, and a growing shift towards sustainable practices. Key players in this sector focus on innovation, quality assurance, and establishing strategic partnerships to maintain their competitive edge.

    As companies vie for market share, their ability to adapt to technological changes and fluctuations in regulatory landscapes will significantly impact their positioning in the market.Southern Ionics stands out in the Elemental Boron Market due to its robust production capabilities and commitment to high-quality standards. The company has made a name for itself by leveraging advanced extraction and refining techniques that ensure a consistent product offering. With a significant presence in the region, Southern Ionics has developed strong distribution networks, allowing it to cater to diverse customer needs effectively.

    Its strengths lie in its extensive research and development initiatives, which not only enhance product efficacy but also focus on eco-friendly practices, aligning with the growing demand for sustainable solutions in the market. Moreover, the company's strong customer relationships and emphasis on technical support and service enhance its competitive positioning, allowing it to thrive amid rising competition.Borax Argentina holds a prominent position in the Elemental Boron Market, showcasing a rich history and extensive expertise in the sector.

    Known for its high-quality boron products, the company benefits from the strategic location of its production facilities, which enables efficient access to raw materials and rapid distribution operations. The strengths of Borax Argentina include its commitment to product innovation and a solid focus on environmental sustainability, which resonates well with contemporary market trends. The company is continually investing in research initiatives to enhance the properties of its elemental boron offerings while ensuring compliance with international safety and environmental standards.

    With a well-established brand reputation and a dedicated customer base, Borax Argentina remains a key player, adept at navigating the competitive landscape while meeting the evolving needs of the market.

    Key Companies in the Elemental Boron Market market include

    Industry Developments

    • Q2 2024: Canter Resources Announces Discovery of Significant Boron Concentrations at Columbus Project Canter Resources reported the identification of significant boron mineralization at its Columbus Project in Nevada, highlighting the project's potential to become a new domestic source of elemental boron amid rising demand for critical minerals.

    Future Outlook

    Elemental Boron Market Future Outlook

    The Elemental Boron Market is projected to grow at a 2.83% CAGR from 2024 to 2035, driven by demand in agriculture, electronics, and renewable energy sectors.

    New opportunities lie in:

    • Develop advanced boron compounds for agricultural applications to enhance crop yields.
    • Innovate boron-based materials for energy storage solutions in renewable technologies.
    • Expand distribution networks in emerging markets to capture growing industrial demand.

    By 2035, the Elemental Boron Market is expected to achieve robust growth, reflecting evolving industrial needs.

    Market Segmentation

    Elemental Boron Market Form Outlook

    • Powder
    • Granule
    • Liquid
    • Paste

    Elemental Boron Market Regional Outlook

    • North America
    • Europe
    • South America
    • Asia Asia-Pacific
    • Middle East and Africa

    Elemental Boron Market Application Outlook

    • Glass and Ceramics
    • Fertilizers
    • Metallurgy
    • Nuclear Energy
    • Personal Care Products

    Elemental Boron Market End End-Use Outlook

    • Agriculture
    • Automotive
    • Electronics
    • Construction
    • Healthcare

    Elemental Boron Market Purity Level Outlook

    • Low Purity Boron
    • Medium Purity Boron
    • High Purity Boron

    Report Scope

    Report Attribute/Metric Details
    Market Size 2024 1.89 (USD Billion)
    Market Size 2025 1.95 (USD Billion)
    Market Size 2034 2.50 (USD Billion)
    Compound Annual Growth Rate (CAGR) 2.8% (2025 - 2034)
    Report Coverage Revenue Forecast, Competitive Landscape, Growth Factors, and Trends
    Base Year 2024
    Market Forecast Period 2025 - 2034
    Historical Data 2020 - 2024
    Market Forecast Units USD Billion
    Key Companies Profiled Southern Ionics, Borax Argentina, Borax Europe, United Borax, Gujarat State Fertilizers and Chemicals, Minera BACO, ICL Group, Eti Maden, Dajin Resources, American Borate Company, Karnalyte Resources, Green Garden Products, Searles Valley Minerals, Rio Tinto, Duda Energy
    Segments Covered Application, End Use, Form, Purity Level, Regional
    Key Market Opportunities Growing demand from the pharmaceutical industry, Expansion in electronics applications, Rising use in the agriculture sector, Increased focus on renewable energy, Advancements in material science technologies
    Key Market Dynamics Increasing demand in agriculture, Growing applications in the glass industry, Technological advancements in extraction, Government regulations and environmental concerns, Fluctuating raw material prices
    Countries Covered North America, Europe, APAC, South America, MEA

    Market Highlights

    Author
    Chitranshi Jaiswal
    Research Analyst Level I

    In her 3 years of experience in the market research field, she has handled critical cross-domain projects. She has an in-depth knowledge of market estimation & analysis, problem-solving, primary as well as secondary research, and team management.She holds an engineering degree and is an MBA professional from a well-known university, capable of evaluating the market and competitive conditions. An exceptional strategist with excellent communication skills and a passion for delivering cutting-edge & practical insights for the market. Proficient in multi-tasking, and can successfully deal with competing demands, while maintaining complete confidentiality. Generated business through active client and project development, networking, and high-quality responses. Her knowledge and skills have helped in making solid business decisions, securing funding from investors, and avoiding business failures.

    Leave a Comment

    FAQs

    What is the expected market size of the Elemental Boron Market by 2034?

    The Elemental Boron Market is expected to reach 2.50 billion USD by 2034.

    What is the compound annual growth rate (CAGR) for the Elemental Boron Market from 2025 to 2034?

    The expected CAGR for the Elemental Boron Market from 2025 to 2034 is 2.8%.

    Which region is projected to have the highest market value in the Elemental Boron Market by 2034?

    North America is projected to have the highest market value at 0.7 billion USD by 2034.

    What is the market value for the Glass and Ceramics application of Elemental Boron by 2034?

    The market value for the Glass and Ceramics application is expected to be 0.85 billion USD by 2034.

    Who are the key players in the Elemental Boron Market?

    Key players in the Elemental Boron Market include Southern Ionics, Borax Argentina, and ICL Group.

    What is the market value of Elemental Boron for Fertilizers in 2024?

    The market value of Elemental Boron for Fertilizers is 0.45 billion USD in 2024.

    How much is the Elemental Boron Market from the APAC region expected to grow by 2034?

    The APAC region is expected to grow to 0.85 billion USD by 2034.

    What is the expected market value for the Metallurgy application by 2034?

    The expected market value for the Metallurgy application is 0.5 billion USD by 2034.

    What is the forecasted market size for Personal Care Products in 2034?

    The market size for Personal Care Products is forecasted to reach 0.25 billion USD by 2034.

    What was the market value of the MEA region in 2025, and how is it expected to change by 2034?

    The MEA region had a market value of 0.09 billion USD in 2025 and is expected to decrease to 0.05 billion USD by 2034.

    1.     1. EXECUTIVE SUMMARY   
    2.       1.1. Market Overview     
    3.       1.2. Key Findings     
    4.       1.3. Market Segmentation     
    5.       1.4. Competitive Landscape     
    6.       1.5. Challenges and Opportunities     
    7.       1.6. Future Outlook        
    8.     2. MARKET INTRODUCTION   
    9.       2.1. Definition     
    10.     2.2. Scope of the study   
    11.       2.2.1. Research Objective         
    12.           2.2.2. Assumption       
    13.             2.2.3. Limitations 
    14.     3. RESEARCH
    15. METHODOLOGY   
    16.         3.1. Overview 
    17.         3.2. Data Mining   
    18.         3.3. Secondary Research   
    19.         3.4. Primary Research   
    20.           3.4.1. Primary Interviews and Information Gathering
    21. Process         
    22.     3.4.2. Breakdown of Primary Respondents       
    23.         3.5. Forecasting Model 
    24.         3.6. Market Size Estimation 
    25.             3.6.1. Bottom-Up
    26. Approach         
    27.     3.6.2. Top-Down Approach           
    28.       3.7. Data Triangulation     
    29.       3.8. Validation        
    30.     4. MARKET DYNAMICS   
    31.       4.1. Overview     
    32.     4.2. Drivers     
    33.   4.3. Restraints     
      1. Opportunities        
    34. MARKET FACTOR ANALYSIS   
      1. Value chain Analysis     
    35.   5.2. Porter's Five Forces Analysis   
    36.         5.2.1. Bargaining Power of Suppliers     
    37.             5.2.2. Bargaining
    38. Power of Buyers         
    39.       5.2.3. Threat of New Entrants         
    40.           5.2.4. Threat of Substitutes     
    41.             5.2.5. Intensity
    42. of Rivalry           
    43.     5.3. COVID-19 Impact Analysis   
    44.         5.3.1. Market Impact Analysis       
    45.             5.3.2. Regional Impact 
      1. Opportunity and Threat Analysis           
    46.   6. Elemental Boron Market, BY Application (USD Billion)   
    47.       6.1. Glass and Ceramics     
    48.       6.2. Fertilizers     
    49.     6.3. Metallurgy     
    50.   6.4. Nuclear Energy     
    51.   6.5. Personal Care Products        
    52.   7. Elemental Boron Market, BY End Use (USD Billion)   
    53.       7.1. Agriculture     
    54.     7.2. Automotive     
    55.   7.3. Electronics     
      1. Construction     
      2. Healthcare        
    56. Elemental Boron Market, BY Form (USD Billion)   
    57.       8.1. Powder     
    58.     8.2. Granule     
    59.   8.3. Liquid     
      1. Paste        
    60.     9. Elemental
    61. Boron Market, BY Purity Level (USD Billion)   
    62.     9.1. Low Purity Boron     
    63.     9.2. Medium Purity Boron     
    64.       9.3. High Purity Boron        
    65.   10. Elemental Boron Market, BY Regional (USD Billion)   
    66.       10.1. North America   
    67.         10.1.1. US         
    68.           10.1.2. Canada         
    69.         10.2. Europe   
    70.           10.2.1. Germany         
    71.           10.2.2. UK         
    72.           10.2.3. France         
    73.           10.2.4. Russia         
    74.           10.2.5. Italy         
    75.           10.2.6. Spain         
    76.           10.2.7. Rest of Europe       
    77.         10.3. APAC   
    78.           10.3.1. China         
    79.           10.3.2. India         
    80.           10.3.3. Japan         
    81.           10.3.4. South Korea       
    82.             10.3.5. Malaysia 
      1. Thailand         
    83.       10.3.7. Indonesia         
    84.           10.3.8. Rest of APAC       
    85.         10.4. South America 
    86.             10.4.1. Brazil 
      1. Mexico         
    87.       10.4.3. Argentina         
    88.           10.4.4. Rest of South America     
    89.         10.5. MEA   
    90.           10.5.1. GCC Countries       
    91.             10.5.2. South Africa 
      1. Rest of MEA              
    92.     11. Competitive Landscape   
    93.       11.1. Overview     
    94.     11.2. Competitive Analysis     
    95.       11.3. Market share Analysis     
    96.       11.4. Major Growth Strategy in the Elemental Boron Market 
    97.         11.5. Competitive Benchmarking 
    98.         11.6. Leading Players in
    99. Terms of Number of Developments in the Elemental Boron Market     
    100.       11.7. Key developments and growth strategies   
    101.           11.7.1. New Product Launch/Service Deployment 
      1. Merger & Acquisitions         
    102.           11.7.3. Joint Ventures       
    103.         11.8. Major Players Financial
    104. Matrix    
      1. Sales and Operating Income         
    105.           11.8.2. Major Players R&D Expenditure. 2023 
    106. Company Profiles   
    107.         12.1. Southern
    108. Ionics   
    109. Financial Overview         
    110.         12.1.2. Products Offered       
    111.             12.1.3. Key Developments 
      1. SWOT Analysis         
    112.         12.1.5. Key Strategies         
    113.         12.2. Borax Argentina   
    114.           12.2.1. Financial Overview     
    115.             12.2.2. Products
    116. Offered         
    117.     12.2.3. Key Developments         
    118.           12.2.4. SWOT Analysis       
    119.             12.2.5. Key Strategies 
    120. Borax Europe   
      1. Financial Overview         
    121.           12.3.2. Products Offered     
    122.             12.3.3. Key
    123. Developments         
    124.       12.3.4. SWOT Analysis         
    125.           12.3.5. Key Strategies       
    126.         12.4. United Borax 
    127.             12.4.1. Financial
    128. Overview         
    129.     12.4.2. Products Offered         
    130.           12.4.3. Key Developments     
    131.             12.4.4. SWOT
    132. Analysis         
    133.     12.4.5. Key Strategies           
    134.       12.5. Gujarat State Fertilizers  and  Chemicals 
    135.             12.5.1. Financial
    136. Overview         
    137.     12.5.2. Products Offered         
    138.           12.5.3. Key Developments     
    139.             12.5.4. SWOT
    140. Analysis         
    141.     12.5.5. Key Strategies           
    142.       12.6. Minera BACO   
    143.         12.6.1. Financial Overview       
    144.             12.6.2. Products
    145. Offered         
    146.     12.6.3. Key Developments         
    147.           12.6.4. SWOT Analysis       
    148.             12.6.5. Key Strategies 
    149. ICL Group   
    150. Financial Overview         
    151.         12.7.2. Products Offered       
    152.             12.7.3. Key Developments 
      1. SWOT Analysis         
    153.         12.7.5. Key Strategies         
    154.         12.8. Eti Maden   
    155.           12.8.1. Financial Overview     
    156.             12.8.2. Products
    157. Offered         
    158.     12.8.3. Key Developments         
    159.           12.8.4. SWOT Analysis       
    160.             12.8.5. Key Strategies 
    161. Dajin Resources   
      1. Financial Overview         
    162.           12.9.2. Products Offered     
    163.             12.9.3. Key
    164. Developments         
    165.       12.9.4. SWOT Analysis         
    166.           12.9.5. Key Strategies       
    167.         12.10. American Borate Company 
    168.             12.10.1. Financial
    169. Overview         
    170.     12.10.2. Products Offered         
    171.           12.10.3. Key Developments     
    172.             12.10.4. SWOT
    173. Analysis         
    174.     12.10.5. Key Strategies           
    175.       12.11. Karnalyte Resources   
    176.           12.11.1. Financial Overview     
    177.             12.11.2. Products
    178. Offered         
    179.     12.11.3. Key Developments         
    180.           12.11.4. SWOT Analysis       
    181.             12.11.5. Key Strategies 
    182. Green Garden Products   
    183.   12.12.1. Financial Overview         
    184.           12.12.2. Products Offered     
    185.             12.12.3. Key
    186. Developments         
    187.       12.12.4. SWOT Analysis         
    188.           12.12.5. Key Strategies       
    189.         12.13. Searles Valley Minerals 
    190.             12.13.1. Financial
    191. Overview         
    192.     12.13.2. Products Offered         
    193.           12.13.3. Key Developments     
    194.             12.13.4. SWOT
    195. Analysis         
    196.     12.13.5. Key Strategies           
    197.       12.14. Rio Tinto   
    198.       12.14.1. Financial Overview         
    199.           12.14.2. Products Offered     
    200.             12.14.3. Key
    201. Developments         
    202.       12.14.4. SWOT Analysis         
    203.           12.14.5. Key Strategies       
    204.         12.15. Duda Energy 
    205.             12.15.1. Financial
    206. Overview         
    207.     12.15.2. Products Offered         
    208.           12.15.3. Key Developments     
    209.             12.15.4. SWOT
    210. Analysis         
    211.     12.15.5. Key Strategies              
    212.   13. Appendix   
    213. References     
    214.         13.2. Related
    215. Reports        
    216.   Table 1. LIST OF ASSUMPTIONS   
    217.     Table
    218. North America Elemental Boron Market SIZE ESTIMATES & FORECAST, BY APPLICATION,
    219. 2034 (USD Billions)   
    220.     Table 3. North
    221. America Elemental Boron Market SIZE ESTIMATES & FORECAST, BY END USE, 2025-2034
    222. (USD Billions)   
    223.     Table 4. North America Elemental
    224. Boron Market SIZE ESTIMATES & FORECAST, BY FORM, 2025-2034 (USD Billions) 
    225.     Table 5. North America Elemental Boron Market
    226. SIZE ESTIMATES & FORECAST, BY PURITY LEVEL, 2025-2034 (USD Billions)   
    227.   Table 6. North America Elemental Boron Market SIZE ESTIMATES & FORECAST,
    228. BY REGIONAL, 2025-2034 (USD Billions)   
    229.     Table
    230. US Elemental Boron Market SIZE ESTIMATES & FORECAST, BY APPLICATION, 2025-2034
    231. (USD Billions)   
    232.     Table 8. US Elemental Boron
    233. Market SIZE ESTIMATES & FORECAST, BY END USE, 2025-2034 (USD Billions) 
    234.     Table 9. US Elemental Boron Market SIZE ESTIMATES
    235. & FORECAST, BY FORM, 2025-2034 (USD Billions)   
    236.   Table 10. US Elemental Boron Market SIZE ESTIMATES & FORECAST, BY PURITY
    237. LEVEL, 2025-2034 (USD Billions)   
    238.     Table 11.
    239. US Elemental Boron Market SIZE ESTIMATES & FORECAST, BY REGIONAL, 2025-2034
    240. (USD Billions)   
    241.     Table 12. Canada Elemental
    242. Boron Market SIZE ESTIMATES & FORECAST, BY APPLICATION, 2025-2034 (USD Billions) 
    243.     Table 13. Canada Elemental Boron Market SIZE
    244. ESTIMATES & FORECAST, BY END USE, 2025-2034 (USD Billions)   
    245.   Table 14. Canada Elemental Boron Market SIZE ESTIMATES & FORECAST, BY
    246. FORM, 2025-2034 (USD Billions)   
    247.     Table 15.
    248. Canada Elemental Boron Market SIZE ESTIMATES & FORECAST, BY PURITY LEVEL, 2025-2034
    249. (USD Billions)   
    250.     Table 16. Canada Elemental
    251. Boron Market SIZE ESTIMATES & FORECAST, BY REGIONAL, 2025-2034 (USD Billions) 
    252.     Table 17. Europe Elemental Boron Market SIZE
    253. ESTIMATES & FORECAST, BY APPLICATION, 2025-2034 (USD Billions)   
    254.   Table 18. Europe Elemental Boron Market SIZE ESTIMATES & FORECAST, BY
    255. END USE, 2025-2034 (USD Billions)   
    256.     Table
    257. Europe Elemental Boron Market SIZE ESTIMATES & FORECAST, BY FORM, 2025-2034
    258. (USD Billions)   
    259.     Table 20. Europe Elemental
    260. Boron Market SIZE ESTIMATES & FORECAST, BY PURITY LEVEL, 2025-2034 (USD Billions) 
    261.     Table 21. Europe Elemental Boron Market SIZE
    262. ESTIMATES & FORECAST, BY REGIONAL, 2025-2034 (USD Billions)   
    263.   Table 22. Germany Elemental Boron Market SIZE ESTIMATES & FORECAST, BY
    264. APPLICATION, 2025-2034 (USD Billions)   
    265.     Table
    266. Germany Elemental Boron Market SIZE ESTIMATES & FORECAST, BY END USE, 2025-2034
    267. (USD Billions)   
    268.     Table 24. Germany Elemental
    269. Boron Market SIZE ESTIMATES & FORECAST, BY FORM, 2025-2034 (USD Billions) 
    270.     Table 25. Germany Elemental Boron Market SIZE
    271. ESTIMATES & FORECAST, BY PURITY LEVEL, 2025-2034 (USD Billions)   
    272.   Table 26. Germany Elemental Boron Market SIZE ESTIMATES & FORECAST, BY
    273. REGIONAL, 2025-2034 (USD Billions)   
    274.     Table
    275. UK Elemental Boron Market SIZE ESTIMATES & FORECAST, BY APPLICATION, 2025-2034
    276. (USD Billions)   
    277.     Table 28. UK Elemental Boron
    278. Market SIZE ESTIMATES & FORECAST, BY END USE, 2025-2034 (USD Billions) 
    279.     Table 29. UK Elemental Boron Market SIZE ESTIMATES
    280. & FORECAST, BY FORM, 2025-2034 (USD Billions)   
    281.   Table 30. UK Elemental Boron Market SIZE ESTIMATES & FORECAST, BY PURITY
    282. LEVEL, 2025-2034 (USD Billions)   
    283.     Table 31.
    284. UK Elemental Boron Market SIZE ESTIMATES & FORECAST, BY REGIONAL, 2025-2034
    285. (USD Billions)   
    286.     Table 32. France Elemental
    287. Boron Market SIZE ESTIMATES & FORECAST, BY APPLICATION, 2025-2034 (USD Billions) 
    288.     Table 33. France Elemental Boron Market SIZE
    289. ESTIMATES & FORECAST, BY END USE, 2025-2034 (USD Billions)   
    290.   Table 34. France Elemental Boron Market SIZE ESTIMATES & FORECAST, BY
    291. FORM, 2025-2034 (USD Billions)   
    292.     Table 35.
    293. France Elemental Boron Market SIZE ESTIMATES & FORECAST, BY PURITY LEVEL, 2025-2034
    294. (USD Billions)   
    295.     Table 36. France Elemental
    296. Boron Market SIZE ESTIMATES & FORECAST, BY REGIONAL, 2025-2034 (USD Billions) 
    297.     Table 37. Russia Elemental Boron Market SIZE
    298. ESTIMATES & FORECAST, BY APPLICATION, 2025-2034 (USD Billions)   
    299.   Table 38. Russia Elemental Boron Market SIZE ESTIMATES & FORECAST, BY
    300. END USE, 2025-2034 (USD Billions)   
    301.     Table
    302. Russia Elemental Boron Market SIZE ESTIMATES & FORECAST, BY FORM, 2025-2034
    303. (USD Billions)   
    304.     Table 40. Russia Elemental
    305. Boron Market SIZE ESTIMATES & FORECAST, BY PURITY LEVEL, 2025-2034 (USD Billions) 
    306.     Table 41. Russia Elemental Boron Market SIZE
    307. ESTIMATES & FORECAST, BY REGIONAL, 2025-2034 (USD Billions)   
    308.   Table 42. Italy Elemental Boron Market SIZE ESTIMATES & FORECAST, BY
    309. APPLICATION, 2025-2034 (USD Billions)   
    310.     Table
    311. Italy Elemental Boron Market SIZE ESTIMATES & FORECAST, BY END USE, 2025-2034
    312. (USD Billions)   
    313.     Table 44. Italy Elemental
    314. Boron Market SIZE ESTIMATES & FORECAST, BY FORM, 2025-2034 (USD Billions) 
    315.     Table 45. Italy Elemental Boron Market SIZE ESTIMATES
    316. & FORECAST, BY PURITY LEVEL, 2025-2034 (USD Billions)   
    317.   Table 46. Italy Elemental Boron Market SIZE ESTIMATES & FORECAST, BY
    318. REGIONAL, 2025-2034 (USD Billions)   
    319.     Table
    320. Spain Elemental Boron Market SIZE ESTIMATES & FORECAST, BY APPLICATION,
    321. 2034 (USD Billions)   
    322.     Table 48. Spain
    323. Elemental Boron Market SIZE ESTIMATES & FORECAST, BY END USE, 2025-2034 (USD
    324. Billions)   
    325.     Table 49. Spain Elemental Boron
    326. Market SIZE ESTIMATES & FORECAST, BY FORM, 2025-2034 (USD Billions)   
    327.   Table 50. Spain Elemental Boron Market SIZE ESTIMATES & FORECAST, BY
    328. PURITY LEVEL, 2025-2034 (USD Billions)   
    329. 2034 (USD Billions)   
    330.     Table 52. Rest
    331. of Europe Elemental Boron Market SIZE ESTIMATES & FORECAST, BY APPLICATION,
    332. 2034 (USD Billions)   
    333.     Table 53. Rest
    334. of Europe Elemental Boron Market SIZE ESTIMATES & FORECAST, BY END USE, 2025-2034
    335. (USD Billions)   
    336.     Table 54. Rest of Europe
    337. Elemental Boron Market SIZE ESTIMATES & FORECAST, BY FORM, 2025-2034 (USD Billions) 
    338.     Table 55. Rest of Europe Elemental Boron Market
    339. SIZE ESTIMATES & FORECAST, BY PURITY LEVEL, 2025-2034 (USD Billions)   
    340.   Table 56. Rest of Europe Elemental Boron Market SIZE ESTIMATES & FORECAST,
    341. BY REGIONAL, 2025-2034 (USD Billions)   
    342.     Table
    343. APAC Elemental Boron Market SIZE ESTIMATES & FORECAST, BY APPLICATION, 2025-2034
    344. (USD Billions)   
    345.     Table 58. APAC Elemental
    346. Boron Market SIZE ESTIMATES & FORECAST, BY END USE, 2025-2034 (USD Billions) 
    347.     Table 59. APAC Elemental Boron Market SIZE ESTIMATES
    348. & FORECAST, BY FORM, 2025-2034 (USD Billions)   
    349.   Table 60. APAC Elemental Boron Market SIZE ESTIMATES & FORECAST, BY PURITY
    350. LEVEL, 2025-2034 (USD Billions)   
    351.     Table 61.
    352. APAC Elemental Boron Market SIZE ESTIMATES & FORECAST, BY REGIONAL, 2025-2034
    353. (USD Billions)   
    354.     Table 62. China Elemental
    355. Boron Market SIZE ESTIMATES & FORECAST, BY APPLICATION, 2025-2034 (USD Billions) 
    356.     Table 63. China Elemental Boron Market SIZE ESTIMATES
    357. & FORECAST, BY END USE, 2025-2034 (USD Billions)   
    358.   Table 64. China Elemental Boron Market SIZE ESTIMATES & FORECAST, BY
    359. FORM, 2025-2034 (USD Billions)   
    360.     Table 65.
    361. China Elemental Boron Market SIZE ESTIMATES & FORECAST, BY PURITY LEVEL, 2025-2034
    362. (USD Billions)   
    363.     Table 66. China Elemental
    364. Boron Market SIZE ESTIMATES & FORECAST, BY REGIONAL, 2025-2034 (USD Billions) 
    365.     Table 67. India Elemental Boron Market SIZE ESTIMATES
    366. & FORECAST, BY APPLICATION, 2025-2034 (USD Billions)   
    367.   Table 68. India Elemental Boron Market SIZE ESTIMATES & FORECAST, BY
    368. END USE, 2025-2034 (USD Billions)   
    369.     Table
    370. India Elemental Boron Market SIZE ESTIMATES & FORECAST, BY FORM, 2025-2034
    371. (USD Billions)   
    372.     Table 70. India Elemental
    373. Boron Market SIZE ESTIMATES & FORECAST, BY PURITY LEVEL, 2025-2034 (USD Billions) 
    374.     Table 71. India Elemental Boron Market SIZE ESTIMATES
    375. & FORECAST, BY REGIONAL, 2025-2034 (USD Billions)   
    376.   Table 72. Japan Elemental Boron Market SIZE ESTIMATES & FORECAST, BY
    377. APPLICATION, 2025-2034 (USD Billions)   
    378.     Table
    379. Japan Elemental Boron Market SIZE ESTIMATES & FORECAST, BY END USE, 2025-2034
    380. (USD Billions)   
    381.     Table 74. Japan Elemental
    382. Boron Market SIZE ESTIMATES & FORECAST, BY FORM, 2025-2034 (USD Billions) 
    383.     Table 75. Japan Elemental Boron Market SIZE ESTIMATES
    384. & FORECAST, BY PURITY LEVEL, 2025-2034 (USD Billions)   
    385.   Table 76. Japan Elemental Boron Market SIZE ESTIMATES & FORECAST, BY
    386. REGIONAL, 2025-2034 (USD Billions)   
    387.     Table
    388. South Korea Elemental Boron Market SIZE ESTIMATES & FORECAST, BY APPLICATION,
    389. 2034 (USD Billions)   
    390.     Table 78. South
    391. Korea Elemental Boron Market SIZE ESTIMATES & FORECAST, BY END USE, 2025-2034
    392. (USD Billions)   
    393.     Table 79. South Korea Elemental
    394. Boron Market SIZE ESTIMATES & FORECAST, BY FORM, 2025-2034 (USD Billions) 
    395.     Table 80. South Korea Elemental Boron Market
    396. SIZE ESTIMATES & FORECAST, BY PURITY LEVEL, 2025-2034 (USD Billions)   
    397.   Table 81. South Korea Elemental Boron Market SIZE ESTIMATES & FORECAST,
    398. BY REGIONAL, 2025-2034 (USD Billions)   
    399.     Table
    400. Malaysia Elemental Boron Market SIZE ESTIMATES & FORECAST, BY APPLICATION,
    401. 2034 (USD Billions)   
    402.     Table 83. Malaysia
    403. Elemental Boron Market SIZE ESTIMATES & FORECAST, BY END USE, 2025-2034 (USD
    404. Billions)   
    405.     Table 84. Malaysia Elemental
    406. Boron Market SIZE ESTIMATES & FORECAST, BY FORM, 2025-2034 (USD Billions) 
    407.     Table 85. Malaysia Elemental Boron Market SIZE
    408. ESTIMATES & FORECAST, BY PURITY LEVEL, 2025-2034 (USD Billions)   
    409.   Table 86. Malaysia Elemental Boron Market SIZE ESTIMATES & FORECAST,
    410. BY REGIONAL, 2025-2034 (USD Billions)   
    411.     Table
    412. Thailand Elemental Boron Market SIZE ESTIMATES & FORECAST, BY APPLICATION,
    413. 2034 (USD Billions)   
    414.     Table 88. Thailand
    415. Elemental Boron Market SIZE ESTIMATES & FORECAST, BY END USE, 2025-2034 (USD
    416. Billions)   
    417.     Table 89. Thailand Elemental
    418. Boron Market SIZE ESTIMATES & FORECAST, BY FORM, 2025-2034 (USD Billions) 
    419.     Table 90. Thailand Elemental Boron Market SIZE
    420. ESTIMATES & FORECAST, BY PURITY LEVEL, 2025-2034 (USD Billions)   
    421.   Table 91. Thailand Elemental Boron Market SIZE ESTIMATES & FORECAST,
    422. BY REGIONAL, 2025-2034 (USD Billions)   
    423.     Table
    424. Indonesia Elemental Boron Market SIZE ESTIMATES & FORECAST, BY APPLICATION,
    425. 2034 (USD Billions)   
    426.     Table 93. Indonesia
    427. Elemental Boron Market SIZE ESTIMATES & FORECAST, BY END USE, 2025-2034 (USD
    428. Billions)   
    429.     Table 94. Indonesia Elemental
    430. Boron Market SIZE ESTIMATES & FORECAST, BY FORM, 2025-2034 (USD Billions) 
    431.     Table 95. Indonesia Elemental Boron Market SIZE
    432. ESTIMATES & FORECAST, BY PURITY LEVEL, 2025-2034 (USD Billions)   
    433.   Table 96. Indonesia Elemental Boron Market SIZE ESTIMATES & FORECAST,
    434. BY REGIONAL, 2025-2034 (USD Billions)   
    435.     Table
    436. Rest of APAC Elemental Boron Market SIZE ESTIMATES & FORECAST, BY APPLICATION,
    437. 2034 (USD Billions)   
    438.     Table 98. Rest
    439. of APAC Elemental Boron Market SIZE ESTIMATES & FORECAST, BY END USE, 2025-2034
    440. (USD Billions)   
    441.     Table 99. Rest of APAC Elemental
    442. Boron Market SIZE ESTIMATES & FORECAST, BY FORM, 2025-2034 (USD Billions) 
    443.     Table 100. Rest of APAC Elemental Boron Market
    444. SIZE ESTIMATES & FORECAST, BY PURITY LEVEL, 2025-2034 (USD Billions)   
    445.   Table 101. Rest of APAC Elemental Boron Market SIZE ESTIMATES & FORECAST,
    446. BY REGIONAL, 2025-2034 (USD Billions)   
    447.     Table
    448. South America Elemental Boron Market SIZE ESTIMATES & FORECAST, BY APPLICATION,
    449. 2034 (USD Billions)   
    450.     Table 103. South
    451. America Elemental Boron Market SIZE ESTIMATES & FORECAST, BY END USE, 2025-2034
    452. (USD Billions)   
    453.     Table 104. South America
    454. Elemental Boron Market SIZE ESTIMATES & FORECAST, BY FORM, 2025-2034 (USD Billions) 
    455.     Table 105. South America Elemental Boron Market
    456. SIZE ESTIMATES & FORECAST, BY PURITY LEVEL, 2025-2034 (USD Billions)   
    457.   Table 106. South America Elemental Boron Market SIZE ESTIMATES & FORECAST,
    458. BY REGIONAL, 2025-2034 (USD Billions)   
    459.     Table
    460. Brazil Elemental Boron Market SIZE ESTIMATES & FORECAST, BY APPLICATION,
    461. 2034 (USD Billions)   
    462.     Table 108. Brazil
    463. Elemental Boron Market SIZE ESTIMATES & FORECAST, BY END USE, 2025-2034 (USD
    464. Billions)   
    465.     Table 109. Brazil Elemental Boron
    466. Market SIZE ESTIMATES & FORECAST, BY FORM, 2025-2034 (USD Billions)   
    467.   Table 110. Brazil Elemental Boron Market SIZE ESTIMATES & FORECAST, BY
    468. PURITY LEVEL, 2025-2034 (USD Billions)   
    469. 2034 (USD Billions)   
    470.     Table 112. Mexico
    471. Elemental Boron Market SIZE ESTIMATES & FORECAST, BY APPLICATION, 2025-2034
    472. (USD Billions)   
    473.     Table 113. Mexico Elemental
    474. Boron Market SIZE ESTIMATES & FORECAST, BY END USE, 2025-2034 (USD Billions) 
    475.     Table 114. Mexico Elemental Boron Market SIZE
    476. ESTIMATES & FORECAST, BY FORM, 2025-2034 (USD Billions)   
    477.   Table 115. Mexico Elemental Boron Market SIZE ESTIMATES & FORECAST, BY
    478. PURITY LEVEL, 2025-2034 (USD Billions)   
    479. 2034 (USD Billions)   
    480.     Table 117. Argentina
    481. Elemental Boron Market SIZE ESTIMATES & FORECAST, BY APPLICATION, 2025-2034
    482. (USD Billions)   
    483.     Table 118. Argentina Elemental
    484. Boron Market SIZE ESTIMATES & FORECAST, BY END USE, 2025-2034 (USD Billions) 
    485.     Table 119. Argentina Elemental Boron Market SIZE
    486. ESTIMATES & FORECAST, BY FORM, 2025-2034 (USD Billions)   
    487.   Table 120. Argentina Elemental Boron Market SIZE ESTIMATES & FORECAST,
    488. BY PURITY LEVEL, 2025-2034 (USD Billions)   
    489. 2034 (USD Billions)   
    490.     Table 122. Rest
    491. of South America Elemental Boron Market SIZE ESTIMATES & FORECAST, BY APPLICATION,
    492. 2034 (USD Billions)   
    493.     Table 123. Rest
    494. of South America Elemental Boron Market SIZE ESTIMATES & FORECAST, BY END USE,
    495. 2034 (USD Billions)   
    496.     Table 124. Rest
    497. of South America Elemental Boron Market SIZE ESTIMATES & FORECAST, BY FORM,
    498. 2034 (USD Billions)   
    499.     Table 125. Rest
    500. of South America Elemental Boron Market SIZE ESTIMATES & FORECAST, BY PURITY
    501. LEVEL, 2025-2034 (USD Billions)   
    502.     Table 126.
    503. Rest of South America Elemental Boron Market SIZE ESTIMATES & FORECAST, BY REGIONAL,
    504. 2034 (USD Billions)   
    505.     Table 127. MEA
    506. Elemental Boron Market SIZE ESTIMATES & FORECAST, BY APPLICATION, 2025-2034
    507. (USD Billions)   
    508.     Table 128. MEA Elemental
    509. Boron Market SIZE ESTIMATES & FORECAST, BY END USE, 2025-2034 (USD Billions) 
    510.     Table 129. MEA Elemental Boron Market SIZE ESTIMATES
    511. & FORECAST, BY FORM, 2025-2034 (USD Billions)   
    512.   Table 130. MEA Elemental Boron Market SIZE ESTIMATES & FORECAST, BY PURITY
    513. LEVEL, 2025-2034 (USD Billions)   
    514.     Table 131.
    515. MEA Elemental Boron Market SIZE ESTIMATES & FORECAST, BY REGIONAL, 2025-2034
    516. (USD Billions)   
    517.     Table 132. GCC Countries
    518. Elemental Boron Market SIZE ESTIMATES & FORECAST, BY APPLICATION, 2025-2034
    519. (USD Billions)   
    520.     Table 133. GCC Countries
    521. Elemental Boron Market SIZE ESTIMATES & FORECAST, BY END USE, 2025-2034 (USD
    522. Billions)   
    523.     Table 134. GCC Countries Elemental
    524. Boron Market SIZE ESTIMATES & FORECAST, BY FORM, 2025-2034 (USD Billions) 
    525.     Table 135. GCC Countries Elemental Boron Market
    526. SIZE ESTIMATES & FORECAST, BY PURITY LEVEL, 2025-2034 (USD Billions)   
    527.   Table 136. GCC Countries Elemental Boron Market SIZE ESTIMATES & FORECAST,
    528. BY REGIONAL, 2025-2034 (USD Billions)   
    529.     Table
    530. South Africa Elemental Boron Market SIZE ESTIMATES & FORECAST, BY APPLICATION,
    531. 2034 (USD Billions)   
    532.     Table 138. South
    533. Africa Elemental Boron Market SIZE ESTIMATES & FORECAST, BY END USE, 2025-2034
    534. (USD Billions)   
    535.     Table 139. South Africa
    536. Elemental Boron Market SIZE ESTIMATES & FORECAST, BY FORM, 2025-2034 (USD Billions) 
    537.     Table 140. South Africa Elemental Boron Market
    538. SIZE ESTIMATES & FORECAST, BY PURITY LEVEL, 2025-2034 (USD Billions)   
    539.   Table 141. South Africa Elemental Boron Market SIZE ESTIMATES & FORECAST,
    540. BY REGIONAL, 2025-2034 (USD Billions)   
    541.     Table
    542. Rest of MEA Elemental Boron Market SIZE ESTIMATES & FORECAST, BY APPLICATION,
    543. 2034 (USD Billions)   
    544.     Table 143. Rest
    545. of MEA Elemental Boron Market SIZE ESTIMATES & FORECAST, BY END USE, 2025-2034
    546. (USD Billions)   
    547.     Table 144. Rest of MEA Elemental
    548. Boron Market SIZE ESTIMATES & FORECAST, BY FORM, 2025-2034 (USD Billions) 
    549.     Table 145. Rest of MEA Elemental Boron Market
    550. SIZE ESTIMATES & FORECAST, BY PURITY LEVEL, 2025-2034 (USD Billions)   
    551.   Table 146. Rest of MEA Elemental Boron Market SIZE ESTIMATES & FORECAST,
    552. BY REGIONAL, 2025-2034 (USD Billions)   
    553.     Table
    554. PRODUCT LAUNCH/PRODUCT DEVELOPMENT/APPROVAL   
    555.   Table 148. ACQUISITION/PARTNERSHIP   
    556. LIST
    557. Of figures
    558.     Figure 1. MARKET SYNOPSIS 
    559.   Figure 2. NORTH AMERICA ELEMENTAL BORON MARKET ANALYSIS 
    560.   Figure 3. US ELEMENTAL BORON MARKET ANALYSIS BY APPLICATION 
    561.   Figure 4. US ELEMENTAL BORON MARKET ANALYSIS BY END USE 
    562.   Figure 5. US ELEMENTAL BORON MARKET ANALYSIS BY FORM 
    563.   Figure 6. US ELEMENTAL BORON MARKET ANALYSIS BY PURITY LEVEL 
    564.   Figure 7. US ELEMENTAL BORON MARKET ANALYSIS BY REGIONAL 
    565.   Figure 8. CANADA ELEMENTAL BORON MARKET ANALYSIS BY APPLICATION 
    566.   Figure 9. CANADA ELEMENTAL BORON MARKET ANALYSIS BY END USE 
    567.   Figure 10. CANADA ELEMENTAL BORON MARKET ANALYSIS BY FORM 
    568.   Figure 11. CANADA ELEMENTAL BORON MARKET ANALYSIS BY PURITY LEVEL 
    569.   Figure 12. CANADA ELEMENTAL BORON MARKET ANALYSIS BY REGIONAL 
    570.   Figure 13. EUROPE ELEMENTAL BORON MARKET ANALYSIS 
    571.   Figure 14. GERMANY ELEMENTAL BORON MARKET ANALYSIS BY APPLICATION 
    572.   Figure 15. GERMANY ELEMENTAL BORON MARKET ANALYSIS BY END USE 
    573.   Figure 16. GERMANY ELEMENTAL BORON MARKET ANALYSIS BY FORM 
    574.   Figure 17. GERMANY ELEMENTAL BORON MARKET ANALYSIS BY PURITY LEVEL 
    575.   Figure 18. GERMANY ELEMENTAL BORON MARKET ANALYSIS BY REGIONAL 
    576.   Figure 19. UK ELEMENTAL BORON MARKET ANALYSIS BY APPLICATION 
    577.   Figure 20. UK ELEMENTAL BORON MARKET ANALYSIS BY END USE 
    578.   Figure 21. UK ELEMENTAL BORON MARKET ANALYSIS BY FORM 
    579.   Figure 22. UK ELEMENTAL BORON MARKET ANALYSIS BY PURITY LEVEL 
    580.   Figure 23. UK ELEMENTAL BORON MARKET ANALYSIS BY REGIONAL 
    581.   Figure 24. FRANCE ELEMENTAL BORON MARKET ANALYSIS BY APPLICATION 
    582.   Figure 25. FRANCE ELEMENTAL BORON MARKET ANALYSIS BY END USE 
    583.   Figure 26. FRANCE ELEMENTAL BORON MARKET ANALYSIS BY FORM 
    584.   Figure 27. FRANCE ELEMENTAL BORON MARKET ANALYSIS BY PURITY LEVEL 
    585.   Figure 28. FRANCE ELEMENTAL BORON MARKET ANALYSIS BY REGIONAL 
    586.   Figure 29. RUSSIA ELEMENTAL BORON MARKET ANALYSIS BY APPLICATION 
    587.   Figure 30. RUSSIA ELEMENTAL BORON MARKET ANALYSIS BY END USE 
    588.   Figure 31. RUSSIA ELEMENTAL BORON MARKET ANALYSIS BY FORM 
    589.   Figure 32. RUSSIA ELEMENTAL BORON MARKET ANALYSIS BY PURITY LEVEL 
    590.   Figure 33. RUSSIA ELEMENTAL BORON MARKET ANALYSIS BY REGIONAL 
    591.   Figure 34. ITALY ELEMENTAL BORON MARKET ANALYSIS BY APPLICATION 
    592.   Figure 35. ITALY ELEMENTAL BORON MARKET ANALYSIS BY END USE 
    593.   Figure 36. ITALY ELEMENTAL BORON MARKET ANALYSIS BY FORM 
    594.   Figure 37. ITALY ELEMENTAL BORON MARKET ANALYSIS BY PURITY LEVEL 
    595.   Figure 38. ITALY ELEMENTAL BORON MARKET ANALYSIS BY REGIONAL 
    596.   Figure 39. SPAIN ELEMENTAL BORON MARKET ANALYSIS BY APPLICATION 
    597.   Figure 40. SPAIN ELEMENTAL BORON MARKET ANALYSIS BY END USE 
    598.   Figure 41. SPAIN ELEMENTAL BORON MARKET ANALYSIS BY FORM 
    599.   Figure 42. SPAIN ELEMENTAL BORON MARKET ANALYSIS BY PURITY LEVEL 
    600.   Figure 43. SPAIN ELEMENTAL BORON MARKET ANALYSIS BY REGIONAL 
    601.   Figure 44. REST OF EUROPE ELEMENTAL BORON MARKET ANALYSIS BY APPLICATION 
    602.   Figure 45. REST OF EUROPE ELEMENTAL BORON MARKET ANALYSIS BY END USE 
    603.   Figure 46. REST OF EUROPE ELEMENTAL BORON MARKET ANALYSIS BY FORM 
    604.   Figure 47. REST OF EUROPE ELEMENTAL BORON MARKET ANALYSIS BY PURITY LEVEL 
    605.   Figure 48. REST OF EUROPE ELEMENTAL BORON MARKET ANALYSIS BY REGIONAL 
    606.   Figure 49. APAC ELEMENTAL BORON MARKET ANALYSIS 
    607.   Figure 50. CHINA ELEMENTAL BORON MARKET ANALYSIS BY APPLICATION 
    608.   Figure 51. CHINA ELEMENTAL BORON MARKET ANALYSIS BY END USE 
    609.   Figure 52. CHINA ELEMENTAL BORON MARKET ANALYSIS BY FORM 
    610.   Figure 53. CHINA ELEMENTAL BORON MARKET ANALYSIS BY PURITY LEVEL 
    611.   Figure 54. CHINA ELEMENTAL BORON MARKET ANALYSIS BY REGIONAL 
    612.   Figure 55. INDIA ELEMENTAL BORON MARKET ANALYSIS BY APPLICATION 
    613.   Figure 56. INDIA ELEMENTAL BORON MARKET ANALYSIS BY END USE 
    614.   Figure 57. INDIA ELEMENTAL BORON MARKET ANALYSIS BY FORM 
    615.   Figure 58. INDIA ELEMENTAL BORON MARKET ANALYSIS BY PURITY LEVEL 
    616.   Figure 59. INDIA ELEMENTAL BORON MARKET ANALYSIS BY REGIONAL 
    617.   Figure 60. JAPAN ELEMENTAL BORON MARKET ANALYSIS BY APPLICATION 
    618.   Figure 61. JAPAN ELEMENTAL BORON MARKET ANALYSIS BY END USE 
    619.   Figure 62. JAPAN ELEMENTAL BORON MARKET ANALYSIS BY FORM 
    620.   Figure 63. JAPAN ELEMENTAL BORON MARKET ANALYSIS BY PURITY LEVEL 
    621.   Figure 64. JAPAN ELEMENTAL BORON MARKET ANALYSIS BY REGIONAL 
    622.   Figure 65. SOUTH KOREA ELEMENTAL BORON MARKET ANALYSIS BY APPLICATION 
    623.   Figure 66. SOUTH KOREA ELEMENTAL BORON MARKET ANALYSIS BY END USE 
    624.   Figure 67. SOUTH KOREA ELEMENTAL BORON MARKET ANALYSIS BY FORM 
    625.   Figure 68. SOUTH KOREA ELEMENTAL BORON MARKET ANALYSIS BY PURITY LEVEL 
    626.   Figure 69. SOUTH KOREA ELEMENTAL BORON MARKET ANALYSIS BY REGIONAL 
    627.   Figure 70. MALAYSIA ELEMENTAL BORON MARKET ANALYSIS BY APPLICATION 
    628.   Figure 71. MALAYSIA ELEMENTAL BORON MARKET ANALYSIS BY END USE 
    629.   Figure 72. MALAYSIA ELEMENTAL BORON MARKET ANALYSIS BY FORM 
    630.   Figure 73. MALAYSIA ELEMENTAL BORON MARKET ANALYSIS BY PURITY LEVEL 
    631.   Figure 74. MALAYSIA ELEMENTAL BORON MARKET ANALYSIS BY REGIONAL 
    632.   Figure 75. THAILAND ELEMENTAL BORON MARKET ANALYSIS BY APPLICATION 
    633.   Figure 76. THAILAND ELEMENTAL BORON MARKET ANALYSIS BY END USE 
    634.   Figure 77. THAILAND ELEMENTAL BORON MARKET ANALYSIS BY FORM 
    635.   Figure 78. THAILAND ELEMENTAL BORON MARKET ANALYSIS BY PURITY LEVEL 
    636.   Figure 79. THAILAND ELEMENTAL BORON MARKET ANALYSIS BY REGIONAL 
    637.   Figure 80. INDONESIA ELEMENTAL BORON MARKET ANALYSIS BY APPLICATION 
    638.   Figure 81. INDONESIA ELEMENTAL BORON MARKET ANALYSIS BY END USE 
    639.   Figure 82. INDONESIA ELEMENTAL BORON MARKET ANALYSIS BY FORM 
    640.   Figure 83. INDONESIA ELEMENTAL BORON MARKET ANALYSIS BY PURITY LEVEL 
    641.   Figure 84. INDONESIA ELEMENTAL BORON MARKET ANALYSIS BY REGIONAL 
    642.   Figure 85. REST OF APAC ELEMENTAL BORON MARKET ANALYSIS BY APPLICATION 
    643.   Figure 86. REST OF APAC ELEMENTAL BORON MARKET ANALYSIS BY END USE 
    644.   Figure 87. REST OF APAC ELEMENTAL BORON MARKET ANALYSIS BY FORM 
    645.   Figure 88. REST OF APAC ELEMENTAL BORON MARKET ANALYSIS BY PURITY LEVEL 
    646.   Figure 89. REST OF APAC ELEMENTAL BORON MARKET ANALYSIS BY REGIONAL 
    647.   Figure 90. SOUTH AMERICA ELEMENTAL BORON MARKET ANALYSIS 
    648.   Figure 91. BRAZIL ELEMENTAL BORON MARKET ANALYSIS BY APPLICATION 
    649.   Figure 92. BRAZIL ELEMENTAL BORON MARKET ANALYSIS BY END USE 
    650.   Figure 93. BRAZIL ELEMENTAL BORON MARKET ANALYSIS BY FORM 
    651.   Figure 94. BRAZIL ELEMENTAL BORON MARKET ANALYSIS BY PURITY LEVEL 
    652.   Figure 95. BRAZIL ELEMENTAL BORON MARKET ANALYSIS BY REGIONAL 
    653.   Figure 96. MEXICO ELEMENTAL BORON MARKET ANALYSIS BY APPLICATION 
    654.   Figure 97. MEXICO ELEMENTAL BORON MARKET ANALYSIS BY END USE 
    655.   Figure 98. MEXICO ELEMENTAL BORON MARKET ANALYSIS BY FORM 
    656.   Figure 99. MEXICO ELEMENTAL BORON MARKET ANALYSIS BY PURITY LEVEL 
    657.   Figure 100. MEXICO ELEMENTAL BORON MARKET ANALYSIS BY REGIONAL 
    658.   Figure 101. ARGENTINA ELEMENTAL BORON MARKET ANALYSIS BY APPLICATION 
    659.   Figure 102. ARGENTINA ELEMENTAL BORON MARKET ANALYSIS BY END USE 
    660.   Figure 103. ARGENTINA ELEMENTAL BORON MARKET ANALYSIS BY FORM 
    661.   Figure 104. ARGENTINA ELEMENTAL BORON MARKET ANALYSIS BY PURITY LEVEL 
    662.   Figure 105. ARGENTINA ELEMENTAL BORON MARKET ANALYSIS BY REGIONAL 
    663.   Figure 106. REST OF SOUTH AMERICA ELEMENTAL BORON MARKET ANALYSIS BY APPLICATION 
    664.   Figure 107. REST OF SOUTH AMERICA ELEMENTAL BORON MARKET ANALYSIS BY END
    665. USE 
    666.     Figure 108. REST OF SOUTH AMERICA ELEMENTAL
    667. BORON MARKET ANALYSIS BY FORM 
    668.     Figure 109. REST
    669. OF SOUTH AMERICA ELEMENTAL BORON MARKET ANALYSIS BY PURITY LEVEL 
    670.   Figure 110. REST OF SOUTH AMERICA ELEMENTAL BORON MARKET ANALYSIS BY REGIONAL 
    671.   Figure 111. MEA ELEMENTAL BORON MARKET ANALYSIS 
    672.   Figure 112. GCC COUNTRIES ELEMENTAL BORON MARKET ANALYSIS BY APPLICATION 
    673.   Figure 113. GCC COUNTRIES ELEMENTAL BORON MARKET ANALYSIS BY END USE 
    674.   Figure 114. GCC COUNTRIES ELEMENTAL BORON MARKET ANALYSIS BY FORM 
    675.   Figure 115. GCC COUNTRIES ELEMENTAL BORON MARKET ANALYSIS BY PURITY LEVEL 
    676.   Figure 116. GCC COUNTRIES ELEMENTAL BORON MARKET ANALYSIS BY REGIONAL 
    677.   Figure 117. SOUTH AFRICA ELEMENTAL BORON MARKET ANALYSIS BY APPLICATION 
    678.   Figure 118. SOUTH AFRICA ELEMENTAL BORON MARKET ANALYSIS BY END USE 
    679.   Figure 119. SOUTH AFRICA ELEMENTAL BORON MARKET ANALYSIS BY FORM 
    680.   Figure 120. SOUTH AFRICA ELEMENTAL BORON MARKET ANALYSIS BY PURITY LEVEL 
    681.   Figure 121. SOUTH AFRICA ELEMENTAL BORON MARKET ANALYSIS BY REGIONAL 
    682.   Figure 122. REST OF MEA ELEMENTAL BORON MARKET ANALYSIS BY APPLICATION 
    683.   Figure 123. REST OF MEA ELEMENTAL BORON MARKET ANALYSIS BY END USE 
    684.   Figure 124. REST OF MEA ELEMENTAL BORON MARKET ANALYSIS BY FORM 
    685.   Figure 125. REST OF MEA ELEMENTAL BORON MARKET ANALYSIS BY PURITY LEVEL 
    686.   Figure 126. REST OF MEA ELEMENTAL BORON MARKET ANALYSIS BY REGIONAL 
    687.   Figure 127. KEY BUYING CRITERIA OF ELEMENTAL BORON MARKET 
    688.   Figure 128. RESEARCH PROCESS OF MRFR 
    689.     Figure
    690. DRO ANALYSIS OF ELEMENTAL BORON MARKET 
    691.     Figure
    692. DRIVERS IMPACT ANALYSIS: ELEMENTAL BORON MARKET 
    693.   Figure 131. RESTRAINTS IMPACT ANALYSIS: ELEMENTAL BORON MARKET 
    694.   Figure 132. SUPPLY / VALUE CHAIN: ELEMENTAL BORON MARKET 
    695.   Figure 133. ELEMENTAL BORON MARKET, BY APPLICATION, 2024 (% SHARE) 
    696.   Figure 134. ELEMENTAL BORON MARKET, BY APPLICATION, 2025 to 2034 (USD Billions) 
    697.   Figure 135. ELEMENTAL BORON MARKET, BY END USE, 2024 (% SHARE) 
    698.   Figure 136. ELEMENTAL BORON MARKET, BY END USE, 2025 to 2034 (USD Billions) 
    699.   Figure 137. ELEMENTAL BORON MARKET, BY FORM, 2024 (% SHARE) 
    700.   Figure 138. ELEMENTAL BORON MARKET, BY FORM, 2025 to 2034 (USD Billions) 
    701.   Figure 139. ELEMENTAL BORON MARKET, BY PURITY LEVEL, 2024 (% SHARE) 
    702.   Figure 140. ELEMENTAL BORON MARKET, BY PURITY LEVEL, 2025 to 2034 (USD Billions) 
    703.   Figure 141. ELEMENTAL BORON MARKET, BY REGIONAL, 2024 (% SHARE) 
    704.   Figure 142. ELEMENTAL BORON MARKET, BY REGIONAL, 2025 to 2034 (USD Billions) 
    705.   Figure 143. BENCHMARKING OF MAJOR COMPETITORS 

    Elemental Boron Market Segmentation

    Elemental Boron Market By Application (USD Billion, 2019-2032)

    • Glass and Ceramics
    • Fertilizers
    • Metallurgy
    • Nuclear Energy
    • Personal Care Products


    Elemental Boron Market By End Use (USD Billion, 2019-2032)

    • Agriculture
    • Automotive
    • Electronics
    • Construction
    • Healthcare


    Elemental Boron Market By Form (USD Billion, 2019-2032)

    • Powder
    • Granule
    • Liquid
    • Paste


    Elemental Boron Market By Purity Level (USD Billion, 2019-2032)

    • Low Purity Boron
    • Medium Purity Boron
    • High Purity Boron


    Elemental Boron Market By Regional (USD Billion, 2019-2032)

    • North America
    • Europe
    • South America
    • Asia Pacific
    • Middle East and Africa

    Elemental Boron Market Regional Outlook (USD Billion, 2019-2032)


    • North America Outlook (USD Billion, 2019-2032)

      • North America Elemental Boron Market by Application Type

        • Glass and Ceramics
        • Fertilizers
        • Metallurgy
        • Nuclear Energy
        • Personal Care Products
      • North America Elemental Boron Market by End Use Type

        • Agriculture
        • Automotive
        • Electronics
        • Construction
        • Healthcare
      • North America Elemental Boron Market by Form Type

        • Powder
        • Granule
        • Liquid
        • Paste
      • North America Elemental Boron Market by Purity Level Type

        • Low Purity Boron
        • Medium Purity Boron
        • High Purity Boron
      • North America Elemental Boron Market by Regional Type

        • US
        • Canada
      • US Outlook (USD Billion, 2019-2032)
      • US Elemental Boron Market by Application Type

        • Glass and Ceramics
        • Fertilizers
        • Metallurgy
        • Nuclear Energy
        • Personal Care Products
      • US Elemental Boron Market by End Use Type

        • Agriculture
        • Automotive
        • Electronics
        • Construction
        • Healthcare
      • US Elemental Boron Market by Form Type

        • Powder
        • Granule
        • Liquid
        • Paste
      • US Elemental Boron Market by Purity Level Type

        • Low Purity Boron
        • Medium Purity Boron
        • High Purity Boron
      • CANADA Outlook (USD Billion, 2019-2032)
      • CANADA Elemental Boron Market by Application Type

        • Glass and Ceramics
        • Fertilizers
        • Metallurgy
        • Nuclear Energy
        • Personal Care Products
      • CANADA Elemental Boron Market by End Use Type

        • Agriculture
        • Automotive
        • Electronics
        • Construction
        • Healthcare
      • CANADA Elemental Boron Market by Form Type

        • Powder
        • Granule
        • Liquid
        • Paste
      • CANADA Elemental Boron Market by Purity Level Type

        • Low Purity Boron
        • Medium Purity Boron
        • High Purity Boron
    • Europe Outlook (USD Billion, 2019-2032)

      • Europe Elemental Boron Market by Application Type

        • Glass and Ceramics
        • Fertilizers
        • Metallurgy
        • Nuclear Energy
        • Personal Care Products
      • Europe Elemental Boron Market by End Use Type

        • Agriculture
        • Automotive
        • Electronics
        • Construction
        • Healthcare
      • Europe Elemental Boron Market by Form Type

        • Powder
        • Granule
        • Liquid
        • Paste
      • Europe Elemental Boron Market by Purity Level Type

        • Low Purity Boron
        • Medium Purity Boron
        • High Purity Boron
      • Europe Elemental Boron Market by Regional Type

        • Germany
        • UK
        • France
        • Russia
        • Italy
        • Spain
        • Rest of Europe
      • GERMANY Outlook (USD Billion, 2019-2032)
      • GERMANY Elemental Boron Market by Application Type

        • Glass and Ceramics
        • Fertilizers
        • Metallurgy
        • Nuclear Energy
        • Personal Care Products
      • GERMANY Elemental Boron Market by End Use Type

        • Agriculture
        • Automotive
        • Electronics
        • Construction
        • Healthcare
      • GERMANY Elemental Boron Market by Form Type

        • Powder
        • Granule
        • Liquid
        • Paste
      • GERMANY Elemental Boron Market by Purity Level Type

        • Low Purity Boron
        • Medium Purity Boron
        • High Purity Boron
      • UK Outlook (USD Billion, 2019-2032)
      • UK Elemental Boron Market by Application Type

        • Glass and Ceramics
        • Fertilizers
        • Metallurgy
        • Nuclear Energy
        • Personal Care Products
      • UK Elemental Boron Market by End Use Type

        • Agriculture
        • Automotive
        • Electronics
        • Construction
        • Healthcare
      • UK Elemental Boron Market by Form Type

        • Powder
        • Granule
        • Liquid
        • Paste
      • UK Elemental Boron Market by Purity Level Type

        • Low Purity Boron
        • Medium Purity Boron
        • High Purity Boron
      • FRANCE Outlook (USD Billion, 2019-2032)
      • FRANCE Elemental Boron Market by Application Type

        • Glass and Ceramics
        • Fertilizers
        • Metallurgy
        • Nuclear Energy
        • Personal Care Products
      • FRANCE Elemental Boron Market by End Use Type

        • Agriculture
        • Automotive
        • Electronics
        • Construction
        • Healthcare
      • FRANCE Elemental Boron Market by Form Type

        • Powder
        • Granule
        • Liquid
        • Paste
      • FRANCE Elemental Boron Market by Purity Level Type

        • Low Purity Boron
        • Medium Purity Boron
        • High Purity Boron
      • RUSSIA Outlook (USD Billion, 2019-2032)
      • RUSSIA Elemental Boron Market by Application Type

        • Glass and Ceramics
        • Fertilizers
        • Metallurgy
        • Nuclear Energy
        • Personal Care Products
      • RUSSIA Elemental Boron Market by End Use Type

        • Agriculture
        • Automotive
        • Electronics
        • Construction
        • Healthcare
      • RUSSIA Elemental Boron Market by Form Type

        • Powder
        • Granule
        • Liquid
        • Paste
      • RUSSIA Elemental Boron Market by Purity Level Type

        • Low Purity Boron
        • Medium Purity Boron
        • High Purity Boron
      • ITALY Outlook (USD Billion, 2019-2032)
      • ITALY Elemental Boron Market by Application Type

        • Glass and Ceramics
        • Fertilizers
        • Metallurgy
        • Nuclear Energy
        • Personal Care Products
      • ITALY Elemental Boron Market by End Use Type

        • Agriculture
        • Automotive
        • Electronics
        • Construction
        • Healthcare
      • ITALY Elemental Boron Market by Form Type

        • Powder
        • Granule
        • Liquid
        • Paste
      • ITALY Elemental Boron Market by Purity Level Type

        • Low Purity Boron
        • Medium Purity Boron
        • High Purity Boron
      • SPAIN Outlook (USD Billion, 2019-2032)
      • SPAIN Elemental Boron Market by Application Type

        • Glass and Ceramics
        • Fertilizers
        • Metallurgy
        • Nuclear Energy
        • Personal Care Products
      • SPAIN Elemental Boron Market by End Use Type

        • Agriculture
        • Automotive
        • Electronics
        • Construction
        • Healthcare
      • SPAIN Elemental Boron Market by Form Type

        • Powder
        • Granule
        • Liquid
        • Paste
      • SPAIN Elemental Boron Market by Purity Level Type

        • Low Purity Boron
        • Medium Purity Boron
        • High Purity Boron
      • REST OF EUROPE Outlook (USD Billion, 2019-2032)
      • REST OF EUROPE Elemental Boron Market by Application Type

        • Glass and Ceramics
        • Fertilizers
        • Metallurgy
        • Nuclear Energy
        • Personal Care Products
      • REST OF EUROPE Elemental Boron Market by End Use Type

        • Agriculture
        • Automotive
        • Electronics
        • Construction
        • Healthcare
      • REST OF EUROPE Elemental Boron Market by Form Type

        • Powder
        • Granule
        • Liquid
        • Paste
      • REST OF EUROPE Elemental Boron Market by Purity Level Type

        • Low Purity Boron
        • Medium Purity Boron
        • High Purity Boron
    • APAC Outlook (USD Billion, 2019-2032)

      • APAC Elemental Boron Market by Application Type

        • Glass and Ceramics
        • Fertilizers
        • Metallurgy
        • Nuclear Energy
        • Personal Care Products
      • APAC Elemental Boron Market by End Use Type

        • Agriculture
        • Automotive
        • Electronics
        • Construction
        • Healthcare
      • APAC Elemental Boron Market by Form Type

        • Powder
        • Granule
        • Liquid
        • Paste
      • APAC Elemental Boron Market by Purity Level Type

        • Low Purity Boron
        • Medium Purity Boron
        • High Purity Boron
      • APAC Elemental Boron Market by Regional Type

        • China
        • India
        • Japan
        • South Korea
        • Malaysia
        • Thailand
        • Indonesia
        • Rest of APAC
      • CHINA Outlook (USD Billion, 2019-2032)
      • CHINA Elemental Boron Market by Application Type

        • Glass and Ceramics
        • Fertilizers
        • Metallurgy
        • Nuclear Energy
        • Personal Care Products
      • CHINA Elemental Boron Market by End Use Type

        • Agriculture
        • Automotive
        • Electronics
        • Construction
        • Healthcare
      • CHINA Elemental Boron Market by Form Type

        • Powder
        • Granule
        • Liquid
        • Paste
      • CHINA Elemental Boron Market by Purity Level Type

        • Low Purity Boron
        • Medium Purity Boron
        • High Purity Boron
      • INDIA Outlook (USD Billion, 2019-2032)
      • INDIA Elemental Boron Market by Application Type

        • Glass and Ceramics
        • Fertilizers
        • Metallurgy
        • Nuclear Energy
        • Personal Care Products
      • INDIA Elemental Boron Market by End Use Type

        • Agriculture
        • Automotive
        • Electronics
        • Construction
        • Healthcare
      • INDIA Elemental Boron Market by Form Type

        • Powder
        • Granule
        • Liquid
        • Paste
      • INDIA Elemental Boron Market by Purity Level Type

        • Low Purity Boron
        • Medium Purity Boron
        • High Purity Boron
      • JAPAN Outlook (USD Billion, 2019-2032)
      • JAPAN Elemental Boron Market by Application Type

        • Glass and Ceramics
        • Fertilizers
        • Metallurgy
        • Nuclear Energy
        • Personal Care Products
      • JAPAN Elemental Boron Market by End Use Type

        • Agriculture
        • Automotive
        • Electronics
        • Construction
        • Healthcare
      • JAPAN Elemental Boron Market by Form Type

        • Powder
        • Granule
        • Liquid
        • Paste
      • JAPAN Elemental Boron Market by Purity Level Type

        • Low Purity Boron
        • Medium Purity Boron
        • High Purity Boron
      • SOUTH KOREA Outlook (USD Billion, 2019-2032)
      • SOUTH KOREA Elemental Boron Market by Application Type

        • Glass and Ceramics
        • Fertilizers
        • Metallurgy
        • Nuclear Energy
        • Personal Care Products
      • SOUTH KOREA Elemental Boron Market by End Use Type

        • Agriculture
        • Automotive
        • Electronics
        • Construction
        • Healthcare
      • SOUTH KOREA Elemental Boron Market by Form Type

        • Powder
        • Granule
        • Liquid
        • Paste
      • SOUTH KOREA Elemental Boron Market by Purity Level Type

        • Low Purity Boron
        • Medium Purity Boron
        • High Purity Boron
      • MALAYSIA Outlook (USD Billion, 2019-2032)
      • MALAYSIA Elemental Boron Market by Application Type

        • Glass and Ceramics
        • Fertilizers
        • Metallurgy
        • Nuclear Energy
        • Personal Care Products
      • MALAYSIA Elemental Boron Market by End Use Type

        • Agriculture
        • Automotive
        • Electronics
        • Construction
        • Healthcare
      • MALAYSIA Elemental Boron Market by Form Type

        • Powder
        • Granule
        • Liquid
        • Paste
      • MALAYSIA Elemental Boron Market by Purity Level Type

        • Low Purity Boron
        • Medium Purity Boron
        • High Purity Boron
      • THAILAND Outlook (USD Billion, 2019-2032)
      • THAILAND Elemental Boron Market by Application Type

        • Glass and Ceramics
        • Fertilizers
        • Metallurgy
        • Nuclear Energy
        • Personal Care Products
      • THAILAND Elemental Boron Market by End Use Type

        • Agriculture
        • Automotive
        • Electronics
        • Construction
        • Healthcare
      • THAILAND Elemental Boron Market by Form Type

        • Powder
        • Granule
        • Liquid
        • Paste
      • THAILAND Elemental Boron Market by Purity Level Type

        • Low Purity Boron
        • Medium Purity Boron
        • High Purity Boron
      • INDONESIA Outlook (USD Billion, 2019-2032)
      • INDONESIA Elemental Boron Market by Application Type

        • Glass and Ceramics
        • Fertilizers
        • Metallurgy
        • Nuclear Energy
        • Personal Care Products
      • INDONESIA Elemental Boron Market by End Use Type

        • Agriculture
        • Automotive
        • Electronics
        • Construction
        • Healthcare
      • INDONESIA Elemental Boron Market by Form Type

        • Powder
        • Granule
        • Liquid
        • Paste
      • INDONESIA Elemental Boron Market by Purity Level Type

        • Low Purity Boron
        • Medium Purity Boron
        • High Purity Boron
      • REST OF APAC Outlook (USD Billion, 2019-2032)
      • REST OF APAC Elemental Boron Market by Application Type

        • Glass and Ceramics
        • Fertilizers
        • Metallurgy
        • Nuclear Energy
        • Personal Care Products
      • REST OF APAC Elemental Boron Market by End Use Type

        • Agriculture
        • Automotive
        • Electronics
        • Construction
        • Healthcare
      • REST OF APAC Elemental Boron Market by Form Type

        • Powder
        • Granule
        • Liquid
        • Paste
      • REST OF APAC Elemental Boron Market by Purity Level Type

        • Low Purity Boron
        • Medium Purity Boron
        • High Purity Boron
    • South America Outlook (USD Billion, 2019-2032)

      • South America Elemental Boron Market by Application Type

        • Glass and Ceramics
        • Fertilizers
        • Metallurgy
        • Nuclear Energy
        • Personal Care Products
      • South America Elemental Boron Market by End Use Type

        • Agriculture
        • Automotive
        • Electronics
        • Construction
        • Healthcare
      • South America Elemental Boron Market by Form Type

        • Powder
        • Granule
        • Liquid
        • Paste
      • South America Elemental Boron Market by Purity Level Type

        • Low Purity Boron
        • Medium Purity Boron
        • High Purity Boron
      • South America Elemental Boron Market by Regional Type

        • Brazil
        • Mexico
        • Argentina
        • Rest of South America
      • BRAZIL Outlook (USD Billion, 2019-2032)
      • BRAZIL Elemental Boron Market by Application Type

        • Glass and Ceramics
        • Fertilizers
        • Metallurgy
        • Nuclear Energy
        • Personal Care Products
      • BRAZIL Elemental Boron Market by End Use Type

        • Agriculture
        • Automotive
        • Electronics
        • Construction
        • Healthcare
      • BRAZIL Elemental Boron Market by Form Type

        • Powder
        • Granule
        • Liquid
        • Paste
      • BRAZIL Elemental Boron Market by Purity Level Type

        • Low Purity Boron
        • Medium Purity Boron
        • High Purity Boron
      • MEXICO Outlook (USD Billion, 2019-2032)
      • MEXICO Elemental Boron Market by Application Type

        • Glass and Ceramics
        • Fertilizers
        • Metallurgy
        • Nuclear Energy
        • Personal Care Products
      • MEXICO Elemental Boron Market by End Use Type

        • Agriculture
        • Automotive
        • Electronics
        • Construction
        • Healthcare
      • MEXICO Elemental Boron Market by Form Type

        • Powder
        • Granule
        • Liquid
        • Paste
      • MEXICO Elemental Boron Market by Purity Level Type

        • Low Purity Boron
        • Medium Purity Boron
        • High Purity Boron
      • ARGENTINA Outlook (USD Billion, 2019-2032)
      • ARGENTINA Elemental Boron Market by Application Type

        • Glass and Ceramics
        • Fertilizers
        • Metallurgy
        • Nuclear Energy
        • Personal Care Products
      • ARGENTINA Elemental Boron Market by End Use Type

        • Agriculture
        • Automotive
        • Electronics
        • Construction
        • Healthcare
      • ARGENTINA Elemental Boron Market by Form Type

        • Powder
        • Granule
        • Liquid
        • Paste
      • ARGENTINA Elemental Boron Market by Purity Level Type

        • Low Purity Boron
        • Medium Purity Boron
        • High Purity Boron
      • REST OF SOUTH AMERICA Outlook (USD Billion, 2019-2032)
      • REST OF SOUTH AMERICA Elemental Boron Market by Application Type

        • Glass and Ceramics
        • Fertilizers
        • Metallurgy
        • Nuclear Energy
        • Personal Care Products
      • REST OF SOUTH AMERICA Elemental Boron Market by End Use Type

        • Agriculture
        • Automotive
        • Electronics
        • Construction
        • Healthcare
      • REST OF SOUTH AMERICA Elemental Boron Market by Form Type

        • Powder
        • Granule
        • Liquid
        • Paste
      • REST OF SOUTH AMERICA Elemental Boron Market by Purity Level Type

        • Low Purity Boron
        • Medium Purity Boron
        • High Purity Boron
    • MEA Outlook (USD Billion, 2019-2032)

      • MEA Elemental Boron Market by Application Type

        • Glass and Ceramics
        • Fertilizers
        • Metallurgy
        • Nuclear Energy
        • Personal Care Products
      • MEA Elemental Boron Market by End Use Type

        • Agriculture
        • Automotive
        • Electronics
        • Construction
        • Healthcare
      • MEA Elemental Boron Market by Form Type

        • Powder
        • Granule
        • Liquid
        • Paste
      • MEA Elemental Boron Market by Purity Level Type

        • Low Purity Boron
        • Medium Purity Boron
        • High Purity Boron
      • MEA Elemental Boron Market by Regional Type

        • GCC Countries
        • South Africa
        • Rest of MEA
      • GCC COUNTRIES Outlook (USD Billion, 2019-2032)
      • GCC COUNTRIES Elemental Boron Market by Application Type

        • Glass and Ceramics
        • Fertilizers
        • Metallurgy
        • Nuclear Energy
        • Personal Care Products
      • GCC COUNTRIES Elemental Boron Market by End Use Type

        • Agriculture
        • Automotive
        • Electronics
        • Construction
        • Healthcare
      • GCC COUNTRIES Elemental Boron Market by Form Type

        • Powder
        • Granule
        • Liquid
        • Paste
      • GCC COUNTRIES Elemental Boron Market by Purity Level Type

        • Low Purity Boron
        • Medium Purity Boron
        • High Purity Boron
      • SOUTH AFRICA Outlook (USD Billion, 2019-2032)
      • SOUTH AFRICA Elemental Boron Market by Application Type

        • Glass and Ceramics
        • Fertilizers
        • Metallurgy
        • Nuclear Energy
        • Personal Care Products
      • SOUTH AFRICA Elemental Boron Market by End Use Type

        • Agriculture
        • Automotive
        • Electronics
        • Construction
        • Healthcare
      • SOUTH AFRICA Elemental Boron Market by Form Type

        • Powder
        • Granule
        • Liquid
        • Paste
      • SOUTH AFRICA Elemental Boron Market by Purity Level Type

        • Low Purity Boron
        • Medium Purity Boron
        • High Purity Boron
      • REST OF MEA Outlook (USD Billion, 2019-2032)
      • REST OF MEA Elemental Boron Market by Application Type

        • Glass and Ceramics
        • Fertilizers
        • Metallurgy
        • Nuclear Energy
        • Personal Care Products
      • REST OF MEA Elemental Boron Market by End Use Type

        • Agriculture
        • Automotive
        • Electronics
        • Construction
        • Healthcare
      • REST OF MEA Elemental Boron Market by Form Type

        • Powder
        • Granule
        • Liquid
        • Paste
      • REST OF MEA Elemental Boron Market by Purity Level Type

        • Low Purity Boron
        • Medium Purity Boron
        • High Purity Boron


    Report Infographic
    Free Sample Request

    Kindly complete the form below to receive a free sample of this Report

    Customer Strories

    “I am very pleased with how market segments have been defined in a relevant way for my purposes (such as "Portable Freezers & refrigerators" and "last-mile"). In general the report is well structured. Thanks very much for your efforts.”

    Victoria Milne Founder
    Case Study

    Chemicals and Materials