• Cat-intel
  • MedIntelliX
  • Resources
  • About Us
  • Request Free Sample ×

    Kindly complete the form below to receive a free sample of this Report

    Leading companies partner with us for data-driven Insights

    clients tt-cursor

    Electronic Toll Collection Market

    ID: MRFR/SEM/3536-CR
    200 Pages
    Shubham Munde
    July 2025

    Electronic Toll Collection Market Research Report By Technology (Radio Frequency Identification, Automatic Number Plate Recognition, Smartphone Applications, Contactless Payment Systems), By Component (On-Board Units, Back Office Systems, Roadside Equipment, Payment Processing Solutions), By Application (Highway Tolling, Urban Tolling, Congestion Pricing), By End Use (Government, Private Operators, Transport Authorities) and By Regional (North America, Europe, South America, Asia Pacific, Middle East and Africa) - Forecast to 2035

    Share:
    Download PDF ×

    We do not share your information with anyone. However, we may send you emails based on your report interest from time to time. You may contact us at any time to opt-out.

    Electronic Toll Collection Market Research Report -Forecast to 2035 Infographic
    Purchase Options
    $ 4,950.0
    $ 5,950.0
    $ 7,250.0
    Table of Contents

    Electronic Toll Collection Market Summary

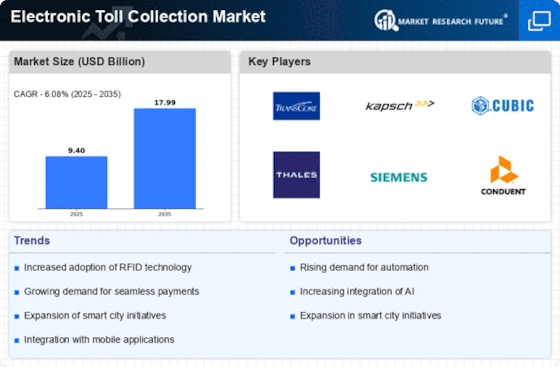
    The Global Electronic Toll Collection Market is projected to grow from 9.4 USD Billion in 2024 to 18 USD Billion by 2035.

    Key Market Trends & Highlights

    Electronic Toll Collection Key Trends and Highlights

    • The market is expected to witness a compound annual growth rate (CAGR) of 6.08 percent from 2025 to 2035.
    • By 2035, the market valuation is anticipated to reach 18 USD Billion, indicating robust growth prospects.
    • In 2024, the market is valued at 9.4 USD Billion, reflecting a strong foundation for future expansion.
    • Growing adoption of electronic toll collection systems due to increasing traffic congestion is a major market driver.

    Market Size & Forecast

    2024 Market Size 9.4 (USD Billion)
    2035 Market Size 18 (USD Billion)
    CAGR (2025-2035) 6.08%

    Major Players

    Traffic Technologies, Conduent, TagMaster, TransCore, QFree, CivicSmart, Swarco, Groupe Eurotunnel, Parker Technology, Siemens, Kapsch TrafficCom, ETC Solutions, Cubic Corporation, IBI Group, Thales Group

    Electronic Toll Collection Market Trends

    The future of the Electronic Toll Collection Market is being influenced by a number of significant trends. The increasing demand for efficient traffic flow management and the increase in vehicle ownership are the primary market drivers. Governments are actively pursuing solutions to reduce delays and enhance transportation efficacy as urban areas become more congested.

    The efficacy of electronic toll systems is being improved by the implementation of advanced technologies, including automatic number plate recognition (ANPR) and radio frequency identification (RFID). This change facilitates more efficient traffic flow while simultaneously decreasing the operational expenses associated with manual toll collection systems.

    Particularly in the integration of electronic toll systems with smart city initiatives, there are substantial opportunities to be investigated. Electronic toll collection has the potential to be a critical component of data-driven transportation administration as communities worldwide invest in smart infrastructure.

    Additionally, the growing prevalence of contactless payment methods fosters collaboration between mobile payment platforms and toll operators, thereby improving the convenience of transactions for users. There is a growing emphasis on sustainability and environmental impact in recent years, as numerous jurisdictions are striving to reduce emissions and encourage eco-friendly transportation practices.

    Sustainability objectives are being integrated into electronic toll systems, which is consistent with global initiatives to mitigate climate change. Efficient electronic tolling is essential for the transition to more sustainable public transport models, as it can reduce congestion and contribute to reduced carbon footprints.

    In general, the Electronic Toll Collection Market is undergoing a transformation as a result of technological advancements, evolving consumer preferences, and a growing consciousness of environmental sustainability. These trends and opportunities clearly establish the market for substantial future growth on a global scale, which is consistent with international transportation objectives.

    Source: Primary Research, Secondary Research, MRFR Database and Analyst Review

    The ongoing evolution of smart transportation infrastructure is likely to drive the adoption of electronic toll collection systems, enhancing efficiency and reducing congestion on roadways.

    U.S. Department of Transportation

    Electronic Toll Collection Market Drivers

    Market Growth Projection Chart

    Government Initiatives and Investments

    Governments worldwide are increasingly investing in electronic toll collection systems as part of broader infrastructure improvements. Initiatives aimed at modernizing transportation networks often include the implementation of electronic tolling to enhance revenue collection and improve traffic flow. For instance, various countries have allocated substantial budgets for upgrading tolling infrastructure, which is expected to contribute to the Global Electronic Toll Collection Market Industry's growth. By 2035, the market is anticipated to expand to 18 USD Billion, driven by these governmental efforts to streamline toll collection processes and enhance user experiences.

    Rising Adoption of Smart City Initiatives

    The Global Electronic Toll Collection Market Industry is closely linked to the rise of smart city initiatives. As urban areas strive to become more connected and efficient, electronic tolling systems are increasingly viewed as essential components of smart transportation networks. These systems facilitate data collection and analysis, enabling cities to optimize traffic management and reduce congestion. The integration of electronic tolling within smart city frameworks not only enhances operational efficiency but also improves the overall travel experience for residents and visitors alike. This trend is likely to bolster market growth as cities invest in technology-driven solutions.

    Increasing Demand for Efficient Transportation

    The Global Electronic Toll Collection Market Industry is experiencing a surge in demand for efficient transportation solutions. As urban populations grow, the need for seamless travel experiences becomes paramount. Electronic toll collection systems facilitate quicker transit times by reducing congestion at toll booths. This efficiency is particularly evident in regions with high traffic volumes, where traditional toll collection methods can lead to significant delays. The market is projected to reach 9.4 USD Billion in 2024, reflecting a growing recognition of the benefits of electronic systems in enhancing mobility and reducing travel times.

    Environmental Concerns and Sustainability Goals

    Environmental sustainability is becoming a pivotal driver for the Global Electronic Toll Collection Market Industry. As concerns over pollution and carbon emissions rise, many regions are adopting electronic tolling as a means to promote greener transportation practices. By reducing idle times at toll booths, electronic systems contribute to lower emissions and improved air quality. Additionally, governments are increasingly implementing policies that encourage the use of electronic tolling to support sustainability goals. This alignment with environmental objectives is expected to further propel market growth, as stakeholders recognize the dual benefits of efficiency and ecological responsibility.

    Technological Advancements in Tolling Solutions

    Technological innovations play a crucial role in the evolution of the Global Electronic Toll Collection Market Industry. The integration of advanced technologies such as RFID, GPS, and mobile applications has transformed how tolls are collected and managed. These advancements not only improve the accuracy of toll collection but also enhance user convenience through features like real-time notifications and automated payments. As technology continues to evolve, it is likely that the market will see further enhancements, potentially leading to a compound annual growth rate of 6.08% from 2025 to 2035, as stakeholders seek to adopt the latest solutions.

    Market Segment Insights

    Electronic Toll Collection Market Technology Insights

    The Electronic Toll Collection Market within the Technology segment is evolving rapidly, with significant contributions from various technologies crucial to streamlining toll collection processes across highways and urban areas. It was valued at 9.4 USD Billion in 2024 and is projected to progress with a notable CAGR, showcasing an increasing adoption driven by rising urbanization and the need for efficient traffic management solutions.

    Among the technologies, Radio Frequency Identification (RFID) is a prominent force, reached 3.5 USD Billion in 2024 and doubling its value to 7.0 USD Billion by 2035, serving as the backbone of many electronic tolling systems due to its speed and accuracy in collecting tolls remotely.Automatic Number Plate Recognition (ANPR) technology, valued at 2.5 USD Billion in 2024 and accelerating to 4.5 USD Billion by 2035, is also critical, facilitating the swift identification of vehicles for billing purposes, thereby enhancing operational efficiency.

    Smartphone Applications are gaining traction as well, with a initial valuation of 2.0 USD Billion in 2024, making them significant in enhancing user experience through seamless payment methods and real-time notifications related to toll charges, expected to grow to 3.5 USD Billion by 2035.Contactless Payment Systems are witnessing an upward trajectory with a valuation of 1.4 USD Billion in 2024 and anticipated to expand to 3.0 USD Billion in 2035, reflecting the global trend towards cashless transactions and the convenience it offers to users.

    Each of these technologies plays a substantial role in reshaping toll collection by boosting operational efficiency and improving user experience, as evidenced by broader trends in smart city initiatives and digital payment solutions, making them integral components of the electronic toll collection landscape.The demand for effective and technologically advanced toll collection has risen due to government initiatives aimed at reducing traffic congestion and enhancing revenue collection, thereby ensuring that these technological advancements are not only pivotal but essential in the current and future landscapes of toll management worldwide.

    Source: Primary Research, Secondary Research, MRFR Database and Analyst Review

    Electronic Toll Collection Market Component Insights

    The Electronic Toll Collection Market, with a projected valuation of 9.4 billion USD in 2024, plays a critical role in modern transportation infrastructure, segmented notably by Component. This segment encompasses key elements such as On-Board Units, Back Office Systems, Roadside Equipment, and Payment Processing Solutions, each contributing uniquely to the tolling ecosystem. On-Board Units facilitate seamless communication and data transfer between vehicles and tolling systems, enhancing user experience and efficiency. Back Office Systems manage data analytics and reporting, driving operational effectiveness.Roadside Equipment, including gantries and sensors, is vital for real-time vehicle detection and toll collection, ensuring accurate revenue generation.

    Meanwhile, Payment Processing Solutions streamline transactions and drive customer satisfaction through various payment options. The growth of this segment is fueled by increasing urbanization and the need for efficient traffic management solutions globally. As cities and governments prioritize smart infrastructure, the demand for advanced electronic toll collection systems becomes evident, highlighting the significance of each component in achieving seamless transportation experiences and improved operational efficiencies.

    Electronic Toll Collection Market Application Insights

    The Electronic Toll Collection Market, reached a valuation of 9.4 USD Billion in 2024, encompasses various applications that greatly impact its dynamics and overall growth. The segmentation includes Highway Tolling, Urban Tolling, and Congestion Pricing, each playing a critical role in the market landscape. Highway Tolling is significant due to the increasing need for efficient vehicle flow on major roadways, while Urban Tolling addresses the challenges of traffic congestion in metropolitan areas, leading to better management of urban mobility.Congestion Pricing has gained traction as a key strategy for promoting sustainable transportation and reducing environmental impacts.

    Collectively, these applications leverage advancements in technology to enhance operational efficiency and user convenience. The Electronic Toll Collection Market statistics reflect a growing trend in adopting innovative tolling solutions, driven by the rise in vehicular traffic and government initiatives aimed at modernizing transportation infrastructure. With urbanization increasing globally, the importance of these applications continues to rise, presenting ample opportunities for growth in the industry as authorities seek to implement smart tolling systems that optimize traffic management and improve road safety.

    Electronic Toll Collection Market End Use Insights

    The Electronic Toll Collection Market is poised for significant growth, with reached a valuation of 9.4 USD Billion in 2024. Within this dynamic market, the End Use segment plays a pivotal role, encompassing various entities including Government, Private Operators, and Transport Authorities. Governments worldwide are increasingly adopting electronic toll collection systems to improve traffic management and generate revenue more efficiently; this strategy is crucial for infrastructure upkeep and expansion.

    On the other hand, Private Operators contribute significantly by offering diverse tolling solutions tailored to customer needs, enhancing operational efficiency and user experience.Transport Authorities also benefit immensely from electronic toll systems, allowing for better data analytics and improved traffic flow management. The demand for seamless tolling solutions and advancements in technology are driving the Electronic Toll Collection Market revenue upward, with expected growth trends indicating a steady increase in adoption by these end users.

    As the market evolves, the integration of innovative technologies and strategic collaborations will play an essential role in addressing challenges such as system interoperability and data security, thereby unlocking considerable opportunities for all stakeholders involved.

    Get more detailed insights about Electronic Toll Collection Market Research Report -Forecast to 2035

    Regional Insights

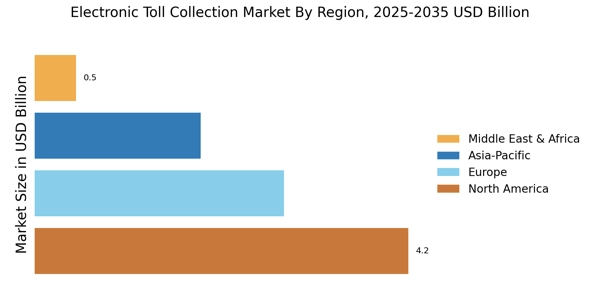
    The Electronic Toll Collection Market is poised for significant growth across various regions, with the total market valued at 9.4 USD Billion in 2024. North America emerged as a dominant player, with a valuation of 3.0 USD Billion in 2024 and projected to reach 6.0 USD Billion by 2035, driven by extensive highway infrastructure and advanced technological adoption.

    Europe follows closely, valued at 2.5 USD Billion in 2024, reflecting a growing emphasis on smart transportation solutions, and is expected to reach 4.5 USD Billion in 2035.Asia Pacific displays substantial market potential as well, valued at 2.5 USD Billion in 2024, with rapid urbanization and increased vehicle ownership propelling its growth to 4.8 USD Billion in 2035. South America holds a smaller share at 1.0 USD Billion in 2024, but it shows a steady increase driven by improving toll collection systems.

    Lastly, the Middle East and Africa, though presently valued at only 0.4 USD Billion in 2024, is anticipated to persistently develop its infrastructure, reaching 0.7 USD Billion by 2035. This varied regional landscape showcases the diverse market dynamics and opportunities inherent within the Electronic Toll Collection Market, with different areas emphasizing distinct growth drivers and technological advancements.

    Electronic Toll Collection Market Regional Insights

    Source: Primary Research, Secondary Research, MRFR Database and Analyst Review

    Key Players and Competitive Insights

    The Electronic Toll Collection Market has witnessed significant growth in recent years, driven by the increasing need for efficient traffic management and the rising demand for automated toll collection systems. The competitive landscape of this market is marked by the presence of several key players striving to enhance their market share through innovation, strategic partnerships, and technological advancements. Companies are increasingly focusing on providing cutting-edge solutions that integrate advanced sensors, cloud computing, and mobile technology to facilitate seamless toll collection processes.

    The market is characterized by rapid developments in payment systems, with many players adopting contactless and mobile payment options to meet the evolving expectations of consumers. The competitive dynamics in this sector also involve tackling regulatory challenges and the need for compliance with various standards which can influence the overall market strategy of these key players.Traffic Technologies has established itself as a formidable competitor in the Electronic Toll Collection Market, known for its innovative solutions that encompass a diverse range of tolling technologies.

    The company has a strong market presence, providing integrated systems that enhance both operational efficiency and user experience. One of the biggest strengths of Traffic Technologies lies in its ability to deliver customized solutions that cater not only to the needs of transportation authorities but also to users, ensuring that toll operations are smooth and efficient.

    The company's focus on research and development has led to the creation of user-friendly interfaces and robust back-end systems, which are pivotal in improving customer satisfaction and driving greater adoption of electronic tolling solutions across various regions.Conduent has solidified its position in the Electronic Toll Collection Market by offering a wide array of services that encompass tolling operations, operational management, and advanced analytics solutions. The company is recognized for its key products that leverage advanced technology to support automated toll collection and payment processing systems.

    Conduent has a strong market presence with numerous contracts and collaborations worldwide, reflecting its capability to cater to large-scale toll systems.

    Strengths of Conduent include its innovative approach to leveraging data analytics for improved operational efficiency and enhanced customer insights. The company has pursued strategic mergers and acquisitions that bolster its service offerings in the electronic tolling space, allowing it to expand its capabilities and better meet the needs of transportation authorities globally. Additionally, Conduent's emphasis on developing adaptive solutions has positioned it to effectively respond to the dynamic requirements of this fast-evolving market.

    Key Companies in the Electronic Toll Collection Market market include

    Industry Developments

    In recent months, the Electronic Toll Collection Market has witnessed increased activity, particularly with advancements in technology and growth in user adoption. Jabil Inc. is indeed expanding; however, the company's primary focus is on strategic growth in photonics, AI infrastructure, and sustainable operations, rather than explicit "sustainable electronics manufacturing processes." Jabil announced the establishment of a new photonics factory in Gujarat, India, in March 2025.

    The facility will support silicon photonics and co-packaged optics, and it was established in accordance with an MoU that was signed in November 2024. In March 2025, they also published a Sustainability Progress Report for FY 2024, which included a 46% decrease in GHG emissions from 2019 levels, landfill diversion milestones, the acquisition of Mikros Technologies for energy-efficient liquid refrigeration, and the membership of the Circular Electronics Partnership.Universal Scientific Industrial (USI) has experienced growth as a result of the increasing demand for high-performance computing modules, particularly in the server and networking sectors.

    However, the majority of this growth is associated with 5G and networking infrastructure, rather than HPC alone. There were no recent announcements that were specifically relevant to that context.In September 2023, Foxconn Technology Group did not acquire a controlling stake in a local semiconductor firm. In July 2023, Foxconn terminated its joint venture with Vedanta and redirected its attention to the mobile and component assembly facilities in Chennai, Bangalore, and Hyderabad in India. They have ongoing investments; however, there has been no confirmed acquisition of a local semiconductor stake.

    Future Outlook

    Electronic Toll Collection Market Future Outlook

    The Electronic Toll Collection Market is projected to grow at a 6.08% CAGR from 2024 to 2035, driven by technological advancements, increased urbanization, and government initiatives for smart transportation.

    New opportunities lie in:

    • Develop integrated payment solutions to enhance user experience and streamline toll collection processes.
    • Leverage data analytics for traffic management and optimization, improving operational efficiency.
    • Invest in cybersecurity measures to protect toll collection systems from emerging threats.

    By 2035, the Electronic Toll Collection Market is expected to be robust, reflecting substantial technological integration and user adoption.

    Market Segmentation

    Electronic Toll Collection Market End Use Outlook

    • Government
    • Private Operators
    • Transport Authorities
    • Electronic Toll Collection Market Regional Outlook

    Electronic Toll Collection Market Regional Outlook

    • North America
    • Europe
    • South America
    • Asia Pacific
    • Middle East and Africa

    Electronic Toll Collection Market Component Outlook

    • On-Board Units
    • Back Office Systems
    • Roadside Equipment
    • Payment Processing Solutions
    • Electronic Toll Collection Market Application Outlook

    Electronic Toll Collection Market Technology Outlook

    • Radio Frequency Identification
    • Automatic Number Plate Recognition
    • Smartphone Applications
    • Contactless Payment Systems
    • Electronic Toll Collection Market Component Outlook

    Electronic Toll Collection Market Application Outlook

    • Highway Tolling
    • Urban Tolling
    • Congestion Pricing
    • Electronic Toll Collection Market End Use Outlook

    Report Scope

    Report Attribute/Metric

    Details

    Market Size 2023

    8.86 (USD Billion)

    Market Size 2024

    9.4 (USD Billion)

    Market Size 2035

    18.0 (USD Billion)

    Compound Annual Growth Rate (CAGR)

    6.08% (2025 - 2035)

    Report Coverage

    Revenue Forecast, Competitive Landscape, Growth Factors, and Trends

    Base Year

    2024

    Market Forecast Period

    2025 - 2035

    Historical Data

    2019 - 2024

    Market Forecast Units

    USD Billion

    Key Companies Profiled

    Traffic Technologies, Conduent, TagMaster, TransCore, QFree, CivicSmart, Swarco, Groupe Eurotunnel, Parker Technology, Siemens, Kapsch TrafficCom, ETC Solutions, Cubic Corporation, IBI Group, Thales Group

    Segments Covered

    Technology, Component, Application, End Use, Regional

    Key Market Opportunities

    Increasing demand for cashless payments, Expansion of smart city infrastructure, Growing vehicle numbers and urbanization, Adoption of AI and IoT technology, Rising need for efficient traffic management

    Key Market Dynamics

    Technological advancements, Growing vehicle population, Increasing urbanization, Demand for efficient traffic management, Government initiatives for smart infrastructure

    Countries Covered

    North America, Europe, APAC, South America, MEA

    Market Highlights

    Author
    Shubham Munde
    Research Analyst Level II

    With a technical background in information technology & semiconductors, Shubham has 4.5+ years of experience in market research and analytics with the tasks of data mining, analysis, and project execution. He is the POC for our clients, for their consulting projects running under the ICT/Semiconductor domain. Shubham holds a Bachelor’s in Information and Technology and a Master of Business Administration (MBA). Shubham has executed over 150 research projects for our clients under the brand name Market Research Future in the last 2 years. His core skill is building the research respondent relation for gathering the primary information from industry and market estimation for niche markets. He is having expertise in conducting secondary & primary research, market estimations, market projections, competitive analysis, analysing current market trends and market dynamics, deep-dive analysis on market scenarios, consumer behaviour, technological impact analysis, consulting, analytics, etc. He has worked on fortune 500 companies' syndicate and consulting projects along with several government projects. He has worked on the projects of top tech brands such as IBM, Google, Microsoft, AWS, Meta, Oracle, Cisco Systems, Samsung, Accenture, VMware, Schneider Electric, Dell, HP, Ericsson, and so many others. He has worked on Metaverse, Web 3.0, Zero-Trust security, cyber-security, blockchain, quantum computing, robotics, 5G technology, High-Performance computing, data centers, AI, automation, IT equipment, sensors, semiconductors, consumer electronics and so many tech domain projects.

    Leave a Comment

    FAQs

    What was the expected market size of the Electronic Toll Collection Market in 2024?

    The Electronic Toll Collection Market was valued at 9.4 USD Billion in 2024.

    What is the projected market size for the Electronic Toll Collection Market by 2035?

    By 2035, the Electronic Toll Collection Market is projected to reach a value of 18.0 USD Billion.

    What is the expected compound annual growth rate (CAGR) for the Electronic Toll Collection Market from 2025 to 2035?

    The expected CAGR for the Electronic Toll Collection Market from 2025 to 2035 is 6.08%.

    Which region dominated the Electronic Toll Collection Market in 2024?

    In 2024, North America dominated the Electronic Toll Collection Market with a value of 3.0 USD Billion.

    What will the market size be for the Asia Pacific region in the Electronic Toll Collection Market by 2035?

    By 2035, the Asia Pacific region is projected to reach a market size of 4.8 USD Billion in the Electronic Toll Collection Market.

    Who are the key players in the Electronic Toll Collection Market?

    Some key players in the Electronic Toll Collection Market include Traffic Technologies, Conduent, TagMaster, and TransCore, among others.

    What was the market value for the Radio Frequency Identification technology segment in 2024?

    The Radio Frequency Identification technology segment was valued at 3.5 USD Billion in 2024.

    What is the projected market value for Automatic Number Plate Recognition technology in 2035?

    The Automatic Number Plate Recognition technology is projected to reach a market value of 4.5 USD Billion by 2035.

    What growth opportunities exist in the Electronic Toll Collection Market?

    Growth opportunities in the Electronic Toll Collection Market are driven by technological advancements and increasing demand for efficient toll collection systems.

    How will the Electronic Toll Collection Market be affected by evolving payment technologies?

    Evolving payment technologies like contactless payment systems are expected to significantly impact growth in the Electronic Toll Collection Market, enhancing user convenience.

    1. EXECUTIVE
    2. SUMMARY
    3. Market Overview
    4. Key Findings
    5. Market Segmentation
    6. Competitive Landscape
    7. Challenges and Opportunities
    8. Future Outlook
    9. MARKET INTRODUCTION
    10. Definition
    11. Scope of the study
    12. Research Objective
    13. Assumption
    14. Limitations
    15. RESEARCH
    16. METHODOLOGY
    17. Overview
    18. Data
    19. Mining
    20. Secondary Research
    21. Primary
    22. Research
    23. Primary Interviews and Information Gathering
    24. Process
    25. Breakdown of Primary Respondents
    26. Forecasting
    27. Model
    28. Market Size Estimation
    29. Bottom-Up
    30. Approach
    31. Top-Down Approach
    32. Data
    33. Triangulation
    34. Validation
    35. MARKET
    36. DYNAMICS
    37. Overview
    38. Drivers
    39. Restraints
    40. Opportunities
    41. MARKET FACTOR ANALYSIS
    42. Value chain Analysis
    43. Porter's
    44. Five Forces Analysis
    45. Bargaining Power of Suppliers
    46. Bargaining
    47. Power of Buyers
    48. Threat of New Entrants
    49. Threat
    50. of Substitutes
    51. Intensity of Rivalry
    52. COVID-19
    53. Impact Analysis
    54. Market Impact Analysis
    55. Regional
    56. Impact
    57. Opportunity and Threat Analysis
    58. Electronic
    59. Toll Collection Market, BY Technology (USD Billion)
    60. Radio
    61. Frequency Identification
    62. Automatic Number Plate Recognition
    63. Smartphone
    64. Applications
    65. Contactless Payment Systems
    66. Electronic
    67. Toll Collection Market, BY Component (USD Billion)
    68. On-Board
    69. Units
    70. Back Office Systems
    71. Roadside
    72. Equipment
    73. Payment Processing Solutions
    74. Electronic
    75. Toll Collection Market, BY Application (USD Billion)
    76. Highway
    77. Tolling
    78. Urban Tolling
    79. Congestion
    80. Pricing
    81. Electronic Toll Collection
    82. Market, BY End Use (USD Billion)
    83. Government
    84. Private
    85. Operators
    86. Transport Authorities
    87. Electronic
    88. Toll Collection Market, BY Regional (USD Billion)
    89. North
    90. America
    91. US
    92. Canada
    93. Europe
    94. Germany
    95. UK
    96. France
    97. Russia
    98. Italy
    99. Spain
    100. Rest
    101. of Europe
    102. APAC
    103. China
    104. India
    105. Japan
    106. South
    107. Korea
    108. Malaysia
    109. Thailand
    110. Indonesia
    111. Rest
    112. of APAC
    113. South America
    114. Brazil
    115. Mexico
    116. Argentina
    117. Rest
    118. of South America
    119. MEA
    120. GCC
    121. Countries
    122. South Africa
    123. Rest
    124. of MEA
    125. Competitive Landscape
    126. Overview
    127. Competitive
    128. Analysis
    129. Market share Analysis
    130. Major
    131. Growth Strategy in the Electronic Toll Collection Market
    132. Competitive
    133. Benchmarking
    134. Leading Players in Terms of Number of Developments
    135. in the Electronic Toll Collection Market
    136. Key developments
    137. and growth strategies
    138. New Product Launch/Service Deployment
    139. Merger
    140. & Acquisitions
    141. Joint Ventures
    142. Major
    143. Players Financial Matrix
    144. Sales and Operating Income
    145. Major
    146. Players R&D Expenditure. 2023
    147. Company
    148. Profiles
    149. EasyPark Group
    150. Financial
    151. Overview
    152. Products Offered
    153. Key
    154. Developments
    155. SWOT Analysis
    156. Key
    157. Strategies
    158. Fujitsu
    159. Financial
    160. Overview
    161. Products Offered
    162. Key
    163. Developments
    164. SWOT Analysis
    165. Key
    166. Strategies
    167. Conduent
    168. Financial
    169. Overview
    170. Products Offered
    171. Key
    172. Developments
    173. SWOT Analysis
    174. Key
    175. Strategies
    176. TransCore
    177. Financial
    178. Overview
    179. Products Offered
    180. Key
    181. Developments
    182. SWOT Analysis
    183. Key
    184. Strategies
    185. Itron
    186. Financial
    187. Overview
    188. Products Offered
    189. Key
    190. Developments
    191. SWOT Analysis
    192. Key
    193. Strategies
    194. QFree ASA
    195. Financial
    196. Overview
    197. Products Offered
    198. Key
    199. Developments
    200. SWOT Analysis
    201. Key
    202. Strategies
    203. Sensys Networks
    204. Financial
    205. Overview
    206. Products Offered
    207. Key
    208. Developments
    209. SWOT Analysis
    210. Key
    211. Strategies
    212. Kiewit Corporation
    213. Financial
    214. Overview
    215. Products Offered
    216. Key
    217. Developments
    218. SWOT Analysis
    219. Key
    220. Strategies
    221. Cubic Corporation
    222. Financial
    223. Overview
    224. Products Offered
    225. Key
    226. Developments
    227. SWOT Analysis
    228. Key
    229. Strategies
    230. Kapsch TrafficCom
    231. Financial
    232. Overview
    233. Products Offered
    234. Key
    235. Developments
    236. SWOT Analysis
    237. Key
    238. Strategies
    239. Civix
    240. Financial
    241. Overview
    242. Products Offered
    243. Key
    244. Developments
    245. SWOT Analysis
    246. Key
    247. Strategies
    248. Siemens AG
    249. Financial
    250. Overview
    251. Products Offered
    252. Key
    253. Developments
    254. SWOT Analysis
    255. Key
    256. Strategies
    257. McCain Inc.
    258. Financial
    259. Overview
    260. Products Offered
    261. Key
    262. Developments
    263. SWOT Analysis
    264. Key
    265. Strategies
    266. Thales Group
    267. Financial
    268. Overview
    269. Products Offered
    270. Key
    271. Developments
    272. SWOT Analysis
    273. Key
    274. Strategies
    275. ATS Traffic
    276. Financial
    277. Overview
    278. Products Offered
    279. Key
    280. Developments
    281. SWOT Analysis
    282. Key
    283. Strategies
    284. References
    285. Related
    286. Reports
    287. LIST
    288. OF ASSUMPTIONS
    289. North America Electronic Toll Collection
    290. Market SIZE ESTIMATES & FORECAST, BY TECHNOLOGY, 2019-2035 (USD Billions)
    291. North
    292. America Electronic Toll Collection Market SIZE ESTIMATES & FORECAST, BY COMPONENT,
    293. 2035 (USD Billions)
    294. North America Electronic Toll
    295. Collection Market SIZE ESTIMATES & FORECAST, BY APPLICATION, 2019-2035 (USD
    296. Billions)
    297. North America Electronic Toll Collection Market
    298. SIZE ESTIMATES & FORECAST, BY END USE, 2019-2035 (USD Billions)
    299. North
    300. America Electronic Toll Collection Market SIZE ESTIMATES & FORECAST, BY REGIONAL,
    301. 2035 (USD Billions)
    302. US Electronic Toll Collection
    303. Market SIZE ESTIMATES & FORECAST, BY TECHNOLOGY, 2019-2035 (USD Billions)
    304. US
    305. Electronic Toll Collection Market SIZE ESTIMATES & FORECAST, BY COMPONENT, 2019-2035
    306. (USD Billions)
    307. US Electronic Toll Collection Market SIZE
    308. ESTIMATES & FORECAST, BY APPLICATION, 2019-2035 (USD Billions)
    309. US
    310. Electronic Toll Collection Market SIZE ESTIMATES & FORECAST, BY END USE, 2019-2035
    311. (USD Billions)
    312. US Electronic Toll Collection Market SIZE
    313. ESTIMATES & FORECAST, BY REGIONAL, 2019-2035 (USD Billions)
    314. Canada
    315. Electronic Toll Collection Market SIZE ESTIMATES & FORECAST, BY TECHNOLOGY,
    316. 2035 (USD Billions)
    317. Canada Electronic Toll Collection
    318. Market SIZE ESTIMATES & FORECAST, BY COMPONENT, 2019-2035 (USD Billions)
    319. Canada
    320. Electronic Toll Collection Market SIZE ESTIMATES & FORECAST, BY APPLICATION,
    321. 2035 (USD Billions)
    322. Canada Electronic Toll Collection
    323. Market SIZE ESTIMATES & FORECAST, BY END USE, 2019-2035 (USD Billions)
    324. Canada
    325. Electronic Toll Collection Market SIZE ESTIMATES & FORECAST, BY REGIONAL, 2019-2035
    326. (USD Billions)
    327. Europe Electronic Toll Collection Market
    328. SIZE ESTIMATES & FORECAST, BY TECHNOLOGY, 2019-2035 (USD Billions)
    329. Europe
    330. Electronic Toll Collection Market SIZE ESTIMATES & FORECAST, BY COMPONENT, 2019-2035
    331. (USD Billions)
    332. Europe Electronic Toll Collection Market
    333. SIZE ESTIMATES & FORECAST, BY APPLICATION, 2019-2035 (USD Billions)
    334. Europe
    335. Electronic Toll Collection Market SIZE ESTIMATES & FORECAST, BY END USE, 2019-2035
    336. (USD Billions)
    337. Europe Electronic Toll Collection Market
    338. SIZE ESTIMATES & FORECAST, BY REGIONAL, 2019-2035 (USD Billions)
    339. Germany
    340. Electronic Toll Collection Market SIZE ESTIMATES & FORECAST, BY TECHNOLOGY,
    341. 2035 (USD Billions)
    342. Germany Electronic Toll Collection
    343. Market SIZE ESTIMATES & FORECAST, BY COMPONENT, 2019-2035 (USD Billions)
    344. Germany
    345. Electronic Toll Collection Market SIZE ESTIMATES & FORECAST, BY APPLICATION,
    346. 2035 (USD Billions)
    347. Germany Electronic Toll Collection
    348. Market SIZE ESTIMATES & FORECAST, BY END USE, 2019-2035 (USD Billions)
    349. Germany
    350. Electronic Toll Collection Market SIZE ESTIMATES & FORECAST, BY REGIONAL, 2019-2035
    351. (USD Billions)
    352. UK Electronic Toll Collection Market SIZE
    353. ESTIMATES & FORECAST, BY TECHNOLOGY, 2019-2035 (USD Billions)
    354. UK
    355. Electronic Toll Collection Market SIZE ESTIMATES & FORECAST, BY COMPONENT, 2019-2035
    356. (USD Billions)
    357. UK Electronic Toll Collection Market SIZE
    358. ESTIMATES & FORECAST, BY APPLICATION, 2019-2035 (USD Billions)
    359. UK
    360. Electronic Toll Collection Market SIZE ESTIMATES & FORECAST, BY END USE, 2019-2035
    361. (USD Billions)
    362. UK Electronic Toll Collection Market SIZE
    363. ESTIMATES & FORECAST, BY REGIONAL, 2019-2035 (USD Billions)
    364. France
    365. Electronic Toll Collection Market SIZE ESTIMATES & FORECAST, BY TECHNOLOGY,
    366. 2035 (USD Billions)
    367. France Electronic Toll Collection
    368. Market SIZE ESTIMATES & FORECAST, BY COMPONENT, 2019-2035 (USD Billions)
    369. France
    370. Electronic Toll Collection Market SIZE ESTIMATES & FORECAST, BY APPLICATION,
    371. 2035 (USD Billions)
    372. France Electronic Toll Collection
    373. Market SIZE ESTIMATES & FORECAST, BY END USE, 2019-2035 (USD Billions)
    374. France
    375. Electronic Toll Collection Market SIZE ESTIMATES & FORECAST, BY REGIONAL, 2019-2035
    376. (USD Billions)
    377. Russia Electronic Toll Collection Market
    378. SIZE ESTIMATES & FORECAST, BY TECHNOLOGY, 2019-2035 (USD Billions)
    379. Russia
    380. Electronic Toll Collection Market SIZE ESTIMATES & FORECAST, BY COMPONENT, 2019-2035
    381. (USD Billions)
    382. Russia Electronic Toll Collection Market
    383. SIZE ESTIMATES & FORECAST, BY APPLICATION, 2019-2035 (USD Billions)
    384. Russia
    385. Electronic Toll Collection Market SIZE ESTIMATES & FORECAST, BY END USE, 2019-2035
    386. (USD Billions)
    387. Russia Electronic Toll Collection Market
    388. SIZE ESTIMATES & FORECAST, BY REGIONAL, 2019-2035 (USD Billions)
    389. Italy
    390. Electronic Toll Collection Market SIZE ESTIMATES & FORECAST, BY TECHNOLOGY,
    391. 2035 (USD Billions)
    392. Italy Electronic Toll Collection
    393. Market SIZE ESTIMATES & FORECAST, BY COMPONENT, 2019-2035 (USD Billions)
    394. Italy
    395. Electronic Toll Collection Market SIZE ESTIMATES & FORECAST, BY APPLICATION,
    396. 2035 (USD Billions)
    397. Italy Electronic Toll Collection
    398. Market SIZE ESTIMATES & FORECAST, BY END USE, 2019-2035 (USD Billions)
    399. Italy
    400. Electronic Toll Collection Market SIZE ESTIMATES & FORECAST, BY REGIONAL, 2019-2035
    401. (USD Billions)
    402. Spain Electronic Toll Collection Market
    403. SIZE ESTIMATES & FORECAST, BY TECHNOLOGY, 2019-2035 (USD Billions)
    404. Spain
    405. Electronic Toll Collection Market SIZE ESTIMATES & FORECAST, BY COMPONENT, 2019-2035
    406. (USD Billions)
    407. Spain Electronic Toll Collection Market
    408. SIZE ESTIMATES & FORECAST, BY APPLICATION, 2019-2035 (USD Billions)
    409. Spain
    410. Electronic Toll Collection Market SIZE ESTIMATES & FORECAST, BY END USE, 2019-2035
    411. (USD Billions)
    412. Spain Electronic Toll Collection Market
    413. SIZE ESTIMATES & FORECAST, BY REGIONAL, 2019-2035 (USD Billions)
    414. Rest
    415. of Europe Electronic Toll Collection Market SIZE ESTIMATES & FORECAST, BY TECHNOLOGY,
    416. 2035 (USD Billions)
    417. Rest of Europe Electronic Toll
    418. Collection Market SIZE ESTIMATES & FORECAST, BY COMPONENT, 2019-2035 (USD Billions)
    419. Rest
    420. of Europe Electronic Toll Collection Market SIZE ESTIMATES & FORECAST, BY APPLICATION,
    421. 2035 (USD Billions)
    422. Rest of Europe Electronic Toll
    423. Collection Market SIZE ESTIMATES & FORECAST, BY END USE, 2019-2035 (USD Billions)
    424. Rest
    425. of Europe Electronic Toll Collection Market SIZE ESTIMATES & FORECAST, BY REGIONAL,
    426. 2035 (USD Billions)
    427. APAC Electronic Toll Collection
    428. Market SIZE ESTIMATES & FORECAST, BY TECHNOLOGY, 2019-2035 (USD Billions)
    429. APAC
    430. Electronic Toll Collection Market SIZE ESTIMATES & FORECAST, BY COMPONENT, 2019-2035
    431. (USD Billions)
    432. APAC Electronic Toll Collection Market
    433. SIZE ESTIMATES & FORECAST, BY APPLICATION, 2019-2035 (USD Billions)
    434. APAC
    435. Electronic Toll Collection Market SIZE ESTIMATES & FORECAST, BY END USE, 2019-2035
    436. (USD Billions)
    437. APAC Electronic Toll Collection Market
    438. SIZE ESTIMATES & FORECAST, BY REGIONAL, 2019-2035 (USD Billions)
    439. China
    440. Electronic Toll Collection Market SIZE ESTIMATES & FORECAST, BY TECHNOLOGY,
    441. 2035 (USD Billions)
    442. China Electronic Toll Collection
    443. Market SIZE ESTIMATES & FORECAST, BY COMPONENT, 2019-2035 (USD Billions)
    444. China
    445. Electronic Toll Collection Market SIZE ESTIMATES & FORECAST, BY APPLICATION,
    446. 2035 (USD Billions)
    447. China Electronic Toll Collection
    448. Market SIZE ESTIMATES & FORECAST, BY END USE, 2019-2035 (USD Billions)
    449. China
    450. Electronic Toll Collection Market SIZE ESTIMATES & FORECAST, BY REGIONAL, 2019-2035
    451. (USD Billions)
    452. India Electronic Toll Collection Market
    453. SIZE ESTIMATES & FORECAST, BY TECHNOLOGY, 2019-2035 (USD Billions)
    454. India
    455. Electronic Toll Collection Market SIZE ESTIMATES & FORECAST, BY COMPONENT, 2019-2035
    456. (USD Billions)
    457. India Electronic Toll Collection Market
    458. SIZE ESTIMATES & FORECAST, BY APPLICATION, 2019-2035 (USD Billions)
    459. India
    460. Electronic Toll Collection Market SIZE ESTIMATES & FORECAST, BY END USE, 2019-2035
    461. (USD Billions)
    462. India Electronic Toll Collection Market
    463. SIZE ESTIMATES & FORECAST, BY REGIONAL, 2019-2035 (USD Billions)
    464. Japan
    465. Electronic Toll Collection Market SIZE ESTIMATES & FORECAST, BY TECHNOLOGY,
    466. 2035 (USD Billions)
    467. Japan Electronic Toll Collection
    468. Market SIZE ESTIMATES & FORECAST, BY COMPONENT, 2019-2035 (USD Billions)
    469. Japan
    470. Electronic Toll Collection Market SIZE ESTIMATES & FORECAST, BY APPLICATION,
    471. 2035 (USD Billions)
    472. Japan Electronic Toll Collection
    473. Market SIZE ESTIMATES & FORECAST, BY END USE, 2019-2035 (USD Billions)
    474. Japan
    475. Electronic Toll Collection Market SIZE ESTIMATES & FORECAST, BY REGIONAL, 2019-2035
    476. (USD Billions)
    477. South Korea Electronic Toll Collection
    478. Market SIZE ESTIMATES & FORECAST, BY TECHNOLOGY, 2019-2035 (USD Billions)
    479. South
    480. Korea Electronic Toll Collection Market SIZE ESTIMATES & FORECAST, BY COMPONENT,
    481. 2035 (USD Billions)
    482. South Korea Electronic Toll
    483. Collection Market SIZE ESTIMATES & FORECAST, BY APPLICATION, 2019-2035 (USD
    484. Billions)
    485. South Korea Electronic Toll Collection Market
    486. SIZE ESTIMATES & FORECAST, BY END USE, 2019-2035 (USD Billions)
    487. South
    488. Korea Electronic Toll Collection Market SIZE ESTIMATES & FORECAST, BY REGIONAL,
    489. 2035 (USD Billions)
    490. Malaysia Electronic Toll Collection
    491. Market SIZE ESTIMATES & FORECAST, BY TECHNOLOGY, 2019-2035 (USD Billions)
    492. Malaysia
    493. Electronic Toll Collection Market SIZE ESTIMATES & FORECAST, BY COMPONENT, 2019-2035
    494. (USD Billions)
    495. Malaysia Electronic Toll Collection Market
    496. SIZE ESTIMATES & FORECAST, BY APPLICATION, 2019-2035 (USD Billions)
    497. Malaysia
    498. Electronic Toll Collection Market SIZE ESTIMATES & FORECAST, BY END USE, 2019-2035
    499. (USD Billions)
    500. Malaysia Electronic Toll Collection Market
    501. SIZE ESTIMATES & FORECAST, BY REGIONAL, 2019-2035 (USD Billions)
    502. Thailand
    503. Electronic Toll Collection Market SIZE ESTIMATES & FORECAST, BY TECHNOLOGY,
    504. 2035 (USD Billions)
    505. Thailand Electronic Toll Collection
    506. Market SIZE ESTIMATES & FORECAST, BY COMPONENT, 2019-2035 (USD Billions)
    507. Thailand
    508. Electronic Toll Collection Market SIZE ESTIMATES & FORECAST, BY APPLICATION,
    509. 2035 (USD Billions)
    510. Thailand Electronic Toll Collection
    511. Market SIZE ESTIMATES & FORECAST, BY END USE, 2019-2035 (USD Billions)
    512. Thailand
    513. Electronic Toll Collection Market SIZE ESTIMATES & FORECAST, BY REGIONAL, 2019-2035
    514. (USD Billions)
    515. Indonesia Electronic Toll Collection Market
    516. SIZE ESTIMATES & FORECAST, BY TECHNOLOGY, 2019-2035 (USD Billions)
    517. Indonesia
    518. Electronic Toll Collection Market SIZE ESTIMATES & FORECAST, BY COMPONENT, 2019-2035
    519. (USD Billions)
    520. Indonesia Electronic Toll Collection Market
    521. SIZE ESTIMATES & FORECAST, BY APPLICATION, 2019-2035 (USD Billions)
    522. Indonesia
    523. Electronic Toll Collection Market SIZE ESTIMATES & FORECAST, BY END USE, 2019-2035
    524. (USD Billions)
    525. Indonesia Electronic Toll Collection Market
    526. SIZE ESTIMATES & FORECAST, BY REGIONAL, 2019-2035 (USD Billions)
    527. Rest
    528. of APAC Electronic Toll Collection Market SIZE ESTIMATES & FORECAST, BY TECHNOLOGY,
    529. 2035 (USD Billions)
    530. Rest of APAC Electronic Toll
    531. Collection Market SIZE ESTIMATES & FORECAST, BY COMPONENT, 2019-2035 (USD Billions)
    532. Rest
    533. of APAC Electronic Toll Collection Market SIZE ESTIMATES & FORECAST, BY APPLICATION,
    534. 2035 (USD Billions)
    535. Rest of APAC Electronic Toll
    536. Collection Market SIZE ESTIMATES & FORECAST, BY END USE, 2019-2035 (USD Billions)
    537. Rest
    538. of APAC Electronic Toll Collection Market SIZE ESTIMATES & FORECAST, BY REGIONAL,
    539. 2035 (USD Billions)
    540. South America Electronic Toll
    541. Collection Market SIZE ESTIMATES & FORECAST, BY TECHNOLOGY, 2019-2035 (USD Billions)
    542. South
    543. America Electronic Toll Collection Market SIZE ESTIMATES & FORECAST, BY COMPONENT,
    544. 2035 (USD Billions)
    545. South America Electronic Toll
    546. Collection Market SIZE ESTIMATES & FORECAST, BY APPLICATION, 2019-2035 (USD
    547. Billions)
    548. South America Electronic Toll Collection Market
    549. SIZE ESTIMATES & FORECAST, BY END USE, 2019-2035 (USD Billions)
    550. South
    551. America Electronic Toll Collection Market SIZE ESTIMATES & FORECAST, BY REGIONAL,
    552. 2035 (USD Billions)
    553. Brazil Electronic Toll Collection
    554. Market SIZE ESTIMATES & FORECAST, BY TECHNOLOGY, 2019-2035 (USD Billions)
    555. Brazil
    556. Electronic Toll Collection Market SIZE ESTIMATES & FORECAST, BY COMPONENT, 2019-2035
    557. (USD Billions)
    558. Brazil Electronic Toll Collection Market
    559. SIZE ESTIMATES & FORECAST, BY APPLICATION, 2019-2035 (USD Billions)
    560. Brazil
    561. Electronic Toll Collection Market SIZE ESTIMATES & FORECAST, BY END USE, 2019-2035
    562. (USD Billions)
    563. Brazil Electronic Toll Collection Market
    564. SIZE ESTIMATES & FORECAST, BY REGIONAL, 2019-2035 (USD Billions)
    565. Mexico
    566. Electronic Toll Collection Market SIZE ESTIMATES & FORECAST, BY TECHNOLOGY,
    567. 2035 (USD Billions)
    568. Mexico Electronic Toll Collection
    569. Market SIZE ESTIMATES & FORECAST, BY COMPONENT, 2019-2035 (USD Billions)
    570. Mexico
    571. Electronic Toll Collection Market SIZE ESTIMATES & FORECAST, BY APPLICATION,
    572. 2035 (USD Billions)
    573. Mexico Electronic Toll Collection
    574. Market SIZE ESTIMATES & FORECAST, BY END USE, 2019-2035 (USD Billions)
    575. Mexico
    576. Electronic Toll Collection Market SIZE ESTIMATES & FORECAST, BY REGIONAL, 2019-2035
    577. (USD Billions)
    578. Argentina Electronic Toll Collection Market
    579. SIZE ESTIMATES & FORECAST, BY TECHNOLOGY, 2019-2035 (USD Billions)
    580. Argentina
    581. Electronic Toll Collection Market SIZE ESTIMATES & FORECAST, BY COMPONENT, 2019-2035
    582. (USD Billions)
    583. Argentina Electronic Toll Collection Market
    584. SIZE ESTIMATES & FORECAST, BY APPLICATION, 2019-2035 (USD Billions)
    585. Argentina
    586. Electronic Toll Collection Market SIZE ESTIMATES & FORECAST, BY END USE, 2019-2035
    587. (USD Billions)
    588. Argentina Electronic Toll Collection Market
    589. SIZE ESTIMATES & FORECAST, BY REGIONAL, 2019-2035 (USD Billions)
    590. Rest
    591. of South America Electronic Toll Collection Market SIZE ESTIMATES & FORECAST,
    592. BY TECHNOLOGY, 2019-2035 (USD Billions)
    593. Rest of South
    594. America Electronic Toll Collection Market SIZE ESTIMATES & FORECAST, BY COMPONENT,
    595. 2035 (USD Billions)
    596. Rest of South America Electronic
    597. Toll Collection Market SIZE ESTIMATES & FORECAST, BY APPLICATION, 2019-2035
    598. (USD Billions)
    599. Rest of South America Electronic Toll
    600. Collection Market SIZE ESTIMATES & FORECAST, BY END USE, 2019-2035 (USD Billions)
    601. Rest
    602. of South America Electronic Toll Collection Market SIZE ESTIMATES & FORECAST,
    603. BY REGIONAL, 2019-2035 (USD Billions)
    604. MEA Electronic
    605. Toll Collection Market SIZE ESTIMATES & FORECAST, BY TECHNOLOGY, 2019-2035 (USD
    606. Billions)
    607. MEA Electronic Toll Collection Market SIZE
    608. ESTIMATES & FORECAST, BY COMPONENT, 2019-2035 (USD Billions)
    609. MEA
    610. Electronic Toll Collection Market SIZE ESTIMATES & FORECAST, BY APPLICATION,
    611. 2035 (USD Billions)
    612. MEA Electronic Toll Collection
    613. Market SIZE ESTIMATES & FORECAST, BY END USE, 2019-2035 (USD Billions)
    614. MEA
    615. Electronic Toll Collection Market SIZE ESTIMATES & FORECAST, BY REGIONAL, 2019-2035
    616. (USD Billions)
    617. GCC Countries Electronic Toll Collection
    618. Market SIZE ESTIMATES & FORECAST, BY TECHNOLOGY, 2019-2035 (USD Billions)
    619. GCC
    620. Countries Electronic Toll Collection Market SIZE ESTIMATES & FORECAST, BY COMPONENT,
    621. 2035 (USD Billions)
    622. GCC Countries Electronic Toll
    623. Collection Market SIZE ESTIMATES & FORECAST, BY APPLICATION, 2019-2035 (USD
    624. Billions)
    625. GCC Countries Electronic Toll Collection Market
    626. SIZE ESTIMATES & FORECAST, BY END USE, 2019-2035 (USD Billions)
    627. GCC
    628. Countries Electronic Toll Collection Market SIZE ESTIMATES & FORECAST, BY REGIONAL,
    629. 2035 (USD Billions)
    630. South Africa Electronic Toll
    631. Collection Market SIZE ESTIMATES & FORECAST, BY TECHNOLOGY, 2019-2035 (USD Billions)
    632. South
    633. Africa Electronic Toll Collection Market SIZE ESTIMATES & FORECAST, BY COMPONENT,
    634. 2035 (USD Billions)
    635. South Africa Electronic Toll
    636. Collection Market SIZE ESTIMATES & FORECAST, BY APPLICATION, 2019-2035 (USD
    637. Billions)
    638. South Africa Electronic Toll Collection Market
    639. SIZE ESTIMATES & FORECAST, BY END USE, 2019-2035 (USD Billions)
    640. South
    641. Africa Electronic Toll Collection Market SIZE ESTIMATES & FORECAST, BY REGIONAL,
    642. 2035 (USD Billions)
    643. Rest of MEA Electronic Toll
    644. Collection Market SIZE ESTIMATES & FORECAST, BY TECHNOLOGY, 2019-2035 (USD Billions)
    645. Rest
    646. of MEA Electronic Toll Collection Market SIZE ESTIMATES & FORECAST, BY COMPONENT,
    647. 2035 (USD Billions)
    648. Rest of MEA Electronic Toll
    649. Collection Market SIZE ESTIMATES & FORECAST, BY APPLICATION, 2019-2035 (USD
    650. Billions)
    651. Rest of MEA Electronic Toll Collection Market
    652. SIZE ESTIMATES & FORECAST, BY END USE, 2019-2035 (USD Billions)
    653. Rest
    654. of MEA Electronic Toll Collection Market SIZE ESTIMATES & FORECAST, BY REGIONAL,
    655. 2035 (USD Billions)
    656. PRODUCT LAUNCH/PRODUCT DEVELOPMENT/APPROVAL
    657. ACQUISITION/PARTNERSHIP
    658. LIST
    659. Of figures
    660. MARKET SYNOPSIS
    661. NORTH
    662. AMERICA ELECTRONIC TOLL COLLECTION MARKET ANALYSIS
    663. US
    664. ELECTRONIC TOLL COLLECTION MARKET ANALYSIS BY TECHNOLOGY
    665. US
    666. ELECTRONIC TOLL COLLECTION MARKET ANALYSIS BY COMPONENT
    667. US
    668. ELECTRONIC TOLL COLLECTION MARKET ANALYSIS BY APPLICATION
    669. US
    670. ELECTRONIC TOLL COLLECTION MARKET ANALYSIS BY END USE
    671. US
    672. ELECTRONIC TOLL COLLECTION MARKET ANALYSIS BY REGIONAL
    673. CANADA
    674. ELECTRONIC TOLL COLLECTION MARKET ANALYSIS BY TECHNOLOGY
    675. CANADA
    676. ELECTRONIC TOLL COLLECTION MARKET ANALYSIS BY COMPONENT
    677. CANADA
    678. ELECTRONIC TOLL COLLECTION MARKET ANALYSIS BY APPLICATION
    679. CANADA
    680. ELECTRONIC TOLL COLLECTION MARKET ANALYSIS BY END USE
    681. CANADA
    682. ELECTRONIC TOLL COLLECTION MARKET ANALYSIS BY REGIONAL
    683. EUROPE
    684. ELECTRONIC TOLL COLLECTION MARKET ANALYSIS
    685. GERMANY ELECTRONIC
    686. TOLL COLLECTION MARKET ANALYSIS BY TECHNOLOGY
    687. GERMANY
    688. ELECTRONIC TOLL COLLECTION MARKET ANALYSIS BY COMPONENT
    689. GERMANY
    690. ELECTRONIC TOLL COLLECTION MARKET ANALYSIS BY APPLICATION
    691. GERMANY
    692. ELECTRONIC TOLL COLLECTION MARKET ANALYSIS BY END USE
    693. GERMANY
    694. ELECTRONIC TOLL COLLECTION MARKET ANALYSIS BY REGIONAL
    695. UK
    696. ELECTRONIC TOLL COLLECTION MARKET ANALYSIS BY TECHNOLOGY
    697. UK
    698. ELECTRONIC TOLL COLLECTION MARKET ANALYSIS BY COMPONENT
    699. UK
    700. ELECTRONIC TOLL COLLECTION MARKET ANALYSIS BY APPLICATION
    701. UK
    702. ELECTRONIC TOLL COLLECTION MARKET ANALYSIS BY END USE
    703. UK
    704. ELECTRONIC TOLL COLLECTION MARKET ANALYSIS BY REGIONAL
    705. FRANCE
    706. ELECTRONIC TOLL COLLECTION MARKET ANALYSIS BY TECHNOLOGY
    707. FRANCE
    708. ELECTRONIC TOLL COLLECTION MARKET ANALYSIS BY COMPONENT
    709. FRANCE
    710. ELECTRONIC TOLL COLLECTION MARKET ANALYSIS BY APPLICATION
    711. FRANCE
    712. ELECTRONIC TOLL COLLECTION MARKET ANALYSIS BY END USE
    713. FRANCE
    714. ELECTRONIC TOLL COLLECTION MARKET ANALYSIS BY REGIONAL
    715. RUSSIA
    716. ELECTRONIC TOLL COLLECTION MARKET ANALYSIS BY TECHNOLOGY
    717. RUSSIA
    718. ELECTRONIC TOLL COLLECTION MARKET ANALYSIS BY COMPONENT
    719. RUSSIA
    720. ELECTRONIC TOLL COLLECTION MARKET ANALYSIS BY APPLICATION
    721. RUSSIA
    722. ELECTRONIC TOLL COLLECTION MARKET ANALYSIS BY END USE
    723. RUSSIA
    724. ELECTRONIC TOLL COLLECTION MARKET ANALYSIS BY REGIONAL
    725. ITALY
    726. ELECTRONIC TOLL COLLECTION MARKET ANALYSIS BY TECHNOLOGY
    727. ITALY
    728. ELECTRONIC TOLL COLLECTION MARKET ANALYSIS BY COMPONENT
    729. ITALY
    730. ELECTRONIC TOLL COLLECTION MARKET ANALYSIS BY APPLICATION
    731. ITALY
    732. ELECTRONIC TOLL COLLECTION MARKET ANALYSIS BY END USE
    733. ITALY
    734. ELECTRONIC TOLL COLLECTION MARKET ANALYSIS BY REGIONAL
    735. SPAIN
    736. ELECTRONIC TOLL COLLECTION MARKET ANALYSIS BY TECHNOLOGY
    737. SPAIN
    738. ELECTRONIC TOLL COLLECTION MARKET ANALYSIS BY COMPONENT
    739. SPAIN
    740. ELECTRONIC TOLL COLLECTION MARKET ANALYSIS BY APPLICATION
    741. SPAIN
    742. ELECTRONIC TOLL COLLECTION MARKET ANALYSIS BY END USE
    743. SPAIN
    744. ELECTRONIC TOLL COLLECTION MARKET ANALYSIS BY REGIONAL
    745. REST
    746. OF EUROPE ELECTRONIC TOLL COLLECTION MARKET ANALYSIS BY TECHNOLOGY
    747. REST
    748. OF EUROPE ELECTRONIC TOLL COLLECTION MARKET ANALYSIS BY COMPONENT
    749. REST
    750. OF EUROPE ELECTRONIC TOLL COLLECTION MARKET ANALYSIS BY APPLICATION
    751. REST
    752. OF EUROPE ELECTRONIC TOLL COLLECTION MARKET ANALYSIS BY END USE
    753. REST
    754. OF EUROPE ELECTRONIC TOLL COLLECTION MARKET ANALYSIS BY REGIONAL
    755. APAC
    756. ELECTRONIC TOLL COLLECTION MARKET ANALYSIS
    757. CHINA ELECTRONIC
    758. TOLL COLLECTION MARKET ANALYSIS BY TECHNOLOGY
    759. CHINA ELECTRONIC
    760. TOLL COLLECTION MARKET ANALYSIS BY COMPONENT
    761. CHINA ELECTRONIC
    762. TOLL COLLECTION MARKET ANALYSIS BY APPLICATION
    763. CHINA
    764. ELECTRONIC TOLL COLLECTION MARKET ANALYSIS BY END USE
    765. CHINA
    766. ELECTRONIC TOLL COLLECTION MARKET ANALYSIS BY REGIONAL
    767. INDIA
    768. ELECTRONIC TOLL COLLECTION MARKET ANALYSIS BY TECHNOLOGY
    769. INDIA
    770. ELECTRONIC TOLL COLLECTION MARKET ANALYSIS BY COMPONENT
    771. INDIA
    772. ELECTRONIC TOLL COLLECTION MARKET ANALYSIS BY APPLICATION
    773. INDIA
    774. ELECTRONIC TOLL COLLECTION MARKET ANALYSIS BY END USE
    775. INDIA
    776. ELECTRONIC TOLL COLLECTION MARKET ANALYSIS BY REGIONAL
    777. JAPAN
    778. ELECTRONIC TOLL COLLECTION MARKET ANALYSIS BY TECHNOLOGY
    779. JAPAN
    780. ELECTRONIC TOLL COLLECTION MARKET ANALYSIS BY COMPONENT
    781. JAPAN
    782. ELECTRONIC TOLL COLLECTION MARKET ANALYSIS BY APPLICATION
    783. JAPAN
    784. ELECTRONIC TOLL COLLECTION MARKET ANALYSIS BY END USE
    785. JAPAN
    786. ELECTRONIC TOLL COLLECTION MARKET ANALYSIS BY REGIONAL
    787. SOUTH
    788. KOREA ELECTRONIC TOLL COLLECTION MARKET ANALYSIS BY TECHNOLOGY
    789. SOUTH
    790. KOREA ELECTRONIC TOLL COLLECTION MARKET ANALYSIS BY COMPONENT
    791. SOUTH
    792. KOREA ELECTRONIC TOLL COLLECTION MARKET ANALYSIS BY APPLICATION
    793. SOUTH
    794. KOREA ELECTRONIC TOLL COLLECTION MARKET ANALYSIS BY END USE
    795. SOUTH
    796. KOREA ELECTRONIC TOLL COLLECTION MARKET ANALYSIS BY REGIONAL
    797. MALAYSIA
    798. ELECTRONIC TOLL COLLECTION MARKET ANALYSIS BY TECHNOLOGY
    799. MALAYSIA
    800. ELECTRONIC TOLL COLLECTION MARKET ANALYSIS BY COMPONENT
    801. MALAYSIA
    802. ELECTRONIC TOLL COLLECTION MARKET ANALYSIS BY APPLICATION
    803. MALAYSIA
    804. ELECTRONIC TOLL COLLECTION MARKET ANALYSIS BY END USE
    805. MALAYSIA
    806. ELECTRONIC TOLL COLLECTION MARKET ANALYSIS BY REGIONAL
    807. THAILAND
    808. ELECTRONIC TOLL COLLECTION MARKET ANALYSIS BY TECHNOLOGY
    809. THAILAND
    810. ELECTRONIC TOLL COLLECTION MARKET ANALYSIS BY COMPONENT
    811. THAILAND
    812. ELECTRONIC TOLL COLLECTION MARKET ANALYSIS BY APPLICATION
    813. THAILAND
    814. ELECTRONIC TOLL COLLECTION MARKET ANALYSIS BY END USE
    815. THAILAND
    816. ELECTRONIC TOLL COLLECTION MARKET ANALYSIS BY REGIONAL
    817. INDONESIA
    818. ELECTRONIC TOLL COLLECTION MARKET ANALYSIS BY TECHNOLOGY
    819. INDONESIA
    820. ELECTRONIC TOLL COLLECTION MARKET ANALYSIS BY COMPONENT
    821. INDONESIA
    822. ELECTRONIC TOLL COLLECTION MARKET ANALYSIS BY APPLICATION
    823. INDONESIA
    824. ELECTRONIC TOLL COLLECTION MARKET ANALYSIS BY END USE
    825. INDONESIA
    826. ELECTRONIC TOLL COLLECTION MARKET ANALYSIS BY REGIONAL
    827. REST
    828. OF APAC ELECTRONIC TOLL COLLECTION MARKET ANALYSIS BY TECHNOLOGY
    829. REST
    830. OF APAC ELECTRONIC TOLL COLLECTION MARKET ANALYSIS BY COMPONENT
    831. REST
    832. OF APAC ELECTRONIC TOLL COLLECTION MARKET ANALYSIS BY APPLICATION
    833. REST
    834. OF APAC ELECTRONIC TOLL COLLECTION MARKET ANALYSIS BY END USE
    835. REST
    836. OF APAC ELECTRONIC TOLL COLLECTION MARKET ANALYSIS BY REGIONAL
    837. SOUTH
    838. AMERICA ELECTRONIC TOLL COLLECTION MARKET ANALYSIS
    839. BRAZIL
    840. ELECTRONIC TOLL COLLECTION MARKET ANALYSIS BY TECHNOLOGY
    841. BRAZIL
    842. ELECTRONIC TOLL COLLECTION MARKET ANALYSIS BY COMPONENT
    843. BRAZIL
    844. ELECTRONIC TOLL COLLECTION MARKET ANALYSIS BY APPLICATION
    845. BRAZIL
    846. ELECTRONIC TOLL COLLECTION MARKET ANALYSIS BY END USE
    847. BRAZIL
    848. ELECTRONIC TOLL COLLECTION MARKET ANALYSIS BY REGIONAL
    849. MEXICO
    850. ELECTRONIC TOLL COLLECTION MARKET ANALYSIS BY TECHNOLOGY
    851. MEXICO
    852. ELECTRONIC TOLL COLLECTION MARKET ANALYSIS BY COMPONENT
    853. MEXICO
    854. ELECTRONIC TOLL COLLECTION MARKET ANALYSIS BY APPLICATION
    855. MEXICO
    856. ELECTRONIC TOLL COLLECTION MARKET ANALYSIS BY END USE
    857. MEXICO
    858. ELECTRONIC TOLL COLLECTION MARKET ANALYSIS BY REGIONAL
    859. ARGENTINA
    860. ELECTRONIC TOLL COLLECTION MARKET ANALYSIS BY TECHNOLOGY
    861. ARGENTINA
    862. ELECTRONIC TOLL COLLECTION MARKET ANALYSIS BY COMPONENT
    863. ARGENTINA
    864. ELECTRONIC TOLL COLLECTION MARKET ANALYSIS BY APPLICATION
    865. ARGENTINA
    866. ELECTRONIC TOLL COLLECTION MARKET ANALYSIS BY END USE
    867. ARGENTINA
    868. ELECTRONIC TOLL COLLECTION MARKET ANALYSIS BY REGIONAL
    869. REST
    870. OF SOUTH AMERICA ELECTRONIC TOLL COLLECTION MARKET ANALYSIS BY TECHNOLOGY
    871. REST
    872. OF SOUTH AMERICA ELECTRONIC TOLL COLLECTION MARKET ANALYSIS BY COMPONENT
    873. REST
    874. OF SOUTH AMERICA ELECTRONIC TOLL COLLECTION MARKET ANALYSIS BY APPLICATION
    875. REST
    876. OF SOUTH AMERICA ELECTRONIC TOLL COLLECTION MARKET ANALYSIS BY END USE
    877. REST
    878. OF SOUTH AMERICA ELECTRONIC TOLL COLLECTION MARKET ANALYSIS BY REGIONAL
    879. MEA
    880. ELECTRONIC TOLL COLLECTION MARKET ANALYSIS
    881. GCC COUNTRIES
    882. ELECTRONIC TOLL COLLECTION MARKET ANALYSIS BY TECHNOLOGY
    883. GCC
    884. COUNTRIES ELECTRONIC TOLL COLLECTION MARKET ANALYSIS BY COMPONENT
    885. GCC
    886. COUNTRIES ELECTRONIC TOLL COLLECTION MARKET ANALYSIS BY APPLICATION
    887. GCC
    888. COUNTRIES ELECTRONIC TOLL COLLECTION MARKET ANALYSIS BY END USE
    889. GCC
    890. COUNTRIES ELECTRONIC TOLL COLLECTION MARKET ANALYSIS BY REGIONAL
    891. SOUTH
    892. AFRICA ELECTRONIC TOLL COLLECTION MARKET ANALYSIS BY TECHNOLOGY
    893. SOUTH
    894. AFRICA ELECTRONIC TOLL COLLECTION MARKET ANALYSIS BY COMPONENT
    895. SOUTH
    896. AFRICA ELECTRONIC TOLL COLLECTION MARKET ANALYSIS BY APPLICATION
    897. SOUTH
    898. AFRICA ELECTRONIC TOLL COLLECTION MARKET ANALYSIS BY END USE
    899. SOUTH
    900. AFRICA ELECTRONIC TOLL COLLECTION MARKET ANALYSIS BY REGIONAL
    901. REST
    902. OF MEA ELECTRONIC TOLL COLLECTION MARKET ANALYSIS BY TECHNOLOGY
    903. REST
    904. OF MEA ELECTRONIC TOLL COLLECTION MARKET ANALYSIS BY COMPONENT
    905. REST
    906. OF MEA ELECTRONIC TOLL COLLECTION MARKET ANALYSIS BY APPLICATION
    907. REST
    908. OF MEA ELECTRONIC TOLL COLLECTION MARKET ANALYSIS BY END USE
    909. REST
    910. OF MEA ELECTRONIC TOLL COLLECTION MARKET ANALYSIS BY REGIONAL
    911. KEY
    912. BUYING CRITERIA OF ELECTRONIC TOLL COLLECTION MARKET
    913. RESEARCH
    914. PROCESS OF MRFR
    915. DRO ANALYSIS OF ELECTRONIC TOLL COLLECTION
    916. MARKET
    917. DRIVERS IMPACT ANALYSIS: ELECTRONIC TOLL COLLECTION
    918. MARKET
    919. RESTRAINTS IMPACT ANALYSIS: ELECTRONIC TOLL COLLECTION
    920. MARKET
    921. SUPPLY / VALUE CHAIN: ELECTRONIC TOLL COLLECTION
    922. MARKET
    923. ELECTRONIC TOLL COLLECTION MARKET, BY TECHNOLOGY,
    924. (% SHARE)
    925. ELECTRONIC TOLL COLLECTION MARKET, BY
    926. TECHNOLOGY, 2019 TO 2035 (USD Billions)
    927. ELECTRONIC TOLL
    928. COLLECTION MARKET, BY COMPONENT, 2025 (% SHARE)
    929. ELECTRONIC
    930. TOLL COLLECTION MARKET, BY COMPONENT, 2019 TO 2035 (USD Billions)
    931. ELECTRONIC
    932. TOLL COLLECTION MARKET, BY APPLICATION, 2025 (% SHARE)
    933. ELECTRONIC
    934. TOLL COLLECTION MARKET, BY APPLICATION, 2019 TO 2035 (USD Billions)
    935. ELECTRONIC
    936. TOLL COLLECTION MARKET, BY END USE, 2025 (% SHARE)
    937. ELECTRONIC
    938. TOLL COLLECTION MARKET, BY END USE, 2019 TO 2035 (USD Billions)
    939. ELECTRONIC
    940. TOLL COLLECTION MARKET, BY REGIONAL, 2025 (% SHARE)
    941. ELECTRONIC
    942. TOLL COLLECTION MARKET, BY REGIONAL, 2019 TO 2035 (USD Billions)
    943. BENCHMARKING
    944. OF MAJOR COMPETITORS

    Electronic Toll Collection Market Segmentation

    • Electronic Toll Collection Market By Technology (USD Billion, 2019-2035)

      • Radio Frequency Identification
      • Automatic Number Plate Recognition
      • Smartphone Applications
      • Contactless Payment Systems
    • Electronic Toll Collection Market By Component (USD Billion, 2019-2035)

      • On-Board Units
      • Back Office Systems
      • Roadside Equipment
      • Payment Processing Solutions
    • Electronic Toll Collection Market By Application (USD Billion, 2019-2035)

      • Highway Tolling
      • Urban Tolling
      • Congestion Pricing
    • Electronic Toll Collection Market By End Use (USD Billion, 2019-2035)

      • Government
      • Private Operators
      • Transport Authorities
    • Electronic Toll Collection Market By Regional (USD Billion, 2019-2035)

      • North America
      • Europe
      • South America
      • Asia Pacific
      • Middle East and Africa

    Electronic Toll Collection Market Regional Outlook (USD Billion, 2019-2035)

    • North America Outlook (USD Billion, 2019-2035)

      • North America Electronic Toll Collection Market by Technology Type

        • Radio Frequency Identification
        • Automatic Number Plate Recognition
        • Smartphone Applications
        • Contactless Payment Systems
      • North America Electronic Toll Collection Market by Component Type

        • On-Board Units
        • Back Office Systems
        • Roadside Equipment
        • Payment Processing Solutions
      • North America Electronic Toll Collection Market by Application Type

        • Highway Tolling
        • Urban Tolling
        • Congestion Pricing
      • North America Electronic Toll Collection Market by End Use Type

        • Government
        • Private Operators
        • Transport Authorities
      • North America Electronic Toll Collection Market by Regional Type

        • US
        • Canada
      • US Outlook (USD Billion, 2019-2035)
      • US Electronic Toll Collection Market by Technology Type

        • Radio Frequency Identification
        • Automatic Number Plate Recognition
        • Smartphone Applications
        • Contactless Payment Systems
      • US Electronic Toll Collection Market by Component Type

        • On-Board Units
        • Back Office Systems
        • Roadside Equipment
        • Payment Processing Solutions
      • US Electronic Toll Collection Market by Application Type

        • Highway Tolling
        • Urban Tolling
        • Congestion Pricing
      • US Electronic Toll Collection Market by End Use Type

        • Government
        • Private Operators
        • Transport Authorities
      • CANADA Outlook (USD Billion, 2019-2035)
      • CANADA Electronic Toll Collection Market by Technology Type

        • Radio Frequency Identification
        • Automatic Number Plate Recognition
        • Smartphone Applications
        • Contactless Payment Systems
      • CANADA Electronic Toll Collection Market by Component Type

        • On-Board Units
        • Back Office Systems
        • Roadside Equipment
        • Payment Processing Solutions
      • CANADA Electronic Toll Collection Market by Application Type

        • Highway Tolling
        • Urban Tolling
        • Congestion Pricing
      • CANADA Electronic Toll Collection Market by End Use Type

        • Government
        • Private Operators
        • Transport Authorities
    • Europe Outlook (USD Billion, 2019-2035)

      • Europe Electronic Toll Collection Market by Technology Type

        • Radio Frequency Identification
        • Automatic Number Plate Recognition
        • Smartphone Applications
        • Contactless Payment Systems
      • Europe Electronic Toll Collection Market by Component Type

        • On-Board Units
        • Back Office Systems
        • Roadside Equipment
        • Payment Processing Solutions
      • Europe Electronic Toll Collection Market by Application Type

        • Highway Tolling
        • Urban Tolling
        • Congestion Pricing
      • Europe Electronic Toll Collection Market by End Use Type

        • Government
        • Private Operators
        • Transport Authorities
      • Europe Electronic Toll Collection Market by Regional Type

        • Germany
        • UK
        • France
        • Russia
        • Italy
        • Spain
        • Rest of Europe
      • GERMANY Outlook (USD Billion, 2019-2035)
      • GERMANY Electronic Toll Collection Market by Technology Type

        • Radio Frequency Identification
        • Automatic Number Plate Recognition
        • Smartphone Applications
        • Contactless Payment Systems
      • GERMANY Electronic Toll Collection Market by Component Type

        • On-Board Units
        • Back Office Systems
        • Roadside Equipment
        • Payment Processing Solutions
      • GERMANY Electronic Toll Collection Market by Application Type

        • Highway Tolling
        • Urban Tolling
        • Congestion Pricing
      • GERMANY Electronic Toll Collection Market by End Use Type

        • Government
        • Private Operators
        • Transport Authorities
      • UK Outlook (USD Billion, 2019-2035)
      • UK Electronic Toll Collection Market by Technology Type

        • Radio Frequency Identification
        • Automatic Number Plate Recognition
        • Smartphone Applications
        • Contactless Payment Systems
      • UK Electronic Toll Collection Market by Component Type

        • On-Board Units
        • Back Office Systems
        • Roadside Equipment
        • Payment Processing Solutions
      • UK Electronic Toll Collection Market by Application Type

        • Highway Tolling
        • Urban Tolling
        • Congestion Pricing
      • UK Electronic Toll Collection Market by End Use Type

        • Government
        • Private Operators
        • Transport Authorities
      • FRANCE Outlook (USD Billion, 2019-2035)
      • FRANCE Electronic Toll Collection Market by Technology Type

        • Radio Frequency Identification
        • Automatic Number Plate Recognition
        • Smartphone Applications
        • Contactless Payment Systems
      • FRANCE Electronic Toll Collection Market by Component Type

        • On-Board Units
        • Back Office Systems
        • Roadside Equipment
        • Payment Processing Solutions
      • FRANCE Electronic Toll Collection Market by Application Type

        • Highway Tolling
        • Urban Tolling
        • Congestion Pricing
      • FRANCE Electronic Toll Collection Market by End Use Type

        • Government
        • Private Operators
        • Transport Authorities
      • RUSSIA Outlook (USD Billion, 2019-2035)
      • RUSSIA Electronic Toll Collection Market by Technology Type

        • Radio Frequency Identification
        • Automatic Number Plate Recognition
        • Smartphone Applications
        • Contactless Payment Systems
      • RUSSIA Electronic Toll Collection Market by Component Type

        • On-Board Units
        • Back Office Systems
        • Roadside Equipment
        • Payment Processing Solutions
      • RUSSIA Electronic Toll Collection Market by Application Type

        • Highway Tolling
        • Urban Tolling
        • Congestion Pricing
      • RUSSIA Electronic Toll Collection Market by End Use Type

        • Government
        • Private Operators
        • Transport Authorities
      • ITALY Outlook (USD Billion, 2019-2035)
      • ITALY Electronic Toll Collection Market by Technology Type

        • Radio Frequency Identification
        • Automatic Number Plate Recognition
        • Smartphone Applications
        • Contactless Payment Systems
      • ITALY Electronic Toll Collection Market by Component Type

        • On-Board Units
        • Back Office Systems
        • Roadside Equipment
        • Payment Processing Solutions
      • ITALY Electronic Toll Collection Market by Application Type

        • Highway Tolling
        • Urban Tolling
        • Congestion Pricing
      • ITALY Electronic Toll Collection Market by End Use Type

        • Government
        • Private Operators
        • Transport Authorities
      • SPAIN Outlook (USD Billion, 2019-2035)
      • SPAIN Electronic Toll Collection Market by Technology Type

        • Radio Frequency Identification
        • Automatic Number Plate Recognition
        • Smartphone Applications
        • Contactless Payment Systems
      • SPAIN Electronic Toll Collection Market by Component Type

        • On-Board Units
        • Back Office Systems
        • Roadside Equipment
        • Payment Processing Solutions
      • SPAIN Electronic Toll Collection Market by Application Type

        • Highway Tolling
        • Urban Tolling
        • Congestion Pricing
      • SPAIN Electronic Toll Collection Market by End Use Type

        • Government
        • Private Operators
        • Transport Authorities
      • REST OF EUROPE Outlook (USD Billion, 2019-2035)
      • REST OF EUROPE Electronic Toll Collection Market by Technology Type

        • Radio Frequency Identification
        • Automatic Number Plate Recognition
        • Smartphone Applications
        • Contactless Payment Systems
      • REST OF EUROPE Electronic Toll Collection Market by Component Type

        • On-Board Units
        • Back Office Systems
        • Roadside Equipment
        • Payment Processing Solutions
      • REST OF EUROPE Electronic Toll Collection Market by Application Type

        • Highway Tolling
        • Urban Tolling
        • Congestion Pricing
      • REST OF EUROPE Electronic Toll Collection Market by End Use Type

        • Government
        • Private Operators
        • Transport Authorities
    • APAC Outlook (USD Billion, 2019-2035)

      • APAC Electronic Toll Collection Market by Technology Type

        • Radio Frequency Identification
        • Automatic Number Plate Recognition
        • Smartphone Applications
        • Contactless Payment Systems
      • APAC Electronic Toll Collection Market by Component Type

        • On-Board Units
        • Back Office Systems
        • Roadside Equipment
        • Payment Processing Solutions
      • APAC Electronic Toll Collection Market by Application Type

        • Highway Tolling
        • Urban Tolling
        • Congestion Pricing
      • APAC Electronic Toll Collection Market by End Use Type

        • Government
        • Private Operators
        • Transport Authorities
      • APAC Electronic Toll Collection Market by Regional Type

        • China
        • India
        • Japan
        • South Korea
        • Malaysia
        • Thailand
        • Indonesia
        • Rest of APAC
      • CHINA Outlook (USD Billion, 2019-2035)
      • CHINA Electronic Toll Collection Market by Technology Type

        • Radio Frequency Identification
        • Automatic Number Plate Recognition
        • Smartphone Applications
        • Contactless Payment Systems
      • CHINA Electronic Toll Collection Market by Component Type

        • On-Board Units
        • Back Office Systems
        • Roadside Equipment
        • Payment Processing Solutions
      • CHINA Electronic Toll Collection Market by Application Type

        • Highway Tolling
        • Urban Tolling
        • Congestion Pricing
      • CHINA Electronic Toll Collection Market by End Use Type

        • Government
        • Private Operators
        • Transport Authorities
      • INDIA Outlook (USD Billion, 2019-2035)
      • INDIA Electronic Toll Collection Market by Technology Type

        • Radio Frequency Identification
        • Automatic Number Plate Recognition
        • Smartphone Applications
        • Contactless Payment Systems
      • INDIA Electronic Toll Collection Market by Component Type

        • On-Board Units
        • Back Office Systems
        • Roadside Equipment
        • Payment Processing Solutions
      • INDIA Electronic Toll Collection Market by Application Type

        • Highway Tolling
        • Urban Tolling
        • Congestion Pricing
      • INDIA Electronic Toll Collection Market by End Use Type

        • Government
        • Private Operators
        • Transport Authorities
      • JAPAN Outlook (USD Billion, 2019-2035)
      • JAPAN Electronic Toll Collection Market by Technology Type

        • Radio Frequency Identification
        • Automatic Number Plate Recognition
        • Smartphone Applications
        • Contactless Payment Systems
      • JAPAN Electronic Toll Collection Market by Component Type

        • On-Board Units
        • Back Office Systems
        • Roadside Equipment
        • Payment Processing Solutions
      • JAPAN Electronic Toll Collection Market by Application Type

        • Highway Tolling
        • Urban Tolling
        • Congestion Pricing
      • JAPAN Electronic Toll Collection Market by End Use Type

        • Government
        • Private Operators
        • Transport Authorities
      • SOUTH KOREA Outlook (USD Billion, 2019-2035)
      • SOUTH KOREA Electronic Toll Collection Market by Technology Type

        • Radio Frequency Identification
        • Automatic Number Plate Recognition
        • Smartphone Applications
        • Contactless Payment Systems
      • SOUTH KOREA Electronic Toll Collection Market by Component Type

        • On-Board Units
        • Back Office Systems
        • Roadside Equipment
        • Payment Processing Solutions
      • SOUTH KOREA Electronic Toll Collection Market by Application Type

        • Highway Tolling
        • Urban Tolling
        • Congestion Pricing
      • SOUTH KOREA Electronic Toll Collection Market by End Use Type

        • Government
        • Private Operators
        • Transport Authorities
      • MALAYSIA Outlook (USD Billion, 2019-2035)
      • MALAYSIA Electronic Toll Collection Market by Technology Type

        • Radio Frequency Identification
        • Automatic Number Plate Recognition
        • Smartphone Applications
        • Contactless Payment Systems
      • MALAYSIA Electronic Toll Collection Market by Component Type

        • On-Board Units
        • Back Office Systems
        • Roadside Equipment
        • Payment Processing Solutions
      • MALAYSIA Electronic Toll Collection Market by Application Type

        • Highway Tolling
        • Urban Tolling
        • Congestion Pricing
      • MALAYSIA Electronic Toll Collection Market by End Use Type

        • Government
        • Private Operators
        • Transport Authorities
      • THAILAND Outlook (USD Billion, 2019-2035)
      • THAILAND Electronic Toll Collection Market by Technology Type

        • Radio Frequency Identification
        • Automatic Number Plate Recognition
        • Smartphone Applications
        • Contactless Payment Systems
      • THAILAND Electronic Toll Collection Market by Component Type

        • On-Board Units
        • Back Office Systems
        • Roadside Equipment
        • Payment Processing Solutions
      • THAILAND Electronic Toll Collection Market by Application Type

        • Highway Tolling
        • Urban Tolling
        • Congestion Pricing
      • THAILAND Electronic Toll Collection Market by End Use Type

        • Government
        • Private Operators
        • Transport Authorities
      • INDONESIA Outlook (USD Billion, 2019-2035)
      • INDONESIA Electronic Toll Collection Market by Technology Type

        • Radio Frequency Identification
        • Automatic Number Plate Recognition
        • Smartphone Applications
        • Contactless Payment Systems
      • INDONESIA Electronic Toll Collection Market by Component Type

        • On-Board Units
        • Back Office Systems
        • Roadside Equipment
        • Payment Processing Solutions
      • INDONESIA Electronic Toll Collection Market by Application Type

        • Highway Tolling
        • Urban Tolling
        • Congestion Pricing
      • INDONESIA Electronic Toll Collection Market by End Use Type

        • Government
        • Private Operators
        • Transport Authorities
      • REST OF APAC Outlook (USD Billion, 2019-2035)
      • REST OF APAC Electronic Toll Collection Market by Technology Type

        • Radio Frequency Identification
        • Automatic Number Plate Recognition
        • Smartphone Applications
        • Contactless Payment Systems
      • REST OF APAC Electronic Toll Collection Market by Component Type

        • On-Board Units
        • Back Office Systems
        • Roadside Equipment
        • Payment Processing Solutions
      • REST OF APAC Electronic Toll Collection Market by Application Type

        • Highway Tolling
        • Urban Tolling
        • Congestion Pricing
      • REST OF APAC Electronic Toll Collection Market by End Use Type

        • Government
        • Private Operators
        • Transport Authorities
    • South America Outlook (USD Billion, 2019-2035)

      • South America Electronic Toll Collection Market by Technology Type

        • Radio Frequency Identification
        • Automatic Number Plate Recognition
        • Smartphone Applications
        • Contactless Payment Systems
      • South America Electronic Toll Collection Market by Component Type

        • On-Board Units
        • Back Office Systems
        • Roadside Equipment
        • Payment Processing Solutions
      • South America Electronic Toll Collection Market by Application Type

        • Highway Tolling
        • Urban Tolling
        • Congestion Pricing
      • South America Electronic Toll Collection Market by End Use Type

        • Government
        • Private Operators
        • Transport Authorities
      • South America Electronic Toll Collection Market by Regional Type

        • Brazil
        • Mexico
        • Argentina
        • Rest of South America
      • BRAZIL Outlook (USD Billion, 2019-2035)
      • BRAZIL Electronic Toll Collection Market by Technology Type

        • Radio Frequency Identification
        • Automatic Number Plate Recognition
        • Smartphone Applications
        • Contactless Payment Systems
      • BRAZIL Electronic Toll Collection Market by Component Type

        • On-Board Units
        • Back Office Systems
        • Roadside Equipment
        • Payment Processing Solutions
      • BRAZIL Electronic Toll Collection Market by Application Type

        • Highway Tolling
        • Urban Tolling
        • Congestion Pricing
      • BRAZIL Electronic Toll Collection Market by End Use Type

        • Government
        • Private Operators
        • Transport Authorities
      • MEXICO Outlook (USD Billion, 2019-2035)
      • MEXICO Electronic Toll Collection Market by Technology Type

        • Radio Frequency Identification
        • Automatic Number Plate Recognition
        • Smartphone Applications
        • Contactless Payment Systems
      • MEXICO Electronic Toll Collection Market by Component Type

        • On-Board Units
        • Back Office Systems
        • Roadside Equipment
        • Payment Processing Solutions
      • MEXICO Electronic Toll Collection Market by Application Type

        • Highway Tolling
        • Urban Tolling
        • Congestion Pricing
      • MEXICO Electronic Toll Collection Market by End Use Type

        • Government
        • Private Operators
        • Transport Authorities
      • ARGENTINA Outlook (USD Billion, 2019-2035)
      • ARGENTINA Electronic Toll Collection Market by Technology Type

        • Radio Frequency Identification
        • Automatic Number Plate Recognition
        • Smartphone Applications
        • Contactless Payment Systems
      • ARGENTINA Electronic Toll Collection Market by Component Type

        • On-Board Units
        • Back Office Systems
        • Roadside Equipment
        • Payment Processing Solutions
      • ARGENTINA Electronic Toll Collection Market by Application Type

        • Highway Tolling
        • Urban Tolling
        • Congestion Pricing
      • ARGENTINA Electronic Toll Collection Market by End Use Type

        • Government
        • Private Operators
        • Transport Authorities
      • REST OF SOUTH AMERICA Outlook (USD Billion, 2019-2035)
      • REST OF SOUTH AMERICA Electronic Toll Collection Market by Technology Type

        • Radio Frequency Identification
        • Automatic Number Plate Recognition
        • Smartphone Applications
        • Contactless Payment Systems
      • REST OF SOUTH AMERICA Electronic Toll Collection Market by Component Type

        • On-Board Units
        • Back Office Systems
        • Roadside Equipment
        • Payment Processing Solutions
      • REST OF SOUTH AMERICA Electronic Toll Collection Market by Application Type

        • Highway Tolling
        • Urban Tolling
        • Congestion Pricing
      • REST OF SOUTH AMERICA Electronic Toll Collection Market by End Use Type

        • Government
        • Private Operators
        • Transport Authorities
    • MEA Outlook (USD Billion, 2019-2035)

      • MEA Electronic Toll Collection Market by Technology Type

        • Radio Frequency Identification
        • Automatic Number Plate Recognition
        • Smartphone Applications
        • Contactless Payment Systems
      • MEA Electronic Toll Collection Market by Component Type

        • On-Board Units
        • Back Office Systems
        • Roadside Equipment
        • Payment Processing Solutions
      • MEA Electronic Toll Collection Market by Application Type

        • Highway Tolling
        • Urban Tolling
        • Congestion Pricing
      • MEA Electronic Toll Collection Market by End Use Type

        • Government
        • Private Operators
        • Transport Authorities
      • MEA Electronic Toll Collection Market by Regional Type

        • GCC Countries
        • South Africa
        • Rest of MEA
      • GCC COUNTRIES Outlook (USD Billion, 2019-2035)
      • GCC COUNTRIES Electronic Toll Collection Market by Technology Type

        • Radio Frequency Identification
        • Automatic Number Plate Recognition
        • Smartphone Applications
        • Contactless Payment Systems
      • GCC COUNTRIES Electronic Toll Collection Market by Component Type

        • On-Board Units
        • Back Office Systems
        • Roadside Equipment
        • Payment Processing Solutions
      • GCC COUNTRIES Electronic Toll Collection Market by Application Type

        • Highway Tolling
        • Urban Tolling
        • Congestion Pricing
      • GCC COUNTRIES Electronic Toll Collection Market by End Use Type

        • Government
        • Private Operators
        • Transport Authorities
      • SOUTH AFRICA Outlook (USD Billion, 2019-2035)
      • SOUTH AFRICA Electronic Toll Collection Market by Technology Type

        • Radio Frequency Identification
        • Automatic Number Plate Recognition
        • Smartphone Applications
        • Contactless Payment Systems
      • SOUTH AFRICA Electronic Toll Collection Market by Component Type

        • On-Board Units
        • Back Office Systems
        • Roadside Equipment
        • Payment Processing Solutions
      • SOUTH AFRICA Electronic Toll Collection Market by Application Type

        • Highway Tolling
        • Urban Tolling
        • Congestion Pricing
      • SOUTH AFRICA Electronic Toll Collection Market by End Use Type

        • Government
        • Private Operators
        • Transport Authorities
      • REST OF MEA Outlook (USD Billion, 2019-2035)
      • REST OF MEA Electronic Toll Collection Market by Technology Type

        • Radio Frequency Identification
        • Automatic Number Plate Recognition
        • Smartphone Applications
        • Contactless Payment Systems
      • REST OF MEA Electronic Toll Collection Market by Component Type

        • On-Board Units
        • Back Office Systems
        • Roadside Equipment
        • Payment Processing Solutions
      • REST OF MEA Electronic Toll Collection Market by Application Type

        • Highway Tolling
        • Urban Tolling
        • Congestion Pricing
      • REST OF MEA Electronic Toll Collection Market by End Use Type

        • Government
        • Private Operators
        • Transport Authorities
    Electronic Toll Collection Market Research Report -Forecast to 2035 Infographic
    Free Sample Request

    Kindly complete the form below to receive a free sample of this Report

    Customer Strories

    “I am very pleased with how market segments have been defined in a relevant way for my purposes (such as "Portable Freezers & refrigerators" and "last-mile"). In general the report is well structured. Thanks very much for your efforts.”

    Victoria Milne Founder
    Case Study

    Chemicals and Materials