• Cat-intel
  • MedIntelliX
  • Resources
  • About Us
  • Request Free Sample ×

    Kindly complete the form below to receive a free sample of this Report

    Leading companies partner with us for data-driven Insights

    clients tt-cursor

    Electronic Table Games Market

    ID: MRFR/ICT/39073-HCR
    100 Pages
    Aarti Dhapte
    December 2025

    Electronic Table Games Market Research Report: By Game Type (Baccarat, Blackjack, Craps, Roulette, Sic Bo, Other Table Games), By Platform (Desktop, Mobile, Tablet), By Game Provider (Evolution Gaming, Microgaming, NetEnt, Playtech, Other Game Providers), By Bet Size (Low, Medium, High), By Betting Limit (No Limit, Limit) and By Regional (North America, Europe, South America, Asia Pacific, Middle East and Africa) - Forecast to 2032.

    Share:
    Download PDF ×

    We do not share your information with anyone. However, we may send you emails based on your report interest from time to time. You may contact us at any time to opt-out.

    Electronic Table Games Market Research Report - Forecast To 2032 Infographic
    Purchase Options
    $ 4,950.0
    $ 5,950.0
    $ 7,250.0
    Table of Contents

    Electronic Table Games Market Summary

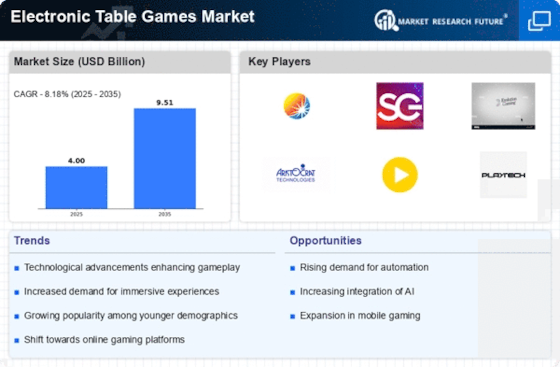
    The Global Electronic Table Games Market is projected to grow significantly from 3.86 USD Billion in 2024 to 9.5 USD Billion by 2035.

    Key Market Trends & Highlights

    Electronic Table Games Key Trends and Highlights

    • The market is expected to witness a compound annual growth rate of 8.53 percent from 2025 to 2035.
    • By 2035, the market valuation is anticipated to reach 9.5 USD Billion, indicating robust growth potential.
    • In 2024, the market is valued at 3.86 USD Billion, reflecting a strong foundation for future expansion.
    • Growing adoption of electronic gaming technology due to increasing consumer demand for innovative gaming experiences is a major market driver.

    Market Size & Forecast

    2024 Market Size 3.86 (USD Billion)
    2035 Market Size 9.5 (USD Billion)
    CAGR (2025-2035) 8.53%

    Major Players

    IGT, Aristocrat Leisure, Penn National Gaming, Inc., Entain PLC, BetMGM, Esports Technologies Inc., Golden Nugget Online Gaming, Inc., PlayAGS Inc., Light Wonder Inc., International Game Technology PLC, Everi Holdings Inc., Caesars Entertainment Corporation, Boyd Gaming Corporation, Scientific Games, Konami Gaming Inc.

    Electronic Table Games Market Trends

    The Global Electronic Table Games Market is experiencing a notable shift towards digitalization, as advancements in technology and changing consumer preferences appear to drive increased engagement and innovation in gaming experiences.

    U.S. Department of Commerce

    Electronic Table Games Market Drivers

    Technological Advancements

    The Global Electronic Table Games Market Industry is experiencing a surge due to rapid technological advancements. Innovations in software and hardware enhance user experience, making games more engaging and interactive. For instance, the integration of virtual reality and augmented reality technologies is transforming traditional gaming experiences. This shift is likely to attract a broader audience, including younger demographics who are more inclined towards immersive experiences. As a result, the market is projected to grow from 3.86 USD Billion in 2024 to 9.5 USD Billion by 2035, indicating a robust demand driven by these advancements.

    Market Segment Insights

    Electronic Table Games Market Game Type Insights

    The Game Type segment of the Global Electronic Table Games Market is categorized into Baccarat, Blackjack, Craps, Roulette, Sic Bo, and Other Table Games. Among these, Baccarat holds the largest market share due to its popularity in Asian countries, particularly Macau. In 2023, the Baccarat segment generated a revenue of USD 1.5 billion, and it is projected to reach USD 2.4 billion by 2032, exhibiting a CAGR of 8.4%. Blackjack, another popular game type, is expected to witness a stable growth rate during the forecast period.

    In 2023, the Blackjack segment held a revenue share of 28.3%, and it is anticipated to reach USD 2.1 billion by 2032.Craps, a dice-based game, is gaining traction in North America and Europe. The Craps segment is expected to grow at a CAGR of 7.9% during the forecast period, reaching a valuation of USD 1.2 billion by 2032. Roulette, a classic casino game, is expected to maintain a steady growth rate throughout the forecast period. The Roulette segment is projected to generate a revenue of USD 1.9 billion by 2032, exhibiting a CAGR of 8.2%.

    Sic Bo, a game of Chinese origin, is gaining popularity in Asian markets. The Sic Bo segment is anticipated to grow at a CAGR of 8.6% during the forecast period, reaching a valuation of USD 1.1 billion by 2032.Other Table Games, which include a variety of games such as Pai Gow, Let It Ride, and Casino War, are expected to experience a moderate growth rate during the forecast period.

    Source: Primary Research, Secondary Research, Market Research Future Database and Analyst Review

    Electronic Table Games Market Platform Insights

    The Global Electronic Table Games Market is segmented into the platform, which includes desktop, mobile, and tablet. In 2023, the desktop platform held the largest market share. The mobile platform is projected to grow at the highest CAGR during the forecast period. The desktop platform is popular due to its large screen size, which provides a more immersive gaming experience. The mobile platform is gaining popularity due to the increasing adoption of smartphones and tablets.

    The tablet platform is expected to grow at a steady pace during the forecast period.The Global Electronic Table Games Market is driven by the increasing popularity of online gambling. The market is also driven by the growing number of mobile and tablet users. The increasing adoption of artificial intelligence (AI) and virtual reality (VR) technologies is also expected to drive the growth of the market.

    Electronic Table Games Market Game Provider Insights

    The Game Provider segment plays a pivotal role in the Global Electronic Table Games Market, shaping its competitive landscape and driving market growth. Leading providers like Evolution Gaming, Microgaming, NetEnt, Playtech, and other notable players dominate this segment, offering a diverse range of innovative and engaging electronic table games. By leveraging advanced technologies and captivating gameplay mechanics, these providers cater to the evolving preferences of players.

    The Global Electronic Table Games Market revenue is projected to reach a substantial USD 3.7 billion in 2023, with a steady rise anticipated in the coming years.This growth is attributed to the increasing demand for immersive gaming experiences coupled with the rise of online casinos and mobile gaming platforms. The market segmentation provides valuable insights into the competitive dynamics, allowing stakeholders to identify growth opportunities and tailor their strategies accordingly.

    Electronic Table Games Market Bet Size Insights

    The Global Electronic Table Games Market is segmented by Bet Size into Low, Medium, and High. Among these segments, the High bet size segment is expected to hold the largest market share in 2023, accounting for around 45% of the Global Electronic Table Games Market revenue. The popularity of high-bet size games can be attributed to the thrill and excitement they offer to players. Additionally, the growing number of high-stakes players is driving the growth of this segment.

    The Medium bet size segment is expected to witness significant growth over the forecast period, owing to the increasing popularity of electronic table games among casual players.The Low bet size segment is also expected to grow during the forecast period, as it caters to players with lower budgets.

    Electronic Table Games Market Betting Limit Insights

    The Betting Limit segment is a crucial factor influencing the Global Electronic Table Games Market revenue. It is broadly divided into two categories: 'No Limit' and 'Limit'. In 2023, the 'No Limit' segment held a dominant market share, accounting for around 65% of the global market. This dominance is attributed to the increasing popularity of high-stakes gambling and the thrill associated with it. On the other hand, the 'Limit' segment is expected to witness a significant growth rate during the forecast period 2023-2032.

    This growth is primarily driven by the increasing participation of casual and recreational players who prefer lower-stakes games.Additionally, strict regulations and responsible gambling initiatives in various jurisdictions are encouraging players to opt for 'Limit' games to minimize potential losses. As a result, the 'Limit' segment is projected to gain a larger market share in the coming years. Understanding the dynamics of the Betting Limit segment is essential for market participants to develop targeted strategies and cater to the diverse needs of players in the Global Electronic Table Games Market.

    Get more detailed insights about Electronic Table Games Market Research Report - Forecast To 2032

    Regional Insights

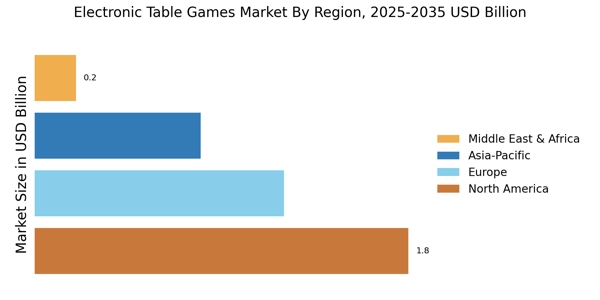
    Regional insights: The Global Electronic Table Games Market is segmented into North America, Europe, APAC, South America, and MEA. North America is the largest regional market, accounting for over 40% of the global market revenue in 2023. The market growth in this region is attributed to the increasing adoption of electronic table games in casinos and the rising popularity of online gambling. Europe is the second largest regional market, with a market size of approximately USD 1.5 billion in 2023.

    The market growth in this region is driven by the increasing demand for electronic table games in land-based casinos and the growing popularity of online gambling.The APAC region is expected to witness the highest market growth during the forecast period, with a CAGR of over 10%. The market growth in this region is attributed to the increasing number of casinos and the increasing adoption of electronic table games in these casinos. South America and MEA are relatively smaller regional markets, with a combined market size of less than USD 1 billion in 2023.

    However, these regions are expected to witness significant market growth during the forecast period, driven by the increasing adoption of electronic table games in casinos and the growing popularity of online gambling.

    Electronic Table Games Market regional insights

    Source: Primary Research, Secondary Research, Market Research Future Database and Analyst Review

    Key Players and Competitive Insights

    Major players in the Electronic Table Games Market industry are focusing on developing innovative products and solutions to meet the evolving demands of customers. Leading Electronic Table Games Market players are investing heavily in research and development to stay ahead of the competition. This has resulted in the introduction of new features and technologies in Electronic Table Games Market products. Electronic Table Games Market development is being driven by the increasing popularity of online gambling and the growing demand for immersive gaming experiences.

    The Electronic Table Games Market Competitive Landscape is expected to remain competitive in the future, with new entrants and established players vying for market share.IGT is a leading provider of Electronic Table Games Market products and solutions. The company offers a wide range of Electronic Table Games Market products, including roulette, blackjack, baccarat, and poker. IGT's Electronic Table Games Market products are known for their high quality and reliability. The company has a strong global presence and a large customer base. IGT is investing heavily in research and development to stay ahead of the competition.

    The company is committed to providing its customers with the latest and most innovative Electronic Table Games Market products and solutions.Aristocrat Leisure is another major player in the Electronic Table Games Market industry. The company offers a wide range of Electronic Table Games Market products, including slot machines, video poker machines, and table games. Aristocrat Leisure's Electronic Table Games Market products are known for their innovative features and high-quality graphics. The company has a strong global presence and a large customer base. Aristocrat Leisure is investing heavily in research and development to stay ahead of the competition.

    The company is committed to providing its customers with the latest and most innovative Electronic Table Games Market products and solutions.

    Key Companies in the Electronic Table Games Market market include

    Industry Developments

    Recent advancements in technology have propelled the growth of the global electronic table games market. In 2023, the market was valued at USD 3.7 billion and is projected to expand at a CAGR of 8.18% from 2024 to 2032, reaching a valuation of USD 7.5 billion by 2032. This growth is attributed to factors such as the increasing adoption of electronic table games in casinos, technological advancements, and rising disposable income. Key industry players are focusing on developing innovative products and expanding their global presence.

    For instance, in February 2023, PlayAGS, a leading provider of electronic gaming machines, announced a partnership with BetMGM to launch its latest electronic table games in Michigan.

    Future Outlook

    Electronic Table Games Market Future Outlook

    The Electronic Table Games Market is projected to grow at an 8.53% CAGR from 2024 to 2035, driven by technological advancements, increased consumer engagement, and expanding online gaming platforms.

    New opportunities lie in:

    • Develop immersive VR experiences to enhance player engagement and attract new demographics.
    • Leverage AI for personalized gaming experiences and improved customer service.
    • Expand partnerships with online casinos to integrate electronic table games into their platforms.

    By 2035, the Electronic Table Games Market is expected to achieve substantial growth, reflecting evolving consumer preferences and technological innovations.

    Market Segmentation

    Electronic Table Games Market Bet Size Outlook

    • No Limit
    • Limit

    Electronic Table Games Market Platform Outlook

    • Evolution Gaming
    • Microgaming
    • NetEnt
    • Playtech
    • Other Game Providers

    Electronic Table Games Market Regional Outlook

    • North America
    • Europe
    • South America
    • Asia Pacific
    • Middle East and Africa

    Electronic Table Games Market Game Type Outlook

    • Desktop
    • Mobile
    • Tablet

    Electronic Table Games Market Betting Limit Outlook

    • North America
    • Europe
    • South America
    • Asia Pacific
    • Middle East and Africa

    Electronic Table Games Market Game Provider Outlook

    • Low
    • Medium
    • High

    Report Scope

    Electronic Table Games Market Report Scope
    Report Attribute/Metric Details
    Market Size 2022 3.42(USD Billion)
    Market Size 2023 3.7(USD Billion)
    Market Size 2032 7.5(USD Billion)
    Compound Annual Growth Rate (CAGR) 8.18% (2024 - 2032)
    Report Coverage Revenue Forecast, Competitive Landscape, Growth Factors, and Trends
    Base Year 2023
    Market Forecast Period 2024 - 2032
    Historical Data 2019 - 2023
    Market Forecast Units USD Billion
    Key Companies Profiled Penn National Gaming, Inc., Entain PLC, BetMGM, Esports Technologies Inc., Golden Nugget Online Gaming, Inc., PlayAGS Inc., Light & Wonder Inc., Aristocrat Leisure Limited, International Game Technology PLC, Everi Holdings Inc., Caesars Entertainment Corporation, Boyd Gaming Corporation, Scientific Games, Konami Gaming Inc.    
    Segments Covered Game Type, Platform, Game Provider, Bet Size, Betting Limit, Regional.    
    Key Market Opportunities Growing Popularity of Casino GamingTechnological Advancements in Electronic GamingExpansion of Gaming VenuesIncreased Demand for Immersive Gaming ExperiencesRising Consumer Disposable Income
    Key Market Dynamics 1 Rising popularity of online gambling2 Technological advancements3 Increasing demand for immersive gaming experiences4 Growing disposable income5 Expansion of the gaming industry
    Countries Covered North America, Europe, APAC, South America, MEA

    Market Highlights

    Author
    Aarti Dhapte
    Team Lead - Research

    She holds an experience of about 6+ years in Market Research and Business Consulting, working under the spectrum of Information Communication Technology, Telecommunications and Semiconductor domains. Aarti conceptualizes and implements a scalable business strategy and provides strategic leadership to the clients. Her expertise lies in market estimation, competitive intelligence, pipeline analysis, customer assessment, etc.

    Leave a Comment

    FAQs

    What is the market size of the Global Electronic Table Games Market?

    The global electronic table games market size was valued at USD 3.7 billion in 2023 and is projected to grow at a CAGR of 8.18% from 2024 to 2032, reaching USD 7.5 billion by 2032.

    What are the key regions contributing to the growth of the Global Electronic Table Games Market?

    North America and Europe are the dominant regions in the electronic table games market, accounting for a significant share of the global revenue. The Asia Pacific region is anticipated to witness the highest growth rate during the forecast period due to the rising popularity of electronic table games in countries such as China, India, and Japan.

    What are the major applications of Electronic Table Games?

    Electronic table games are primarily used in casinos and resorts to provide a realistic and immersive gaming experience. They are also gaining popularity in social gaming platforms and online casinos, allowing players to enjoy table games from the comfort of their own homes.

    Who are the key competitors in the Global Electronic Table Games Market?

    The key competitors in the global electronic table games market include Aristocrat Leisure Limited, IGT, Scientific Games Corporation, Novomatic AG, and Konami Corporation. These companies offer a wide range of electronic table games, including roulette, blackjack, baccarat, and poker.

    What are the factors driving the growth of the Global Electronic Table Games Market?

    The growth of the global electronic table games market is primarily driven by the increasing popularity of casino gaming, the rising adoption of electronic table games in casinos and resorts, and the growing demand for immersive and convenient gaming experiences.

    What are the challenges faced by the Global Electronic Table Games Market?

    The global electronic table games market faces challenges such as the high cost of manufacturing and maintaining electronic table games, the competition from traditional table games, and the regulatory restrictions on gambling in certain regions.

    What are the latest trends in the Global Electronic Table Games Market?

    The latest trends in the global electronic table games market include the integration of advanced technologies such as virtual reality and augmented reality, the development of skill-based electronic table games, and the growing popularity of online and mobile electronic table games.

    What is the expected growth rate of the Global Electronic Table Games Market?

    The global electronic table games market is projected to grow at a CAGR of 8.18% from 2024 to 2032.

    What are the key factors to consider when investing in the Global Electronic Table Games Market?

    Key factors to consider when investing in the global electronic table games market include the market size and growth potential, the competitive landscape, the regulatory environment, and the technological advancements in the industry.

    What is the future outlook of the Global Electronic Table Games Market?

    The future outlook for the global electronic table games market is positive, with the market expected to continue growing in the coming years. The rising popularity of casino gaming, the increasing adoption of electronic table games, and the technological advancements in the industry are expected to drive the growth of the market.

    1. 'Table of Contents
    2. EXECUTIVE SUMMARY
    3. Market Overview
      1. Key Findings
      2. Market Segmentation
    4. Competitive Landscape
      1. Challenges and Opportunities
      2. Future Outlook
    5. MARKET INTRODUCTION
      1. Definition
      2. Scope of the study
        1. Research Objective
        2. Assumption
        3. Limitations
    6. RESEARCH METHODOLOGY
      1. Overview
    7. Data Mining
      1. Secondary Research
      2. Primary Research
    8. Primary Interviews and Information Gathering Process
      1. Breakdown of Primary
    9. Respondents
      1. Forecasting Model
      2. Market Size Estimation
    10. Bottom-Up Approach
      1. Top-Down Approach
      2. Data Triangulation
      3. Validation
    11. MARKET DYNAMICS
      1. Overview
      2. Drivers
      3. Restraints
      4. Opportunities
    12. MARKET FACTOR ANALYSIS
      1. Value chain Analysis
      2. Porter''s Five Forces
    13. Analysis
      1. Bargaining Power of Suppliers
        1. Bargaining Power
    14. of Buyers
      1. Threat of New Entrants
        1. Threat of Substitutes
        2. Intensity of Rivalry
      2. COVID-19 Impact Analysis
    15. Market Impact Analysis
      1. Regional Impact
        1. Opportunity and
    16. Threat Analysis
    17. Electronic Table Games Market, BY Game
    18. Type (USD Billion)
      1. Baccarat
      2. Blackjack
      3. Craps
      4. Roulette
      5. Sic Bo
      6. Other Table Games
    19. Electronic
      1. Desktop
      2. Mobile
      3. Tablet
    20. Electronic Table Games Market, BY Game Provider (USD
    21. Billion)
      1. Evolution Gaming
      2. Microgaming
      3. NetEnt
      4. Playtech
      5. Other Game Providers
    22. Electronic Table Games
    23. Market, BY Bet Size (USD Billion)
      1. Low
      2. Medium
      3. High
    24. Electronic Table Games Market, BY Betting Limit (USD Billion)
    25. No Limit
      1. Limit
    26. Electronic Table Games Market, BY Regional
    27. (USD Billion)
      1. North America
        1. US
        2. Canada
      2. Europe
        1. Germany
        2. UK
        3. France
    28. Russia
      1. Italy
        1. Spain
        2. Rest of Europe
      2. APAC
        1. China
        2. India
        3. Japan
    29. South Korea
      1. Malaysia
        1. Thailand
        2. Indonesia
        3. Rest of APAC
      2. South America
        1. Brazil
    30. Mexico
      1. Argentina
        1. Rest of South America
      2. MEA
        1. GCC Countries
        2. South Africa
        3. Rest of MEA
    31. Competitive Landscape
      1. Overview
    32. Competitive Analysis
      1. Market share Analysis
      2. Major Growth
    33. Strategy in the Electronic Table Games Market
      1. Competitive Benchmarking
      2. Leading Players in Terms of Number of Developments in the Electronic
      3. Key developments and growth strategies
    34. New Product Launch/Service Deployment
      1. Merger & Acquisitions
        1. Joint Ventures
      2. Major Players Financial Matrix
    35. Sales and Operating Income
      1. Major Players R&D Expenditure. 2023
    36. Company Profiles
      1. Penn National Gaming, Inc.
    37. Financial Overview
      1. Products Offered
        1. Key Developments
        2. SWOT Analysis
        3. Key Strategies
      2. Entain PLC
        1. Financial Overview
        2. Products Offered
        3. Key
    38. Developments
      1. SWOT Analysis
        1. Key Strategies
    39. BetMGM
      1. Financial Overview
        1. Products Offered
    40. Key Developments
      1. SWOT Analysis
        1. Key Strategies
    41. Esports Technologies Inc.
      1. Financial Overview
        1. Products
    42. Offered
      1. Key Developments
        1. SWOT Analysis
    43. Key Strategies
      1. Golden Nugget Online Gaming, Inc.
        1. Financial
    44. Overview
      1. Products Offered
        1. Key Developments
    45. SWOT Analysis
      1. Key Strategies
      2. PlayAGS Inc.
    46. Financial Overview
      1. Products Offered
        1. Key Developments
        2. SWOT Analysis
        3. Key Strategies
      2. Light Wonder
    47. Inc
      1. Financial Overview
        1. Products Offered
    48. Key Developments
      1. SWOT Analysis
        1. Key Strategies
    49. Aristocrat Leisure Limited
      1. Financial Overview
        1. Products
    50. Offered
      1. Key Developments
        1. SWOT Analysis
    51. Key Strategies
      1. International Game Technology PLC
        1. Financial
    52. Overview
      1. Products Offered
        1. Key Developments
    53. SWOT Analysis
      1. Key Strategies
      2. Everi Holdings Inc
    54. Financial Overview
      1. Products Offered
        1. Key Developments
        2. SWOT Analysis
        3. Key Strategies
      2. Caesars
    55. Entertainment Corporation
      1. Financial Overview
        1. Products
    56. Offered
      1. Key Developments
        1. SWOT Analysis
    57. Key Strategies
      1. Boyd Gaming Corporation
        1. Financial Overview
        2. Products Offered
        3. Key Developments
        4. SWOT
    58. Analysis
      1. Key Strategies
      2. Scientific Games
    59. Financial Overview
      1. Products Offered
        1. Key Developments
        2. SWOT Analysis
        3. Key Strategies
      2. Konami Gaming
    60. Inc.
      1. Financial Overview
        1. Products Offered
    61. Key Developments
      1. SWOT Analysis
        1. Key Strategies
    62. Appendix
      1. References
      2. Related Reports
    63. FORECAST, BY PLATFORM, 2019-2032 (USD Billions)
    64. Billions)
    65. & FORECAST, BY BET SIZE, 2019-2032 (USD Billions)
    66. Electronic Table Games Market SIZE ESTIMATES & FORECAST, BY BETTING LIMIT, 2019-2032
    67. (USD Billions)
    68. & FORECAST, BY REGIONAL, 2019-2032 (USD Billions)
    69. PLATFORM, 2019-2032 (USD Billions)
    70. SIZE ESTIMATES & FORECAST, BY GAME PROVIDER, 2019-2032 (USD Billions)
    71. US Electronic Table Games Market SIZE ESTIMATES & FORECAST, BY BET SIZE,
    72. 2032 (USD Billions)
    73. & FORECAST, BY BETTING LIMIT, 2019-2032 (USD Billions)
    74. BY GAME TYPE, 2019-2032 (USD Billions)
    75. Market SIZE ESTIMATES & FORECAST, BY PLATFORM, 2019-2032 (USD Billions)
    76. BY GAME PROVIDER, 2019-2032 (USD Billions)
    77. Games Market SIZE ESTIMATES & FORECAST, BY BET SIZE, 2019-2032 (USD Billions)
    78. BY BETTING LIMIT, 2019-2032 (USD Billions)
    79. Games Market SIZE ESTIMATES & FORECAST, BY REGIONAL, 2019-2032 (USD Billions)
    80. BY GAME TYPE, 2019-2032 (USD Billions)
    81. Market SIZE ESTIMATES & FORECAST, BY PLATFORM, 2019-2032 (USD Billions)
    82. BY GAME PROVIDER, 2019-2032 (USD Billions)
    83. Games Market SIZE ESTIMATES & FORECAST, BY BET SIZE, 2019-2032 (USD Billions)
    84. BY BETTING LIMIT, 2019-2032 (USD Billions)
    85. Games Market SIZE ESTIMATES & FORECAST, BY REGIONAL, 2019-2032 (USD Billions)
    86. BY GAME TYPE, 2019-2032 (USD Billions)
    87. Games Market SIZE ESTIMATES & FORECAST, BY PLATFORM, 2019-2032 (USD Billions)
    88. BY GAME PROVIDER, 2019-2032 (USD Billions)
    89. Games Market SIZE ESTIMATES & FORECAST, BY BET SIZE, 2019-2032 (USD Billions)
    90. BY BETTING LIMIT, 2019-2032 (USD Billions)
    91. Games Market SIZE ESTIMATES & FORECAST, BY REGIONAL, 2019-2032 (USD Billions)
    92. BY GAME TYPE, 2019-2032 (USD Billions)
    93. Market SIZE ESTIMATES & FORECAST, BY PLATFORM, 2019-2032 (USD Billions)
    94. PROVIDER, 2019-2032 (USD Billions)
    95. SIZE ESTIMATES & FORECAST, BY BET SIZE, 2019-2032 (USD Billions)
    96. UK Electronic Table Games Market SIZE ESTIMATES & FORECAST, BY BETTING LIMIT,
    97. 2032 (USD Billions)
    98. & FORECAST, BY REGIONAL, 2019-2032 (USD Billions)
    99. BY PLATFORM, 2019-2032 (USD Billions)
    100. Market SIZE ESTIMATES & FORECAST, BY GAME PROVIDER, 2019-2032 (USD Billions)
    101. BY BET SIZE, 2019-2032 (USD Billions)
    102. Market SIZE ESTIMATES & FORECAST, BY BETTING LIMIT, 2019-2032 (USD Billions)
    103. BY REGIONAL, 2019-2032 (USD Billions)
    104. Market SIZE ESTIMATES & FORECAST, BY GAME TYPE, 2019-2032 (USD Billions)
    105. BY PLATFORM, 2019-2032 (USD Billions)
    106. Market SIZE ESTIMATES & FORECAST, BY GAME PROVIDER, 2019-2032 (USD Billions)
    107. BY BET SIZE, 2019-2032 (USD Billions)
    108. Market SIZE ESTIMATES & FORECAST, BY BETTING LIMIT, 2019-2032 (USD Billions)
    109. BY REGIONAL, 2019-2032 (USD Billions)
    110. Market SIZE ESTIMATES & FORECAST, BY GAME TYPE, 2019-2032 (USD Billions)
    111. PLATFORM, 2019-2032 (USD Billions)
    112. Market SIZE ESTIMATES & FORECAST, BY GAME PROVIDER, 2019-2032 (USD Billions)
    113. BY BET SIZE, 2019-2032 (USD Billions)
    114. Market SIZE ESTIMATES & FORECAST, BY BETTING LIMIT, 2019-2032 (USD Billions)
    115. BY REGIONAL, 2019-2032 (USD Billions)
    116. Market SIZE ESTIMATES & FORECAST, BY GAME TYPE, 2019-2032 (USD Billions)
    117. PLATFORM, 2019-2032 (USD Billions)
    118. Market SIZE ESTIMATES & FORECAST, BY GAME PROVIDER, 2019-2032 (USD Billions)
    119. BY BET SIZE, 2019-2032 (USD Billions)
    120. Market SIZE ESTIMATES & FORECAST, BY BETTING LIMIT, 2019-2032 (USD Billions)
    121. BY REGIONAL, 2019-2032 (USD Billions)
    122. FORECAST, BY PLATFORM, 2019-2032 (USD Billions)
    123. Billions)
    124. & FORECAST, BY BET SIZE, 2019-2032 (USD Billions)
    125. Electronic Table Games Market SIZE ESTIMATES & FORECAST, BY BETTING LIMIT, 2019-2032
    126. (USD Billions)
    127. ESTIMATES & FORECAST, BY REGIONAL, 2019-2032 (USD Billions)
    128. APAC Electronic Table Games Market SIZE ESTIMATES & FORECAST, BY GAME TYPE,
    129. 2032 (USD Billions)
    130. ESTIMATES & FORECAST, BY PLATFORM, 2019-2032 (USD Billions)
    131. APAC Electronic Table Games Market SIZE ESTIMATES & FORECAST, BY GAME PROVIDER,
    132. 2032 (USD Billions)
    133. ESTIMATES & FORECAST, BY BET SIZE, 2019-2032 (USD Billions)
    134. APAC Electronic Table Games Market SIZE ESTIMATES & FORECAST, BY BETTING LIMIT,
    135. 2032 (USD Billions)
    136. ESTIMATES & FORECAST, BY REGIONAL, 2019-2032 (USD Billions)
    137. China Electronic Table Games Market SIZE ESTIMATES & FORECAST, BY GAME TYPE,
    138. 2032 (USD Billions)
    139. ESTIMATES & FORECAST, BY PLATFORM, 2019-2032 (USD Billions)
    140. China Electronic Table Games Market SIZE ESTIMATES & FORECAST, BY GAME PROVIDER,
    141. 2032 (USD Billions)
    142. ESTIMATES & FORECAST, BY BET SIZE, 2019-2032 (USD Billions)
    143. China Electronic Table Games Market SIZE ESTIMATES & FORECAST, BY BETTING LIMIT,
    144. 2032 (USD Billions)
    145. ESTIMATES & FORECAST, BY REGIONAL, 2019-2032 (USD Billions)
    146. India Electronic Table Games Market SIZE ESTIMATES & FORECAST, BY GAME TYPE,
    147. 2032 (USD Billions)
    148. ESTIMATES & FORECAST, BY PLATFORM, 2019-2032 (USD Billions)
    149. India Electronic Table Games Market SIZE ESTIMATES & FORECAST, BY GAME PROVIDER,
    150. 2032 (USD Billions)
    151. ESTIMATES & FORECAST, BY BET SIZE, 2019-2032 (USD Billions)
    152. India Electronic Table Games Market SIZE ESTIMATES & FORECAST, BY BETTING LIMIT,
    153. 2032 (USD Billions)
    154. ESTIMATES & FORECAST, BY REGIONAL, 2019-2032 (USD Billions)
    155. Japan Electronic Table Games Market SIZE ESTIMATES & FORECAST, BY GAME TYPE,
    156. 2032 (USD Billions)
    157. ESTIMATES & FORECAST, BY PLATFORM, 2019-2032 (USD Billions)
    158. Japan Electronic Table Games Market SIZE ESTIMATES & FORECAST, BY GAME PROVIDER,
    159. 2032 (USD Billions)
    160. ESTIMATES & FORECAST, BY BET SIZE, 2019-2032 (USD Billions)
    161. Japan Electronic Table Games Market SIZE ESTIMATES & FORECAST, BY BETTING LIMIT,
    162. 2032 (USD Billions)
    163. ESTIMATES & FORECAST, BY REGIONAL, 2019-2032 (USD Billions)
    164. South Korea Electronic Table Games Market SIZE ESTIMATES & FORECAST, BY GAME
    165. TYPE, 2019-2032 (USD Billions)
    166. Market SIZE ESTIMATES & FORECAST, BY PLATFORM, 2019-2032 (USD Billions)
    167. BY GAME PROVIDER, 2019-2032 (USD Billions)
    168. BY BETTING LIMIT, 2019-2032 (USD Billions)
    169. BY GAME TYPE, 2019-2032 (USD Billions)
    170. Games Market SIZE ESTIMATES & FORECAST, BY PLATFORM, 2019-2032 (USD Billions)
    171. BY GAME PROVIDER, 2019-2032 (USD Billions)
    172. BY BETTING LIMIT, 2019-2032 (USD Billions)
    173. BY GAME TYPE, 2019-2032 (USD Billions)
    174. Games Market SIZE ESTIMATES & FORECAST, BY PLATFORM, 2019-2032 (USD Billions)
    175. BY GAME PROVIDER, 2019-2032 (USD Billions)
    176. BY BETTING LIMIT, 2019-2032 (USD Billions)
    177. BY GAME TYPE, 2019-2032 (USD Billions)
    178. Games Market SIZE ESTIMATES & FORECAST, BY PLATFORM, 2019-2032 (USD Billions)
    179. BY GAME PROVIDER, 2019-2032 (USD Billions)
    180. BY BETTING LIMIT, 2019-2032 (USD Billions)
    181. FORECAST, BY GAME TYPE, 2019-2032 (USD Billions)
    182. FORECAST, BY GAME PROVIDER, 2019-2032 (USD Billions)
    183. Electronic Table Games Market SIZE ESTIMATES & FORECAST, BY BET SIZE, 2019-2032
    184. (USD Billions)
    185. ESTIMATES & FORECAST, BY BETTING LIMIT, 2019-2032 (USD Billions)
    186. Rest of APAC Electronic Table Games Market SIZE ESTIMATES & FORECAST, BY
    187. REGIONAL, 2019-2032 (USD Billions)
    188. Games Market SIZE ESTIMATES & FORECAST, BY GAME TYPE, 2019-2032 (USD Billions)
    189. FORECAST, BY PLATFORM, 2019-2032 (USD Billions)
    190. Billions)
    191. & FORECAST, BY BET SIZE, 2019-2032 (USD Billions)
    192. Electronic Table Games Market SIZE ESTIMATES & FORECAST, BY BETTING LIMIT, 2019-2032
    193. (USD Billions)
    194. ESTIMATES & FORECAST, BY REGIONAL, 2019-2032 (USD Billions)
    195. Brazil Electronic Table Games Market SIZE ESTIMATES & FORECAST, BY GAME TYPE,
    196. 2032 (USD Billions)
    197. ESTIMATES & FORECAST, BY PLATFORM, 2019-2032 (USD Billions)
    198. Brazil Electronic Table Games Market SIZE ESTIMATES & FORECAST, BY GAME PROVIDER,
    199. 2032 (USD Billions)
    200. ESTIMATES & FORECAST, BY BET SIZE, 2019-2032 (USD Billions)
    201. Brazil Electronic Table Games Market SIZE ESTIMATES & FORECAST, BY BETTING LIMIT,
    202. 2032 (USD Billions)
    203. ESTIMATES & FORECAST, BY REGIONAL, 2019-2032 (USD Billions)
    204. Mexico Electronic Table Games Market SIZE ESTIMATES & FORECAST, BY GAME TYPE,
    205. 2032 (USD Billions)
    206. ESTIMATES & FORECAST, BY PLATFORM, 2019-2032 (USD Billions)
    207. Mexico Electronic Table Games Market SIZE ESTIMATES & FORECAST, BY GAME PROVIDER,
    208. 2032 (USD Billions)
    209. ESTIMATES & FORECAST, BY BET SIZE, 2019-2032 (USD Billions)
    210. Mexico Electronic Table Games Market SIZE ESTIMATES & FORECAST, BY BETTING LIMIT,
    211. 2032 (USD Billions)
    212. ESTIMATES & FORECAST, BY REGIONAL, 2019-2032 (USD Billions)
    213. Argentina Electronic Table Games Market SIZE ESTIMATES & FORECAST, BY GAME TYPE,
    214. 2032 (USD Billions)
    215. SIZE ESTIMATES & FORECAST, BY PLATFORM, 2019-2032 (USD Billions)
    216. Argentina Electronic Table Games Market SIZE ESTIMATES & FORECAST, BY GAME
    217. PROVIDER, 2019-2032 (USD Billions)
    218. Market SIZE ESTIMATES & FORECAST, BY BET SIZE, 2019-2032 (USD Billions)
    219. BY BETTING LIMIT, 2019-2032 (USD Billions)
    220. & FORECAST, BY GAME TYPE, 2019-2032 (USD Billions)
    221. South America Electronic Table Games Market SIZE ESTIMATES & FORECAST, BY PLATFORM,
    222. 2032 (USD Billions)
    223. Games Market SIZE ESTIMATES & FORECAST, BY GAME PROVIDER, 2019-2032 (USD Billions)
    224. & FORECAST, BY BET SIZE, 2019-2032 (USD Billions)
    225. America Electronic Table Games Market SIZE ESTIMATES & FORECAST, BY BETTING
    226. LIMIT, 2019-2032 (USD Billions)
    227. BY GAME TYPE, 2019-2032 (USD Billions)
    228. Market SIZE ESTIMATES & FORECAST, BY PLATFORM, 2019-2032 (USD Billions)
    229. GAME PROVIDER, 2019-2032 (USD Billions)
    230. Market SIZE ESTIMATES & FORECAST, BY BET SIZE, 2019-2032 (USD Billions)
    231. BETTING LIMIT, 2019-2032 (USD Billions)
    232. Market SIZE ESTIMATES & FORECAST, BY REGIONAL, 2019-2032 (USD Billions)
    233. BY GAME TYPE, 2019-2032 (USD Billions)
    234. FORECAST, BY GAME PROVIDER, 2019-2032 (USD Billions)
    235. Electronic Table Games Market SIZE ESTIMATES & FORECAST, BY BET SIZE, 2019-2032
    236. (USD Billions)
    237. ESTIMATES & FORECAST, BY BETTING LIMIT, 2019-2032 (USD Billions)
    238. GCC Countries Electronic Table Games Market SIZE ESTIMATES & FORECAST,
    239. BY REGIONAL, 2019-2032 (USD Billions)
    240. Games Market SIZE ESTIMATES & FORECAST, BY GAME TYPE, 2019-2032 (USD Billions)
    241. FORECAST, BY PLATFORM, 2019-2032 (USD Billions)
    242. Billions)
    243. & FORECAST, BY BET SIZE, 2019-2032 (USD Billions)
    244. Electronic Table Games Market SIZE ESTIMATES & FORECAST, BY BETTING LIMIT, 2019-2032
    245. (USD Billions)
    246. ESTIMATES & FORECAST, BY REGIONAL, 2019-2032 (USD Billions)
    247. Rest of MEA Electronic Table Games Market SIZE ESTIMATES & FORECAST, BY GAME
    248. TYPE, 2019-2032 (USD Billions)
    249. Market SIZE ESTIMATES & FORECAST, BY PLATFORM, 2019-2032 (USD Billions)
    250. BY GAME PROVIDER, 2019-2032 (USD Billions)
    251. FORECAST, BY BETTING LIMIT, 2019-2032 (USD Billions)
    252. Electronic Table Games Market SIZE ESTIMATES & FORECAST, BY REGIONAL, 2019-2032
    253. (USD Billions)
    254. MARKET SYNOPSIS
    255. US ELECTRONIC TABLE GAMES MARKET ANALYSIS BY PLATFORM
    256. GAMES MARKET ANALYSIS BY BET SIZE
    257. ANALYSIS BY BETTING LIMIT
    258. BY REGIONAL
    259. TYPE
    260. CANADA ELECTRONIC TABLE GAMES MARKET ANALYSIS BY BETTING LIMIT
    261. CANADA ELECTRONIC TABLE GAMES MARKET ANALYSIS BY REGIONAL
    262. ELECTRONIC TABLE GAMES MARKET ANALYSIS
    263. GAMES MARKET ANALYSIS BY GAME TYPE
    264. MARKET ANALYSIS BY PLATFORM
    265. ANALYSIS BY GAME PROVIDER
    266. ANALYSIS BY BET SIZE
    267. BY BETTING LIMIT
    268. BY REGIONAL
    269. UK ELECTRONIC TABLE GAMES MARKET ANALYSIS BY GAME PROVIDER
    270. UK ELECTRONIC TABLE GAMES MARKET ANALYSIS BY BET SIZE
    271. GAMES MARKET ANALYSIS BY REGIONAL
    272. MARKET ANALYSIS BY GAME TYPE
    273. ANALYSIS BY PLATFORM
    274. BY GAME PROVIDER
    275. BY BET SIZE
    276. LIMIT
    277. RUSSIA ELECTRONIC TABLE GAMES MARKET ANALYSIS BY GAME PROVIDER
    278. RUSSIA ELECTRONIC TABLE GAMES MARKET ANALYSIS BY BET SIZE
    279. ELECTRONIC TABLE GAMES MARKET ANALYSIS BY BETTING LIMIT
    280. ELECTRONIC TABLE GAMES MARKET ANALYSIS BY REGIONAL
    281. GAMES MARKET ANALYSIS BY PLATFORM
    282. MARKET ANALYSIS BY GAME PROVIDER
    283. ANALYSIS BY BET SIZE
    284. BY BETTING LIMIT
    285. REGIONAL
    286. SPAIN ELECTRONIC TABLE GAMES MARKET ANALYSIS BY GAME PROVIDER
    287. SPAIN ELECTRONIC TABLE GAMES MARKET ANALYSIS BY BET SIZE
    288. ELECTRONIC TABLE GAMES MARKET ANALYSIS BY BETTING LIMIT
    289. MARKET ANALYSIS
    290. GAME TYPE
    291. CHINA ELECTRONIC TABLE GAMES MARKET ANALYSIS BY BETTING LIMIT
    292. CHINA ELECTRONIC TABLE GAMES MARKET ANALYSIS BY REGIONAL
    293. ELECTRONIC TABLE GAMES MARKET ANALYSIS BY GAME TYPE
    294. GAMES MARKET ANALYSIS BY GAME PROVIDER
    295. MARKET ANALYSIS BY BET SIZE
    296. ANALYSIS BY BETTING LIMIT
    297. BY REGIONAL
    298. TYPE
    299. JAPAN ELECTRONIC TABLE GAMES MARKET ANALYSIS BY BET SIZE
    300. ELECTRONIC TABLE GAMES MARKET ANALYSIS BY BETTING LIMIT
    301. GAMES MARKET ANALYSIS BY GAME TYPE
    302. MARKET ANALYSIS BY PLATFORM
    303. ANALYSIS BY GAME PROVIDER
    304. ANALYSIS BY BET SIZE
    305. BY BETTING LIMIT
    306. BY REGIONAL
    307. GAME TYPE
    308. INDONESIA ELECTRONIC TABLE GAMES MARKET ANALYSIS BY GAME TYPE
    309. INDONESIA ELECTRONIC TABLE GAMES MARKET ANALYSIS BY PLATFORM
    310. ELECTRONIC TABLE GAMES MARKET ANALYSIS BY GAME PROVIDER
    311. ELECTRONIC TABLE GAMES MARKET ANALYSIS BY BET SIZE
    312. ANALYSIS BY GAME TYPE
    313. BY PLATFORM
    314. PROVIDER
    315. SIZE
    316. LIMIT
    317. MEXICO ELECTRONIC TABLE GAMES MARKET ANALYSIS BY GAME PROVIDER
    318. MEXICO ELECTRONIC TABLE GAMES MARKET ANALYSIS BY BET SIZE
    319. MEXICO ELECTRONIC TABLE GAMES MARKET ANALYSIS BY BETTING LIMIT
    320. MEXICO ELECTRONIC TABLE GAMES MARKET ANALYSIS BY REGIONAL
    321. ELECTRONIC TABLE GAMES MARKET ANALYSIS BY GAME TYPE
    322. ELECTRONIC TABLE GAMES MARKET ANALYSIS BY PLATFORM
    323. GAMES MARKET ANALYSIS BY BETTING LIMIT
    324. GAMES MARKET ANALYSIS BY REGIONAL
    325. ELECTRONIC TABLE GAMES MARKET ANALYSIS BY PLATFORM
    326. AMERICA ELECTRONIC TABLE GAMES MARKET ANALYSIS BY GAME PROVIDER
    327. REST OF SOUTH AMERICA ELECTRONIC TABLE GAMES MARKET ANALYSIS BY BET SIZE
    328. REST OF SOUTH AMERICA ELECTRONIC TABLE GAMES MARKET ANALYSIS BY BETTING LIMIT
    329. REGIONAL
    330. GCC COUNTRIES ELECTRONIC TABLE GAMES MARKET ANALYSIS BY GAME TYPE
    331. GCC COUNTRIES ELECTRONIC TABLE GAMES MARKET ANALYSIS BY PLATFORM
    332. GCC COUNTRIES ELECTRONIC TABLE GAMES MARKET ANALYSIS BY GAME PROVIDER
    333. GCC COUNTRIES ELECTRONIC TABLE GAMES MARKET ANALYSIS BY BET SIZE
    334. GCC COUNTRIES ELECTRONIC TABLE GAMES MARKET ANALYSIS BY BETTING LIMIT
    335. GCC COUNTRIES ELECTRONIC TABLE GAMES MARKET ANALYSIS BY REGIONAL
    336. SOUTH AFRICA ELECTRONIC TABLE GAMES MARKET ANALYSIS BY GAME TYPE
    337. SOUTH AFRICA ELECTRONIC TABLE GAMES MARKET ANALYSIS BY PLATFORM
    338. SOUTH AFRICA ELECTRONIC TABLE GAMES MARKET ANALYSIS BY GAME PROVIDER
    339. SOUTH AFRICA ELECTRONIC TABLE GAMES MARKET ANALYSIS BY BET SIZE
    340. SOUTH AFRICA ELECTRONIC TABLE GAMES MARKET ANALYSIS BY BETTING LIMIT
    341. SOUTH AFRICA ELECTRONIC TABLE GAMES MARKET ANALYSIS BY REGIONAL
    342. REST OF MEA ELECTRONIC TABLE GAMES MARKET ANALYSIS BY GAME TYPE
    343. REST OF MEA ELECTRONIC TABLE GAMES MARKET ANALYSIS BY PLATFORM
    344. REST OF MEA ELECTRONIC TABLE GAMES MARKET ANALYSIS BY GAME PROVIDER
    345. REST OF MEA ELECTRONIC TABLE GAMES MARKET ANALYSIS BY BET SIZE
    346. REST OF MEA ELECTRONIC TABLE GAMES MARKET ANALYSIS BY BETTING LIMIT
    347. REST OF MEA ELECTRONIC TABLE GAMES MARKET ANALYSIS BY REGIONAL
    348. KEY BUYING CRITERIA OF ELECTRONIC TABLE GAMES MARKET
    349. PROCESS OF MRFR
    350. RESTRAINTS IMPACT ANALYSIS: ELECTRONIC TABLE GAMES MARKET
    351. SUPPLY / VALUE CHAIN: ELECTRONIC TABLE GAMES MARKET
    352. GAMES MARKET, BY GAME TYPE, 2019 TO 2032 (USD Billions)
    353. GAMES MARKET, BY PLATFORM, 2019 TO 2032 (USD Billions)
    354. ELECTRONIC TABLE GAMES MARKET, BY BET SIZE, 2024 (% SHARE)
    355. ELECTRONIC TABLE GAMES MARKET, BY REGIONAL, 2024 (% SHARE)
    356. OF MAJOR COMPETITORS'

    Electronic Table Games Market Segmentation


    • Electronic Table Games Market By Game Type (USD Billion, 2019-2032)

      • Baccarat
      • Blackjack
      • Craps
      • Roulette
      • Sic Bo
      • Other Table Games

    • Electronic Table Games Market By Platform (USD Billion, 2019-2032)

      • Desktop
      • Mobile
      • Tablet

    • Electronic Table Games Market By Game Provider (USD Billion, 2019-2032)

      • Evolution Gaming
      • Microgaming
      • NetEnt
      • Playtech
      • Other Game Providers

    • Electronic Table Games Market By Bet Size (USD Billion, 2019-2032)

      • Low
      • Medium
      • High

    • Electronic Table Games Market By Betting Limit (USD Billion, 2019-2032)

      • No Limit
      • Limit

    • Electronic Table Games Market By Regional (USD Billion, 2019-2032)

      • North America
      • Europe
      • South America
      • Asia Pacific
      • Middle East and Africa

    Electronic Table Games Market Regional Outlook (USD Billion, 2019-2032)


    • North America Outlook (USD Billion, 2019-2032)

      • North America Electronic Table Games Market by Game Type

        • Baccarat
        • Blackjack
        • Craps
        • Roulette
        • Sic Bo
        • Other Table Games
      • North America Electronic Table Games Market by Platform Type

        • Desktop
        • Mobile
        • Tablet
      • North America Electronic Table Games Market by Game Provider Type

        • Evolution Gaming
        • Microgaming
        • NetEnt
        • Playtech
        • Other Game Providers
      • North America Electronic Table Games Market by Bet Size Type

        • Low
        • Medium
        • High
      • North America Electronic Table Games Market by Betting Limit Type

        • No Limit
        • Limit
      • North America Electronic Table Games Market by Regional Type

        • US
        • Canada
      • US Outlook (USD Billion, 2019-2032)
      • US Electronic Table Games Market by Game Type

        • Baccarat
        • Blackjack
        • Craps
        • Roulette
        • Sic Bo
        • Other Table Games
      • US Electronic Table Games Market by Platform Type

        • Desktop
        • Mobile
        • Tablet
      • US Electronic Table Games Market by Game Provider Type

        • Evolution Gaming
        • Microgaming
        • NetEnt
        • Playtech
        • Other Game Providers
      • US Electronic Table Games Market by Bet Size Type

        • Low
        • Medium
        • High
      • US Electronic Table Games Market by Betting Limit Type

        • No Limit
        • Limit
      • CANADA Outlook (USD Billion, 2019-2032)
      • CANADA Electronic Table Games Market by Game Type

        • Baccarat
        • Blackjack
        • Craps
        • Roulette
        • Sic Bo
        • Other Table Games
      • CANADA Electronic Table Games Market by Platform Type

        • Desktop
        • Mobile
        • Tablet
      • CANADA Electronic Table Games Market by Game Provider Type

        • Evolution Gaming
        • Microgaming
        • NetEnt
        • Playtech
        • Other Game Providers
      • CANADA Electronic Table Games Market by Bet Size Type

        • Low
        • Medium
        • High
      • CANADA Electronic Table Games Market by Betting Limit Type

        • No Limit
        • Limit
    • Europe Outlook (USD Billion, 2019-2032)

      • Europe Electronic Table Games Market by Game Type

        • Baccarat
        • Blackjack
        • Craps
        • Roulette
        • Sic Bo
        • Other Table Games
      • Europe Electronic Table Games Market by Platform Type

        • Desktop
        • Mobile
        • Tablet
      • Europe Electronic Table Games Market by Game Provider Type

        • Evolution Gaming
        • Microgaming
        • NetEnt
        • Playtech
        • Other Game Providers
      • Europe Electronic Table Games Market by Bet Size Type

        • Low
        • Medium
        • High
      • Europe Electronic Table Games Market by Betting Limit Type

        • No Limit
        • Limit
      • Europe Electronic Table Games Market by Regional Type

        • Germany
        • UK
        • France
        • Russia
        • Italy
        • Spain
        • Rest of Europe
      • GERMANY Outlook (USD Billion, 2019-2032)
      • GERMANY Electronic Table Games Market by Game Type

        • Baccarat
        • Blackjack
        • Craps
        • Roulette
        • Sic Bo
        • Other Table Games
      • GERMANY Electronic Table Games Market by Platform Type

        • Desktop
        • Mobile
        • Tablet
      • GERMANY Electronic Table Games Market by Game Provider Type

        • Evolution Gaming
        • Microgaming
        • NetEnt
        • Playtech
        • Other Game Providers
      • GERMANY Electronic Table Games Market by Bet Size Type

        • Low
        • Medium
        • High
      • GERMANY Electronic Table Games Market by Betting Limit Type

        • No Limit
        • Limit
      • UK Outlook (USD Billion, 2019-2032)
      • UK Electronic Table Games Market by Game Type

        • Baccarat
        • Blackjack
        • Craps
        • Roulette
        • Sic Bo
        • Other Table Games
      • UK Electronic Table Games Market by Platform Type

        • Desktop
        • Mobile
        • Tablet
      • UK Electronic Table Games Market by Game Provider Type

        • Evolution Gaming
        • Microgaming
        • NetEnt
        • Playtech
        • Other Game Providers
      • UK Electronic Table Games Market by Bet Size Type

        • Low
        • Medium
        • High
      • UK Electronic Table Games Market by Betting Limit Type

        • No Limit
        • Limit
      • FRANCE Outlook (USD Billion, 2019-2032)
      • FRANCE Electronic Table Games Market by Game Type

        • Baccarat
        • Blackjack
        • Craps
        • Roulette
        • Sic Bo
        • Other Table Games
      • FRANCE Electronic Table Games Market by Platform Type

        • Desktop
        • Mobile
        • Tablet
      • FRANCE Electronic Table Games Market by Game Provider Type

        • Evolution Gaming
        • Microgaming
        • NetEnt
        • Playtech
        • Other Game Providers
      • FRANCE Electronic Table Games Market by Bet Size Type

        • Low
        • Medium
        • High
      • FRANCE Electronic Table Games Market by Betting Limit Type

        • No Limit
        • Limit
      • RUSSIA Outlook (USD Billion, 2019-2032)
      • RUSSIA Electronic Table Games Market by Game Type

        • Baccarat
        • Blackjack
        • Craps
        • Roulette
        • Sic Bo
        • Other Table Games
      • RUSSIA Electronic Table Games Market by Platform Type

        • Desktop
        • Mobile
        • Tablet
      • RUSSIA Electronic Table Games Market by Game Provider Type

        • Evolution Gaming
        • Microgaming
        • NetEnt
        • Playtech
        • Other Game Providers
      • RUSSIA Electronic Table Games Market by Bet Size Type

        • Low
        • Medium
        • High
      • RUSSIA Electronic Table Games Market by Betting Limit Type

        • No Limit
        • Limit
      • ITALY Outlook (USD Billion, 2019-2032)
      • ITALY Electronic Table Games Market by Game Type

        • Baccarat
        • Blackjack
        • Craps
        • Roulette
        • Sic Bo
        • Other Table Games
      • ITALY Electronic Table Games Market by Platform Type

        • Desktop
        • Mobile
        • Tablet
      • ITALY Electronic Table Games Market by Game Provider Type

        • Evolution Gaming
        • Microgaming
        • NetEnt
        • Playtech
        • Other Game Providers
      • ITALY Electronic Table Games Market by Bet Size Type

        • Low
        • Medium
        • High
      • ITALY Electronic Table Games Market by Betting Limit Type

        • No Limit
        • Limit
      • SPAIN Outlook (USD Billion, 2019-2032)
      • SPAIN Electronic Table Games Market by Game Type

        • Baccarat
        • Blackjack
        • Craps
        • Roulette
        • Sic Bo
        • Other Table Games
      • SPAIN Electronic Table Games Market by Platform Type

        • Desktop
        • Mobile
        • Tablet
      • SPAIN Electronic Table Games Market by Game Provider Type

        • Evolution Gaming
        • Microgaming
        • NetEnt
        • Playtech
        • Other Game Providers
      • SPAIN Electronic Table Games Market by Bet Size Type

        • Low
        • Medium
        • High
      • SPAIN Electronic Table Games Market by Betting Limit Type

        • No Limit
        • Limit
      • REST OF EUROPE Outlook (USD Billion, 2019-2032)
      • REST OF EUROPE Electronic Table Games Market by Game Type

        • Baccarat
        • Blackjack
        • Craps
        • Roulette
        • Sic Bo
        • Other Table Games
      • REST OF EUROPE Electronic Table Games Market by Platform Type

        • Desktop
        • Mobile
        • Tablet
      • REST OF EUROPE Electronic Table Games Market by Game Provider Type

        • Evolution Gaming
        • Microgaming
        • NetEnt
        • Playtech
        • Other Game Providers
      • REST OF EUROPE Electronic Table Games Market by Bet Size Type

        • Low
        • Medium
        • High
      • REST OF EUROPE Electronic Table Games Market by Betting Limit Type

        • No Limit
        • Limit
    • APAC Outlook (USD Billion, 2019-2032)

      • APAC Electronic Table Games Market by Game Type

        • Baccarat
        • Blackjack
        • Craps
        • Roulette
        • Sic Bo
        • Other Table Games
      • APAC Electronic Table Games Market by Platform Type

        • Desktop
        • Mobile
        • Tablet
      • APAC Electronic Table Games Market by Game Provider Type

        • Evolution Gaming
        • Microgaming
        • NetEnt
        • Playtech
        • Other Game Providers
      • APAC Electronic Table Games Market by Bet Size Type

        • Low
        • Medium
        • High
      • APAC Electronic Table Games Market by Betting Limit Type

        • No Limit
        • Limit
      • APAC Electronic Table Games Market by Regional Type

        • China
        • India
        • Japan
        • South Korea
        • Malaysia
        • Thailand
        • Indonesia
        • Rest of APAC
      • CHINA Outlook (USD Billion, 2019-2032)
      • CHINA Electronic Table Games Market by Game Type

        • Baccarat
        • Blackjack
        • Craps
        • Roulette
        • Sic Bo
        • Other Table Games
      • CHINA Electronic Table Games Market by Platform Type

        • Desktop
        • Mobile
        • Tablet
      • CHINA Electronic Table Games Market by Game Provider Type

        • Evolution Gaming
        • Microgaming
        • NetEnt
        • Playtech
        • Other Game Providers
      • CHINA Electronic Table Games Market by Bet Size Type

        • Low
        • Medium
        • High
      • CHINA Electronic Table Games Market by Betting Limit Type

        • No Limit
        • Limit
      • INDIA Outlook (USD Billion, 2019-2032)
      • INDIA Electronic Table Games Market by Game Type

        • Baccarat
        • Blackjack
        • Craps
        • Roulette
        • Sic Bo
        • Other Table Games
      • INDIA Electronic Table Games Market by Platform Type

        • Desktop
        • Mobile
        • Tablet
      • INDIA Electronic Table Games Market by Game Provider Type

        • Evolution Gaming
        • Microgaming
        • NetEnt
        • Playtech
        • Other Game Providers
      • INDIA Electronic Table Games Market by Bet Size Type

        • Low
        • Medium
        • High
      • INDIA Electronic Table Games Market by Betting Limit Type

        • No Limit
        • Limit
      • JAPAN Outlook (USD Billion, 2019-2032)
      • JAPAN Electronic Table Games Market by Game Type

        • Baccarat
        • Blackjack
        • Craps
        • Roulette
        • Sic Bo
        • Other Table Games
      • JAPAN Electronic Table Games Market by Platform Type

        • Desktop
        • Mobile
        • Tablet
      • JAPAN Electronic Table Games Market by Game Provider Type

        • Evolution Gaming
        • Microgaming
        • NetEnt
        • Playtech
        • Other Game Providers
      • JAPAN Electronic Table Games Market by Bet Size Type

        • Low
        • Medium
        • High
      • JAPAN Electronic Table Games Market by Betting Limit Type

        • No Limit
        • Limit
      • SOUTH KOREA Outlook (USD Billion, 2019-2032)
      • SOUTH KOREA Electronic Table Games Market by Game Type

        • Baccarat
        • Blackjack
        • Craps
        • Roulette
        • Sic Bo
        • Other Table Games
      • SOUTH KOREA Electronic Table Games Market by Platform Type

        • Desktop
        • Mobile
        • Tablet
      • SOUTH KOREA Electronic Table Games Market by Game Provider Type

        • Evolution Gaming
        • Microgaming
        • NetEnt
        • Playtech
        • Other Game Providers
      • SOUTH KOREA Electronic Table Games Market by Bet Size Type

        • Low
        • Medium
        • High
      • SOUTH KOREA Electronic Table Games Market by Betting Limit Type

        • No Limit
        • Limit
      • MALAYSIA Outlook (USD Billion, 2019-2032)
      • MALAYSIA Electronic Table Games Market by Game Type

        • Baccarat
        • Blackjack
        • Craps
        • Roulette
        • Sic Bo
        • Other Table Games
      • MALAYSIA Electronic Table Games Market by Platform Type

        • Desktop
        • Mobile
        • Tablet
      • MALAYSIA Electronic Table Games Market by Game Provider Type

        • Evolution Gaming
        • Microgaming
        • NetEnt
        • Playtech
        • Other Game Providers
      • MALAYSIA Electronic Table Games Market by Bet Size Type

        • Low
        • Medium
        • High
      • MALAYSIA Electronic Table Games Market by Betting Limit Type

        • No Limit
        • Limit
      • THAILAND Outlook (USD Billion, 2019-2032)
      • THAILAND Electronic Table Games Market by Game Type

        • Baccarat
        • Blackjack
        • Craps
        • Roulette
        • Sic Bo
        • Other Table Games
      • THAILAND Electronic Table Games Market by Platform Type

        • Desktop
        • Mobile
        • Tablet
      • THAILAND Electronic Table Games Market by Game Provider Type

        • Evolution Gaming
        • Microgaming
        • NetEnt
        • Playtech
        • Other Game Providers
      • THAILAND Electronic Table Games Market by Bet Size Type

        • Low
        • Medium
        • High
      • THAILAND Electronic Table Games Market by Betting Limit Type

        • No Limit
        • Limit
      • INDONESIA Outlook (USD Billion, 2019-2032)
      • INDONESIA Electronic Table Games Market by Game Type

        • Baccarat
        • Blackjack
        • Craps
        • Roulette
        • Sic Bo
        • Other Table Games
      • INDONESIA Electronic Table Games Market by Platform Type

        • Desktop
        • Mobile
        • Tablet
      • INDONESIA Electronic Table Games Market by Game Provider Type

        • Evolution Gaming
        • Microgaming
        • NetEnt
        • Playtech
        • Other Game Providers
      • INDONESIA Electronic Table Games Market by Bet Size Type

        • Low
        • Medium
        • High
      • INDONESIA Electronic Table Games Market by Betting Limit Type

        • No Limit
        • Limit
      • REST OF APAC Outlook (USD Billion, 2019-2032)
      • REST OF APAC Electronic Table Games Market by Game Type

        • Baccarat
        • Blackjack
        • Craps
        • Roulette
        • Sic Bo
        • Other Table Games
      • REST OF APAC Electronic Table Games Market by Platform Type

        • Desktop
        • Mobile
        • Tablet
      • REST OF APAC Electronic Table Games Market by Game Provider Type

        • Evolution Gaming
        • Microgaming
        • NetEnt
        • Playtech
        • Other Game Providers
      • REST OF APAC Electronic Table Games Market by Bet Size Type

        • Low
        • Medium
        • High
      • REST OF APAC Electronic Table Games Market by Betting Limit Type

        • No Limit
        • Limit
    • South America Outlook (USD Billion, 2019-2032)

      • South America Electronic Table Games Market by Game Type

        • Baccarat
        • Blackjack
        • Craps
        • Roulette
        • Sic Bo
        • Other Table Games
      • South America Electronic Table Games Market by Platform Type

        • Desktop
        • Mobile
        • Tablet
      • South America Electronic Table Games Market by Game Provider Type

        • Evolution Gaming
        • Microgaming
        • NetEnt
        • Playtech
        • Other Game Providers
      • South America Electronic Table Games Market by Bet Size Type

        • Low
        • Medium
        • High
      • South America Electronic Table Games Market by Betting Limit Type

        • No Limit
        • Limit
      • South America Electronic Table Games Market by Regional Type

        • Brazil
        • Mexico
        • Argentina
        • Rest of South America
      • BRAZIL Outlook (USD Billion, 2019-2032)
      • BRAZIL Electronic Table Games Market by Game Type

        • Baccarat
        • Blackjack
        • Craps
        • Roulette
        • Sic Bo
        • Other Table Games
      • BRAZIL Electronic Table Games Market by Platform Type

        • Desktop
        • Mobile
        • Tablet
      • BRAZIL Electronic Table Games Market by Game Provider Type

        • Evolution Gaming
        • Microgaming
        • NetEnt
        • Playtech
        • Other Game Providers
      • BRAZIL Electronic Table Games Market by Bet Size Type

        • Low
        • Medium
        • High
      • BRAZIL Electronic Table Games Market by Betting Limit Type

        • No Limit
        • Limit
      • MEXICO Outlook (USD Billion, 2019-2032)
      • MEXICO Electronic Table Games Market by Game Type

        • Baccarat
        • Blackjack
        • Craps
        • Roulette
        • Sic Bo
        • Other Table Games
      • MEXICO Electronic Table Games Market by Platform Type

        • Desktop
        • Mobile
        • Tablet
      • MEXICO Electronic Table Games Market by Game Provider Type

        • Evolution Gaming
        • Microgaming
        • NetEnt
        • Playtech
        • Other Game Providers
      • MEXICO Electronic Table Games Market by Bet Size Type

        • Low
        • Medium
        • High
      • MEXICO Electronic Table Games Market by Betting Limit Type

        • No Limit
        • Limit
      • ARGENTINA Outlook (USD Billion, 2019-2032)
      • ARGENTINA Electronic Table Games Market by Game Type

        • Baccarat
        • Blackjack
        • Craps
        • Roulette
        • Sic Bo
        • Other Table Games
      • ARGENTINA Electronic Table Games Market by Platform Type

        • Desktop
        • Mobile
        • Tablet
      • ARGENTINA Electronic Table Games Market by Game Provider Type

        • Evolution Gaming
        • Microgaming
        • NetEnt
        • Playtech
        • Other Game Providers
      • ARGENTINA Electronic Table Games Market by Bet Size Type

        • Low
        • Medium
        • High
      • ARGENTINA Electronic Table Games Market by Betting Limit Type

        • No Limit
        • Limit
      • REST OF SOUTH AMERICA Outlook (USD Billion, 2019-2032)
      • REST OF SOUTH AMERICA Electronic Table Games Market by Game Type

        • Baccarat
        • Blackjack
        • Craps
        • Roulette
        • Sic Bo
        • Other Table Games
      • REST OF SOUTH AMERICA Electronic Table Games Market by Platform Type

        • Desktop
        • Mobile
        • Tablet
      • REST OF SOUTH AMERICA Electronic Table Games Market by Game Provider Type

        • Evolution Gaming
        • Microgaming
        • NetEnt
        • Playtech
        • Other Game Providers
      • REST OF SOUTH AMERICA Electronic Table Games Market by Bet Size Type

        • Low
        • Medium
        • High
      • REST OF SOUTH AMERICA Electronic Table Games Market by Betting Limit Type

        • No Limit
        • Limit
    • MEA Outlook (USD Billion, 2019-2032)

      • MEA Electronic Table Games Market by Game Type

        • Baccarat
        • Blackjack
        • Craps
        • Roulette
        • Sic Bo
        • Other Table Games
      • MEA Electronic Table Games Market by Platform Type

        • Desktop
        • Mobile
        • Tablet
      • MEA Electronic Table Games Market by Game Provider Type

        • Evolution Gaming
        • Microgaming
        • NetEnt
        • Playtech
        • Other Game Providers
      • MEA Electronic Table Games Market by Bet Size Type

        • Low
        • Medium
        • High
      • MEA Electronic Table Games Market by Betting Limit Type

        • No Limit
        • Limit
      • MEA Electronic Table Games Market by Regional Type

        • GCC Countries
        • South Africa
        • Rest of MEA
      • GCC COUNTRIES Outlook (USD Billion, 2019-2032)
      • GCC COUNTRIES Electronic Table Games Market by Game Type

        • Baccarat
        • Blackjack
        • Craps
        • Roulette
        • Sic Bo
        • Other Table Games
      • GCC COUNTRIES Electronic Table Games Market by Platform Type

        • Desktop
        • Mobile
        • Tablet
      • GCC COUNTRIES Electronic Table Games Market by Game Provider Type

        • Evolution Gaming
        • Microgaming
        • NetEnt
        • Playtech
        • Other Game Providers
      • GCC COUNTRIES Electronic Table Games Market by Bet Size Type

        • Low
        • Medium
        • High
      • GCC COUNTRIES Electronic Table Games Market by Betting Limit Type

        • No Limit
        • Limit
      • SOUTH AFRICA Outlook (USD Billion, 2019-2032)
      • SOUTH AFRICA Electronic Table Games Market by Game Type

        • Baccarat
        • Blackjack
        • Craps
        • Roulette
        • Sic Bo
        • Other Table Games
      • SOUTH AFRICA Electronic Table Games Market by Platform Type

        • Desktop
        • Mobile
        • Tablet
      • SOUTH AFRICA Electronic Table Games Market by Game Provider Type

        • Evolution Gaming
        • Microgaming
        • NetEnt
        • Playtech
        • Other Game Providers
      • SOUTH AFRICA Electronic Table Games Market by Bet Size Type

        • Low
        • Medium
        • High
      • SOUTH AFRICA Electronic Table Games Market by Betting Limit Type

        • No Limit
        • Limit
      • REST OF MEA Outlook (USD Billion, 2019-2032)
      • REST OF MEA Electronic Table Games Market by Game Type

        • Baccarat
        • Blackjack
        • Craps
        • Roulette
        • Sic Bo
        • Other Table Games
      • REST OF MEA Electronic Table Games Market by Platform Type

        • Desktop
        • Mobile
        • Tablet
      • REST OF MEA Electronic Table Games Market by Game Provider Type

        • Evolution Gaming
        • Microgaming
        • NetEnt
        • Playtech
        • Other Game Providers
      • REST OF MEA Electronic Table Games Market by Bet Size Type

        • Low
        • Medium
        • High
      • REST OF MEA Electronic Table Games Market by Betting Limit Type

        • No Limit
        • Limit


    Report Infographic
    Free Sample Request

    Kindly complete the form below to receive a free sample of this Report

    Customer Strories

    “I am very pleased with how market segments have been defined in a relevant way for my purposes (such as "Portable Freezers & refrigerators" and "last-mile"). In general the report is well structured. Thanks very much for your efforts.”

    Victoria Milne Founder
    Case Study

    Chemicals and Materials