• Cat-intel
  • MedIntelliX
  • Resources
  • About Us
  • Hero Background
    English
    Chinese
    French
    Japanese
    Korean
    German
    Spanish

    Electric Vehicle Inverter Market Share

    ID: MRFR/AM/12367-CR
    128 Pages
    Sejal Akre
    March 2024

    Electric Vehicle Inverter Market Research Report By Inverter (SiC and IGBT.), by Power (Up to 100 kW, 101-300 kW, 301-600 kW and 601 kW & above), by Vehicle Propulsion (BEVs, HEVs, PHEVs and FCEVs), by Vehicle Category (Passenger Cars and Commercial Vehicles) and By Region (North America, Europe, Asia-Pacific, Middle East and Africa, South America) –Market Forecast Till 2035

    Share:
    Download PDF ×

    We do not share your information with anyone. However, we may send you emails based on your report interest from time to time. You may contact us at any time to opt-out.

    Electric Vehicle Inverter Market Infographic
    $ 4,950.0
    $ 5,950.0
    $ 7,250.0

    Market Share

    Electric Vehicle Inverter Market Share Analysis

    The Electric Vehicle (EV) Inverter Market is experiencing a significant increase in demand because of the shift in automotive industry from pollutant or dirty technology to cleaner and environmentally friendly technologies. In this competitive market, the positioning of who are they radical share strategies for companies looking to have a strong presence in the EV inverter market. One common method is forming technological differentiation. The electric vehicles world is making tremendous efforts towards improving and technologically inventing more efficient inverter technologies that can ensure optimal performance output. Research and development are embraced so that businesses can provide key features including better power density, high efficiency, climate-friendly cooling systems with which they can gain competitive advantage along with attracting more market share. The market share positioning of manufacturers is an also important role performed by strategic partnership and collaborations.

    Allowing the inverter company to plug neatly into the wider EV normative can be considered helped by so-called partnerships with electric car manufacturers or at least one of the big players of its automotive supply chain. By working with other companies in such partnerships, firms are able to ensure that their equipped units work efficiently with specific features of electric car models hence forcing better system performance. In addition, forging strategic partnerships with providers of charging infrastructure enables one to improve the functionality and the efficiency of an EV inverter solution resulting in a firm entrenchment into the market. Success in the EV inverter market must include customer-centric approaches that would effectively sell these branded EV Inverters and its features. The knowledge of specific requirements and preferences of those who create electric vehicles, as well as those who operate them, can also allow companies to provide inverter solutions that are customized accordingly.

    The above aspects as architecture, structure design and integration become important key factors. In addition, issues encompassing reliability, durability and thermal management should be very important. The point is that, when companies concentrate on creating tailored inverter solutions to meet what customers need, they are able to build trust and loyalty, as well as bigger market share. Cost competitiveness is an important separable aspect of market share placement’s positioning in the EV Inverter market. There are indications that cost plays a significant role as the industry grows. It is also considered an important factor to manufacturers and consumers. Reducing costs of production, optimized operations and supply chain management help the inverter companies to give competitive prices without compromising on the quality. This method can be supportive in obtaining market share especially areas where electric vehicles are viewed as responsive to price.

    Market Summary

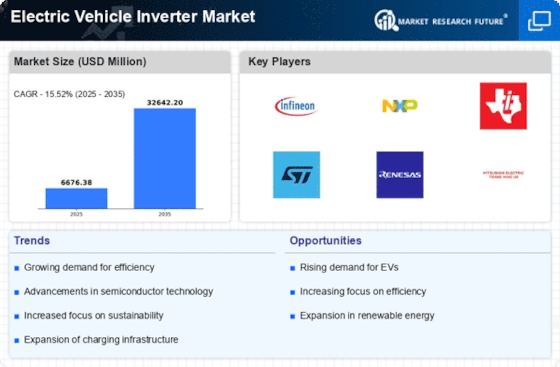
    As per Market Research Future Analysis, the Electric Vehicle Inverter Market was valued at 6676.38 USD Million in 2024 and is projected to reach 32642.20 USD Million by 2035, growing at a CAGR of 15.52% from 2025 to 2035. The market is driven by the increasing consumer shift towards electric vehicles, government incentives for electric mobility, and advancements in inverter technology. IGBTs dominate the market, contributing approximately 92.8% of revenue in 2022. The Asia-Pacific region accounted for around 57% of the market share in 2022, driven by significant growth in electric vehicle adoption and infrastructure development.

    Key Market Trends & Highlights

    The Electric Vehicle Inverter Market is witnessing several key trends.

    • Market Size in 2024: 6676.38 USD Million
    • Projected Market Size by 2035: 32642.20 USD Million
    • CAGR from 2025 to 2035: 15.52%
    • Asia-Pacific Market Share in 2022: ~57%

    Market Size & Forecast

    2024 Market Size USD 6676.38 Million
    2035 Market Size USD 32642.20 Million
    CAGR (2025-2035) 15.52%

    Major Players

    Dana Incorporated, UQM Technologies, GKN Automotive, Magna International, Valeo, BorgWarner Inc., AISIN CORPORATION, Hitachi Astemo, Ltd., ZF Friedrichshafen

    Market Trends

    Growing Demand For Renewable Energy Sources Such As Solar And Wind Power

    The ongoing transition towards sustainable transportation solutions appears to be driving innovations in electric vehicle inverter technology, which is likely to enhance vehicle efficiency and performance.

    U.S. Department of Energy

    Electric Vehicle Inverter Market Market Drivers

    Market Growth Projections

    The Global Electric Vehicle Inverter Market Industry is projected to experience substantial growth over the next decade. With an estimated market value of 6.68 USD Billion in 2024, the industry is on a trajectory to reach 32.6 USD Billion by 2035. This growth is underpinned by a compound annual growth rate (CAGR) of 15.52% from 2025 to 2035. Such projections indicate a robust demand for electric vehicle inverters, driven by factors such as technological advancements, government incentives, and the increasing adoption of electric vehicles. The market's expansion reflects a broader shift towards sustainable transportation solutions and energy efficiency.

    Rising Demand for Electric Vehicles

    The increasing consumer preference for electric vehicles is a primary driver for the Global Electric Vehicle Inverter Market Industry. As governments worldwide implement stringent emission regulations and provide incentives for electric vehicle adoption, the market is projected to grow significantly. In 2024, the market value is estimated at 6.68 USD Billion, reflecting a robust demand for efficient inverters that convert DC power from batteries to AC power for electric motors. This trend is expected to continue, with the market potentially reaching 32.6 USD Billion by 2035, indicating a strong shift towards sustainable transportation solutions.

    Expansion of Charging Infrastructure

    The expansion of electric vehicle charging infrastructure is a critical factor influencing the Global Electric Vehicle Inverter Market Industry. As more charging stations are established globally, the demand for efficient inverters that can handle varying power levels and charging speeds becomes paramount. This infrastructure development is essential for alleviating range anxiety among consumers and encouraging electric vehicle adoption. With investments pouring into charging networks, the market is poised for growth, potentially reaching a valuation of 32.6 USD Billion by 2035. The availability of fast-charging options will likely drive the need for advanced inverter technologies that can support rapid energy transfer.

    Government Initiatives and Incentives

    Government policies and incentives aimed at promoting electric vehicle adoption are significant drivers of the Global Electric Vehicle Inverter Market Industry. Many countries are implementing tax rebates, subsidies, and grants to encourage consumers to switch to electric vehicles. For instance, the European Union has set ambitious targets for reducing carbon emissions, which has led to increased investments in electric vehicle infrastructure. These initiatives not only stimulate demand for electric vehicles but also create a corresponding need for efficient inverters. As a result, the market is expected to experience substantial growth, with projections indicating a market value of 32.6 USD Billion by 2035.

    Growth in Renewable Energy Integration

    The integration of renewable energy sources into the electric vehicle ecosystem is emerging as a vital driver for the Global Electric Vehicle Inverter Market Industry. As more electric vehicles are charged using renewable energy, the demand for advanced inverters that can efficiently manage energy flow increases. This trend is particularly evident in regions with high solar and wind energy penetration. The ability of inverters to facilitate vehicle-to-grid technology further enhances their importance, allowing electric vehicles to act as energy storage units. Consequently, this growing synergy between renewable energy and electric vehicles is likely to propel the market forward, supporting its projected growth trajectory.

    Technological Advancements in Inverter Design

    Innovations in inverter technology play a crucial role in enhancing the performance and efficiency of electric vehicles, thereby driving the Global Electric Vehicle Inverter Market Industry. Developments such as the integration of silicon carbide (SiC) and gallium nitride (GaN) semiconductors are improving power density and thermal management. These advancements allow for lighter and more compact inverters, which can lead to longer driving ranges for electric vehicles. As manufacturers continue to invest in research and development, the market is likely to see a CAGR of 15.52% from 2025 to 2035, reflecting the importance of cutting-edge technology in meeting consumer expectations.

    Market Segment Insights

    Inverter for EV Inverter Insights

    Based on inverter, the Electric Vehicle Inverter Market has been segmented into SiC and IGBT. IGBT would be the majority shareholder in 2022, contributing around 92.8 % to the market revenue. IGBTs (Insulated Gate Bipolar Transistors) play a crucial role in electric vehicles by converting DC power from batteries into AC power to drive electric motors. These inverters are known for their high efficiency, fast switching speeds, and ability to handle high voltages and currents, making them ideal for EV applications.

    Get more detailed insights about Electric Vehicle Inverter Market Research Report—Global Forecast till 2034

    Regional Insights

    By Region, the study provides market insights into North America, Europe, Asia-Pacific, Middle East and Africa and South America. Asia-Pacific accounted for ~ 57 % of Electric Vehicle Inverter Market in 2022. Asia-Pacific is likely to be the largest contributor to the Electric Vehicle Inverter Market. This includes the China, Japan, India, South Korea and rest of Asia-Pacific. The Asia-Pacific region is witnessing significant growth in the adoption of electric vehicles, driven by factors such as government initiatives, environmental concerns, and technological advancements. As a result, the demand for EV inverters in this region has been on the rise.

    Several key players in the automotive industry, including established manufacturers and new entrants, are actively involved in developing and producing EV inverters in the Asia-Pacific market. These companies are investing in research and development to enhance the efficiency and performance of EV inverters, making them more suitable for a wide range of electric vehicles. The Asia-Pacific EV inverter market is characterized by intense competition, with players focusing on product differentiation, cost optimization, and strategic partnerships to gain a competitive edge.

    The Europe EV inverter market is a rapidly growing industry that is expected to experience significant growth in the coming years. The development of the European EV inverter market can be attributed to various factors, such as the increasing demand for electric vehicles, government incentives, and technological advancements. Key players in the European EV inverter market include major automotive manufacturers and specialized inverter manufacturers focusing on EV technology. These companies are investing in research and development and training programs to enhance EV inverters' efficiency, reliability, and performance.

    Figure 3: Electric Vehicle Inverter Market Size By Region 2022 Vs 2032

    Electric Vehicle Inverter Market Size By Region 2022 Vs

    Source: Secondary Research, Primary Research, Market Research Future Database, and Analyst Review

    Further, the major countries studied in the market report are the U.S., Canada, Mexico, Germany, UK, France, Italy, Spain, China, Japan, and India.

    Key Players and Competitive Insights

    The Electric Vehicle Inverter Market is distinguished by the presence of numerous global, regional, and local players catering to the Radiator technologies that are evolving at a rapid pace. Furthermore, the Increasing demand due to industrial automation, and rise in number of smart city projects are further driving the growth of Electric Vehicle Inverter Market during the forecast period.

    The Electric Vehicle Inverter Market is extremely competitive, with players competing, partnering, and investing heavily in research and development to gain a significant market share. The market is moderately fragmented with rising competition, increasing collaborative partnerships, and other strategic decisions to achieve operational efficiency. During the study, MRFR has analyzed some of the major players in the Electric Vehicle Inverter Market who have contributed to the market growth includes Dana Incorporated, UQM Technologies, GKN Automotive, Magna International, Valeo, BorgWarner Inc., AISIN CORPORATION, Hitachi Astemo, Ltd., ZF Friedrichshafen, among others.

    These players focus on expanding and enhancing their product portfolio and services to remain competitive and increase their customer base. Additionally, these players are focusing on partnerships & collaborations to expand their business and customer base to enhance their market position.

    Key Companies in the Electric Vehicle Inverter Market market include

    Industry Developments

    In May 2024, ABB acintroduced a cutting-edge package specifically designed for electric buses. This package includes the AMXE250 motor and HES580 inverter. The newly developed propulsion package represents a substantial advancement in cleaner and more sustainable transportation solutions. It has been meticulously designed to ensure optimal efficiency, reliability, and accessibility for the industry. The HES580, the first 3-level inverter available for electric buses, is known for its exceptional energy efficiency and power output. The HES580 inverter, when compared to traditional 2-level inverters, achieves a considerable reduction of up to 75 percent in motor harmonic losses.

    This reduction greatly reduces heat dissipation and maximizes energy conservation.

    In June 2024, Uno Minda, a major supplier of lighting, switching, acoustics, and seating solutions to global automobile companies, revealed that it has partnered with Suzhou lnovance Automotive to produce and sell specific high voltage electric vehicle products for passenger and commercial vehicles in India. The available electric car products include of the Charging Control Unit (CCU), EV inverter, EV motors, and advanced 3-in-1 electric drive systems (e-Axle) for the next generation.

    Future Outlook

    Electric Vehicle Inverter Market Future Outlook

    The Electric Vehicle Inverter Market is projected to grow at a 15.52% CAGR from 2025 to 2035, driven by advancements in EV technology, increasing demand for electric vehicles, and supportive government policies.

    New opportunities lie in:

    • Invest in R&D for high-efficiency inverters to enhance vehicle performance.
    • Develop integrated inverter solutions for smart grid applications.
    • Expand partnerships with automotive manufacturers to co-develop next-gen inverters.

    By 2035, the Electric Vehicle Inverter Market is expected to achieve substantial growth, reflecting a robust and competitive landscape.

    Market Segmentation

    Inverter for EV Power Outlook

    • Up to 100 kW
    • 101-300 kW
    • 301-600 kW
    • 601 kW & Above

    Inverter for EV Inverter Outlook

    • SiC
    • IGBT

    Inverter for EV Regional Outlook

    • US
    • Canada
    • Mexico
    • UK
    • Germany
    • France
    • Italy
    • Spain
    • Rest of Europe
    • China
    • Japan
    • India
    • South Korea
    • Rest of Asia-Pacific
    • Saudi Arabia
    • UAE
    • Rest of Middle East & Africa
    • Brazil
    • Argentina
    • Rest of South & Central America

    Inverter for EV Vehicle Category Outlook

    • Passenger Cars
    • Commercial Vehicles

    Inverter for EV Vehicle Propulsion Outlook

    • BEVs
    • HEVs
    • PHEVs
    • FCEVs

    Report Scope

    Report Attribute/Metric Details
    Market Size 2024 6,676.38 (USD Million)
    Market Size 2025 7,712.57 (USD Million)
    Market Size 2035 32642.20 (USD Million)
    Compound Annual Growth Rate (CAGR) 15.52% (2025 - 2035)
    Report Coverage Revenue Forecast, Competitive Landscape, Growth Factors, and Trends
    Base Year 2024
    Market Forecast Period 2025 - 2035
    Historical Data 2019 - 2023
    Report Coverage Revenue Forecast, Market Competitive Landscape, Growth Factors, and Trends
    Segments Covered Inverter, Power, Vehicle Propulsion, Vehicle Category, and Region
    Geographies Covered Europe, North America, Asia-Pacific, Middle East & Africa, and South America
    Countries Covered US, Canada, Mexico, Germany, U.K., Italy, France, Japan, China, India, South Korea, Saudi Arabia, UAE, South Africa Brazil, Argentina, and Others.
    Key Companies Profiled Dana Incorporated, UQM Technologies,    GKN Automotive, Magna International,    Valeo, BorgWarner Inc., AISIN CORPORATION,  Hitachi Astemo, Ltd., ZF Friedrichshafen
    Key Market Opportunities Technological Advancements Growing Demand for Renewable Energy Sources Such as Solar and Wind Power
    Key Market Dynamics Growing Investment in EV Infrastructure, Including Charging Stations Growing Consumer Shift Towards Electric Vehicles Supportive Government Schemes for Electric Mobility

    Market Highlights

    Author

    Sejal Akre
    Senior Research Analyst

    She holds an experience of about 6+ years in market research and business consulting, working under the spectrum of information communication technology, telecommunications and semiconductor domains. aarti conceptualizes and implements a scalable business strategy and provides strategic leadership to the clients. her expertise lies in market estimation, competitive intelligence, pipeline analysis, customer assessment, etc.

    Leave a Comment

    Latest Comments

    John Doe
    john@example.com

    This is a great article! Really helped me understand the topic better.

    Posted on July 23, 2025, 10:15 AM
    Jane Smith
    jane@domain.com

    Thanks for sharing this. I’ve bookmarked it for later reference.

    Posted on July 22, 2025, 7:45 PM

    FAQs

    How much is the Electric Vehicle Inverter Market?

    The Electric Vehicle Inverter Market size is expected to be valued at USD 6,676.38 Million in 2024.

    What is the growth rate of the Electric Vehicle Inverter Market?

    The global market is projected to grow at a CAGR of 15.52 % during the forecast period, 2025-2034.

    Which region held the largest market share in the Electric Vehicle Inverter Market?

    Asia-Pacific had the largest share of the global market.

    Who are the key players in the Electric Vehicle Inverter Market?

    The key players in the market are Dana Incorporated, UQM Technologies, GKN Automotive, Magna International, Valeo, BorgWarner Inc., AISIN CORPORATION, Hitachi Astemo, Ltd., ZF Friedrichshafen, among others.

    Which Inverter led the Electric Vehicle Inverter Market?

    The IGBT category dominated the market in 2022.

    1. Table of Contents
    2. Executive Summary 22
    3. Market Introduction 25
      1. DEFINITION 25
      2. Scope of the Study 25
      3. RESEARCH OBJECTIVE 25
      4. MARKET STRUCTURE 26
    4. Research Methodology 27
      1. OVERVIEW 27
      2. DATA FLOW 29
        1. DATA MINING PROCESS 29
      3. PURCHASED DATABASE: 30
      4. SECONDARY SOURCES: 31
        1. SECONDARY RESEARCH DATA FLOW: 32
      5. PRIMARY RESEARCH: 33
        1. PRIMARY RESEARCH DATA FLOW: 34
        2. PRIMARY RESEARCH: NUMBER OF INTERVIEWS CONDUCTED 35
        3. PRIMARY RESEARCH: REGIONAL COVERAGE 35
      6. APPROACHES FOR MARKET SIZE ESTIMATION: 36
        1. REVENUE ANALYSIS APPROACH 36
      7. DATA FORECASTING 37
        1. DATA FORECASTING TECHNIQUE 37
      8. DATA MODELING 38
        1. MICROECONOMIC FACTOR ANALYSIS: 38
        2. DATA MODELING: 39
      9. TEAMS AND ANALYST CONTRIBUTION 41
    5. MARKET DYNAMICS 43
      1. INTRODUCTION 43
      2. DRIVERS 44
        1. GROWING CONSUMER SHIFT TOWARDS ELECTRIC VEHICLES 44
        2. SUPPORTIVE GOVERNMENT SCHEMES FOR ELECTRIC MOBILITY 44
        3. TECHNOLOGICAL ADVANCEMENT IN INVERTERS FOR EV 44
        4. GROWING INVESTMENT IN EV INFRASTRUCTURE, INCLUDING CHARGING STATIONS 45
      3. RESTRAINTS 46
        1. LIMITATION IN PERFORMANCE 46
        2. CHALLENGE OF STANDARDIZATION AND INTEROPERABILITY 46
      4. OPPORTUNITY 47
        1. TECHNOLOGICAL ADVANCEMENTS 47
        2. GROWING DEMAND FOR RENEWABLE ENERGY SOURCES SUCH AS SOLAR AND WIND POWER 47
      5. CHALLENGES 48
        1. HIGH INITIAL CAPITAL EXPENDITURE COST 48
      6. COVID-19 IMPACT ANALYSIS 48
        1. IMPACT OF COVID-19 ON GLOBAL ECONOMY 48
        2. IMPACT OF COVID-19 ON THE GLOBAL ELECTRIC VEHICLE INVERTER MARKET 49
        3. SUPPLY CHAIN IMPACT 49
        4. IMPACT ON CONSUMER 50
        5. MARKET RECOVERY ANALYSIS 50
      7. TRENDS 50
        1. INCREASED DEMAND FOR HIGH-POWER INVERTERS 50
        2. INTEGRATION OF SIC AND GAN TECHNOLOGIES 50
    6. MARKET FACTOR ANALYSIS 51
      1. SUPPLY CHAIN ANALYSIS 51
        1. DESIGN & DEVELOPMENT 51
        2. RAW MATERIAL & COMPONENT SUPPLY 51
        3. MANUFACTURE & ASSEMBLY 52
        4. SALES & DISTRIBUTION 52
        5. END USE 52
      2. PORTER''S FIVE FORCES MODEL 53
        1. THREAT OF NEW ENTRANTS 53
        2. BARGAINING POWER OF SUPPLIERS 54
        3. THREAT OF SUBSTITUTES 54
        4. BARGAINING POWER OF BUYERS 54
        5. INTENSITY OF RIVALRY 54
      3. REGULATORY LANDSCAPE ANALYSIS 55
      4. PATENT TRENDS ANALYSIS 56
      5. MARKET SWOT ANALYSIS 57
      6. MARKET PESTEL ANALYSIS 57
        1. POLITICAL FACTORS: 57
        2. ECONOMIC FACTORS: 57
        3. SOCIAL FACTORS: 58
        4. TECHNOLOGICAL FACTORS: 58
        5. ENVIRONMENTAL FACTORS: 58
        6. LEGAL FACTORS: 58
      7. FUTURE TECHNOLOGICAL INNOVATIONS 58
      8. NEW DEVELOPMENT PROCESSES OR DESIGN 59
      9. NEXT DEVELOPMENT STAGE OF PRODUCTS 59
      10. STRATEGY FOR AUTOMATION ASSEMBLY SUPPLIER 60
    7. GLOBAL Electric Vehicle Inverter Market, BY INVERTER 62
      1. OVERVIEW 62
      2. SIC 63
      3. IGBT 63
    8. GLOBAL Electric Vehicle Inverter Market, BY POWER 64
      1. INTRODUCTION 64
      2. UP TO 100 KW 66
      3. 101-300 KW 66
      4. 301-600 KW 66
      5. 601 KW & ABOVE 66
    9. GLOBAL Electric Vehicle Inverter Market, BY VEHICLE PROPULSION 67
      1. INTRODUCTION 67
      2. BEVS 69
      3. HEVS 69
      4. PHEVS 69
      5. FCEVS 69
    10. GLOBAL Electric Vehicle Inverter Market, BY VEHICLE CATEGORY 70
      1. INTRODUCTION 70
      2. PASSENGER CARS 71
      3. COMMERCIAL VEHICLES 71
    11. GLOBAL Electric Vehicle Inverter Market, BY REGION 72
      1. OVERVIEW 72
        1. GLOBAL Electric Vehicle Inverter Market, BY REGION, 2022 VS 2032 (USD MILLION) 72
        2. GLOBAL Electric Vehicle Inverter Market, BY REGION, 2019–2032 (USD MILLION) 73
      2. NORTH AMERICA 73
        1. US 76
        2. CANADA 77
        3. MEXICO 78
      3. EUROPE 79
        1. GERMANY 82
        2. UK 83
        3. FRANCE 84
        4. ITALY 85
        5. SPAIN 86
        6. DENMARK 87
        7. AUSTRIA 88
        8. NETHERLANDS 89
        9. LUXEMBOURG 90
        10. HUNGARY 91
        11. BELGIUM 92
        12. POLAND 93
        13. ROMANIA 94
        14. SWEDEN 95
        15. REST OF EUROPE 96
      4. ASIA-PACIFIC 97
        1. CHINA 100
        2. JAPAN 101
        3. INDIA 102
        4. AUSTRALIA 103
        5. SOUTH KOREA 104
        6. INDONESIA 105
        7. REST OF ASIA PACIFIC 106
      5. MIDDLE EAST & AFRICA 107
        1. SAUDI ARABIA 110
        2. UAE 111
        3. REST OF MEA 112
      6. SOUTH & CENTRAL AMERICA 114
        1. BRAZIL 117
        2. ARGENTINA 118
        3. REST OF SOUTH & CENTRAL AMERICA 119
    12. Competitive Landscape 122
      1. INTRODUCTION 122
      2. MARKET SHARE ANALYSIS, 2022 123
      3. COMPETITOR DASHBOARD 124
      4. KEY DEVELOPMENTS & GROWTH STRATEGIES 125
        1. PRODUCT LAUNCH/PRODUCT APPROVAL/PRODUCT DEVELOPMET 125
        2. PARTNERSHIP/INVESTMENT 126
    13. COMPANY PROFILE 127
      1. DANA INCORPORATED 127
        1. COMPANY OVERVIEW 127
        2. FINANCIAL OVERVIEW 128
        3. PRODUCTS OFFERED 128
        4. KEY DEVELOPMENTS 129
        5. SWOT ANALYSIS 129
        6. KEY STRATEGIES 129
      2. UQM TECHNOLOGIES 130
        1. COMPANY OVERVIEW 130
        2. FINANCIAL OVERVIEW 130
        3. PRODUCTS OFFERED 130
        4. KEY DEVELOPMENTS 130
      3. BORGWARNER INC. 131
        1. COMPANY OVERVIEW 131
        2. FINANCIAL OVERVIEW 132
        3. PRODUCTS OFFERED 132
        4. KEY DEVELOPMENTS 133
        5. SWOT ANALYSIS 133
        6. KEY STRATEGIES 134
      4. BOSCH 135
        1. COMPANY OVERVIEW 135
        2. FINANCIAL OVERVIEW 136
        3. PRODUCTS OFFERED 136
        4. KEY DEVELOPMENTS 137
        5. SWOT ANALYSIS 137
        6. KEY STRATEGIES 137
      5. GKN AUTOMOTIVE 138
        1. COMPANY OVERVIEW 138
        2. FINANCIAL OVERVIEW 138
        3. PRODUCTS OFFERED 138
        4. KEY DEVELOPMENTS 139
        5. SWOT ANALYSIS 139
        6. KEY STRATEGIES 139
      6. AISIN CORPORATION 140
        1. COMPANY OVERVIEW 140
        2. FINANCIAL OVERVIEW 141
        3. PRODUCTS OFFERED 141
        4. KEY DEVELOPMENTS 142
        5. SWOT ANALYSIS 142
        6. KEY STRATEGIES 142
      7. HITACHI ASTEMO, LTD. 143
        1. COMPANY OVERVIEW 143
        2. FINANCIAL OVERVIEW 144
        3. PRODUCTS/SOLUTIONS/SERVICES OFFERED 144
        4. KEY DEVELOPMENTS 145
        5. SWOT ANALYSIS 145
        6. KEY STRATEGIES 145
      8. MAGNA INTERNATIONAL 146
        1. COMPANY OVERVIEW 146
        2. FINANCIAL OVERVIEW 147
        3. PRODUCTS/SOLUTIONS/SERVICES OFFERED 147
        4. KEY DEVELOPMENTS 147
        5. SWOT ANALYSIS 148
        6. KEY STRATEGIES 148
      9. ZF FRIEDRICHSHAFEN 149
        1. COMPANY OVERVIEW 149
        2. FINANCIAL OVERVIEW 150
        3. PRODUCTS/SOLUTIONS/SERVICES OFFERED 150
        4. KEY DEVELOPMENTS 151
        5. SWOT ANALYSIS 151
        6. KEY STRATEGIES 151
      10. DANA TM4 INC. 152
        1. COMPANY OVERVIEW 152
        2. FINANCIAL OVERVIEW 152
        3. PRODUCTS/SOLUTIONS/SERVICES OFFERED 152
        4. KEY DEVELOPMENTS 153
        5. SWOT ANALYSIS 153
        6. KEY STRATEGIES 153
      11. VALEO 154
        1. COMPANY OVERVIEW 154
        2. FINANCIAL OVERVIEW 155
        3. PRODUCTS/SOLUTIONS/SERVICES OFFERED 155
        4. KEY DEVELOPMENTS 155
        5. SWOT ANALYSIS 156
        6. KEY STRATEGIES 156
    14. List of Tables and Figures
      1. LIST OF TABLES
      2. TABLE 1 QFD MODELING FOR MARKET SHARE ASSESSMENT 39
      3. TABLE 2 MAJOR GRANTED PATENTS ON INVERTER FOR EV (2019 –2023) 56
      4. TABLE 3 GLOBAL Electric Vehicle Inverter Market, BY INVERTER, 2019-2032 (USD MILLION) 63
      5. TABLE 4 GLOBAL Electric Vehicle Inverter Market, BY POWER, 2019-2032 (USD MILLION) 65
      6. TABLE 5 GLOBAL Electric Vehicle Inverter Market, BY VEHICLE PROPULSION, 2019-2032 (USD MILLION) 68
      7. TABLE 6 GLOBAL Electric Vehicle Inverter Market, BY VEHICLE CATEGORY, 2019-2032 (USD MILLION) 71
      8. TABLE 7 GLOBAL Electric Vehicle Inverter Market, BY REGION, 2019–2032 (USD MILLION) 73
      9. TABLE 8 NORTH AMERICA: Electric Vehicle Inverter Market, BY COUNTRY, 2019-2032 (USD MILLION) 74
      10. TABLE 9 NORTH AMERICA Electric Vehicle Inverter Market, BY INVERTER 2019-2032 (USD MILLION) 75
      11. TABLE 10 NORTH AMERICA Electric Vehicle Inverter Market, BY POWER, 2019-2032 (USD MILLION) 75
      12. TABLE 11 NORTH AMERICA Electric Vehicle Inverter Market, BY VEHICLE PROPULSION, 2019-2032 (USD MILLION) 75
      13. TABLE 12 NORTH AMERICA Electric Vehicle Inverter Market, BY VEHICLE CATEGORY, 2019-2032 (USD MILLION) 75
      14. TABLE 13 US Electric Vehicle Inverter Market, BY INVERTER 2019-2032 (USD MILLION) 76
      15. TABLE 14 US Electric Vehicle Inverter Market, BY POWER, 2019-2032 (USD MILLION) 76
      16. TABLE 15 US Electric Vehicle Inverter Market, BY VEHICLE PROPULSION, 2019-2032 (USD MILLION) 76
      17. TABLE 16 US Electric Vehicle Inverter Market, BY VEHICLE CATEGORY, 2019-2032 (USD MILLION) 76
      18. TABLE 17 CANADA Electric Vehicle Inverter Market, BY INVERTER, 2019-2032 (USD MILLION) 77
      19. TABLE 18 CANADA Electric Vehicle Inverter Market, BY POWER, 2019-2032 (USD MILLION) 77
      20. TABLE 19 CANADA Electric Vehicle Inverter Market, BY VEHICLE PROPULSION, 2019-2032 (USD MILLION) 77
      21. TABLE 20 CANADA Electric Vehicle Inverter Market, BY VEHICLE CATEGORY, 2019-2032 (USD MILLION) 77
      22. TABLE 21 MEXICO Electric Vehicle Inverter Market, BY INVERTER, 2019-2032 (USD MILLION) 78
      23. TABLE 22 MEXICO Electric Vehicle Inverter Market, BY POWER, 2019-2032 (USD MILLION) 78
      24. TABLE 23 MEXICO Electric Vehicle Inverter Market, BY VEHICLE PROPULSION, 2019-2032 (USD MILLION) 78
      25. TABLE 24 MEXICO Electric Vehicle Inverter Market, BY VEHICLE CATEGORY, 2019-2032 (USD MILLION) 78
      26. TABLE 25 EUROPE: Electric Vehicle Inverter Market, BY COUNTRY, 2019-2032 (USD MILLION) 80
      27. TABLE 26 EUROPE Electric Vehicle Inverter Market, BY INVERTER, 2019-2032 (USD MILLION) 81
      28. TABLE 27 EUROPE Electric Vehicle Inverter Market, BY POWER, 2019-2032 (USD MILLION) 81
      29. TABLE 28 EUROPE Electric Vehicle Inverter Market, BY VEHICLE PROPULSION, 2019-2032 (USD MILLION) 81
      30. TABLE 29 EUROPE Electric Vehicle Inverter Market, BY VEHICLE CATEGORY, 2019-2032 (USD MILLION) 81
      31. TABLE 30 GERMANY Electric Vehicle Inverter Market, BY INVERTER, 2019-2032 (USD MILLION) 82
      32. TABLE 31 GERMANY Electric Vehicle Inverter Market, BY POWER, 2019-2032 (USD MILLION) 82
      33. TABLE 32 GERMANY Electric Vehicle Inverter Market, BY VEHICLE PROPULSION, 2019-2032 (USD MILLION) 82
      34. TABLE 33 GERMANY Electric Vehicle Inverter Market, BY VEHICLE CATEGORY, 2019-2032 (USD MILLION) 82
      35. TABLE 34 UK Electric Vehicle Inverter Market, BY INVERTER, 2019-2032 (USD MILLION) 83
      36. TABLE 35 UK Electric Vehicle Inverter Market, BY POWER, 2019-2032 (USD MILLION) 83
      37. TABLE 36 UK Electric Vehicle Inverter Market, BY VEHICLE PROPULSION, 2019-2032 (USD MILLION) 83
      38. TABLE 37 UK Electric Vehicle Inverter Market, BY VEHICLE CATEGORY, 2019-2032 (USD MILLION) 83
      39. TABLE 38 FRANCE Electric Vehicle Inverter Market, BY INVERTER, 2019-2032 (USD MILLION) 84
      40. TABLE 39 FRANCE Electric Vehicle Inverter Market, BY POWER, 2019-2032 (USD MILLION) 84
      41. TABLE 40 FRANCE Electric Vehicle Inverter Market, BY VEHICLE PROPULSION, 2019-2032 (USD MILLION) 84
      42. TABLE 41 FRANCE Electric Vehicle Inverter Market, BY VEHICLE CATEGORY, 2019-2032 (USD MILLION) 84
      43. TABLE 42 ITALY Electric Vehicle Inverter Market, BY INVERTER, 2019-2032 (USD MILLION) 85
      44. TABLE 43 ITALY Electric Vehicle Inverter Market, BY POWER, 2019-2032 (USD MILLION) 85
      45. TABLE 44 ITALY Electric Vehicle Inverter Market, BY VEHICLE PROPULSION, 2019-2032 (USD MILLION) 85
      46. TABLE 45 ITALY Electric Vehicle Inverter Market, BY VEHICLE CATEGORY, 2019-2032 (USD MILLION) 85
      47. TABLE 46 SPAIN Electric Vehicle Inverter Market, BY INVERTER, 2019-2032 (USD MILLION) 86
      48. TABLE 47 SPAIN Electric Vehicle Inverter Market, BY POWER, 2019-2032 (USD MILLION) 86
      49. TABLE 48 SPAIN Electric Vehicle Inverter Market, BY VEHICLE PROPULSION, 2019-2032 (USD MILLION) 86
      50. TABLE 49 SPAIN Electric Vehicle Inverter Market, BY VEHICLE CATEGORY, 2019-2032 (USD MILLION) 86
      51. TABLE 50 DENMARK Electric Vehicle Inverter Market, BY INVERTER, 2019-2032 (USD MILLION) 87
      52. TABLE 51 DENMARK Electric Vehicle Inverter Market, BY POWER, 2019-2032 (USD MILLION) 87
      53. TABLE 52 DENMARK Electric Vehicle Inverter Market, BY VEHICLE PROPULSION, 2019-2032 (USD MILLION) 87
      54. TABLE 53 DENMARK Electric Vehicle Inverter Market, BY VEHICLE CATEGORY, 2019-2032 (USD MILLION) 87
      55. TABLE 54 AUSTRIA Electric Vehicle Inverter Market, BY INVERTER, 2019-2032 (USD MILLION) 88
      56. TABLE 55 AUSTRIA Electric Vehicle Inverter Market, BY POWER, 2019-2032 (USD MILLION) 88
      57. TABLE 56 AUSTRIA Electric Vehicle Inverter Market, BY VEHICLE PROPULSION, 2019-2032 (USD MILLION) 88
      58. TABLE 57 AUSTRIA Electric Vehicle Inverter Market, BY VEHICLE CATEGORY, 2019-2032 (USD MILLION) 88
      59. TABLE 58 NETHERLANDS Electric Vehicle Inverter Market, BY INVERTER, 2019-2032 (USD MILLION) 89
      60. TABLE 59 NETHERLANDS Electric Vehicle Inverter Market, BY POWER, 2019-2032 (USD MILLION) 89
      61. TABLE 60 NETHERLANDS Electric Vehicle Inverter Market, BY VEHICLE PROPULSION, 2019-2032 (USD MILLION) 89
      62. TABLE 61 NETHERLANDS Electric Vehicle Inverter Market, BY VEHICLE CATEGORY, 2019-2032 (USD MILLION) 89
      63. TABLE 62 LUXEMBOURG Electric Vehicle Inverter Market, BY INVERTER, 2019-2032 (USD MILLION) 90
      64. TABLE 63 LUXEMBOURG Electric Vehicle Inverter Market, BY POWER, 2019-2032 (USD MILLION) 90
      65. TABLE 64 LUXEMBOURG Electric Vehicle Inverter Market, BY VEHICLE PROPULSION, 2019-2032 (USD MILLION) 90
      66. TABLE 65 LUXEMBOURG Electric Vehicle Inve

    Electric Vehicle Inverter Market Segmentation

    Global Electric Vehicle Inverter Inverter Outlook (USD Million, 2019-2032)

    • SiC
    • IGBT

    Global Electric Vehicle Inverter Power Outlook (USD Million, 2019-2032)

    • Up to 100 kW
    • 101-300 kW
    • 301-600 kW
    • 601 kW & Above

    Global Electric Vehicle Inverter Vehicle Propulsion Outlook (USD Million, 2019-2032)

    • BEVs
    • HEVs
    • PHEVs
    • FCEVs

    Global Electric Vehicle Inverter Vehicle Category Outlook (USD Million, 2019-2032)

    • Passenger Cars
    • Commercial Vehicles

    Global Electric Vehicle Inverter Regional Outlook (USD Million, 2019-2032)

    North America Electric Vehicle Inverter Inverter Outlook (USD Million, 2019-2032)

    • SiC
    • IGBT

    North America Electric Vehicle Inverter Power Outlook (USD Million, 2019-2032)

    • Up to 100 kW
    • 101-300 kW
    • 301-600 kW
    • 601 kW & Above

    North America Electric Vehicle Inverter Vehicle Propulsion Outlook (USD Million, 2019-2032)

    • BEVs
    • HEVs
    • PHEVs
    • FCEVs

    North America Electric Vehicle Inverter Vehicle Category Outlook (USD Million, 2019-2032)

    • Passenger Cars
    • Commercial Vehicles

    US Electric Vehicle Inverter Inverter Outlook (USD Million, 2019-2032)

    • SiC
    • IGBT

    US Electric Vehicle Inverter Power Outlook (USD Million, 2019-2032)

    • Up to 100 kW
    • 101-300 kW
    • 301-600 kW
    • 601 kW & Above

    US Electric Vehicle Inverter Vehicle Propulsion Outlook (USD Million, 2019-2032)

    • BEVs
    • HEVs
    • PHEVs
    • FCEVs

    US Electric Vehicle Inverter Vehicle Category Outlook (USD Million, 2019-2032)

    • Passenger Cars
    • Commercial Vehicles

    Canada Electric Vehicle Inverter Inverter Outlook (USD Million, 2019-2032)

    • SiC
    • IGBT

    Canada Electric Vehicle Inverter Power Outlook (USD Million, 2019-2032)

    • Up to 100 kW
    • 101-300 kW
    • 301-600 kW
    • 601 kW & Above

    Canada Electric Vehicle Inverter Vehicle Propulsion Outlook (USD Million, 2019-2032)

    • BEVs
    • HEVs
    • PHEVs
    • FCEVs

    Canada Electric Vehicle Inverter Vehicle Category Outlook (USD Million, 2019-2032)

    • Passenger Cars
    • Commercial Vehicles

    Mexico Electric Vehicle Inverter Inverter Outlook (USD Million, 2019-2032)

    • SiC
    • IGBT

    Mexico Electric Vehicle Inverter Power Outlook (USD Million, 2019-2032)

    • Up to 100 kW
    • 101-300 kW
    • 301-600 kW
    • 601 kW & Above

    Mexico Electric Vehicle Inverter Vehicle Propulsion Outlook (USD Million, 2019-2032)

    • BEVs
    • HEVs
    • PHEVs
    • FCEVs

    Mexico Electric Vehicle Inverter Vehicle Category Outlook (USD Million, 2019-2032)

    • Passenger Cars
    • Commercial Vehicles

    Europe Electric Vehicle Inverter Inverter Outlook (USD Million, 2019-2032)

    • SiC
    • IGBT

    Europe Electric Vehicle Inverter Power Outlook (USD Million, 2019-2032)

    • Up to 100 kW
    • 101-300 kW
    • 301-600 kW
    • 601 kW & Above

    Europe Electric Vehicle Inverter Vehicle Propulsion Outlook (USD Million, 2019-2032)

    • BEVs
    • HEVs
    • PHEVs
    • FCEVs

    Europe Electric Vehicle Inverter Vehicle Category Outlook (USD Million, 2019-2032)

    • Passenger Cars
    • Commercial Vehicles

    Germany Electric Vehicle Inverter Inverter Outlook (USD Million, 2019-2032)

    • SiC
    • IGBT

    Germany Electric Vehicle Inverter Power Outlook (USD Million, 2019-2032)

    • Up to 100 kW
    • 101-300 kW
    • 301-600 kW
    • 601 kW & Above

    Germany Electric Vehicle Inverter Vehicle Propulsion Outlook (USD Million, 2019-2032)

    • BEVs
    • HEVs
    • PHEVs
    • FCEVs

    Germany Electric Vehicle Inverter Vehicle Category Outlook (USD Million, 2019-2032)

    • Passenger Cars
    • Commercial Vehicles

    UK Electric Vehicle Inverter Inverter Outlook (USD Million, 2019-2032)

    • SiC
    • IGBT

    UK Electric Vehicle Inverter Power Outlook (USD Million, 2019-2032)

    • Up to 100 kW
    • 101-300 kW
    • 301-600 kW
    • 601 kW & Above

    UK Electric Vehicle Inverter Vehicle Propulsion Outlook (USD Million, 2019-2032)

    • BEVs
    • HEVs
    • PHEVs
    • FCEVs

    UK Electric Vehicle Inverter Vehicle Category Outlook (USD Million, 2019-2032)

    • Passenger Cars
    • Commercial Vehicles

    France Electric Vehicle Inverter Inverter Outlook (USD Million, 2019-2032)

    • SiC
    • IGBT

    France Electric Vehicle Inverter Power Outlook (USD Million, 2019-2032)

    • Up to 100 kW
    • 101-300 kW
    • 301-600 kW
    • 601 kW & Above

    France Electric Vehicle Inverter Vehicle Propulsion Outlook (USD Million, 2019-2032)

    • BEVs
    • HEVs
    • PHEVs
    • FCEVs

    France Electric Vehicle Inverter Vehicle Category Outlook (USD Million, 2019-2032)

    • Passenger Cars
    • Commercial Vehicles

    Italy Electric Vehicle Inverter Inverter Outlook (USD Million, 2019-2032)

    • SiC
    • IGBT

    Italy Electric Vehicle Inverter Power Outlook (USD Million, 2019-2032)

    • Up to 100 kW
    • 101-300 kW
    • 301-600 kW
    • 601 kW & Above

    Italy Electric Vehicle Inverter Vehicle Propulsion Outlook (USD Million, 2019-2032)

    • BEVs
    • HEVs
    • PHEVs
    • FCEVs

    Italy Electric Vehicle Inverter Vehicle Category Outlook (USD Million, 2019-2032)

    • Passenger Cars
    • Commercial Vehicles

    Spain Electric Vehicle Inverter Inverter Outlook (USD Million, 2019-2032)

    • SiC
    • IGBT

    Spain Electric Vehicle Inverter Power Outlook (USD Million, 2019-2032)

    • Up to 100 kW
    • 101-300 kW
    • 301-600 kW
    • 601 kW & Above

    Spain Electric Vehicle Inverter Vehicle Propulsion Outlook (USD Million, 2019-2032)

    • BEVs
    • HEVs
    • PHEVs
    • FCEVs

    Spain Electric Vehicle Inverter Vehicle Category Outlook (USD Million, 2019-2032)

    • Passenger Cars
    • Commercial Vehicles

    Rest of Europe Electric Vehicle Inverter Inverter Outlook (USD Million, 2019-2032)

    • SiC
    • IGBT

    Rest of Europe Electric Vehicle Inverter Power Outlook (USD Million, 2019-2032)

    • Up to 100 kW
    • 101-300 kW
    • 301-600 kW
    • 601 kW & Above

    Rest of Europe Electric Vehicle Inverter Vehicle Propulsion Outlook (USD Million, 2019-2032)

    • BEVs
    • HEVs
    • PHEVs
    • FCEVs

    Rest of Europe Electric Vehicle Inverter Vehicle Category Outlook (USD Million, 2019-2032)

    • Passenger Cars
    • Commercial Vehicles

    Asia Pacific Electric Vehicle Inverter Inverter Outlook (USD Million, 2019-2032)

    • SiC
    • IGBT

    Asia Pacific Electric Vehicle Inverter Power Outlook (USD Million, 2019-2032)

    • Up to 100 kW
    • 101-300 kW
    • 301-600 kW
    • 601 kW & Above

    Asia Pacific Electric Vehicle Inverter Vehicle Propulsion Outlook (USD Million, 2019-2032)

    • BEVs
    • HEVs
    • PHEVs
    • FCEVs

    Asia Pacific Electric Vehicle Inverter Vehicle Category Outlook (USD Million, 2019-2032)

    • Passenger Cars
    • Commercial Vehicles

    China Electric Vehicle Inverter Inverter Outlook (USD Million, 2019-2032)

    • SiC
    • IGBT

    China Electric Vehicle Inverter Power Outlook (USD Million, 2019-2032)

    • Up to 100 kW
    • 101-300 kW
    • 301-600 kW
    • 601 kW & Above

    China Electric Vehicle Inverter Vehicle Propulsion Outlook (USD Million, 2019-2032)

    • BEVs
    • HEVs
    • PHEVs
    • FCEVs

    China Electric Vehicle Inverter Vehicle Category Outlook (USD Million, 2019-2032)

    • Passenger Cars
    • Commercial Vehicles

    Japan Electric Vehicle Inverter Inverter Outlook (USD Million, 2019-2032)

    • SiC
    • IGBT

    Japan Electric Vehicle Inverter Power Outlook (USD Million, 2019-2032)

    • Up to 100 kW
    • 101-300 kW
    • 301-600 kW
    • 601 kW & Above

    Japan Electric Vehicle Inverter Vehicle Propulsion Outlook (USD Million, 2019-2032)

    • BEVs
    • HEVs
    • PHEVs
    • FCEVs

    Japan Electric Vehicle Inverter Vehicle Category Outlook (USD Million, 2019-2032)

    • Passenger Cars
    • Commercial Vehicles

    India Electric Vehicle Inverter Inverter Outlook (USD Million, 2019-2032)

    • SiC
    • IGBT

    India Electric Vehicle Inverter Power Outlook (USD Million, 2019-2032)

    • Up to 100 kW
    • 101-300 kW
    • 301-600 kW
    • 601 kW & Above

    India Electric Vehicle Inverter Vehicle Propulsion Outlook (USD Million, 2019-2032)

    • BEVs
    • HEVs
    • PHEVs
    • FCEVs

    India Electric Vehicle Inverter Vehicle Category Outlook (USD Million, 2019-2032)

    • Passenger Cars
    • Commercial Vehicles

    Rest of Asia Pacific Electric Vehicle Inverter Inverter Outlook (USD Million, 2019-2032)

    • SiC
    • IGBT

    Rest of Asia Pacific Electric Vehicle Inverter Power Outlook (USD Million, 2019-2032)

    • Up to 100 kW
    • 101-300 kW
    • 301-600 kW
    • 601 kW & Above

    Rest of Asia Pacific Electric Vehicle Inverter Vehicle Propulsion Outlook (USD Million, 2019-2032)

    • BEVs
    • HEVs
    • PHEVs
    • FCEVs

    Rest of Asia Pacific Electric Vehicle Inverter Vehicle Category Outlook (USD Million, 2019-2032)

    • Passenger Cars
    • Commercial Vehicles

    Middle East & Africa Electric Vehicle Inverter Inverter Outlook (USD Million, 2019-2032)

    • SiC
    • IGBT

    Middle East & Africa Electric Vehicle Inverter Power Outlook (USD Million, 2019-2032)

    • Up to 100 kW
    • 101-300 kW
    • 301-600 kW
    • 601 kW & Above

    Middle East & Africa Electric Vehicle Inverter Vehicle Propulsion Outlook (USD Million, 2019-2032)

    • BEVs
    • HEVs
    • PHEVs
    • FCEVs

    Middle East & Africa Electric Vehicle Inverter Vehicle Category Outlook (USD Million, 2019-2032)

    • Passenger Cars
    • Commercial Vehicles

    South America Electric Vehicle Inverter Inverter Outlook (USD Million, 2019-2032)

    • SiC
    • IGBT

    South America Electric Vehicle Inverter Power Outlook (USD Million, 2019-2032)

    • Up to 100 kW
    • 101-300 kW
    • 301-600 kW
    • 601 kW & Above

    South America Electric Vehicle Inverter Vehicle Propulsion Outlook (USD Million, 2019-2032)

    • BEVs
    • HEVs
    • PHEVs
    • FCEVs

    South America Electric Vehicle Inverter Vehicle Category Outlook (USD Million, 2019-2032)

    • Passenger Cars
    • Commercial Vehicles
    Infographic

    Free Sample Request

    Kindly complete the form below to receive a free sample of this Report

    Get Free Sample

    Customer Strories

    “I am very pleased with how market segments have been defined in a relevant way for my purposes (such as "Portable Freezers & refrigerators" and "last-mile"). In general the report is well structured. Thanks very much for your efforts.”

    Victoria Milne

    Founder
    Case Study
    Chemicals and Materials