• Cat-intel
  • MedIntelliX
  • Resources
  • About Us
  • Request Free Sample ×

    Kindly complete the form below to receive a free sample of this Report

    Leading companies partner with us for data-driven Insights

    clients tt-cursor

    Dynamic Positioning System Market

    ID: MRFR/A&D/7281-CR
    128 Pages
    Priya Nagrale
    February 2024

    Dynamic Positioning System Market Research Report Information by Subsystem (Control System, Thruster System, Power System, Others) By Equipment Class (Class 1, Class 2, Class 3), By Application (Merchant Vessels, Passenger Vessels, Naval Vessels, Offshore Vessels), And By Region (North America, Europe, Asia-Pacific, Middle East & Africa, and Latin America) –Market Forecast Till 2032

    Share:
    Download PDF ×

    We do not share your information with anyone. However, we may send you emails based on your report interest from time to time. You may contact us at any time to opt-out.

    Dynamic Positioning System Market Research Report - Global Forecast till 2032 Infographic
    Purchase Options
    $ 4,950.0
    $ 5,950.0
    $ 7,250.0
    Table of Contents

    Dynamic Positioning System Market Summary

    As per Market Research Future Analysis, the Global Dynamic Positioning System Market was valued at USD 1,957.84 Million in 2023 and is projected to reach USD 3,169.47 Million by 2032, growing at a CAGR of 5.49% from 2024 to 2032. The market growth is driven by increasing safety and efficiency demands in maritime operations and rising seaborne trade. However, high initial investment and operational costs, along with the complexity of systems for inexperienced operators, may hinder adoption. Opportunities lie in the growing offshore renewable energy sector and the autonomous shipping industry.

    Key Market Trends & Highlights

    Key trends influencing the Dynamic Positioning System Market include technological advancements and increasing maritime trade.

    • Dynamic Positioning System Market Size in 2023: USD 1,957.84 Million
    • Projected Market Size by 2032: USD 3,169.47 Million
    • CAGR from 2024 to 2032: 5.49%
    • Asia Pacific held the largest market share in 2022: 56.2%

    Market Size & Forecast

    2023 Market Size USD 1,957.84 Million
    2024 Market Size USD 2,065.52 Million
    2032 Market Size USD 3,169.47 Million

    Major Players

    Kongsberg Maritime, General Electric, ABB Ltd., L3Harris Technologies, Wr, Marine Technologies, Rolls-Royce Holdings PLC, Bosch Rexroth AG

    Dynamic Positioning System Market Trends

    The ongoing advancements in marine technology and the increasing demand for efficient vessel operations are likely to propel the growth of the Dynamic Positioning System market, reflecting a broader trend towards automation and precision in maritime activities.

    U.S. Department of Transportation

    Dynamic Positioning System Market Drivers

    Market Charts and Trends

    Growth of the Renewable Energy Sector

    The burgeoning renewable energy sector is a pivotal driver for the Global Dynamic Positioning System Market Industry. With the increasing focus on sustainable energy sources, offshore wind farms and tidal energy projects are gaining traction. These projects require precise positioning to ensure the effective installation and maintenance of energy infrastructure. As a result, the demand for dynamic positioning systems is expected to surge. The market's growth trajectory is supported by investments in renewable energy, which are projected to contribute significantly to the overall market expansion. This trend aligns with the global shift towards greener energy solutions, further enhancing the relevance of dynamic positioning technologies.

    Technological Advancements in DP Systems

    Technological innovations play a crucial role in shaping the Global Dynamic Positioning System Market Industry. The integration of artificial intelligence, machine learning, and enhanced sensor technologies is revolutionizing the capabilities of dynamic positioning systems. These advancements not only improve accuracy and reliability but also reduce operational costs. For example, the implementation of advanced algorithms allows for real-time data processing, enabling vessels to maintain their position with greater precision. As these technologies continue to evolve, they are likely to attract further investments and drive market growth, thereby enhancing the overall efficiency of maritime operations.

    Increasing Demand for Offshore Operations

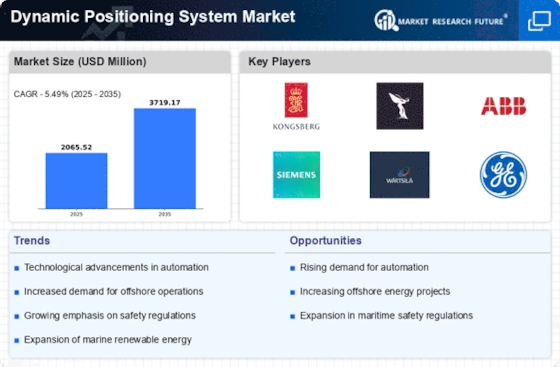
    The Global Dynamic Positioning System Market Industry experiences heightened demand due to the expansion of offshore operations in sectors such as oil and gas, renewable energy, and maritime transport. As companies seek to enhance operational efficiency and safety, the adoption of advanced dynamic positioning systems becomes paramount. For instance, the global offshore oil and gas market is projected to grow significantly, driving the need for sophisticated positioning technologies. This trend is reflected in the market's anticipated growth from 2.07 USD Billion in 2024 to 3.72 USD Billion by 2035, indicating a robust compound annual growth rate of 5.5% from 2025 to 2035.

    Regulatory Compliance and Safety Standards

    The Global Dynamic Positioning System Market Industry is significantly influenced by stringent regulatory compliance and safety standards imposed by maritime authorities. These regulations necessitate the implementation of advanced dynamic positioning systems to ensure safe navigation and operational integrity. For instance, the International Maritime Organization has established guidelines that mandate the use of DP systems in specific maritime operations. As a result, companies are increasingly investing in these technologies to meet compliance requirements, thereby propelling market growth. The emphasis on safety and environmental protection is expected to further drive the adoption of dynamic positioning systems across various maritime sectors.

    Market Segment Insights

    Dynamic Positioning System Market Subsystem Segment Insights

    Dynamic Positioning System Market Subsystem Insights

    Based on Subsystem, the Dynamic Positioning System Market segmentation includes Control System, Thruster System, Power System and Others. The Control System segment held the majority share in 2022, contributing around ~41.3% to the market revenue. A control system enables a vessel to maintain its position and head automatically. It utilizes a combination of sensors, computer systems, and thrusters to counteract external forces such as wind, waves, and currents, ensuring the vessel stays in a desired location.

    The control system continuously receives information from position reference sensors, wind sensors, motion sensors, and gyrocompasses to calculate the necessary steering angles and thruster outputs for each thruster. The control system in dynamic positioning is essential for various applications, including offshore drilling, cable-laying vessels, cruise ships, research vessels, and many others. It allows for precise maneuverability and positioning, even in challenging conditions, making it a valuable tool in the maritime industry.

    A power system refers to the generation and distribution of electrical power required to operate a vessel's propulsion and manoeuvring thrusters. It is one of the key sub-systems of a DP system. An ideal DP power system is designed to provide reliable and uninterrupted power to the thrusters even during failure conditions. It typically consists of multiple diesel generator sets which feed busbars and switchboards. The switchboards then distribute power to electric propulsion motors and thruster drives.

    The DP control system monitors the power system to ensure adequate power from the generators to maintain the vessel's position as required by environmental conditions. Having redundant power sources is crucial for dynamic positioning operations to withstand single generator or busbar failures.

    Figure 1: Dynamic Positioning System Market, by Component, 2022 & 2032 (USD Million)

    Dynamic Positioning System Market, by Component, 2022 & 2032

    Source: Secondary Research, Primary Research, Market Research Future Database, and Analyst Review

    Dynamic Positioning System Market Equipment Class Insights

    Based on Equipment Class, the Dynamic Positioning System Market segmentation includes Class 1, Class 2 and Class 3. The Class 2 segment held the majority share in 2022 contributing around ~49.3% to the market revenue. Class 2 are designed for vessels that operate in more demanding environments. These systems have a redundant capability, meaning they can automatically compensate for equipment failures, ensuring the vessel's position is precisely maintained. Class 2 DP systems are required for operations in areas with more challenging weather conditions or critical operations.

    They provide increased reliability and safety compared to Class 1 systems, making them suitable for offshore construction, seismic surveys, and offshore supply vessels.

    Class 1 Dynamic Positioning (DP) systems are designed for vessels that require position-keeping capabilities under normal weather conditions. These systems have a single failure tolerance, meaning that the system should remain operational and maintain its position in the event of a single failure. Class 1 DP systems generally have essential redundancy and are typically used in benign environments where failure poses no significant risk to human life or the environment. They are commonly used in offshore drilling, pipe laying, and diving operations.

    Dynamic Positioning System Market Application Insights

    Based on the Application, the Dynamic Positioning System Market segmentation includes Merchant Vessels, Passenger Vessels, Naval Vessels and Offshore Vessels. The Offshore Vessels segment hold the majority market share in 2022 contributing 49.4% of the market share. DPS significantly benefits offshore activities such as drilling, subsea construction, cable laying, and offshore platform maintenance. Firstly, it enhances safety by eliminating the need for anchors, reducing the risk of anchor dragging or damage to sensitive seafloor structures. This is especially crucial in harsh weather conditions or deep-water environments.

    Secondly, DPS allows for precise maneuvering and positioning, essential for intricate operations such as connecting subsea pipelines or conducting delicate repairs. It enables more efficient and accurate processes, reducing downtime and costs. Additionally, DPS allows vessels to maintain a fixed position during offshore drilling operations, ensuring precise wellbore placement. This is vital for optimizing hydrocarbon extraction and reducing environmental risks.

    Naval operations enable precise positioning of vessels during sensitive processes such as mine clearance, underwater exploration, or launching and recovering unmanned vehicles. DPS enhances vessel stability, allowing for more accurate and stable weapon deployment increasing the accuracy of missile launches or naval gunfire support. Moreover, DPS improves the safety and effectiveness of maritime operations in challenging environmental conditions by compensating for wind, wave, and current effects. This technology allows vessels to stay on station during adverse weather conditions, making it valuable in search and rescue missions, offshore patrols, or extended surveillance operations.

    Overall, applying dynamic positioning systems in naval vessels provides enhanced operational capabilities, increased safety, and improved efficiency in accomplishing various naval tasks, contributing to the overall effectiveness of the maritime force.

    Regional Insights

    Key Companies in the Dynamic Positioning System Market market include

    Industry Developments

      • In April 2022, Rolls-Royce has launched a new range of MTU Nautiq products incorporating Sea Machines technology to provide intelligent crew support systems for the marine industry. The integration of Sea Machines' autonomous technology with Rolls-Royce's MTU Nautiq products will enable vessels to operate with increased efficiency, safety, and reliability, while also reducing operating costs.
      • In July 2023, L3Harris Technologies has completed its acquisition of Aerojet Rocketdyne, a leading supplier of propulsion systems for the aerospace and defense industries. The acquisition is expected to strengthen the defense industrial base and promote competition in the sector.

    Future Outlook

    Dynamic Positioning System Market Future Outlook

    The Global Dynamic Positioning System Market is projected to grow at a 5.5% CAGR from 2024 to 2035, driven by advancements in automation, increased offshore activities, and rising safety regulations.

    New opportunities lie in:

    • Develop AI-driven algorithms for enhanced positioning accuracy.
    • Expand service offerings to include retrofitting existing vessels.
    • Invest in sustainable technologies to meet environmental regulations.

    By 2035, the market is expected to achieve substantial growth, reflecting a robust demand for advanced dynamic positioning solutions.

    Market Segmentation

    Dynamic Positioning System Market Regional Outlook

    • US
    • Canada

    Dynamic Positioning System Market Subsystem Outlook

    • Control System
    • Thruster System
    • Power System
    • Others

    Dynamic Positioning System Market Application Outlook

    • Merchant Vessels
    • Passenger Vessels
    • Naval Vessels
    • Offshore Vessels

    Dynamic Positioning System Market Equipment Class Outlook

    • Class 1
    • Class 2
    • Class 3

    Report Scope

    Report Attribute/Metric Details
    Market Size 2023 USD 1957.84 Million
    Market Size 2024 USD 2065.5212 Million
    Market Size 2032 USD 3,169.47 Million
    Compound Annual Growth Rate (CAGR) 5.49% (2024-2032)
    Base Year 2023
    Market Forecast Period 2024-2032
    Historical Data 2019- 2022
    Market Forecast Units Value (USD Million)
    Report Coverage Revenue Forecast, Market Competitive Landscape, Growth Factors, and Trends
    Segments Covered Subsystem, Equipment Class, Application, and Region
    Geographies Covered Europe, North America, Asia-Pacific, Middle East & Africa, and latin America
    Countries Covered The U.S, Germany, Canada, U.K., Italy, France, Spain, Japan, China, Australia, India, South Korea, Brazil, and others.
    Key Companies Profiled Kongsberg Maritime (Kongsberg Gruppen), General Electric, ABB Ltd., L3Harris Technologies, Inc., Wärtsilä, Marine, Technologies, LLC, Navis Engineering, Rolls-Royce Holdings PLC, NORR Systems AS, Bosch Rexroth AG and Others.
    Key Market Opportunities ·       Growing offshore renewable energy sector offers promising opportunities for dynamic positioning system market             ·       Growing autonomous shipping industry
    Key Market Dynamics ·       Rising focus on safety and efficiency drives the demand for dynamic positioning systems in maritime operations     ·       Increase in seaborne trade across the globe

    Market Highlights

    Author
    Priya Nagrale
    Senior Research Analyst

    With an experience of over five years in market research industry (Chemicals & Materials domain), I gather and analyze market data from diverse sources to produce results, which are then presented back to a client. Also, provide recommendations based on the findings. As a Senior Research Analyst, I perform quality checks (QC) for market estimations, QC for reports, and handle queries and work extensively on client customizations. Also, handle the responsibilities of client proposals, report planning, report finalization, and execution

    Leave a Comment

    FAQs

    How much is the Dynamic Positioning System Market?

    The Dynamic Positioning System Market size is expected to be valued at USD 1957.84 Million in 2023.

    What is the growth rate of the Dynamic Positioning System Market?

    The global market is projected to grow at a CAGR of 5.49% during the forecast period, 2024-2032.

    Which region held the largest market share in the Dynamic Positioning System Market?

    Europe had the largest share of the global market.

    Who are the key players in the Dynamic Positioning System Market?

    The key players in the market are Kongsberg Maritime (Kongsberg Gruppen), General Electric, ABB Ltd., L3Harris Technologies, Inc., Wärtsilä, Marine, Technologies, LLC, Navis Engineering, Rolls-Royce Holdings PLC, NORR Systems AS, Bosch Rexroth AG and Others.

    Which Subsystem led the Dynamic Positioning System Market?

    The Control System category dominated the market in 2023.

    1. EXECUTIVE SUMMARY 18
      1. MARKET ATTRACTIVENESS
    2. ANALYSIS 19
    3. MARKET INTRODUCTION 20
      1. DEFINITION 20
      2. SCOPE OF THE STUDY 20
      3. RESEARCH OBJECTIVE 20
      4. MARKET STRUCTURE 20
    4. RESEARCH METHODOLOGY 21
    5. MARKET DYNAMICS 28
      1. INTRODUCTION 28
    6. DRIVERS 29
      1. RISING FOCUS ON SAFETY AND EFFICIENCY DRIVES THE DEMAND FOR
    7. DYNAMIC POSITIONING SYSTEMS IN MARITIME OPERATIONS 29
      1. INCREASE IN SEABORNE
    8. TRADE ACROSS THE GLOBE 29
      1. RESTRAINTS 30
        1. HIGH INITIAL INVESTMENT
    9. AND OPERATIONAL COSTS RESTRICT THE ADOPTION OF DYNAMIC POSITIONING SYSTEMS 30
      1. COMPLEX SYSTEMS ARE DIFFICULT TO RUN BY INEXPERIENCED OPERATORS 30
    10. OPPORTUNITY 31
      1. GROWING OFFSHORE RENEWABLE ENERGY SECTOR OFFERS PROMISING
    11. OPPORTUNITIES FOR DYNAMIC POSITIONING SYSTEM MARKET 31
      1. GROWING AUTONOMOUS
    12. SHIPPING INDUSTRY 32
    13. COST STRUCTURE ANALYSIS 33
      1. COST STRUCTURE ANALYSIS
    14. OF DYNAMIC POSITIONING SYSTEM MARKET 33
      1. CAPITAL COSTS 33
        1. OPERATIONAL
    15. COSTS 33
      1. REGULATORY COSTS 33
      2. YEAR OF INSTALLMENTS ANALYSIS,
    16. MARKET FACTOR ANALYSIS 34
      1. SUPPLY CHAIN ANALYSIS 34
        1. RAW MATERIAL SUPPLIERS 34
        2. DYNAMIC POSITIONING SYSTEM MANUFACTURERS
        3. DISTRIBUTION & SALES CHANNEL: 34
        4. END-USERS: 35
    17. PORTER'S FIVE FORCES MODEL 35
      1. THREAT OF NEW ENTRANTS 35
        1. BARGAINING
    18. POWER OF SUPPLIERS: 36
      1. BARGAINING POWER OF BUYERS: 36
        1. THREAT
    19. OF SUBSTITUTE PRODUCTS OR SERVICES: 36
      1. INTENSITY OF COMPETITIVE RIVALRY:
      2. IMPACT OF CORONAVIRUS OUTBREAK ON GLOBAL DYNAMIC POSITIONING SYSTEM
    20. MARKET 36
      1. IMPACT OF COVID-19 ON SUPPLY CHAIN OF DYNAMIC POSITIONING SYSTEM
    21. MARKET* 36
      1. QUALITATIVE ANALYSIS ON CHANGE IN DEMAND FROM END USER 37
    22. GLOBAL DYNAMIC POSITIONING SYSTEM MARKET, BY SUBSYSTEM 38
      1. OVERVIEW
        1. GLOBAL DYNAMIC POSITIONING SYSTEM MARKET, BY SUBSYSTEM, 2024–2032
    23. (USD MILLION) 39
      1. CONTROL SYSTEM 39
        1. THRUSTER SYSTEM 39
    24. POWER SYSTEM 39
      1. OTHERS 40
    25. GLOBAL DYNAMIC POSITIONING SYSTEM MARKET,
    26. BY EQUIPMENT CLASS 41
      1. OVERVIEW 41
        1. GLOBAL DYNAMIC POSITIONING
    27. SYSTEM MARKET, BY EQUIPMENT CLASS, 2024–2032 (USD MILLION) 42
      1. CLASS
        1. CLASS 2 42
        2. CLASS 3 42
    28. GLOBAL DYNAMIC POSITIONING
    29. SYSTEM MARKET, BY APPLICATION 43
      1. OVERVIEW 43
        1. GLOBAL DYNAMIC
    30. POSITIONING SYSTEM MARKET, BY APPLICATION, 2024–2032 (USD MILLION) 44
    31. MERCHANT VESSELS 44
      1. PASSENGER VESSELS 44
        1. NAVAL VESSELS 44
        2. OFFSHORE VESSELS 45
    32. GLOBAL DYNAMIC POSITIONING SYSTEM MARKET, BY
    33. REGION 46
      1. OVERVIEW 46
        1. GLOBAL DYNAMIC POSITIONING SYSTEM MARKET,
    34. BY REGION, 2024–2032 (USD MILLION) 46
      1. GLOBAL DYNAMIC POSITIONING
    35. SYSTEM MARKET, BY REGION, 2024–2032 (USD MILLION) 47
      1. NORTH AMERICA
        1. NORTH AMERICA: DYNAMIC POSITIONING SYSTEM MARKET, BY COUNTRY, 2024–2032
    36. (USD MILLION) 49
      1. NORTH AMERICA: DYNAMIC POSITIONING SYSTEM MARKET, BY
    37. SUBSYSTEM, 2024–2032 (USD MILLION) 49
      1. NORTH AMERICA: DYNAMIC POSITIONING
    38. SYSTEM MARKET, BY EQUIPMENT CLASS, 2024–2032 (USD MILLION) 50
    39. NORTH AMERICA: DYNAMIC POSITIONING SYSTEM MARKET, BY APPLICATION, 2024–2032
    40. (USD MILLION) 51
      1. US 51
        1. US: DYNAMIC POSITIONING SYSTEM
    41. MARKET, BY SUBSYSTEM, 2024–2032 (USD MILLION) 51
      1. US DYNAMIC
    42. POSITIONING SYSTEM MARKET, BY EQUIPMENT CLASS, 2024–2032 (USD MILLION) 51
      1. US DYNAMIC POSITIONING SYSTEM MARKET, BY APPLICATION, 2024–2032
    43. (USD MILLION) 52
      1. CANADA 52
        1. CANADA: DYNAMIC POSITIONING
    44. SYSTEM MARKET, BY SUBSYSTEM, 2024–2032 (USD MILLION) 52
      1. CANADA
    45. DYNAMIC POSITIONING SYSTEM MARKET, BY EQUIPMENT CLASS, 2024–2032 (USD MILLION)
      1. CANADA DYNAMIC POSITIONING SYSTEM MARKET, BY APPLICATION, 2024–2032
    46. (USD MILLION) 53
      1. EUROPE 54
        1. EUROPE: DYNAMIC POSITIONING SYSTEM
    47. MARKET, BY COUNTRY, 2024–2032 (USD MILLION) 55
      1. EUROPE: DYNAMIC
    48. POSITIONING SYSTEM MARKET, BY SUBSYSTEM, 2024–2032 (USD MILLION) 55
    49. EUROPE: DYNAMIC POSITIONING SYSTEM MARKET, BY EQUIPMENT CLASS, 2024–2032 (USD
    50. MILLION) 56
      1. EUROPE: DYNAMIC POSITIONING SYSTEM MARKET, BY APPLICATION,
    51. –2032 (USD MILLION) 57
      1. UK 57
        1. UK: DYNAMIC POSITIONING
    52. SYSTEM MARKET, BY SUBSYSTEM, 2024–2032 (USD MILLION) 57
      1. UK DYNAMIC
    53. POSITIONING SYSTEM MARKET, BY EQUIPMENT CLASS, 2024–2032 (USD MILLION) 57
      1. UK DYNAMIC POSITIONING SYSTEM MARKET, BY APPLICATION, 2024–2032
    54. (USD MILLION) 58
      1. RUSSIA 58
        1. RUSSIA: DYNAMIC POSITIONING
    55. SYSTEM MARKET, BY SUBSYSTEM, 2024–2032 (USD MILLION) 58
      1. RUSSIA
    56. DYNAMIC POSITIONING SYSTEM MARKET, BY EQUIPMENT CLASS, 2024–2032 (USD MILLION)
      1. RUSSIA DYNAMIC POSITIONING SYSTEM MARKET, BY APPLICATION, 2024–2032
    57. (USD MILLION) 59
      1. GERMANY 59
        1. GERMANY: DYNAMIC POSITIONING
    58. SYSTEM MARKET, BY SUBSYSTEM, 2024–2032 (USD MILLION) 59
      1. GERMANY
    59. DYNAMIC POSITIONING SYSTEM MARKET, BY EQUIPMENT CLASS, 2024–2032 (USD MILLION)
      1. GERMANY DYNAMIC POSITIONING SYSTEM MARKET, BY APPLICATION, 2024–2032
    60. (USD MILLION) 60
      1. FRANCE 60
        1. FRANCE: DYNAMIC POSITIONING
    61. SYSTEM MARKET, BY SUBSYSTEM, 2024–2032 (USD MILLION) 60
      1. FRANCE
    62. DYNAMIC POSITIONING SYSTEM MARKET, BY EQUIPMENT CLASS, 2024–2032 (USD MILLION)
      1. FRANCE DYNAMIC POSITIONING SYSTEM MARKET, BY APPLICATION, 2024–2032
    63. (USD MILLION) 61
      1. SPAIN 61
        1. SPAIN: DYNAMIC POSITIONING SYSTEM
    64. MARKET, BY SUBSYSTEM, 2024–2032 (USD MILLION) 61
      1. SPAIN DYNAMIC
    65. POSITIONING SYSTEM MARKET, BY EQUIPMENT CLASS, 2024–2032 (USD MILLION) 61
      1. SPAIN DYNAMIC POSITIONING SYSTEM MARKET, BY APPLICATION, 2024–2032
    66. (USD MILLION) 62
      1. ITALY 62
        1. ITALY: DYNAMIC POSITIONING
    67. SYSTEM MARKET, BY SUBSYSTEM, 2024–2032 (USD MILLION) 62
      1. ITALY
    68. DYNAMIC POSITIONING SYSTEM MARKET, BY EQUIPMENT CLASS, 2024–2032 (USD MILLION)
      1. ITALY DYNAMIC POSITIONING SYSTEM MARKET, BY APPLICATION, 2024–2032
    69. (USD MILLION) 63
      1. REST OF EUROPE 63
        1. REST OF EUROPE: DYNAMIC
    70. POSITIONING SYSTEM MARKET, BY SUBSYSTEM, 2024–2032 (USD MILLION) 63
    71. REST OF EUROPE DYNAMIC POSITIONING SYSTEM MARKET, BY EQUIPMENT CLASS, 2024–2032
    72. (USD MILLION) 63
      1. REST OF EUROPE DYNAMIC POSITIONING SYSTEM MARKET,
    73. BY APPLICATION, 2024–2032 (USD MILLION) 64
      1. ASIA-PACIFIC 65
    74. ASIA-PACIFIC: DYNAMIC POSITIONING SYSTEM MARKET, BY COUNTRY, 2024–2032 (USD
    75. MILLION) 66
      1. ASIA-PACIFIC: DYNAMIC POSITIONING SYSTEM MARKET, BY SUBSYSTEM,
    76. –2032 (USD MILLION) 66
      1. ASIA-PACIFIC: DYNAMIC POSITIONING SYSTEM
    77. MARKET, BY EQUIPMENT CLASS, 2024–2032 (USD MILLION) 67
      1. ASIA-PACIFIC:
    78. DYNAMIC POSITIONING SYSTEM MARKET, BY APPLICATION, 2024–2032 (USD MILLION)
      1. CHINA 68
        1. CHINA: DYNAMIC POSITIONING SYSTEM MARKET,
    79. BY SUBSYSTEM, 2024–2032 (USD MILLION) 68
      1. CHINA DYNAMIC POSITIONING
    80. SYSTEM MARKET, BY EQUIPMENT CLASS, 2024–2032 (USD MILLION) 68
    81. CHINA DYNAMIC POSITIONING SYSTEM MARKET, BY APPLICATION, 2024–2032 (USD MILLION)
      1. JAPAN 69
        1. JAPAN: DYNAMIC POSITIONING SYSTEM MARKET,
    82. BY SUBSYSTEM, 2024–2032 (USD MILLION) 69
      1. JAPAN DYNAMIC POSITIONING
    83. SYSTEM MARKET, BY EQUIPMENT CLASS, 2024–2032 (USD MILLION) 69
    84. JAPAN DYNAMIC POSITIONING SYSTEM MARKET, BY APPLICATION, 2024–2032 (USD MILLION)
      1. INDIA 70
        1. INDIA: DYNAMIC POSITIONING SYSTEM MARKET,
    85. BY SUBSYSTEM, 2024–2032 (USD MILLION) 70
      1. INDIA DYNAMIC POSITIONING
    86. SYSTEM MARKET, BY EQUIPMENT CLASS, 2024–2032 (USD MILLION) 70
    87. INDIA DYNAMIC POSITIONING SYSTEM MARKET, BY APPLICATION, 2024–2032 (USD MILLION)
      1. SOUTH KOREA 71
        1. SOUTH KOREA: DYNAMIC POSITIONING SYSTEM
    88. MARKET, BY SUBSYSTEM, 2024–2032 (USD MILLION) 71
      1. SOUTH KOREA
    89. DYNAMIC POSITIONING SYSTEM MARKET, BY EQUIPMENT CLASS, 2024–2032 (USD MILLION)
      1. SOUTH KOREA DYNAMIC POSITIONING SYSTEM MARKET, BY APPLICATION,
    90. –2032 (USD MILLION) 72
      1. REST OF ASIA-PACIFIC 72
    91. REST OF ASIA-PACIFIC: DYNAMIC POSITIONING SYSTEM MARKET, BY SUBSYSTEM, 2024–2032
    92. (USD MILLION) 72
      1. REST OF ASIA-PACIFIC DYNAMIC POSITIONING SYSTEM MARKET,
    93. BY EQUIPMENT CLASS, 2024–2032 (USD MILLION) 72
      1. REST OF ASIA-PACIFIC
    94. DYNAMIC POSITIONING SYSTEM MARKET, BY APPLICATION, 2024–2032 (USD MILLION)
      1. MIDDLE EAST & AFRICA 74
        1. MIDDLE EAST & AFRICA: DYNAMIC
    95. POSITIONING SYSTEM MARKET, BY COUNTRY, 2024–2032 (USD MILLION) 75
    96. MIDDLE EAST & AFRICA: DYNAMIC POSITIONING SYSTEM MARKET, BY SUBSYSTEM, 2024–2032
    97. (USD MILLION) 75
      1. MIDDLE EAST & AFRICA: DYNAMIC POSITIONING SYSTEM
    98. MARKET, BY EQUIPMENT CLASS, 2024–2032 (USD MILLION) 76
      1. MIDDLE
    99. EAST & AFRICA: DYNAMIC POSITIONING SYSTEM MARKET, BY APPLICATION, 2024–2032
    100. (USD MILLION) 77
      1. GCC COUNTRIES 77
        1. GCC COUNTRIES: DYNAMIC
    101. POSITIONING SYSTEM MARKET, BY SUBSYSTEM, 2024–2032 (USD MILLION) 77
    102. GCC COUNTRIES DYNAMIC POSITIONING SYSTEM MARKET, BY EQUIPMENT CLASS, 2024–2032
    103. (USD MILLION) 77
      1. GCC COUNTRIES DYNAMIC POSITIONING SYSTEM MARKET,
    104. BY APPLICATION, 2024–2032 (USD MILLION) 78
      1. SOUTH AFRICA 78
        1. SOUTH AFRICA: DYNAMIC POSITIONING SYSTEM MARKET, BY SUBSYSTEM, 2024–2032
    105. (USD MILLION) 78
      1. SOUTH AFRICA DYNAMIC POSITIONING SYSTEM MARKET, BY
    106. EQUIPMENT CLASS, 2024–2032 (USD MILLION) 78
      1. SOUTH AFRICA DYNAMIC
    107. POSITIONING SYSTEM MARKET, BY APPLICATION, 2024–2032 (USD MILLION) 79
    108. REST OF MIDDLE EAST & AFRICA 79
      1. REST OF MIDDLE EAST & AFRICA:
    109. DYNAMIC POSITIONING SYSTEM MARKET, BY SUBSYSTEM, 2024–2032 (USD MILLION) 79
      1. REST OF MIDDLE EAST & AFRICA DYNAMIC POSITIONING SYSTEM MARKET, BY
    110. EQUIPMENT CLASS, 2024–2032 (USD MILLION) 79
      1. REST OF MIDDLE EAST
    111. & AFRICA DYNAMIC POSITIONING SYSTEM MARKET, BY APPLICATION, 2024–2032
    112. (USD MILLION) 80
      1. LATIN AMERICA 81
        1. LATIN AMERICA: DYNAMIC POSITIONING
    113. SYSTEM MARKET, BY COUNTRY, 2024–2032 (USD MILLION) 82
      1. LATIN AMERICA:
    114. DYNAMIC POSITIONING SYSTEM MARKET, BY SUBSYSTEM, 2024–2032 (USD MILLION) 82
      1. LATIN AMERICA: DYNAMIC POSITIONING SYSTEM MARKET, BY EQUIPMENT CLASS, 2024–2032
    115. (USD MILLION) 83
      1. LATIN AMERICA: DYNAMIC POSITIONING SYSTEM MARKET, BY
    116. APPLICATION, 2024–2032 (USD MILLION) 84
      1. BRAZIL 84
    117. BRAZIL: DYNAMIC POSITIONING SYSTEM MARKET, BY SUBSYSTEM, 2024–2032 (USD MILLION)
      1. BRAZIL DYNAMIC POSITIONING SYSTEM MARKET, BY EQUIPMENT CLASS, 2024–2032
    118. (USD MILLION) 84
      1. BRAZIL DYNAMIC POSITIONING SYSTEM MARKET, BY APPLICATION,
    119. –2032 (USD MILLION) 85
      1. MEXICO 85
        1. MEXICO: DYNAMIC
    120. POSITIONING SYSTEM MARKET, BY SUBSYSTEM, 2024–2032 (USD MILLION) 85
    121. MEXICO DYNAMIC POSITIONING SYSTEM MARKET, BY EQUIPMENT CLASS, 2024–2032 (USD
    122. MILLION) 85
      1. MEXICO DYNAMIC POSITIONING SYSTEM MARKET, BY APPLICATION,
    123. –2032 (USD MILLION) 86
      1. ARGENTINA 86
        1. ARGENTINA:
    124. DYNAMIC POSITIONING SYSTEM MARKET, BY SUBSYSTEM, 2024–2032 (USD MILLION) 86
      1. ARGENTINA DYNAMIC POSITIONING SYSTEM MARKET, BY EQUIPMENT CLASS, 2024–2032
    125. (USD MILLION) 86
      1. ARGENTINA DYNAMIC POSITIONING SYSTEM MARKET, BY APPLICATION,
    126. –2032 (USD MILLION) 87
      1. REST OF LATIN AMERICA 87
    127. REST OF LATIN AMERICA: DYNAMIC POSITIONING SYSTEM MARKET, BY SUBSYSTEM, 2024–2032
    128. (USD MILLION) 87
      1. REST OF LATIN AMERICA DYNAMIC POSITIONING SYSTEM
    129. MARKET, BY EQUIPMENT CLASS, 2024–2032 (USD MILLION) 87
      1. REST
    130. OF LATIN AMERICA DYNAMIC POSITIONING SYSTEM MARKET, BY APPLICATION, 2024–2032
    131. (USD MILLION) 88
    132. COMPETITIVE LANDSCAPE 89
      1. OVERVIEW 89
    133. COMPETITIVE BENCHMARKING 90
      1. MARKET SHARE ANALYSIS 91
      2. KEY DEVELOPMENT
    134. IN THE GLOBAL DYNAMIC POSITIONING SYSTEM MARKET 91
      1. PRODUCT LAUNCHES/SERVICE
        1. MERGERS & ACQUISITIONS 92
        2. CONTRACTS & AGREEMENTS
        3. EXPANSIONS/ JOINT VENTURE & INVESTMENTS 93
        4. PARTNERSHIP
    135. & COLABORATION 93
    136. COMPANY PROFILE 96
      1. GENERAL ELECTRIC 96
        1. COMPANY OVERVIEW 96
        2. FINANCIAL OVERVIEW 97
        3. PRODUCTS
    137. OFFERED 97
      1. KEY DEVELOPMENTSS 98
        1. SWOT ANALYSIS 98
    138. KEY STRATEGIES 99
      1. ABB LTD. 100
        1. COMPANY OVERVIEW 100
    139. FINANCIAL OVERVIEW 101
      1. PRODUCTS OFFERED 101
        1. KEY DEVELOPMENTS
        2. SWOT ANALYSIS 103
        3. KEY STRATEGIES 103
      2. L3HARRIS
    140. TECHNOLOGIES, INC. 104
      1. COMPANY OVERVIEW 104
        1. FINANCIAL OVERVIEW
        2. PRODUCTS OFFERED 105
        3. KEY DEVELOPMENTS 105
    141. SWOT ANALYSIS 106
      1. KEY STRATEGIES 106
      2. KONGSBERG MARITIME 107
        1. COMPANY OVERVIEW 107
        2. FINANCIAL OVERVIEW 108
        3. PRODUCTS
    142. OFFERED 108
      1. KEY DEVELOPMENTS 109
        1. SWOT ANALYSIS 110
    143. KEY STRATEGIES 110
      1. WÄRTSILÄ 111
        1. COMPANY OVERVIEW
        2. FINANCIAL OVERVIEW 112
        3. PRODUCTS OFFERED 113
    144. KEY DEVELOPMENTS 113
      1. SWOT ANALYSIS 114
        1. KEY STRATEGIES 114
      2. MARINE TECHNOLOGIES, LLC 115
        1. COMPANY OVERVIEW 115
    145. FINANCIAL OVERVIEW 115
      1. PRODUCTS OFFERED 115
        1. KEY DEVELOPMENTS
        2. SWOT ANALYSIS 116
        3. KEY STRATEGIES 116
      2. NAVIS
    146. ENGINEERING 117
      1. COMPANY OVERVIEW 117
        1. FINANCIAL OVERVIEW
        2. PRODUCTS OFFERED 117
        3. KEY DEVELOPMENTS 118
    147. SWOT ANALYSIS 119
      1. KEY STRATEGIES 119
      2. ROLLS-ROYCE HOLDINGS
    148. PLC 120
      1. COMPANY OVERVIEW 120
        1. FINANCIAL OVERVIEW 121
    149. PRODUCTS OFFERED 121
      1. KEY DEVELOPMENTS 122
        1. SWOT ANALYSIS
        2. KEY STRATEGIES 123
      2. NORR SYSTEMS HYDRAULICS PTE LTD 124
        1. COMPANY OVERVIEW 124
        2. FINANCIAL OVERVIEW 124
        3. PRODUCTS
    150. OFFERED 124
      1. KEY DEVELOPMENTS 125
        1. SWOT ANALYSIS 125
    151. BOSCH REXROTH AG (BOSCH GROUP) 126
      1. COMPANY OVERVIEW 126
    152. FINANCIAL OVERVIEW 127
      1. PRODUCTS OFFERED 127
        1. KEY DEVELOPMENTS
        2. SWOT ANALYSIS 128
        3. KEY STRATEGIES 129
    153. SYSTEM INSTALLATION, 2024–2023 (UNITS) 33
    154. SYSTEM MARKET, BY SUBSYSTEM, 2024–2032 (USD MILLION) 39
    155. DYNAMIC POSITIONING SYSTEM MARKET, BY EQUIPMENT CLASS, 2024–2032 (USD MILLION)
    156. (USD MILLION) 44
    157. –2032 (USD MILLION) 47
    158. SYSTEM MARKET, BY COUNTRY, 2024–2032 (USD MILLION) 49
    159. DYNAMIC POSITIONING SYSTEM MARKET, BY SUBSYSTEM, 2024–2032 (USD MILLION) 49
    160. (USD MILLION) 50
    161. BY APPLICATION, 2024–2032 (USD MILLION) 51
    162. SYSTEM MARKET, BY SUBSYSTEM, 2024–2032 (USD MILLION) 51
    163. POSITIONING SYSTEM MARKET, BY EQUIPMENT CLASS, 2024–2032 (USD MILLION) 51
    164. (USD MILLION) 52
    165. –2032 (USD MILLION) 52
    166. MARKET, BY EQUIPMENT CLASS, 2024–2032 (USD MILLION) 52
    167. DYNAMIC POSITIONING SYSTEM MARKET, BY APPLICATION, 2024–2032 (USD MILLION)
    168. (USD MILLION) 55
    169. –2032 (USD MILLION) 55
    170. MARKET, BY EQUIPMENT CLASS, 2024–2032 (USD MILLION) 56
    171. DYNAMIC POSITIONING SYSTEM MARKET, BY APPLICATION, 2024–2032 (USD MILLION)
    172. (USD MILLION) 57
    173. CLASS, 2024–2032 (USD MILLION) 57
    174. MARKET, BY APPLICATION, 2024–2032 (USD MILLION) 58
    175. POSITIONING SYSTEM MARKET, BY SUBSYSTEM, 2024–2032 (USD MILLION) 58
    176. RUSSIA DYNAMIC POSITIONING SYSTEM MARKET, BY EQUIPMENT CLASS, 2024–2032
    177. (USD MILLION) 58
    178. –2032 (USD MILLION) 59
    179. MARKET, BY SUBSYSTEM, 2024–2032 (USD MILLION) 59
    180. POSITIONING SYSTEM MARKET, BY EQUIPMENT CLASS, 2024–2032 (USD MILLION) 59
    181. (USD MILLION) 60
    182. –2032 (USD MILLION) 60
    183. MARKET, BY EQUIPMENT CLASS, 2024–2032 (USD MILLION) 60
    184. DYNAMIC POSITIONING SYSTEM MARKET, BY APPLICATION, 2024–2032 (USD MILLION)
    185. (USD MILLION) 61
    186. CLASS, 2024–2032 (USD MILLION) 61
    187. SYSTEM MARKET, BY APPLICATION, 2024–2032 (USD MILLION) 62
    188. DYNAMIC POSITIONING SYSTEM MARKET, BY SUBSYSTEM, 2024–2032 (USD MILLION) 62
    189. (USD MILLION) 62
    190. –2032 (USD MILLION) 63
    191. SYSTEM MARKET, BY SUBSYSTEM, 2024–2032 (USD MILLION) 63
    192. OF EUROPE DYNAMIC POSITIONING SYSTEM MARKET, BY EQUIPMENT CLASS, 2024–2032
    193. (USD MILLION) 63
    194. BY APPLICATION, 2024–2032 (USD MILLION) 64
    195. POSITIONING SYSTEM MARKET, BY COUNTRY, 2024–2032 (USD MILLION) 66
    196. ASIA-PACIFIC DYNAMIC POSITIONING SYSTEM MARKET, BY SUBSYSTEM, 2024–2032
    197. (USD MILLION) 66
    198. EQUIPMENT CLASS, 2024–2032 (USD MILLION) 67
    199. POSITIONING SYSTEM MARKET, BY APPLICATION, 2024–2032 (USD MILLION) 68
    200. CHINA DYNAMIC POSITIONING SYSTEM MARKET, BY SUBSYSTEM, 2024–2032 (USD MILLION)
    201. (USD MILLION) 68
    202. –2032 (USD MILLION) 69
    203. MARKET, BY SUBSYSTEM, 2024–2032 (USD MILLION) 69
    204. POSITIONING SYSTEM MARKET, BY EQUIPMENT CLASS, 2024–2032 (USD MILLION) 69
    205. (USD MILLION) 70
    206. –2032 (USD MILLION) 70
    207. MARKET, BY EQUIPMENT CLASS, 2024–2032 (USD MILLION) 70
    208. DYNAMIC POSITIONING SYSTEM MARKET, BY APPLICATION, 2024–2032 (USD MILLION)
    209. (USD MILLION) 71
    210. EQUIPMENT CLASS, 2024–2032 (USD MILLION) 71
    211. POSITIONING SYSTEM MARKET, BY APPLICATION, 2024–2032 (USD MILLION) 72
    212. REST OF ASIA-PACIFIC DYNAMIC POSITIONING SYSTEM MARKET, BY SUBSYSTEM, 2024–2032
    213. (USD MILLION) 72
    214. BY EQUIPMENT CLASS, 2024–2032 (USD MILLION) 72
    215. DYNAMIC POSITIONING SYSTEM MARKET, BY APPLICATION, 2024–2032 (USD MILLION)
    216. COUNTRY, 2024–2032 (USD MILLION) 75
    217. DYNAMIC POSITIONING SYSTEM MARKET, BY SUBSYSTEM, 2024–2032 (USD MILLION) 75
    218. CLASS, 2024–2032 (USD MILLION) 76
    219. POSITIONING SYSTEM MARKET, BY APPLICATION, 2024–2032 (USD MILLION) 77
    220. GCC COUNTRIES DYNAMIC POSITIONING SYSTEM MARKET, BY SUBSYSTEM, 2024–2032
    221. (USD MILLION) 77
    222. BY EQUIPMENT CLASS, 2024–2032 (USD MILLION) 77
    223. DYNAMIC POSITIONING SYSTEM MARKET, BY APPLICATION, 2024–2032 (USD MILLION)
    224. (USD MILLION) 78
    225. EQUIPMENT CLASS, 2024–2032 (USD MILLION) 78
    226. POSITIONING SYSTEM MARKET, BY APPLICATION, 2024–2032 (USD MILLION) 79
    227. REST OF MIDDLE EAST & AFRICA DYNAMIC POSITIONING SYSTEM MARKET, BY SUBSYSTEM,
    228. –2032 (USD MILLION) 79
    229. DYNAMIC POSITIONING SYSTEM MARKET, BY EQUIPMENT CLASS, 2024–2032 (USD MILLION)
    230. BY APPLICATION, 2024–2032 (USD MILLION) 80
    231. POSITIONING SYSTEM MARKET, BY COUNTRY, 2024–2032 (USD MILLION) 82
    232. LATIN AMERICA DYNAMIC POSITIONING SYSTEM MARKET, BY SUBSYSTEM, 2024–2032
    233. (USD MILLION) 82
    234. BY EQUIPMENT CLASS, 2024–2032 (USD MILLION) 83
    235. DYNAMIC POSITIONING SYSTEM MARKET, BY APPLICATION, 2024–2032 (USD MILLION)
    236. (USD MILLION) 84
    237. CLASS, 2024–2032 (USD MILLION) 84
    238. SYSTEM MARKET, BY APPLICATION, 2024–2032 (USD MILLION) 85
    239. DYNAMIC POSITIONING SYSTEM MARKET, BY SUBSYSTEM, 2024–2032 (USD MILLION) 85
    240. (USD MILLION) 85
    241. –2032 (USD MILLION) 86
    242. MARKET, BY SUBSYSTEM, 2024–2032 (USD MILLION) 86
    243. POSITIONING SYSTEM MARKET, BY EQUIPMENT CLASS, 2024–2032 (USD MILLION) 86
    244. (USD MILLION) 87
    245. MARKET, BY SUBSYSTEM, 2024–2032 (USD MILLION) 87
    246. AMERICA DYNAMIC POSITIONING SYSTEM MARKET, BY EQUIPMENT CLASS, 2024–2032 (USD
    247. MILLION) 87
    248. BY APPLICATION, 2024–2032 (USD MILLION) 88
    249. & COLABORATION 93
    250. GENERAL ELECTRIC: KEY DEVELOPMENTS 98
    251. INC.: PRODUCTS OFFERED 105
    252. KONGSBERG MARITIME: PRODUCTS OFFERED 108
    253. KEY DEVELOPMENTS 109
    254. LLC: PRODUCTS OFFERED 115
    255. PLC: PRODUCTS OFFERED 121
    256. BOSCH REXROTH AG (BOSCH GROUP): PRODUCTS OFFERED 127
    257. AG (BOSCH GROUP): KEY DEVELOPMENTS 128
    258. OF THE GLOBAL DYNAMIC POSITIONING SYSTEM MARKET 28
    259. MARKET: VALUE CHAIN 34
    260. POSITIONING MARKET 35
    261. SUBSYSTEM, 2022 (% SHARE) 38
    262. BY SUBSYSTEM, 2022 VS 2032 (USD MILLION) 38
    263. SYSTEM MARKET, BY EQUIPMENT CLASS, 2022 (% SHARE) 41
    264. POSITIONING SYSTEM MARKET, BY EQUIPMENT CLASS, 2022 VS 2032 (USD MILLION) 41
    265. VS 2032 (USD MILLION) 43
    266. BY REGION, 2022 (% SHARE) 46
    267. BY REGION, 2024–2032 (USD MILLION) 46
    268. POSITIONING SYSTEM MARKET, BY COUNTRY, 2022 (% SHARE) 48
    269. DYNAMIC POSITIONING SYSTEM MARKET, BY COUNTRY, 2024–2032 (USD MILLION) 48
    270. (USD MILLION) 49
    271. BY EQUIPMENT CLASS, 2024–2032 (USD MILLION) 50
    272. DYNAMIC POSITIONING SYSTEM MARKET, BY APPLICATION, 2024–2032 (USD MILLION)
    273. SHARE) 54
    274. (USD MILLION) 54
    275. –2032 (USD MILLION) 55
    276. MARKET, BY EQUIPMENT CLASS, 2024–2032 (USD MILLION) 56
    277. DYNAMIC POSITIONING SYSTEM MARKET, BY APPLICATION, 2024–2032 (USD MILLION)
    278. (% SHARE) 65
    279. –2032 (USD MILLION) 65
    280. SYSTEM MARKET, BY SUBSYSTEM, 2024–2032 (USD MILLION) 66
    281. DYNAMIC POSITIONING SYSTEM MARKET, BY EQUIPMENT CLASS, 2024–2032 (USD MILLION)
    282. –2032 (USD MILLION) 67
    283. POSITIONING SYSTEM MARKET, BY COUNTRY, 2022 (% SHARE) 74
    284. & AFRICA DYNAMIC POSITIONING SYSTEM MARKET, BY COUNTRY, 2024–2032 (USD
    285. MILLION) 74
    286. BY SUBSYSTEM, 2024–2032 (USD MILLION) 75
    287. AFRICA DYNAMIC POSITIONING SYSTEM MARKET, BY EQUIPMENT CLASS, 2024–2032 (USD
    288. MILLION) 76
    289. BY APPLICATION, 2024–2032 (USD MILLION) 76
    290. POSITIONING SYSTEM MARKET, BY COUNTRY, 2022 (% SHARE) 81
    291. DYNAMIC POSITIONING SYSTEM MARKET, BY COUNTRY, 2024–2032 (USD MILLION) 81
    292. (USD MILLION) 82
    293. BY EQUIPMENT CLASS, 2024–2032 (USD MILLION) 83
    294. DYNAMIC POSITIONING SYSTEM MARKET, BY APPLICATION, 2024–2032 (USD MILLION)
    295. POSITIONING SYSTEM MARKET SHARE ANALYSIS, 2022% 91
    296. FINANCIAL OVERVIEW SNAPSHOT 97
    297. ANALYSIS 103
    298. KONGSBERG MARITIME: FINANCIAL OVERVIEW SNAPSHOT 108
    299. SWOT ANALYSIS 110
    300. LLC: SWOT ANALYSIS 116
    301. ROLLS-ROYCE HOLDINGS PLC: FINANCIAL OVERVIEW SNAPSHOT 121
    302. HOLDINGS PLC: SWOT ANALYSIS 123
    303. SWOT ANALYSIS 125
    304. SNAPSHOT 127

    Dynamic Positioning System Market Segmentation

    • Global Digital Payment, By Subsystem Outlook (USD Billion, 2018-2032)
      • Control System
      • Thruster System
      • Power System
      • Others
    • Global Digital Payment, By Equipment Class Outlook (USD Billion, 2018-2032)
      • Class 1
      • Class 2
      • Class 3
    • Global Digital Payment, By Application Outlook (USD Billion, 2018-2032)
      • Merchant Vessels
      • Passenger Vessels
      • Naval Vessels
      • Offshore Vessels

    Global Digital Payment Regional Outlook (USD Billion, 2018-2032)

    • North America Outlook (USD Billion, 2018-2032)
    • North America Digital Payment, By Subsystem Outlook (USD Billion, 2018-2032)
      • Control System
      • Thruster System
      • Power System
      • Others
    • North America Digital Payment, By Equipment Class Outlook (USD Billion, 2018-2032)
      • Class 1
      • Class 2
      • Class 3
    • North America Digital Payment, By Application Outlook (USD Billion, 2018-2032)
      • Merchant Vessels
      • Passenger Vessels
      • Naval Vessels
      • Offshore Vessels


    • US Outlook (USD Billion, 2018-2032)
    • US Digital Payment, By Subsystem Outlook (USD Billion, 2018-2032)
      • Control System
      • Thruster System
      • Power System
      • Others
    • US Digital Payment, By Equipment Class Outlook (USD Billion, 2018-2032)
      • Class 1
      • Class 2
      • Class 3
    • US Digital Payment, By Application Outlook (USD Billion, 2018-2032)
      • Merchant Vessels
      • Passenger Vessels
      • Naval Vessels
      • Offshore Vessels
    • Canada Outlook (USD Billion, 2018-2032)
    • Canada Digital Payment, By Subsystem Outlook (USD Billion, 2018-2032)
      • Control System
      • Thruster System
      • Power System
      • Others
    • Canada Digital Payment, By Equipment Class Outlook (USD Billion, 2018-2032)
      • Class 1
      • Class 2
      • Class 3
    • Canada Digital Payment, By Application Outlook (USD Billion, 2018-2032)
      • Merchant Vessels
      • Passenger Vessels
      • Naval Vessels
      • Offshore Vessels
    • Europe Outlook (USD Billion, 2018-2032)
    • Europe Digital Payment, By Subsystem Outlook (USD Billion, 2018-2032)
      • Control System
      • Thruster System
      • Power System
      • Others
    • Europe Digital Payment, By Equipment Class Outlook (USD Billion, 2018-2032)
      • Class 1
      • Class 2
      • Class 3
    • Europe Digital Payment, By Application Outlook (USD Billion, 2018-2032)
      • Merchant Vessels
      • Passenger Vessels
      • Naval Vessels
      • Offshore Vessels
      • Germany Outlook (USD Billion, 2018-2032)
      • Germany Digital Payment, By Subsystem Outlook (USD Billion, 2018-2032)
        • Control System
        • Thruster System
        • Power System
        • Others
      • Germany Digital Payment, By Equipment Class Outlook (USD Billion, 2018-2032)
        • Class 1
        • Class 2
        • Class 3
      • Germany Digital Payment, By Application Outlook (USD Billion, 2018-2032)
        • Merchant Vessels
        • Passenger Vessels
        • Naval Vessels
        • Offshore Vessels
      • France Outlook (USD Billion, 2018-2032)
      • France Digital Payment, By Subsystem Outlook (USD Billion, 2018-2032)
        • Control System
        • Thruster System
        • Power System
        • Others
      • France Digital Payment, By Equipment Class Outlook (USD Billion, 2018-2032)
        • Class 1
        • Class 2
        • Class 3
      • France Digital Payment, By Application Outlook (USD Billion, 2018-2032)
        • Merchant Vessels
        • Passenger Vessels
        • Naval Vessels
        • Offshore Vessels
      • UK Outlook (USD Billion, 2018-2032)
      • UK Digital Payment, By Subsystem Outlook (USD Billion, 2018-2032)
        • Control System
        • Thruster System
        • Power System
        • Others
      • UK Digital Payment, By Equipment Class Outlook (USD Billion, 2018-2032)
        • Class 1
        • Class 2
        • Class 3
      • UK Digital Payment, By Application Outlook (USD Billion, 2018-2032)
        • Merchant Vessels
        • Passenger Vessels
        • Naval Vessels
        • Offshore Vessels
      • RUSSIA Outlook (USD Billion, 2018-2032)
      • RUSSIA Digital Payment, By Subsystem Outlook (USD Billion, 2018-2032)
        • Control System
        • Thruster System
        • Power System
        • Others
      • RUSSIA Digital Payment, By Equipment Class Outlook (USD Billion, 2018-2032)
        • Class 1
        • Class 2
        • Class 3
      • RUSSIA Digital Payment, By Application Outlook (USD Billion, 2018-2032)
        • Merchant Vessels
        • Passenger Vessels
        • Naval Vessels
        • Offshore Vessels
      • SPAIN Outlook (USD Billion, 2018-2032)
      • SPAIN Digital Payment, By Subsystem Outlook (USD Billion, 2018-2032)
        • Control System
        • Thruster System
        • Power System
        • Others
      • SPAIN Digital Payment, By Equipment Class Outlook (USD Billion, 2018-2032)
        • Class 1
        • Class 2
        • Class 3
      • SPAIN Digital Payment, By Application Outlook (USD Billion, 2018-2032)
        • Merchant Vessels
        • Passenger Vessels
        • Naval Vessels
        • Offshore Vessels
      • ITALY Outlook (USD Billion, 2018-2032)
      • ITALY Digital Payment, By Subsystem Outlook (USD Billion, 2018-2032)
        • Control System
        • Thruster System
        • Power System
        • Others
      • ITALY Digital Payment, By Equipment Class Outlook (USD Billion, 2018-2032)
        • Class 1
        • Class 2
        • Class 3
      • ITALY Digital Payment, By Application Outlook (USD Billion, 2018-2032)
        • Merchant Vessels
        • Passenger Vessels
        • Naval Vessels
        • Offshore Vessels
      • Rest of Europe Outlook (USD Billion, 2018-2032)
      • Rest of Europe Digital Payment, By Subsystem Outlook (USD Billion, 2018-2032)
        • Control System
        • Thruster System
        • Power System
        • Others
      • Rest of Europe Digital Payment, By Equipment Class Outlook (USD Billion, 2018-2032)
        • Class 1
        • Class 2
        • Class 3
      • Rest of Europe Digital Payment, By Application Outlook (USD Billion, 2018-2032)
        • Merchant Vessels
        • Passenger Vessels
        • Naval Vessels
        • Offshore Vessels
      • Asia-Pacific Outlook (USD Billion, 2018-2032)
      • Asia-Pacific Digital Payment, By Subsystem Outlook (USD Billion, 2018-2032)
        • Control System
        • Thruster System
        • Power System
        • Others
      • Asia-Pacific Digital Payment, By Equipment Class Outlook (USD Billion, 2018-2032)
        • Class 1
        • Class 2
        • Class 3
      • Asia-Pacific Digital Payment, By Application Outlook (USD Billion, 2018-2032)
        • Merchant Vessels
        • Passenger Vessels
        • Naval Vessels
        • Offshore Vessels
        • China Outlook (USD Billion, 2018-2032)
        • China Digital Payment, By Subsystem Outlook (USD Billion, 2018-2032)
          • Control System
          • Thruster System
          • Power System
          • Others
        • China Digital Payment, By Equipment Class Outlook (USD Billion, 2018-2032)
          • Class 1
          • Class 2
          • Class 3
        • China Digital Payment, By Application Outlook (USD Billion, 2018-2032)
          • Merchant Vessels
          • Passenger Vessels
          • Naval Vessels
          • Offshore Vessels
        • Japan Outlook (USD Billion, 2018-2032)
        • Japan Digital Payment, By Subsystem Outlook (USD Billion, 2018-2032)
          • Control System
          • Thruster System
          • Power System
          • Others
        • Japan Digital Payment, By Equipment Class Outlook (USD Billion, 2018-2032)
          • Class 1
          • Class 2
          • Class 3
        • Japan Digital Payment, By Application Outlook (USD Billion, 2018-2032)
          • Merchant Vessels
          • Passenger Vessels
          • Naval Vessels
          • Offshore Vessels
        • India Outlook (USD Billion, 2018-2032)
        • India Digital Payment, By Subsystem Outlook (USD Billion, 2018-2032)
          • Control System
          • Thruster System
          • Power System
          • Others
        • India Digital Payment, By Equipment Class Outlook (USD Billion, 2018-2032)
          • Class 1
          • Class 2
          • Class 3
        • India Digital Payment, By Application Outlook (USD Billion, 2018-2032)
          • Merchant Vessels
          • Passenger Vessels
          • Naval Vessels
          • Offshore Vessels
        • South Korea Outlook (USD Billion, 2018-2032)
        • South Korea Digital Payment, By Subsystem Outlook (USD Billion, 2018-2032)
          • Control System
          • Thruster System
          • Power System
          • Others
        • South Korea Digital Payment, By Equipment Class Outlook (USD Billion, 2018-2032)
          • Class 1
          • Class 2
          • Class 3
        • South Korea Digital Payment, By Application Outlook (USD Billion, 2018-2032)
          • Merchant Vessels
          • Passenger Vessels
          • Naval Vessels
          • Offshore Vessels
        • Rest of Asia Pacific Outlook (USD Billion, 2018-2032)
        • Rest of Asia Pacific Digital Payment, By Subsystem Outlook (USD Billion, 2018-2032)
          • Control System
          • Thruster System
          • Power System
          • Others
        • Rest of Asia Pacific Digital Payment, By Equipment Class Outlook (USD Billion, 2018-2032)
          • Class 1
          • Class 2
          • Class 3
        • Rest of Asia Pacific Digital Payment, By Application Outlook (USD Billion, 2018-2032)
          • Merchant Vessels
          • Passenger Vessels
          • Naval Vessels
          • Offshore Vessels
        • Middle East & Africa Outlook (USD Billion, 2018-2032)
        • Middle East & Africa Digital Payment, By Subsystem Outlook (USD Billion, 2018-2032)
          • Control System
          • Thruster System
          • Power System
          • Others
        • Middle East & Africa Digital Payment, By Equipment Class Outlook (USD Billion, 2018-2032)
          • Class 1
          • Class 2
          • Class 3
        • Middle East & Africa Digital Payment, By Application Outlook (USD Billion, 2018-2032)
          • Merchant Vessels
          • Passenger Vessels
          • Naval Vessels
          • Offshore Vessels
          • GCC Countries Outlook (USD Billion, 2018-2032)
          • GCC Countries Digital Payment, By Subsystem Outlook (USD Billion, 2018-2032)
            • Control System
            • Thruster System
            • Power System
            • Others
          • GCC Countries Digital Payment, By Equipment Class Outlook (USD Billion, 2018-2032)
            • Class 1
            • Class 2
            • Class 3
          • GCC Countries Digital Payment, By Application Outlook (USD Billion, 2018-2032)
            • Merchant Vessels
            • Passenger Vessels
            • Naval Vessels
            • Offshore Vessels


    • South Africa Outlook (USD Billion, 2018-2032)
    • South Africa Digital Payment, By Subsystem Outlook (USD Billion, 2018-2032)
      • Control System
      • Thruster System
      • Power System
      • Others
    • South Africa Digital Payment, By Equipment Class Outlook (USD Billion, 2018-2032)
      • Class 1
      • Class 2
      • Class 3
    • South Africa Digital Payment, By Application Outlook (USD Billion, 2018-2032)
      • Merchant Vessels
      • Passenger Vessels
      • Naval Vessels
      • Offshore Vessels
    • Rest of Middle East & Africa Outlook (USD Billion, 2018-2032)
    • Rest of Middle East & Africa Digital Payment, By Subsystem Outlook (USD Billion, 2018-2032)
      • Control System
      • Thruster System
      • Power System
      • Others
    • Rest of Middle East & Africa Digital Payment, By Equipment Class Outlook (USD Billion, 2018-2032)
      • Class 1
      • Class 2
      • Class 3
    • Rest of Middle East & Africa Digital Payment, By Application Outlook (USD Billion, 2018-2032)
      • Merchant Vessels
      • Passenger Vessels
      • Naval Vessels
      • Offshore Vessels
    • Latin America Outlook (USD Billion, 2018-2032)
    • Latin America Digital Payment, By Subsystem Outlook (USD Billion, 2018-2032)
      • Control System
      • Thruster System
      • Power System
      • Others
    • Latin America Digital Payment, By Equipment Class Outlook (USD Billion, 2018-2032)
      • Class 1
      • Class 2
      • Class 3
    • Latin America Digital Payment, By Application Outlook (USD Billion, 2018-2032)
      • Merchant Vessels
      • Passenger Vessels
      • Naval Vessels
      • Offshore Vessels
      • Brazil Outlook (USD Billion, 2018-2032)
      • Brazil Digital Payment, By Subsystem Outlook (USD Billion, 2018-2032)
        • Control System
        • Thruster System
        • Power System
        • Others
      • Brazil Digital Payment, By Equipment Class Outlook (USD Billion, 2018-2032)
        • Class 1
        • Class 2
        • Class 3
      • Brazil Digital Payment, By Application Outlook (USD Billion, 2018-2032)
        • Merchant Vessels
        • Passenger Vessels
        • Naval Vessels
        • Offshore Vessels
      • Mexico Outlook (USD Billion, 2018-2032)
      • Mexico Digital Payment, By Subsystem Outlook (USD Billion, 2018-2032)
        • Control System
        • Thruster System
        • Power System
        • Others
      • Mexico Digital Payment, By Equipment Class Outlook (USD Billion, 2018-2032)
        • Class 1
        • Class 2
        • Class 3
      • Mexico Digital Payment, By Application Outlook (USD Billion, 2018-2032)
        • Merchant Vessels
        • Passenger Vessels
        • Naval Vessels
        • Offshore Vessels


    • Argentina Outlook (USD Billion, 2018-2032)
    • Argentina Digital Payment, By Subsystem Outlook (USD Billion, 2018-2032)
      • Control System
      • Thruster System
      • Power System
      • Others
    • Argentina Digital Payment, By Equipment Class Outlook (USD Billion, 2018-2032)
      • Class 1
      • Class 2
      • Class 3
    • Argentina Digital Payment, By Application Outlook (USD Billion, 2018-2032)
      • Merchant Vessels
      • Passenger Vessels
      • Naval Vessels
      • Offshore Vessels
    • Rest of Latin America Outlook (USD Billion, 2018-2032)
    • Rest of Latin America Digital Payment, By Subsystem Outlook (USD Billion, 2018-2032)
      • Control System
      • Thruster System
      • Power System
      • Others
    • Rest of Latin America Digital Payment, By Equipment Class Outlook (USD Billion, 2018-2032)
      • Class 1
      • Class 2
      • Class 3
    • Rest of Latin America Digital Payment, By Application Outlook (USD Billion, 2018-2032)
      • Merchant Vessels
      • Passenger Vessels
      • Naval Vessels
      • Offshore Vessels
    Dynamic Positioning System Market Research Report - Global Forecast till 2032 Infographic
    Free Sample Request

    Kindly complete the form below to receive a free sample of this Report

    Customer Strories

    “I am very pleased with how market segments have been defined in a relevant way for my purposes (such as "Portable Freezers & refrigerators" and "last-mile"). In general the report is well structured. Thanks very much for your efforts.”

    Victoria Milne Founder
    Case Study

    Chemicals and Materials