• Cat-intel
  • MedIntelliX
  • Resources
  • About Us
  • Request Free Sample ×

    Kindly complete the form below to receive a free sample of this Report

    Leading companies partner with us for data-driven Insights

    clients tt-cursor

    Data Collection and Labelling Market

    ID: MRFR/ICT/14688-CR
    128 Pages
    Aarti Dhapte
    September 2024

    Data Collection and Labelling Market Research Report By Data Type (Text, Image/ Video and Audio), by Vertical (IT, Automotive, Government, Healthcare, BFSI, Retail & E-commerce, and Others), and By Region (North America, Europe, Asia-Pacific, Middle East and Africa, South America) –Market Forecast Till 2032

    Share:
    Download PDF ×

    We do not share your information with anyone. However, we may send you emails based on your report interest from time to time. You may contact us at any time to opt-out.

    Data Collection and Labelling Market Research Report — Global Forecast till 2032 Infographic
    Purchase Options
    $ 4,950.0
    $ 5,950.0
    $ 7,250.0
    Table of Contents

    Data Collection and Labelling Market Summary

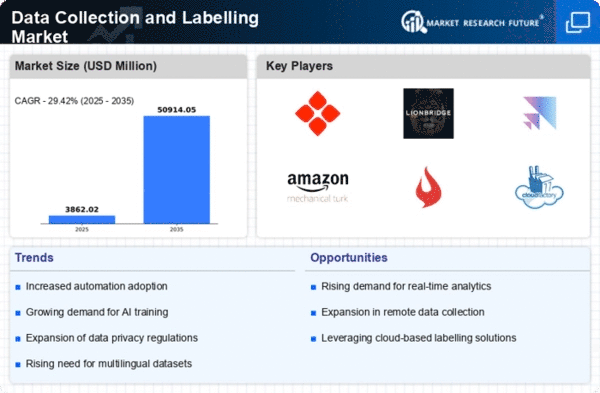
    As per Market Research Future Analysis, the Data Collection and Labelling Market was valued at USD 2,701.8 million in 2023 and is projected to reach USD 23,476.8 million by 2032, growing at a CAGR of 29.4% from 2024 to 2032. The market is driven by the increasing application of AI in healthcare and e-commerce, along with rising automation across various sectors. Companies are innovating their product offerings, integrating advanced technologies like AI and machine learning to enhance data collection and labelling capabilities. Startups are also emerging with specialized solutions tailored to specific industries, further driving market growth.

    Key Market Trends & Highlights

    The Data Collection and Labelling Market is witnessing significant trends driven by technological advancements and industry demands.

    • Image/Video segment accounted for the largest market share in 2023 due to the rise of computer vision applications.
    • Retail and e-commerce emerged as the largest vertical in 2023, leveraging AI for improved operations.
    • North America is the leading region, driven by high demand for data annotation services and technological adoption.
    • The growth of autonomous technology is increasing the need for high-quality data annotations for self-driving cars.

    Market Size & Forecast

    2023 Market Size USD 2,701.8 million
    2024 Market Size USD 2,984.1 million
    2032 Market Size USD 23,476.8 million
    CAGR (2024-2032) 29.4%
    Largest Vertical in 2023 Retail & E-commerce

    Major Players

    Key players include Appen Limited, TELUS International, Global Technology Solutions, Alegion, Labelbox, Inc, Reality AI, Globalme Localization Inc, Dobility Inc, Scale AI, Trilldata Technologies PVT LTD.

    Data Collection and Labelling Market Trends

    GROWTH OF AUTONOMOUS TECHNOLOGY

    A vital component of training self-driving automobiles is the quality of data annotations. Annotations of the highest caliber are essential to guaranteeing the dependability and safety of autonomous cars. Accurate data annotation is essential to the success of autonomous driving because it allows cars to safely navigate by appropriately categorizing roadside items and characteristics. Inadequate data labelling procedures can negatively impact the stages of development and manufacturing, leading to bottlenecks and endangering the functionality and security of self-driving cars. A critical component of the data annotation process for self-driving cars is data validation, which guarantees accurate and dependable algorithm training.

    It confirms that the annotated data is correct, comprehensive, and pertinent to the algorithms being trained. The goal of enhancing safety and accuracy through sophisticated annotation techniques and automation is the future of data annotation quality in self-driving cars. The safety and reliability of the autonomous driving systems will overall enhance by developing new techniques in annotation and self-driving cars will get a more safer mode of transportation.

    It was noted that labelled datasets are critical in the development of drones, autonomous cars and all other robotic systems since the data needed for decision-making, object detection and navigation among other things is contained in labelled datasets. Thus, data gathering and labelling services, which improve object identification, navigation, and decision-making abilities, can significantly help in the creation of autonomous technologies. All of the companies actively developing self-driving car technologies: Waymo, Tesla, and Cruise heavily rely on information that is accurately classified.

    These datasets are used to train their artificial intelligence in how to interpret traffic signs, identify barriers and how to maneuver on highways safely. In addition, the drones and the Unmanned Aerial Vehicles (UAVs) with the help of Artificial Intelligence (AI) are employed by the businesses in aerial mapping, farming, structure monitoring, and logistics for enabling the flight and data acquisition. There is a necessity to have datasets that include aerial photographs, terrain maps, and annotations for object detection to train the drone AI systems to recognize different terrains and objects and identify specific objects.

    The increasing reliance on artificial intelligence and machine learning technologies is driving a robust demand for high-quality data collection and labelling services, which are essential for training algorithms and enhancing predictive accuracy.

    U.S. Department of Commerce

    Data Collection and Labelling Market Drivers

    Rising Demand for AI and Machine Learning

    The increasing adoption of artificial intelligence and machine learning technologies is a primary driver of the Global Data Collection and Labelling Market Industry. Organizations across various sectors are leveraging these technologies to enhance operational efficiency and decision-making processes. As AI systems require vast amounts of labeled data for training, the demand for data collection and labeling services is surging. In 2024, the market is projected to reach 2.98 USD Billion, reflecting the growing need for high-quality datasets. This trend is expected to continue, with the market potentially expanding to 50.9 USD Billion by 2035, indicating a robust growth trajectory.

    Market Segment Insights

    Data Collection and Labelling Market Data Type Insights

    Based on Data Type, the Data Collection and Labelling Market has been segmented into Text, Image/Video, and Audio. Image/Video accounted for the largest market shar in 2023. The large percentage is likely due to the rising use of computer vision in various industries, including automotive, healthcare, media, and entertainment. For instance, in May 2022, Researchers at the Massachusetts Institute of Technology (MIT), a private land-grant research university, created a machine learning model that learns to describe data in a manner that incorporates concepts shared by video and aural modalities.

    Their model can identify and mark where particular actions occur in a video. The developers limit the technique to only 1,000 words to label vectors, and the model can choose which concepts or activities to put into a single vector.

    FIGURE 2: DATA COLLECTION AND LABELLING MARKET, BY DATA TYPE, 2023 VS 2032 (USD MILLION)

    Source: Secondary Research, Primary Research, Market Research Future Database, and Analyst Review

    Data Collection and Labelling Market Application Insights

    Based on Vertical, the Data Collection and Labelling Market has been segmented into IT, Automotive, Government, Healthcare, BFSI, Retail & E-commerce, and Others. In 2023, the retail and e-commerce industry emerged to be the largest market share. In the retail industry, AI and machine learning have revolutionized how stock is controlled, how sales are channeled and how personalization is done. Among the retailers that have woken up to the new reality, some have adopted machine learning as a way of dealing with the new reality of retailing through the following aspects of sales, scalability, customer satisfaction and efficiency of operations.

    However, the effectiveness of these models is closely connected with the proper training that can be a challenging task to be implemented within the organization.

    Data Collection and Labelling Market

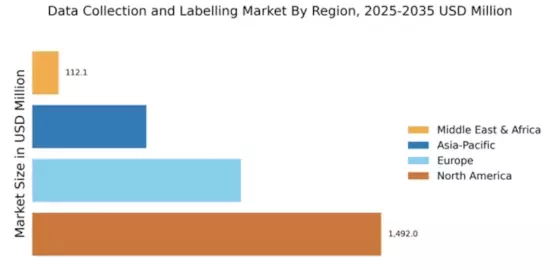
    FIGURE 3: DATA COLLECTION AND LABELLING MARKET SIZE BY REGION 2023 VS 2032

    By Region, the study provides market insights into North America, Europe, Asia-Pacific, Middle East and Africa and South America. North America consists of the U.S, Canada, and Mexico. North America has experienced an increased need for data gathering and tagging. This area with a great number of large businesses with a fast adoption of innovative technologies is where data annotation and labelling have quickly gained a foothold. The increasing complexity of the AI and machine learning models being developed presents the need for firms to outsource these services to meet their data processing needs.

    Get more detailed insights about Data Collection and Labelling Market Research Report — Global Forecast till 2032

    Regional Insights

    By Region, the study provides market insights into North America, Europe, Asia-Pacific, Middle East and Africa and South America. North America consists of the U.S, Canada, and Mexico. North America has experienced an increased need for data gathering and tagging. This area with a great number of large businesses with a fast adoption of innovative technologies is where data annotation and labelling have quickly gained a foothold. The increasing complexity of the AI and machine learning models being developed presents the need for firms to outsource these services to meet their data processing needs.

    One of the reasons that exert pressure on this demand is the increase in the capital expenditure by the North American businesses especially those in United States which is the leading market within the region.

    In the Asia-Pacific region, especially in countries like China, Japan, India, and others included, the use of Artificial Intelligence (AI) and Machine Learning (ML) has significantly increased in the last few years across industries. As these technologies are being applied in the real world, the need for data acquisition and annotation is also growing at an exponential rate. There is also a need for well-annotated datasets to train the models for AI and ML, which will help businesses to draw conclusions and make the right decisions.

    Europe region consists of UK, Germany, France, Rest of Europe for the study. The rising trend of using AI and ML technologies in Europe and the high demand for data collection and labelling services is seen as the main impetus. The sectors in the region are gradually adopting AI and ML solutions as the advancement in generative AI has made the technologies more deployable. This is mainly driven by the increasing consciousness of the opportunities that AI and ML bring about despite the relative scarcity of talent in the region.

    While organizations and governments are trying to harness these technologies and integrate them into their processes to achieve better performance and creativity, the importance of high-quality and annotated data is increasing. Thus, European companies are gradually mitigating the initial scepticism regarding AI and ML. Due to the increased scarcity of workers in the global working environment, many people have considered adopting AI and ML as the possible solutions to the problem of vacancy.

    FIGURE 3: DATA COLLECTION AND LABELLING MARKET SIZE BY REGION 2023 VS 2032

    DATA COLLECTION AND LABELLING MARKET SIZE BY REGION 2023 VS 2032

    Source: Secondary Research, Primary Research, Market Research Future Database, and Analyst Review

    Further, the major countries studied in the market report are the U.S., Canada, Mexico, Germany, UK, France, Italy, Spain, China, Japan, and India.

    Key Players and Competitive Insights

    The Data Collection and Labelling Market is characterized by the presence of many global, regional, and local vendors. The regional market is highly competitive, with all the players continually competing to gain a larger market share. The vendors compete based on reliability, cost, product quality, and aftermarket services. Therefore, vendors must provide cost-effective and efficient products to survive and succeed in a competitive market environment.

    The growth of the vendors is dependent on market conditions, government support, and industrial development. Thus, the vendors should focus on expanding their presence and improving their services. According to MRFR analysis, the growth of the Data Collection and Labelling Market is dependent on market conditions.

    The growth of the vendors is dependent on market conditions, and industrial development. Thus, the vendors should focus on expanding their presence and improving their services. According to MRFR analysis, the growth of the Data collection and labelling market is dependent on market conditions. The key vendors in the market are Appen Limited, Telcus international, Global Technology Solutions, Alegion, Labelbox, inc, Reality AI, Globalme Localization inc, Dobility Inc, Scale AI, Trilldata Technologies PVT LTD.

    These companies are focusing on enhancing their products with the integration of improved technologies. Moreover, these are prominent providers of Data collection and labelling and compete in the Data collection and labelling market to increase their geographic presence, expand their customer base, and form strategic partnerships.

    Key Companies in the Data Collection and Labelling Market market include

    Industry Developments

    Future Outlook

    Data Collection and Labelling Market Future Outlook

    The Data Collection and Labelling Market is projected to grow at a 29.41% CAGR from 2024 to 2035, driven by advancements in AI, increasing data demands, and automation technologies.

    New opportunities lie in:

    • Develop AI-driven tools for real-time data annotation and collection.
    • Create specialized data labelling services for emerging industries like autonomous vehicles.
    • Implement scalable cloud-based platforms for efficient data management and storage.

    By 2035, the Data Collection and Labelling Market is expected to be a pivotal sector, reflecting robust growth and innovation.

    Market Segmentation

    Data Collection and Labelling Market Type Outlook

    • Text
    • Image/ Video
    • Audio

    Data Collection and Labelling Market Regional Outlook

    • US
    • Canada
    • Mexico

    Data Collection and Labelling Market Vertical Outlook

    • IT
    • Automotive
    • Government
    • Healthcare
    • BFSI
    • Retail & E-commerce
    • Others

    Report Scope

    Report Attribute/Metric Details
    Market Size 2023 USD 2,701.8 million
    Market Size 2024 USD 2,984.1 million
    Market Size 2032 USD 23,476.8 million
    Compound Annual Growth Rate (CAGR) 29.4 % (2024-2032)
    Base Year 2023
    Market Forecast Period 2024-2032
    Historical Data 2019- 2022
    Market Forecast Units Value (USD Million)
    Report Coverage Revenue Forecast, Market Competitive Landscape, Growth Factors, and Trends
    Segments Covered Data Type, Vertical, and Region
    Geographies Covered Europe, North America, Asia-Pacific, Middle East & Africa, and South America
    Countries Covered US, Canada, Mexico, Germany, U.K., Italy, France, Japan, China, India, South Korea, Saudi Arabia, UAE, South Africa Brazil, Argentina, and Others.
    Key Companies Profiled ·       Appen Limited ·       Telcus International ·       Global Technology Solutions ·       Alegion, ·       Labelbox, Inc ·       Reality AI ·       Globalme Localization Inc ·       Dobility Inc ·       Scale AI ·       Trilldata Technologies PVT LTD. ·       Others
    Key Market Opportunities ·       Growing popularity of labelling crowdsourced data ·       Growth of autonomous technology
    Key Market Dynamics ·       Rise in healthcare ai application ·       Rapidly increasing in e commerce

    Market Highlights

    Author
    Aarti Dhapte
    Team Lead - Research

    She holds an experience of about 6+ years in Market Research and Business Consulting, working under the spectrum of Information Communication Technology, Telecommunications and Semiconductor domains. Aarti conceptualizes and implements a scalable business strategy and provides strategic leadership to the clients. Her expertise lies in market estimation, competitive intelligence, pipeline analysis, customer assessment, etc.

    Leave a Comment

    FAQs

    How much is the Data Collection and Labelling Market?

    The Data Collection and Labelling Market size is expected to be valued at USD 2,701.8 Million in 2023.

    What is the growth rate of the Data Collection and Labelling Market?

    The global market is projected to grow at a CAGR of 29.4% during the forecast period, 2024-2032.

    Which region held the largest market share in the Data Collection and Labelling Market?

    Asia-Pacific had the largest share of the global market.

    Who are the key players in the Data Collection and Labelling Market?

    The key players in the market are Appen Limited, Telcus international, Global Technology Solutions, Alegion, Labelbox, inc, Reality AI, Globalme Localization inc, Dobility Inc, Scale AI, Trilldata Technologies PVT LTD. and others.

    Which Data Type led the Data Collection and Labelling Market?

    The Image/ Video dominated the market in 2023.

    1. EXECUTIVE SUMMARY 18
    2. MARKET INTRODUCTION 21
      1. DEFINITION 21
      2. SCOPE OF THE STUDY 21
      3. RESEARCH
    3. OBJECTIVE 21
      1. MARKET STRUCTURE 22
    4. RESEARCH METHODOLOGY 23
    5. OVERVIEW 23
      1. DATA FLOW 25
        1. Data Mining Process 25
      2. PURCHASED
    6. DATABASE: 26
      1. SECONDARY SOURCES: 27
        1. Secondary Research data flow:
      2. PRIMARY RESEARCH: 29
        1. Primary Research DATA FLOW: 30
    7. Primary Research: Number of Interviews conducted 31
      1. APPROACHES FOR MARKET
    8. SIZE ESTIMATION: 32
      1. Consumption & Net Trade Approach 32
    9. Revenue Analysis Approach 32
      1. DATA FORECASTING 33
        1. Data forecasting
    10. Type 33
      1. DATA MODELING 34
        1. microeconomic factor analysis: 34
        2. Data modeling: 35
    11. MARKET DYNAMICS 38
      1. INTRODUCTION 38
      2. DRIVERS 38
        1. rise in Healthcare AI Application 38
        2. rapidly
    12. increasing in e commerce 39
      1. RESTRAINTS 40
        1. Data Privacy and Security
    13. Concerns 40
      1. Problems related to inadequate training data quality 40
      2. OPPORTUNITY 41
        1. Growth of Autonomous Technology 41
        2. Growing
    14. popularity of labelling crowdsourced data 42
    15. MARKET FACTOR ANALYSIS 43
      1. VALUE CHAIN ANALYSIS 43
        1. Data Collection 43
        2. Data Preprocessing
        3. Select the Right Vendor or Tool 43
        4. Annotation Guidelines
        5. Annotation 43
        6. Quality Assurance (QA) 44
        7. Data
    16. Export 44
      1. PORTER'S FIVE FORCES MODEL 45
        1. THREAT OF NEW ENTRANTS
        2. BARGAINING POWER OF SUPPLIERS 46
        3. THREAT OF SUBSTITUTES
        4. BARGAINING POWER OF BUYERS 46
        5. INTENSITY OF RIVALRY 46
      2. COVID-19 IMPACT ANALYSIS 47
        1. Market Impact Analysis 47
    17. Regional Impact 47
      1. Opportunity and Threat Analysis 47
    18. GLOBAL DATA
    19. COLLECTION AND LABELLING MARKET, BY DATA TYPE 49
      1. OVERVIEW 49
      2. TEXT
      3. IMAGE/ VIDEO 51
      4. AUDIO 51
    20. GLOBAL DATA COLLECTION AND
    21. LABELLING MARKET, BY VERTICAL 53
      1. INTRODUCTION 53
      2. IT 55
    22. AUTOMOTIVE 55
      1. GOVERNMENT 56
      2. HEALTHCARE 56
      3. BFSI 56
      4. RETAIL & E-COMMERCE 57
      5. OTHERS 57
    23. GLOBAL DATA COLLECTION
    24. AND LABELLING MARKET, BY REGION 59
      1. OVERVIEW 59
    25. Global Data Collection
    26. and Labelling market, by region, 2023 VS 2032 (USD MILLION) 59
      1. NORTH AMERICA
        1. us 63
        2. Canada 64
      2. EUROPE 65
        1. UK 69
        2. GERMANY 70
        3. FRANCE 71
        4. ITALY 72
        5. SPAIN 73
        6. REST OF EUROPE 74
      3. ASIA-PACIFIC 75
        1. CHINA 78
    27. JAPAN 79
      1. INDIA 80
        1. SOUTH KOREA 81
        2. Australia 82
        3. REST OF ASIA-PACIFIC 83
      2. REST OF THE WORLD 85
        1. MIDDLE
    28. EAST 88
      1. AFRICA 89
        1. Latin America 90
    29. COMPETITIVE LANDSCAPE
      1. INTRODUCTION 91
      2. MARKET SHARE ANALYSIS, 2023 91
      3. COMPETITOR
    30. DASHBOARD 92
    31. SUMMA LINGUAE TECHNOLOGIES 92
    32. APPEN 92
    33. IBM 92
    34. LABELBOX 92
    35. TELUS INTERNATIONAL 92
      1. MAJOR PLAYERS FINANCIAL MATRIX 93
      2. KEY DEVELOPMENTS & GROWTH
    36. STRATEGIES 93
      1. Product development 93
        1. Partnerships/Agreements/contracts/Collaborations
    37. COMPANY PROFILE 97
      1. APPEN LIMITED 97
        1. COMPANY OVERVIEW
        2. FINANCIAL OVERVIEW 98
        3. PRODUCTS Offered 98
    38. KEY DEVELOPMENTS 99
      1. SWOT ANALYSIS 100
        1. Key Strategies 100
      2. TELUS INTERNATIONAL 101
        1. COMPANY OVERVIEW 101
        2. FINANCIAL
    39. OVERVIEW 102
      1. PRODUCTS Offered 102
        1. KEY DEVELOPMENTS 103
        2. SWOT ANALYSIS 103
        3. Key Strategies 104
      2. GLOBAL TECHNOLOGY
    40. SOLUTIONS 105
      1. COMPANY OVERVIEW 105
        1. FINANCIAL OVERVIEW 105
        2. PRODUCTS Offered 106
      2. ALEGION 107
        1. COMPANY OVERVIEW
        2. FINANCIAL OVERVIEW 108
        3. PRODUCTS Offered 108
    41. KEY DEVELOPMENTS 109
      1. SWOT ANALYSIS 109
        1. Key Strategies 109
      2. LABELBOX, INC 110
        1. COMPANY OVERVIEW 110
        2. FINANCIAL
    42. OVERVIEW 110
      1. PRODUCTS Offered 110
        1. KEY DEVELOPMENTS 111
        2. SWOT ANALYSIS 112
        3. Key Strategies 112
      2. RENESAS ELECTRONICS
    43. CORPORATION 113
      1. COMPANY OVERVIEW 113
        1. FINANCIAL OVERVIEW
        2. PRODUCTS Offered 114
        3. KEY DEVELOPMENTS 115
    44. SWOT ANALYSIS 116
      1. Key Strategies 117
      2. SUMMA LINGUAE TECHNOLOGIES
        1. COMPANY OVERVIEW 118
        2. FINANCIAL OVERVIEW 118
    45. PRODUCTS Offered 119
      1. KEY DEVELOPMENTS 119
        1. SWOT ANALYSIS
        2. Key Strategies 120
      2. DOBILITY INC. 121
        1. COMPANY
    46. OVERVIEW 121
      1. FINANCIAL OVERVIEW 121
        1. PRODUCTS Offered 122
        2. KEY DEVELOPMENTS 122
        3. SWOT ANALYSIS 122
        4. Key Strategies
      2. SCALE AI INC. 124
        1. COMPANY OVERVIEW 124
        2. FINANCIAL
    47. OVERVIEW 124
      1. PRODUCTS Offered 124
        1. KEY DEVELOPMENTS 125
        2. SWOT ANALYSIS 126
        3. Key Strategies 126
      2. IBM CORPORATION
        1. COMPANY OVERVIEW 127
        2. FINANCIAL OVERVIEW 127
    48. PRODUCTS Offered 128
      1. KEY DEVELOPMENTS 129
        1. SWOT ANALYSIS
        2. Key Strategies 130
    49. ASSESSMENT 35
    50. TYPE, 2019-2032 (USD MILLION) 50
    51. MARKET, BY VERTICAL, 2019-2032 (USD MILLION) 54
    52. AND LABELLING MARKET, BY REGION, 2019–2032 (USD MILLION) 60
    53. AMERICA: DATA COLLECTION AND LABELLING MARKET, BY COUNTRY, 2019-2032 (USD MILLION)
    54. 2032 (USD MILLION) 62
    55. MARKET, BY VERTICAL, 2019-2032 (USD MILLION) 62
    56. AND LABELLING MARKET, BY DATA TYPE, 2019-2032 (USD MILLION) 63
    57. DATA COLLECTION AND LABELLING MARKET, BY VERTICAL, 2019-2032 (USD MILLION) 63
    58. (USD MILLION) 64
    59. 2032 (USD MILLION) 64
    60. BY COUNTRY, 2019-2032 (USD MILLION) 67
    61. LABELLING MARKET, BY DATA TYPE, 2019-2032 (USD MILLION) 68
    62. DATA COLLECTION AND LABELLING MARKET, BY VERTICAL, 2019-2032 (USD MILLION) 68
    63. MILLION) 69
    64. 2032 (USD MILLION) 69
    65. BY DATA TYPE, 2019-2032 (USD MILLION) 70
    66. LABELLING MARKET, BY VERTICAL, 2019-2032 (USD MILLION) 70
    67. COLLECTION AND LABELLING MARKET, BY DATA TYPE, 2019-2032 (USD MILLION) 71
    68. FRANCE DATA COLLECTION AND LABELLING MARKET, BY VERTICAL, 2019-2032 (USD MILLION)
    69. (USD MILLION) 72
    70. 2032 (USD MILLION) 72
    71. BY DATA TYPE, 2019-2032 (USD MILLION) 73
    72. LABELLING MARKET, BY VERTICAL, 2019-2032 (USD MILLION) 73
    73. EUROPE DATA COLLECTION AND LABELLING MARKET, BY DATA TYPE, 2019-2032 (USD MILLION)
    74. 2032 (USD MILLION) 74
    75. MARKET, BY COUNTRY, 2019-2032 (USD MILLION) 77
    76. AND LABELLING MARKET, BY DATA TYPE, 2019-2032 (USD MILLION) 77
    77. DATA COLLECTION AND LABELLING MARKET, BY VERTICAL, 2019-2032 (USD MILLION) 78
    78. MILLION) 78
    79. 2032 (USD MILLION) 79
    80. BY DATA TYPE, 2019-2032 (USD MILLION) 79
    81. LABELLING MARKET, BY VERTICAL, 2019-2032 (USD MILLION) 80
    82. COLLECTION AND LABELLING MARKET, BY DATA TYPE, 2019-2032 (USD MILLION) 80
    83. INDIA DATA COLLECTION AND LABELLING MARKET, BY VERTICAL, 2019-2032 (USD MILLION)
    84. 2032 (USD MILLION) 81
    85. MARKET, BY VERTICAL, 2019-2032 (USD MILLION) 82
    86. AND LABELLING MARKET, BY DATA TYPE, 2019-2032 (USD MILLION) 82
    87. DATA COLLECTION AND LABELLING MARKET, BY VERTICAL, 2019-2032 (USD MILLION) 83
    88. 2032 (USD MILLION) 83
    89. LABELLING MARKET, BY VERTICAL, 2019-2032 (USD MILLION) 84
    90. THE WORLD: DATA COLLECTION AND LABELLING MARKET, BY COUNTRY, 2019-2032 (USD MILLION)
    91. TYPE, 2019-2032 (USD MILLION) 87
    92. AND LABELLING MARKET, BY VERTICAL, 2019-2032 (USD MILLION) 87
    93. EAST DATA COLLECTION AND LABELLING MARKET, BY DATA TYPE, 2019-2032 (USD MILLION)
    94. 2032 (MILLIONS) 88
    95. BY DATA TYPE, 2019-2032 (USD MILLION) 89
    96. LABELLING MARKET, BY VERTICAL, 2019-2032 (USD MILLION) 89
    97. DATA COLLECTION AND LABELLING MARKET, BY DATA TYPE, 2019-2032 (USD MILLION) 90
    98. (USD MILLION) 90
    99. IN THE GLOBAL DATA COLLECTION AND LABELLING MARKET 92
    100. OPERATING INCOME, 2023 93
    101. APPEN LIMITED: KEY DEVELOPMENTS 99
    102. SOLUTIONS/ SERVICES OFFERED 102
    103. ALEGION: KEY DEVELOPMENTS 109
    104. SERVICES OFFERED 110
    105. RENESAS ELECTRONICS CORPORATION: PRODUCTS/ SOLUTIONS/ SERVICES OFFERED 114
    106. LINGUAE TECHNOLOGIES: PRODUCTS/ SOLUTIONS/ SERVICES OFFERED 119
    107. LINGUAE TECHNOLOGIES: KEY DEVELOPMENTS 119
    108. SOLUTIONS/ SERVICES OFFERED 122
    109. SERVICES OFFERED 124
    110. IBM CORP.: PRODUCTS/ SOLUTIONS/ SERVICES OFFERED 128
    111. KEY DEVELOPMENTS 129
    112. GLOBAL DATA COLLECTION AND LABELLING MARKET: EXECUTIVE SUMMARY 19
    113. GLOBAL DATA COLLECTION AND LABELLING MARKET: STRUCTURE 22
    114. DATA COLLECTION & LABELLING MARKET: MARKET GROWTH FACTOR ANALYSIS (2022-2032)
    115. ANALYSIS (2023-2032) 41
    116. VALUE CHAIN: GLOBAL DATA COLLECTION & LABELLING MARKET 43
    117. FIVE FORCES ANALYSIS OF THE GLOBAL DATA COLLECTION & LABELLING MARKET 45
    118. & 2032 (USD MILLION) 50
    119. MARKET, BY DATA TYPE, 2023 (% SHARE) 50
    120. GLOBAL DATA COLLECTION AND LABELLING
    121. MARKET, BY VERTICAL, SEGMENT ATTRACTIVENESS ANALYSIS 53
    122. COLLECTION AND LABELLING MARKET, BY VERTICAL, 2023 & 2032 (USD MILLION) 54
    123. SHARE) 59
    124. VS 2032 (USD MILLION) 59
    125. COLLECTION AND LABELLING MARKET, 2019-2023(USD MILLION) 60
    126. AMERICA: DATA COLLECTION AND LABELLING MARKET SHARE, BY COUNTRY, 2023 (% SHARE)
    127. COUNTRY, 2023 & 2032 (USD MILLION) 61
    128. DATA COLLECTION AND LABELLING MARKET, 2019-2023(USD MILLION) 66
    129. DATA COLLECTION AND LABELLING MARKET SHARE, BY COUNTRY, 2023 (% SHARE) 67
    130. EUROPE: DATA COLLECTION AND LABELLING MARKET SHARE, BY COUNTRY, 2023 & 2032
    131. (USD MILLION) 67
    132. LABELLING MARKET, 2019-2023(USD MILLION) 75
    133. AND LABELLING MARKET SHARE, BY COUNTRY, 2023 (% SHARE) 76
    134. DATA COLLECTION AND LABELLING MARKET SHARE, BY COUNTRY, 2023 & 2032 (USD MILLION)
    135. MARKET, 2019-2023 (USD MILLION) 85
    136. AND LABELLING MARKET SHARE, BY COUNTRY, 2023 (% SHARE) 86
    137. THE WORLD: DATA COLLECTION AND LABELLING MARKET SHARE, BY COUNTRY, 2023 & 2032
    138. (USD MILLION) 86
    139. COMPETITIVE ANALSIS, 2023 91
    140. AND LABELLING MARKET 92
    141. SNAPSHOT 98
    142. INTERNATIONAL: FINANCIAL OVERVIEW SNAPSHOT 102
    143. SWOT ANALYSIS 103
    144. ALEGION: SWOT ANALYSIS 109
    145. NOTE- THE COMPANY
    146. DOES NOT PROVIDE ITS FINANCIAL INFORMATION IN PUBLIC DOMAIN 118
    147. LINGUAE TECHNOLOGIES: SWOT ANALYSIS 120
    148. OVERVIEW SNAPSHOT 121
    149. SCALE AI INC.: SWOT ANALYSIS 126
    150. SNAPSHOT 127

    Data Collection and Labelling Market Segmentation

    Global Data Collection and Labelling Offering Outlook

    • Text
    • Image/ Video
    • Audio

    Global Data Collection and Labelling Application Outlook

    • IT
    • Automotive
    • Government
    • Healthcare
    • BFSI
    • Retail & E-commerce
    • Others

    Global Data Collection and Labelling Regional Outlook (USD Million, 2019-2032)

    North America Data Collection and Labelling Offering Outlook

    • Text
    • Image/ Video
    • Audio

    North America Data Collection and Labelling Application Outlook

    • IT
    • Automotive
    • Government
    • Healthcare
    • BFSI
    • Retail & E-commerce
    • Others

    US Data Collection and Labelling Offering Outlook

    • Text
    • Image/ Video
    • Audio

    US Data Collection and Labelling Application Outlook

    • IT
    • Automotive
    • Government
    • Healthcare
    • BFSI
    • Retail & E-commerce
    • Others

    Canada Data Collection and Labelling Offering Outlook

    • Text
    • Image/ Video
    • Audio

    Canada Data Collection and Labelling Application Outlook

    • IT
    • Automotive
    • Government
    • Healthcare
    • BFSI
    • Retail & E-commerce
    • Others

    Mexico Data Collection and Labelling Offering Outlook

    • Text
    • Image/ Video
    • Audio

    Mexico Data Collection and Labelling Application Outlook

    • IT
    • Automotive
    • Government
    • Healthcare
    • BFSI
    • Retail & E-commerce
    • Others

    Europe Data Collection and Labelling Offering Outlook

    • Text
    • Image/ Video
    • Audio

    Europe Data Collection and Labelling Application Outlook

    • IT
    • Automotive
    • Government
    • Healthcare
    • BFSI
    • Retail & E-commerce
    • Others

    Germany Data Collection and Labelling Offering Outlook

    • Text
    • Image/ Video
    • Audio

    Germany Data Collection and Labelling Application Outlook

    • IT
    • Automotive
    • Government
    • Healthcare
    • BFSI
    • Retail & E-commerce
    • Others

    UK Data Collection and Labelling Offering Outlook

    • Text
    • Image/ Video
    • Audio

    UK Data Collection and Labelling Application Outlook

    • IT
    • Automotive
    • Government
    • Healthcare
    • BFSI
    • Retail & E-commerce
    • Others

    France Data Collection and Labelling Offering Outlook

    • Text
    • Image/ Video
    • Audio

    France Data Collection and Labelling Application Outlook

    • IT
    • Automotive
    • Government
    • Healthcare
    • BFSI
    • Retail & E-commerce
    • Others

    Italy Data Collection and Labelling Offering Outlook

    • Text
    • Image/ Video
    • Audio

    Italy Data Collection and Labelling Application Outlook

    • IT
    • Automotive
    • Government
    • Healthcare
    • BFSI
    • Retail & E-commerce
    • Others

    Spain Data Collection and Labelling Offering Outlook

    • Text
    • Image/ Video
    • Audio

    Spain Data Collection and Labelling Application Outlook

    • IT
    • Automotive
    • Government
    • Healthcare
    • BFSI
    • Retail & E-commerce
    • Others

    Rest of Europe Data Collection and Labelling Offering Outlook

    • Text
    • Image/ Video
    • Audio

    Rest of Europe Data Collection and Labelling Application Outlook

    • IT
    • Automotive
    • Government
    • Healthcare
    • BFSI
    • Retail & E-commerce
    • Others

    Asia-Pacific Data Collection and Labelling Offering Outlook

    • Text
    • Image/ Video
    • Audio

    Asia-Pacific Data Collection and Labelling Application Outlook

    • IT
    • Automotive
    • Government
    • Healthcare
    • BFSI
    • Retail & E-commerce
    • Others

    China Data Collection and Labelling Offering Outlook

    • Text
    • Image/ Video
    • Audio

    China Data Collection and Labelling Application Outlook

    • IT
    • Automotive
    • Government
    • Healthcare
    • BFSI
    • Retail & E-commerce
    • Others

    Japan Data Collection and Labelling Offering Outlook

    • Text
    • Image/ Video
    • Audio

    Japan Data Collection and Labelling Application Outlook

    • IT
    • Automotive
    • Government
    • Healthcare
    • BFSI
    • Retail & E-commerce
    • Others

    India Data Collection and Labelling Offering Outlook

    • Text
    • Image/ Video
    • Audio

    India Data Collection and Labelling Application Outlook

    • IT
    • Automotive
    • Government
    • Healthcare
    • BFSI
    • Retail & E-commerce
    • Others

    Rest of Asia-Pacific Data Collection and Labelling Offering Outlook

    • Text
    • Image/ Video
    • Audio

    Rest of Asia-Pacific Data Collection and Labelling Application Outlook

    • IT
    • Automotive
    • Government
    • Healthcare
    • BFSI
    • Retail & E-commerce
    • Others

    Middle East & Africa Data Collection and Labelling Offering Outlook

    • Text
    • Image/ Video
    • Audio

    Middle East & Africa Data Collection and Labelling Application Outlook

    • IT
    • Automotive
    • Government
    • Healthcare
    • BFSI
    • Retail & E-commerce
    • Others

    Saudi Arabia Data Collection and Labelling Offering Outlook

    • Text
    • Image/ Video
    • Audio

    Saudi Arabia Data Collection and Labelling Application Outlook

    • IT
    • Automotive
    • Government
    • Healthcare
    • BFSI
    • Retail & E-commerce
    • Others

    UAE Data Collection and Labelling Offering Outlook

    • Text
    • Image/ Video
    • Audio

    UAE Data Collection and Labelling Application Outlook

    • IT
    • Automotive
    • Government
    • Healthcare
    • BFSI
    • Retail & E-commerce
    • Others

    South Africa Data Collection and Labelling Offering Outlook

    • Text
    • Image/ Video
    • Audio

    South Africa Data Collection and Labelling Application Outlook

    • IT
    • Automotive
    • Government
    • Healthcare
    • BFSI
    • Retail & E-commerce
    • Others

    Rest of MEA Data Collection and Labelling Offering Outlook

    • Text
    • Image/ Video
    • Audio

    Rest of MEA Data Collection and Labelling Application Outlook

    • IT
    • Automotive
    • Government
    • Healthcare
    • BFSI
    • Retail & E-commerce
    • Others

    Rest of MEA Data Collection and Labelling Offering Outlook

    • Text
    • Image/ Video
    • Audio

    Rest of MEA Data Collection and Labelling Application Outlook

    • IT
    • Automotive
    • Government
    • Healthcare
    • BFSI
    • Retail & E-commerce
    • Others

    South America Data Collection and Labelling Offering Outlook

    • Text
    • Image/ Video
    • Audio

    South America Data Collection and Labelling Application Outlook

    • IT
    • Automotive
    • Government
    • Healthcare
    • BFSI
    • Retail & E-commerce
    • Others

    Argentina Data Collection and Labelling Offering Outlook

    • Text
    • Image/ Video
    • Audio

    Argentina Data Collection and Labelling Application Outlook

    • IT
    • Automotive
    • Government
    • Healthcare
    • BFSI
    • Retail & E-commerce
    • Others

    Rest of South America Data Collection and Labelling Offering Outlook

    • Text
    • Image/ Video
    • Audio

    Rest of South America Data Collection and Labelling Application Outlook

    • IT
    • Automotive
    • Government
    • Healthcare
    • BFSI
    • Retail & E-commerce
    • Others
    Report Infographic
    Free Sample Request

    Kindly complete the form below to receive a free sample of this Report

    Customer Strories

    “I am very pleased with how market segments have been defined in a relevant way for my purposes (such as "Portable Freezers & refrigerators" and "last-mile"). In general the report is well structured. Thanks very much for your efforts.”

    Victoria Milne Founder
    Case Study

    Chemicals and Materials