• Cat-intel
  • MedIntelliX
  • Resources
  • About Us
  • Hero Background
    English
    Chinese
    French
    Japanese
    Korean
    German
    Spanish

    Chemotherapy Market Analysis

    ID: MRFR/Pharma/4335-CR
    126 Pages
    Rahul Gotadki
    February 2021

    Chemotherapy Market Research Report Information By Drug Class (Mitotic Inhibitors, Alkylating Agents, Antimetabolites, Topoisomerase Inhibitors and Antitumor Antibiotic), By Indication (Breast Cancer, Lung Cancer, Colorectal Cancer, Prostate Cancer, Stomach Cancer, Lymphoma, Leukemia and Ovarian Cancer), By Route of Drug Administration (Intravenous, Oral, Subcutaneous, Intra-Muscular, Intravesi...

    Share:
    Download PDF ×

    We do not share your information with anyone. However, we may send you emails based on your report interest from time to time. You may contact us at any time to opt-out.

    Chemotherapy Market Infographic
    Purchase Options

    Market Analysis

    In-depth Analysis of Chemotherapy Market Industry Landscape

    Developing countries present an opportunity for the chemotherapy market due to their underdeveloped research and development sector, making it challenging to address emerging health challenges. In regions like Africa, there is a significant demand for healthcare solutions, but the healthcare industry's slow growth is hindered by poor economic conditions and dependence on imported medicines.

    The underdeveloped healthcare sector in these regions creates a chance for chemotherapy drug providers to enhance the global chemotherapy market's presence in developing areas. By focusing on strengthening healthcare infrastructure and accessibility, providers can contribute to improving healthcare outcomes in these regions.

    The chemotherapy market is witnessing rapid growth due to several factors, including the increasing prevalence of cancer, expansion of the target patient population, growing public-private funding, government support for cancer research, and technological advancements in interventional oncology. The market offers a diverse range of chemotherapy drugs to address various types of cancer.

    The value chain analysis for the chemotherapy industry involves four key components. It begins with research and product development, followed by the manufacturing of products, distribution, sales, and concludes with post-sales services. Each stage in this value chain plays a crucial role in ensuring that chemotherapy drugs reach patients effectively, from the initial research and development phase to post-sales support.

    Research and product development are vital for creating innovative and effective chemotherapy drugs. This stage involves scientific studies, clinical trials, and the development of new formulations to enhance treatment outcomes. Manufacturers then take on the responsibility of producing these drugs on a larger scale, ensuring they meet quality standards and are readily available for distribution.

    Distribution plays a crucial role in reaching chemotherapy drugs to various healthcare facilities and providers. Efficient distribution channels are essential to ensure timely access to these drugs, especially in regions with a high demand for cancer treatment but limited resources.

    Sales and marketing strategies contribute to creating awareness about chemotherapy drugs, making them accessible to healthcare professionals and patients. Effective sales efforts help in reaching a broader audience and ensuring that healthcare providers have the necessary information to prescribe these drugs based on patient needs.

    Post-sales services involve ongoing support, monitoring, and feedback to enhance the effectiveness of chemotherapy treatment. This phase ensures that patients receive the necessary follow-up care and that healthcare providers have access to updated information and resources.

    Author
    Rahul Gotadki
    Assistant Manager

    He holds an experience of about 7+ years in Market Research and Business Consulting, working under the spectrum of Life Sciences and Healthcare domains. Rahul conceptualizes and implements a scalable business strategy and provides strategic leadership to the clients. His expertise lies in market estimation, competitive intelligence, pipeline analysis, customer assessment, etc. In addition to the above, his other responsibility includes strategic tracking of high growth markets & advising clients on the potential areas of focus they could direct their business initiatives

    Leave a Comment

    FAQs

    What is the current valuation of the Chemotherapy Market as of 2024?

    The Chemotherapy Market was valued at 9.55 USD Billion in 2024.

    What is the projected market valuation for the Chemotherapy Market in 2035?

    The Chemotherapy Market is projected to reach 20.99 USD Billion by 2035.

    What is the expected CAGR for the Chemotherapy Market during the forecast period 2025 - 2035?

    The expected CAGR for the Chemotherapy Market during the forecast period 2025 - 2035 is 7.42%.

    Which drug class segment is projected to have the highest valuation by 2035?

    The Antimetabolites segment is projected to reach 5.75 USD Billion by 2035.

    How does the valuation of Breast Cancer treatment compare to Lung Cancer treatment in 2035?

    By 2035, Breast Cancer treatment is projected to be valued at 4.25 USD Billion, while Lung Cancer treatment is expected to reach 4.75 USD Billion.

    What are the projected valuations for the Intravenous and Oral routes of drug administration by 2035?

    The Intravenous route is projected to reach 7.5 USD Billion, while the Oral route is expected to reach 4.5 USD Billion by 2035.

    Market Summary

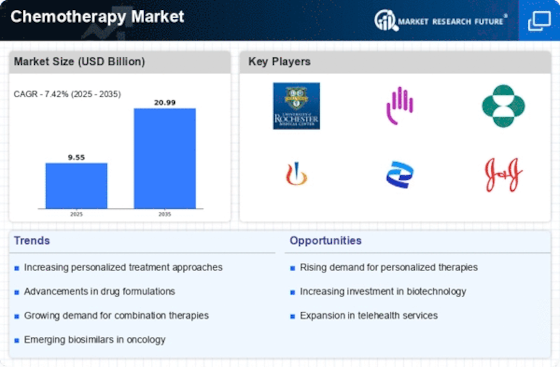
    As per MRFR analysis, the Chemotherapy Market Size was estimated at 9.55 USD Billion in 2024. The Chemotherapy industry is projected to grow from 10.26 USD Billion in 2025 to 20.99 USD Billion by 2035, exhibiting a compound annual growth rate (CAGR) of 7.42 during the forecast period 2025 - 2035.

    Key Market Trends & Highlights

    The chemotherapy market is experiencing a transformative shift towards personalized medicine and technological integration.

    • North America remains the largest market for chemotherapy, driven by advanced healthcare infrastructure and high treatment costs.
    • The Asia-Pacific region is emerging as the fastest-growing market, fueled by increasing cancer incidence and improving healthcare access.
    • Mitotic inhibitors continue to dominate the market, while antimetabolites are witnessing rapid growth due to their effectiveness in various cancer types.
    • Rising incidence of cancer and advancements in drug development are key drivers propelling the chemotherapy market forward.

    Market Size & Forecast

    2024 Market Size 9.55 (USD Billion)
    2035 Market Size 20.99 (USD Billion)
    CAGR (2025 - 2035) 7.42%
    Largest Regional Market Share in 2024 North America

    Major Players

    <p>Roche (CH), Bristol-Myers Squibb (US), Merck & Co. (US), Novartis (CH), Pfizer (US), Johnson & Johnson (US), Amgen (US), Eli Lilly and Company (US), AstraZeneca (GB)</p>

    Market Trends

    The Chemotherapy Market is currently experiencing a dynamic evolution, driven by advancements in treatment methodologies and a growing understanding of cancer biology. Innovative drug formulations and personalized medicine approaches are reshaping therapeutic strategies, allowing for more targeted interventions. This shift not only enhances efficacy but also aims to minimize adverse effects, thereby improving patient quality of life. Furthermore, the integration of technology in treatment protocols, such as artificial intelligence and machine learning, is facilitating more precise treatment planning and monitoring, which could lead to better outcomes for patients. In addition, the Chemotherapy Market is witnessing an increase in collaboration among pharmaceutical companies, research institutions, and healthcare providers. This collaborative environment fosters the development of novel therapies and encourages the sharing of knowledge and resources. As a result, there is a heightened focus on clinical trials and research initiatives aimed at discovering new treatment options. The ongoing commitment to improving cancer care is likely to drive the market forward, as stakeholders strive to meet the evolving needs of patients and healthcare systems alike.

    Personalized Medicine

    The trend towards personalized medicine is gaining traction within the Chemotherapy Market. Tailoring treatment plans to individual patient profiles, including genetic and molecular characteristics, appears to enhance therapeutic effectiveness. This approach not only optimizes drug selection but also minimizes the risk of adverse reactions, thereby improving overall patient outcomes.

    Technological Integration

    The integration of advanced technologies into chemotherapy practices is transforming treatment delivery. Innovations such as artificial intelligence and data analytics are being utilized to refine treatment protocols and enhance patient monitoring. This technological shift may lead to more precise and effective chemotherapy regimens, ultimately benefiting patient care.

    Collaborative Research Initiatives

    Collaboration among various stakeholders in the Chemotherapy Market is becoming increasingly prevalent. Pharmaceutical companies, academic institutions, and healthcare providers are joining forces to conduct research and clinical trials. This collaborative effort is likely to accelerate the development of new therapies and improve access to cutting-edge treatments for patients.

    <p>The ongoing advancements in chemotherapy treatments are poised to enhance patient outcomes and expand therapeutic options, reflecting a dynamic evolution in oncology care.</p>

    U.S. National Cancer Institute

    Chemotherapy Market Market Drivers

    Rising Incidence of Cancer

    The increasing prevalence of cancer worldwide is a primary driver of the Chemotherapy Market. According to recent statistics, cancer cases are projected to rise significantly, with estimates suggesting that by 2040, the number of new cancer cases could reach 29.5 million annually. This alarming trend necessitates the development and administration of effective chemotherapy treatments, thereby propelling market growth. The Chemotherapy Market is responding to this demand by innovating and expanding treatment options, including targeted therapies and combination regimens. As healthcare systems adapt to manage this growing burden, investments in chemotherapy research and development are likely to increase, further enhancing the market landscape. The urgency to address cancer's impact on public health underscores the critical role of chemotherapy in treatment protocols, making it a focal point for pharmaceutical companies and healthcare providers alike.

    Advancements in Drug Development

    Innovations in drug development are significantly influencing the Chemotherapy Market. The advent of novel therapeutic agents, including immunotherapies and targeted therapies, has transformed the treatment landscape for various cancers. Recent advancements in biotechnology and pharmacogenomics have enabled the creation of more effective and less toxic chemotherapy agents. For instance, the introduction of antibody-drug conjugates has shown promise in improving patient outcomes while minimizing side effects. The Chemotherapy Market is witnessing a surge in clinical trials aimed at evaluating these new therapies, with a notable increase in investment from pharmaceutical companies. This focus on research and development is expected to yield a pipeline of innovative treatments that could reshape the market dynamics. As these advancements continue to emerge, they are likely to enhance the efficacy of chemotherapy, thereby attracting more patients and healthcare providers to these novel solutions.

    Growing Awareness and Screening Programs

    The rising awareness of cancer and the importance of early detection are driving the Chemotherapy Market. Public health initiatives and educational campaigns have led to increased participation in screening programs, resulting in earlier diagnoses of various cancers. This trend is crucial, as early-stage cancers often require chemotherapy as part of the treatment regimen. The Chemotherapy Market benefits from this heightened awareness, as it translates into a larger patient population seeking treatment. Moreover, healthcare providers are increasingly recommending chemotherapy as a viable option for patients diagnosed at earlier stages, further propelling market growth. The integration of screening programs into healthcare systems is likely to continue, fostering a culture of proactive health management. As awareness grows, the demand for effective chemotherapy solutions is expected to rise, creating opportunities for pharmaceutical companies to expand their offerings in this competitive market.

    Increasing Investment in Cancer Research

    The Chemotherapy Market is experiencing a surge in investment directed towards cancer research and development. Governments and private organizations are recognizing the urgent need to combat cancer, leading to increased funding for research initiatives. For instance, funding for cancer research in the United States has seen a steady rise, with the National Cancer Institute's budget reaching approximately 6.56 billion USD in recent years. This influx of capital is facilitating the exploration of new chemotherapy agents and treatment modalities. The Chemotherapy Market stands to benefit from these investments, as they enable the acceleration of clinical trials and the development of innovative therapies. Furthermore, collaborations between academic institutions and pharmaceutical companies are becoming more prevalent, fostering an environment conducive to groundbreaking discoveries. As research continues to advance, the market is likely to witness the introduction of novel chemotherapy options that could significantly improve patient outcomes.

    Regulatory Support and Approval Processes

    Regulatory support plays a pivotal role in shaping the Chemotherapy Market. Streamlined approval processes for new chemotherapy agents are encouraging pharmaceutical companies to invest in research and development. Regulatory agencies are increasingly adopting expedited pathways for promising therapies, which can significantly reduce the time it takes for new treatments to reach the market. This trend is particularly evident in the approval of breakthrough therapies and orphan drugs, which are designed to address unmet medical needs. The Chemotherapy Market is likely to benefit from these regulatory advancements, as they facilitate quicker access to innovative treatments for patients. Additionally, the emphasis on patient-centric approaches in regulatory frameworks is fostering a more responsive environment for drug development. As regulatory bodies continue to support the introduction of new therapies, the market is expected to expand, providing patients with a broader array of chemotherapy options.

    Market Segment Insights

    By Drug Class: Mitotic Inhibitors (Largest) vs. Antimetabolites (Fastest-Growing)

    <p>The Chemotherapy Market is characterized by a diverse array of drug classes, with Mitotic Inhibitors holding the largest market share. This category encompasses several pivotal agents that are essential in treating various malignancies by disrupting cell division. Following closely, Antimetabolites, which interfere with DNA and RNA synthesis, represent the fastest-growing segment. Increased prevalence of cancers and advancements in treatment protocols contribute to this growing demand. Analyzing the growth trajectory, Antimetabolites are gaining traction due to their effectiveness in targeted therapies, appealing to both clinicians and patients alike. The ongoing research into novel drug combinations and personalized medicine further propels this segment's growth. Moreover, supportive initiatives and increased healthcare expenditure are driving broader access to these vital medications, positioning Antimetabolites ahead in the competitive landscape.</p>

    <p>Mitotic Inhibitors (Dominant) vs. Topoisomerase Inhibitors (Emerging)</p>

    <p>Mitotic Inhibitors are recognized as the dominant drug class in the chemotherapy market, effectively targeting the mitotic spindle and thus halting cancer cell division. Their established clinical efficacy makes them a cornerstone in treating various solid tumors and hematological malignancies. In contrast, Topoisomerase Inhibitors are an emerging class that also holds significant potential, particularly for cancers known for rapid proliferation. These agents work by inducing breaks in DNA strands, leading to the death of rapidly dividing cells. Despite their emerging status, ongoing clinical trials and increasing adoption of Topoisomerase Inhibitors are expected to enhance their market presence significantly. As both classes continue to evolve, they represent critical components of modern oncological therapies.</p>

    By Indication: Breast Cancer (Largest) vs. Lung Cancer (Fastest-Growing)

    <p>In the chemotherapy market, breast cancer stands out as the largest indication, commanding a significant share due to its high prevalence and targeted treatment advancements. This segment has benefitted from continuous research and innovative therapies, making it the most addressed cancer type in oncology. Following closely, lung cancer is emerging as the fastest-growing segment, driven by increasing incidence rates and enhanced awareness around early detection and treatment options that have significantly improved patient outcomes.</p>

    <p>Breast Cancer (Dominant) vs. Lung Cancer (Emerging)</p>

    <p>Breast cancer remains the dominant indication in the chemotherapy market, primarily due to extensive funding and research focusing on personalized medicine and targeted therapies. The wide acceptance of newer agents and combination therapies has bolstered its market position. In contrast, lung cancer is rapidly emerging, with innovative treatment paradigms and breakthroughs in immunotherapy contributing to its growth. The rising incidence of lung cancer, driven by lifestyle changes and rising tobacco use in various regions, coupled with robust R&D efforts, positions it as a key focus area for pharmaceutical companies.</p>

    By Route of Drug Administration: Intravenous (Largest) vs. Oral (Fastest-Growing)

    <p>The chemotherapy market is significantly dominated by the intravenous route of drug administration, representing a substantial share due to its effectiveness and rapid onset of action in cancer treatment. On the other hand, the oral administration route is gaining popularity and is projected to capture an increasing portion of the market, reflecting a shift toward patient-friendly therapies that enhance compliance and convenience.</p>

    <p>Intravenous (Dominant) vs. Oral (Emerging)</p>

    <p>Intravenous administration remains the dominant route in chemotherapy, characterized by its ability to deliver high doses of medication directly into the bloodstream, ensuring effective and immediate results. This method is preferred for aggressive cancer treatments, making it a staple in oncology. Conversely, oral administration is emerging as a vital alternative, catering to patients seeking convenience and ease of use. This route enables patients to take medication at home, promoting adherence to treatment schedules and improving quality of life. As research continues to expand oral chemotherapeutics, its market presence is poised for significant growth.</p>

    By End-User: Specialty Centers (Largest) vs. Hospitals & Clinics (Fastest-Growing)

    <p>In the Chemotherapy Market, the distribution of market share among end-users reveals Specialty Centers as the largest segment, capitalizing on the increasing preference for specialized cancer treatment in dedicated facilities. These centers are equipped with advanced technologies and offer comprehensive services, making them the preferred choice for patients seeking quality care. Hospitals & Clinics, while smaller in share, are witnessing rapid growth due to their accessibility, integration into community healthcare systems, and the rising trend of outpatient chemotherapy services.</p>

    <p>Specialty Centers (Dominant) vs. Hospitals & Clinics (Emerging)</p>

    <p>Specialty Centers dominate the chemotherapy market due to their focus on tailored cancer treatments and patient care. These centers provide a wide range of specialized services, including cutting-edge therapies and personalized treatment plans, often leading to better patient outcomes. In contrast, Hospitals & Clinics are emerging as significant players, primarily driven by their ability to offer convenient and flexible treatment options for patients. This segment is on the rise as more clinics adopt oncology services, thus facilitating early diagnosis and timely chemotherapy administration. The collaboration between community hospitals and specialized centers enhances treatment pathways and expands access to chemotherapy.</p>

    Get more detailed insights about Chemotherapy Market Research Report -Forecast till 2035

    Regional Insights

    North America : Leading Market for Innovation

    North America is the largest market for chemotherapy, accounting for approximately 45% of the global share. The region benefits from advanced healthcare infrastructure, high R&D investments, and a growing prevalence of cancer. Regulatory support from agencies like the FDA accelerates the approval of new therapies, driving market growth. The increasing demand for personalized medicine and targeted therapies further fuels this expansion. The United States is the primary contributor, with significant market players such as Roche, Merck & Co., and Bristol-Myers Squibb leading the competitive landscape. Canada also plays a vital role, focusing on innovative treatment options and collaborations with pharmaceutical companies. The presence of key players and ongoing clinical trials enhances the region's position in The Chemotherapy.

    Europe : Emerging Regulatory Frameworks

    Europe is the second-largest market for chemotherapy, holding around 30% of the global share. The region is characterized by a robust regulatory framework that supports drug approval and market access. Countries like Germany and France are at the forefront, with increasing investments in healthcare and a rising incidence of cancer. The European Medicines Agency (EMA) plays a crucial role in facilitating the introduction of new therapies, which is a significant growth driver. Leading countries in Europe include Germany, France, and the UK, where major pharmaceutical companies like Novartis and AstraZeneca are actively involved. The competitive landscape is marked by collaborations between biotech firms and established players, enhancing innovation. The focus on patient-centric approaches and access to advanced therapies is shaping the future of the chemotherapy market in Europe.

    Asia-Pacific : Rapidly Growing Market Potential

    Asia-Pacific is witnessing rapid growth in the chemotherapy market, driven by increasing cancer prevalence and improving healthcare infrastructure. The region holds approximately 20% of the global market share, with countries like China and India leading the charge. Government initiatives aimed at enhancing healthcare access and affordability are significant catalysts for market expansion. The rising awareness of cancer treatment options is also contributing to demand growth. China is the largest market in the region, with a growing number of local and international players entering the market. India follows closely, focusing on affordable treatment solutions. The competitive landscape is evolving, with key players like Pfizer and Johnson & Johnson expanding their presence. The region's potential for growth is immense, supported by a young population and increasing investments in healthcare innovation.

    Middle East and Africa : Untapped Market Opportunities

    The Middle East and Africa (MEA) region is gradually emerging in the chemotherapy market, currently holding about 5% of the global share. The growth is driven by increasing cancer incidences and a rising demand for advanced treatment options. Countries like South Africa and the UAE are making strides in healthcare improvements, supported by government initiatives aimed at enhancing cancer care. The region's market is expected to grow as awareness and access to treatments improve. South Africa is the leading market in the MEA, with a growing number of healthcare facilities and partnerships with international pharmaceutical companies. The competitive landscape is characterized by a mix of local and global players, including Amgen and Eli Lilly. As healthcare infrastructure develops, the region is poised for significant growth in the chemotherapy sector, addressing the rising cancer burden.

    Key Players and Competitive Insights

    The Chemotherapy is characterized by a dynamic competitive landscape, driven by innovation, strategic partnerships, and a focus on patient-centric solutions. Major players such as Roche (CH), Bristol-Myers Squibb (US), and Merck & Co. (US) are at the forefront, each employing distinct strategies to enhance their market presence. Roche (CH) emphasizes a robust pipeline of targeted therapies, aiming to leverage precision medicine to improve treatment outcomes. Meanwhile, Bristol-Myers Squibb (US) focuses on expanding its immuno-oncology portfolio, which has shown promising results in clinical trials, thereby positioning itself as a leader in innovative cancer therapies. Merck & Co. (US) is also investing heavily in research and development, particularly in combination therapies that could potentially enhance the efficacy of existing chemotherapy agents.

    The business tactics employed by these companies reflect a concerted effort to optimize operations and enhance supply chain efficiencies. Localizing manufacturing has become a prevalent strategy, allowing companies to reduce costs and improve responsiveness to market demands. The Chemotherapy Market appears moderately fragmented, with a mix of established players and emerging biotech firms. This structure enables a competitive environment where innovation and strategic collaborations are paramount.

    In August 2025, Roche (CH) announced a strategic partnership with a leading biotech firm to co-develop a novel chemotherapy agent targeting specific cancer biomarkers. This collaboration is expected to accelerate the development timeline and enhance Roche's competitive edge in the precision oncology space. The significance of this partnership lies in its potential to bring forth therapies that are not only more effective but also tailored to individual patient profiles, thereby aligning with the growing trend towards personalized medicine.

    In September 2025, Bristol-Myers Squibb (US) launched a new clinical trial for a combination therapy that integrates its existing immunotherapy with traditional chemotherapy. This strategic move is indicative of the company's commitment to enhancing treatment efficacy and patient outcomes. By exploring synergistic effects, Bristol-Myers Squibb aims to solidify its position as a pioneer in the oncology sector, potentially reshaping treatment paradigms.

    Merck & Co. (US) has also made headlines recently; in October 2025, the company unveiled a new digital platform designed to streamline patient access to chemotherapy treatments. This initiative not only reflects Merck's commitment to digital transformation but also addresses the critical need for improved patient engagement and adherence to treatment protocols. The strategic importance of this platform lies in its potential to enhance patient outcomes through better management of treatment journeys.

    As of October 2025, the Chemotherapy Market is witnessing a shift towards digitalization, sustainability, and the integration of artificial intelligence in drug development and patient management. Strategic alliances are increasingly shaping the competitive landscape, fostering innovation and collaboration among key players. Looking ahead, it is likely that competitive differentiation will evolve, with a pronounced emphasis on innovation and technology rather than solely on price. Companies that can effectively leverage these trends will likely emerge as leaders in the market, driving forward the next generation of cancer therapies.

    Key Companies in the Chemotherapy Market market include

    Industry Developments

    August 2022:Ipsen announced the completion of the definitive merger agreement that would see Ipsen acquire Epizyme, Inc. (Epizyme). Tazverik (tazemetostat), a first-in-class, chemotherapy-free EZH2a inhibitor awarded Accelerated Approval by US Food and Drug Administration in 2020, is acquired by Ipsen as part of the agreement.

    September 2020:Gilead Sciences Inc announced a $21 billion acquisition of Immunomedics Inc, boosting its cancer portfolio by obtaining access to a promising medicine. The agreement grants Gilead access to Immunomedics' breast cancer treatment medicine Trodelvy, which received fast FDA approval in April for an aggressive and difficult-to-treat kind of breast cancer.

    Future Outlook

    Chemotherapy Market Future Outlook

    <p>The Chemotherapy Market is projected to grow at a 7.42% CAGR from 2024 to 2035, driven by advancements in drug formulations, increasing cancer prevalence, and enhanced healthcare infrastructure.</p>

    New opportunities lie in:

    • <p>Development of personalized chemotherapy regimens using genomic profiling.</p>
    • <p>Expansion of telehealth services for remote chemotherapy monitoring.</p>
    • <p>Investment in AI-driven drug discovery platforms for faster treatment development.</p>

    <p>By 2035, the Chemotherapy Market is expected to achieve substantial growth, reflecting evolving treatment paradigms.</p>

    Market Segmentation

    Chemotherapy Market End-User Outlook

    • Specialty Centers
    • Hospitals & Clinics

    Chemotherapy Market Drug Class Outlook

    • Mitotic Inhibitors
    • Alkylating Agents
    • Antimetabolites
    • Topoisomerase Inhibitors
    • Antitumor Antibiotics

    Chemotherapy Market Indication Outlook

    • Breast Cancer
    • Lung Cancer
    • Colorectal Cancer
    • Prostate Cancer
    • Stomach Cancer
    • Lymphoma
    • Leukemia
    • Ovarian Cancer

    Chemotherapy Market Route of Drug Administration Outlook

    • Intravenous
    • Oral
    • Subcutaneous
    • Intra-Muscular
    • Intravesicular
    • Topical
    • Intraperitoneal
    • Intraventricular/Intrathecal

    Report Scope

    MARKET SIZE 20249.55(USD Billion)
    MARKET SIZE 202510.26(USD Billion)
    MARKET SIZE 203520.99(USD Billion)
    COMPOUND ANNUAL GROWTH RATE (CAGR)7.42% (2024 - 2035)
    REPORT COVERAGERevenue Forecast, Competitive Landscape, Growth Factors, and Trends
    BASE YEAR2024
    Market Forecast Period2025 - 2035
    Historical Data2019 - 2024
    Market Forecast UnitsUSD Billion
    Key Companies ProfiledMarket analysis in progress
    Segments CoveredMarket segmentation analysis in progress
    Key Market OpportunitiesAdvancements in personalized medicine enhance treatment efficacy in the Chemotherapy Market.
    Key Market DynamicsRising demand for personalized medicine drives innovation and competition in the chemotherapy market.
    Countries CoveredNorth America, Europe, APAC, South America, MEA

    FAQs

    What is the current valuation of the Chemotherapy Market as of 2024?

    The Chemotherapy Market was valued at 9.55 USD Billion in 2024.

    What is the projected market valuation for the Chemotherapy Market in 2035?

    The Chemotherapy Market is projected to reach 20.99 USD Billion by 2035.

    What is the expected CAGR for the Chemotherapy Market during the forecast period 2025 - 2035?

    The expected CAGR for the Chemotherapy Market during the forecast period 2025 - 2035 is 7.42%.

    Which drug class segment is projected to have the highest valuation by 2035?

    The Antimetabolites segment is projected to reach 5.75 USD Billion by 2035.

    How does the valuation of Breast Cancer treatment compare to Lung Cancer treatment in 2035?

    By 2035, Breast Cancer treatment is projected to be valued at 4.25 USD Billion, while Lung Cancer treatment is expected to reach 4.75 USD Billion.

    What are the projected valuations for the Intravenous and Oral routes of drug administration by 2035?

    The Intravenous route is projected to reach 7.5 USD Billion, while the Oral route is expected to reach 4.5 USD Billion by 2035.

    1. SECTION I: EXECUTIVE SUMMARY AND KEY HIGHLIGHTS
      1. | 1.1 EXECUTIVE SUMMARY
      2. | | 1.1.1 Market Overview
      3. | | 1.1.2 Key Findings
      4. | | 1.1.3 Market Segmentation
      5. | | 1.1.4 Competitive Landscape
      6. | | 1.1.5 Challenges and Opportunities
      7. | | 1.1.6 Future Outlook
    2. SECTION II: SCOPING, METHODOLOGY AND MARKET STRUCTURE
      1. | 2.1 MARKET INTRODUCTION
      2. | | 2.1.1 Definition
      3. | | 2.1.2 Scope of the study
      4. | | | 2.1.2.1 Research Objective
      5. | | | 2.1.2.2 Assumption
      6. | | | 2.1.2.3 Limitations
      7. | 2.2 RESEARCH METHODOLOGY
      8. | | 2.2.1 Overview
      9. | | 2.2.2 Data Mining
      10. | | 2.2.3 Secondary Research
      11. | | 2.2.4 Primary Research
      12. | | | 2.2.4.1 Primary Interviews and Information Gathering Process
      13. | | | 2.2.4.2 Breakdown of Primary Respondents
      14. | | 2.2.5 Forecasting Model
      15. | | 2.2.6 Market Size Estimation
      16. | | | 2.2.6.1 Bottom-Up Approach
      17. | | | 2.2.6.2 Top-Down Approach
      18. | | 2.2.7 Data Triangulation
      19. | | 2.2.8 Validation
    3. SECTION III: QUALITATIVE ANALYSIS
      1. | 3.1 MARKET DYNAMICS
      2. | | 3.1.1 Overview
      3. | | 3.1.2 Drivers
      4. | | 3.1.3 Restraints
      5. | | 3.1.4 Opportunities
      6. | 3.2 MARKET FACTOR ANALYSIS
      7. | | 3.2.1 Value chain Analysis
      8. | | 3.2.2 Porter's Five Forces Analysis
      9. | | | 3.2.2.1 Bargaining Power of Suppliers
      10. | | | 3.2.2.2 Bargaining Power of Buyers
      11. | | | 3.2.2.3 Threat of New Entrants
      12. | | | 3.2.2.4 Threat of Substitutes
      13. | | | 3.2.2.5 Intensity of Rivalry
      14. | | 3.2.3 COVID-19 Impact Analysis
      15. | | | 3.2.3.1 Market Impact Analysis
      16. | | | 3.2.3.2 Regional Impact
      17. | | | 3.2.3.3 Opportunity and Threat Analysis
    4. SECTION IV: QUANTITATIVE ANALYSIS
      1. | 4.1 Healthcare, BY Drug Class (USD Billion)
      2. | | 4.1.1 Mitotic Inhibitors
      3. | | 4.1.2 Alkylating Agents
      4. | | 4.1.3 Antimetabolites
      5. | | 4.1.4 Topoisomerase Inhibitors
      6. | | 4.1.5 Antitumor Antibiotics
      7. | 4.2 Healthcare, BY Indication (USD Billion)
      8. | | 4.2.1 Breast Cancer
      9. | | 4.2.2 Lung Cancer
      10. | | 4.2.3 Colorectal Cancer
      11. | | 4.2.4 Prostate Cancer
      12. | | 4.2.5 Stomach Cancer
      13. | | 4.2.6 Lymphoma
      14. | | 4.2.7 Leukemia
      15. | | 4.2.8 Ovarian Cancer
      16. | 4.3 Healthcare, BY Route of Drug Administration (USD Billion)
      17. | | 4.3.1 Intravenous
      18. | | 4.3.2 Oral
      19. | | 4.3.3 Subcutaneous
      20. | | 4.3.4 Intra-Muscular
      21. | | 4.3.5 Intravesicular
      22. | | 4.3.6 Topical
      23. | | 4.3.7 Intraperitoneal
      24. | | 4.3.8 Intraventricular/Intrathecal
      25. | 4.4 Healthcare, BY End-User (USD Billion)
      26. | | 4.4.1 Specialty Centers
      27. | | 4.4.2 Hospitals & Clinics
      28. | 4.5 Healthcare, BY Region (USD Billion)
      29. | | 4.5.1 North America
      30. | | | 4.5.1.1 US
      31. | | | 4.5.1.2 Canada
      32. | | 4.5.2 Europe
      33. | | | 4.5.2.1 Germany
      34. | | | 4.5.2.2 UK
      35. | | | 4.5.2.3 France
      36. | | | 4.5.2.4 Russia
      37. | | | 4.5.2.5 Italy
      38. | | | 4.5.2.6 Spain
      39. | | | 4.5.2.7 Rest of Europe
      40. | | 4.5.3 APAC
      41. | | | 4.5.3.1 China
      42. | | | 4.5.3.2 India
      43. | | | 4.5.3.3 Japan
      44. | | | 4.5.3.4 South Korea
      45. | | | 4.5.3.5 Malaysia
      46. | | | 4.5.3.6 Thailand
      47. | | | 4.5.3.7 Indonesia
      48. | | | 4.5.3.8 Rest of APAC
      49. | | 4.5.4 South America
      50. | | | 4.5.4.1 Brazil
      51. | | | 4.5.4.2 Mexico
      52. | | | 4.5.4.3 Argentina
      53. | | | 4.5.4.4 Rest of South America
      54. | | 4.5.5 MEA
      55. | | | 4.5.5.1 GCC Countries
      56. | | | 4.5.5.2 South Africa
      57. | | | 4.5.5.3 Rest of MEA
    5. SECTION V: COMPETITIVE ANALYSIS
      1. | 5.1 Competitive Landscape
      2. | | 5.1.1 Overview
      3. | | 5.1.2 Competitive Analysis
      4. | | 5.1.3 Market share Analysis
      5. | | 5.1.4 Major Growth Strategy in the Healthcare
      6. | | 5.1.5 Competitive Benchmarking
      7. | | 5.1.6 Leading Players in Terms of Number of Developments in the Healthcare
      8. | | 5.1.7 Key developments and growth strategies
      9. | | | 5.1.7.1 New Product Launch/Service Deployment
      10. | | | 5.1.7.2 Merger & Acquisitions
      11. | | | 5.1.7.3 Joint Ventures
      12. | | 5.1.8 Major Players Financial Matrix
      13. | | | 5.1.8.1 Sales and Operating Income
      14. | | | 5.1.8.2 Major Players R&D Expenditure. 2023
      15. | 5.2 Company Profiles
      16. | | 5.2.1 Roche (CH)
      17. | | | 5.2.1.1 Financial Overview
      18. | | | 5.2.1.2 Products Offered
      19. | | | 5.2.1.3 Key Developments
      20. | | | 5.2.1.4 SWOT Analysis
      21. | | | 5.2.1.5 Key Strategies
      22. | | 5.2.2 Bristol-Myers Squibb (US)
      23. | | | 5.2.2.1 Financial Overview
      24. | | | 5.2.2.2 Products Offered
      25. | | | 5.2.2.3 Key Developments
      26. | | | 5.2.2.4 SWOT Analysis
      27. | | | 5.2.2.5 Key Strategies
      28. | | 5.2.3 Merck & Co. (US)
      29. | | | 5.2.3.1 Financial Overview
      30. | | | 5.2.3.2 Products Offered
      31. | | | 5.2.3.3 Key Developments
      32. | | | 5.2.3.4 SWOT Analysis
      33. | | | 5.2.3.5 Key Strategies
      34. | | 5.2.4 Novartis (CH)
      35. | | | 5.2.4.1 Financial Overview
      36. | | | 5.2.4.2 Products Offered
      37. | | | 5.2.4.3 Key Developments
      38. | | | 5.2.4.4 SWOT Analysis
      39. | | | 5.2.4.5 Key Strategies
      40. | | 5.2.5 Pfizer (US)
      41. | | | 5.2.5.1 Financial Overview
      42. | | | 5.2.5.2 Products Offered
      43. | | | 5.2.5.3 Key Developments
      44. | | | 5.2.5.4 SWOT Analysis
      45. | | | 5.2.5.5 Key Strategies
      46. | | 5.2.6 Johnson & Johnson (US)
      47. | | | 5.2.6.1 Financial Overview
      48. | | | 5.2.6.2 Products Offered
      49. | | | 5.2.6.3 Key Developments
      50. | | | 5.2.6.4 SWOT Analysis
      51. | | | 5.2.6.5 Key Strategies
      52. | | 5.2.7 Amgen (US)
      53. | | | 5.2.7.1 Financial Overview
      54. | | | 5.2.7.2 Products Offered
      55. | | | 5.2.7.3 Key Developments
      56. | | | 5.2.7.4 SWOT Analysis
      57. | | | 5.2.7.5 Key Strategies
      58. | | 5.2.8 Eli Lilly and Company (US)
      59. | | | 5.2.8.1 Financial Overview
      60. | | | 5.2.8.2 Products Offered
      61. | | | 5.2.8.3 Key Developments
      62. | | | 5.2.8.4 SWOT Analysis
      63. | | | 5.2.8.5 Key Strategies
      64. | | 5.2.9 AstraZeneca (GB)
      65. | | | 5.2.9.1 Financial Overview
      66. | | | 5.2.9.2 Products Offered
      67. | | | 5.2.9.3 Key Developments
      68. | | | 5.2.9.4 SWOT Analysis
      69. | | | 5.2.9.5 Key Strategies
      70. | 5.3 Appendix
      71. | | 5.3.1 References
      72. | | 5.3.2 Related Reports
    6. LIST OF FIGURES
      1. | 6.1 MARKET SYNOPSIS
      2. | 6.2 NORTH AMERICA MARKET ANALYSIS
      3. | 6.3 US MARKET ANALYSIS BY DRUG CLASS
      4. | 6.4 US MARKET ANALYSIS BY INDICATION
      5. | 6.5 US MARKET ANALYSIS BY ROUTE OF DRUG ADMINISTRATION
      6. | 6.6 US MARKET ANALYSIS BY END-USER
      7. | 6.7 CANADA MARKET ANALYSIS BY DRUG CLASS
      8. | 6.8 CANADA MARKET ANALYSIS BY INDICATION
      9. | 6.9 CANADA MARKET ANALYSIS BY ROUTE OF DRUG ADMINISTRATION
      10. | 6.10 CANADA MARKET ANALYSIS BY END-USER
      11. | 6.11 EUROPE MARKET ANALYSIS
      12. | 6.12 GERMANY MARKET ANALYSIS BY DRUG CLASS
      13. | 6.13 GERMANY MARKET ANALYSIS BY INDICATION
      14. | 6.14 GERMANY MARKET ANALYSIS BY ROUTE OF DRUG ADMINISTRATION
      15. | 6.15 GERMANY MARKET ANALYSIS BY END-USER
      16. | 6.16 UK MARKET ANALYSIS BY DRUG CLASS
      17. | 6.17 UK MARKET ANALYSIS BY INDICATION
      18. | 6.18 UK MARKET ANALYSIS BY ROUTE OF DRUG ADMINISTRATION
      19. | 6.19 UK MARKET ANALYSIS BY END-USER
      20. | 6.20 FRANCE MARKET ANALYSIS BY DRUG CLASS
      21. | 6.21 FRANCE MARKET ANALYSIS BY INDICATION
      22. | 6.22 FRANCE MARKET ANALYSIS BY ROUTE OF DRUG ADMINISTRATION
      23. | 6.23 FRANCE MARKET ANALYSIS BY END-USER
      24. | 6.24 RUSSIA MARKET ANALYSIS BY DRUG CLASS
      25. | 6.25 RUSSIA MARKET ANALYSIS BY INDICATION
      26. | 6.26 RUSSIA MARKET ANALYSIS BY ROUTE OF DRUG ADMINISTRATION
      27. | 6.27 RUSSIA MARKET ANALYSIS BY END-USER
      28. | 6.28 ITALY MARKET ANALYSIS BY DRUG CLASS
      29. | 6.29 ITALY MARKET ANALYSIS BY INDICATION
      30. | 6.30 ITALY MARKET ANALYSIS BY ROUTE OF DRUG ADMINISTRATION
      31. | 6.31 ITALY MARKET ANALYSIS BY END-USER
      32. | 6.32 SPAIN MARKET ANALYSIS BY DRUG CLASS
      33. | 6.33 SPAIN MARKET ANALYSIS BY INDICATION
      34. | 6.34 SPAIN MARKET ANALYSIS BY ROUTE OF DRUG ADMINISTRATION
      35. | 6.35 SPAIN MARKET ANALYSIS BY END-USER
      36. | 6.36 REST OF EUROPE MARKET ANALYSIS BY DRUG CLASS
      37. | 6.37 REST OF EUROPE MARKET ANALYSIS BY INDICATION
      38. | 6.38 REST OF EUROPE MARKET ANALYSIS BY ROUTE OF DRUG ADMINISTRATION
      39. | 6.39 REST OF EUROPE MARKET ANALYSIS BY END-USER
      40. | 6.40 APAC MARKET ANALYSIS
      41. | 6.41 CHINA MARKET ANALYSIS BY DRUG CLASS
      42. | 6.42 CHINA MARKET ANALYSIS BY INDICATION
      43. | 6.43 CHINA MARKET ANALYSIS BY ROUTE OF DRUG ADMINISTRATION
      44. | 6.44 CHINA MARKET ANALYSIS BY END-USER
      45. | 6.45 INDIA MARKET ANALYSIS BY DRUG CLASS
      46. | 6.46 INDIA MARKET ANALYSIS BY INDICATION
      47. | 6.47 INDIA MARKET ANALYSIS BY ROUTE OF DRUG ADMINISTRATION
      48. | 6.48 INDIA MARKET ANALYSIS BY END-USER
      49. | 6.49 JAPAN MARKET ANALYSIS BY DRUG CLASS
      50. | 6.50 JAPAN MARKET ANALYSIS BY INDICATION
      51. | 6.51 JAPAN MARKET ANALYSIS BY ROUTE OF DRUG ADMINISTRATION
      52. | 6.52 JAPAN MARKET ANALYSIS BY END-USER
      53. | 6.53 SOUTH KOREA MARKET ANALYSIS BY DRUG CLASS
      54. | 6.54 SOUTH KOREA MARKET ANALYSIS BY INDICATION
      55. | 6.55 SOUTH KOREA MARKET ANALYSIS BY ROUTE OF DRUG ADMINISTRATION
      56. | 6.56 SOUTH KOREA MARKET ANALYSIS BY END-USER
      57. | 6.57 MALAYSIA MARKET ANALYSIS BY DRUG CLASS
      58. | 6.58 MALAYSIA MARKET ANALYSIS BY INDICATION
      59. | 6.59 MALAYSIA MARKET ANALYSIS BY ROUTE OF DRUG ADMINISTRATION
      60. | 6.60 MALAYSIA MARKET ANALYSIS BY END-USER
      61. | 6.61 THAILAND MARKET ANALYSIS BY DRUG CLASS
      62. | 6.62 THAILAND MARKET ANALYSIS BY INDICATION
      63. | 6.63 THAILAND MARKET ANALYSIS BY ROUTE OF DRUG ADMINISTRATION
      64. | 6.64 THAILAND MARKET ANALYSIS BY END-USER
      65. | 6.65 INDONESIA MARKET ANALYSIS BY DRUG CLASS
      66. | 6.66 INDONESIA MARKET ANALYSIS BY INDICATION
      67. | 6.67 INDONESIA MARKET ANALYSIS BY ROUTE OF DRUG ADMINISTRATION
      68. | 6.68 INDONESIA MARKET ANALYSIS BY END-USER
      69. | 6.69 REST OF APAC MARKET ANALYSIS BY DRUG CLASS
      70. | 6.70 REST OF APAC MARKET ANALYSIS BY INDICATION
      71. | 6.71 REST OF APAC MARKET ANALYSIS BY ROUTE OF DRUG ADMINISTRATION
      72. | 6.72 REST OF APAC MARKET ANALYSIS BY END-USER
      73. | 6.73 SOUTH AMERICA MARKET ANALYSIS
      74. | 6.74 BRAZIL MARKET ANALYSIS BY DRUG CLASS
      75. | 6.75 BRAZIL MARKET ANALYSIS BY INDICATION
      76. | 6.76 BRAZIL MARKET ANALYSIS BY ROUTE OF DRUG ADMINISTRATION
      77. | 6.77 BRAZIL MARKET ANALYSIS BY END-USER
      78. | 6.78 MEXICO MARKET ANALYSIS BY DRUG CLASS
      79. | 6.79 MEXICO MARKET ANALYSIS BY INDICATION
      80. | 6.80 MEXICO MARKET ANALYSIS BY ROUTE OF DRUG ADMINISTRATION
      81. | 6.81 MEXICO MARKET ANALYSIS BY END-USER
      82. | 6.82 ARGENTINA MARKET ANALYSIS BY DRUG CLASS
      83. | 6.83 ARGENTINA MARKET ANALYSIS BY INDICATION
      84. | 6.84 ARGENTINA MARKET ANALYSIS BY ROUTE OF DRUG ADMINISTRATION
      85. | 6.85 ARGENTINA MARKET ANALYSIS BY END-USER
      86. | 6.86 REST OF SOUTH AMERICA MARKET ANALYSIS BY DRUG CLASS
      87. | 6.87 REST OF SOUTH AMERICA MARKET ANALYSIS BY INDICATION
      88. | 6.88 REST OF SOUTH AMERICA MARKET ANALYSIS BY ROUTE OF DRUG ADMINISTRATION
      89. | 6.89 REST OF SOUTH AMERICA MARKET ANALYSIS BY END-USER
      90. | 6.90 MEA MARKET ANALYSIS
      91. | 6.91 GCC COUNTRIES MARKET ANALYSIS BY DRUG CLASS
      92. | 6.92 GCC COUNTRIES MARKET ANALYSIS BY INDICATION
      93. | 6.93 GCC COUNTRIES MARKET ANALYSIS BY ROUTE OF DRUG ADMINISTRATION
      94. | 6.94 GCC COUNTRIES MARKET ANALYSIS BY END-USER
      95. | 6.95 SOUTH AFRICA MARKET ANALYSIS BY DRUG CLASS
      96. | 6.96 SOUTH AFRICA MARKET ANALYSIS BY INDICATION
      97. | 6.97 SOUTH AFRICA MARKET ANALYSIS BY ROUTE OF DRUG ADMINISTRATION
      98. | 6.98 SOUTH AFRICA MARKET ANALYSIS BY END-USER
      99. | 6.99 REST OF MEA MARKET ANALYSIS BY DRUG CLASS
      100. | 6.100 REST OF MEA MARKET ANALYSIS BY INDICATION
      101. | 6.101 REST OF MEA MARKET ANALYSIS BY ROUTE OF DRUG ADMINISTRATION
      102. | 6.102 REST OF MEA MARKET ANALYSIS BY END-USER
      103. | 6.103 KEY BUYING CRITERIA OF HEALTHCARE
      104. | 6.104 RESEARCH PROCESS OF MRFR
      105. | 6.105 DRO ANALYSIS OF HEALTHCARE
      106. | 6.106 DRIVERS IMPACT ANALYSIS: HEALTHCARE
      107. | 6.107 RESTRAINTS IMPACT ANALYSIS: HEALTHCARE
      108. | 6.108 SUPPLY / VALUE CHAIN: HEALTHCARE
      109. | 6.109 HEALTHCARE, BY DRUG CLASS, 2024 (% SHARE)
      110. | 6.110 HEALTHCARE, BY DRUG CLASS, 2024 TO 2035 (USD Billion)
      111. | 6.111 HEALTHCARE, BY INDICATION, 2024 (% SHARE)
      112. | 6.112 HEALTHCARE, BY INDICATION, 2024 TO 2035 (USD Billion)
      113. | 6.113 HEALTHCARE, BY ROUTE OF DRUG ADMINISTRATION, 2024 (% SHARE)
      114. | 6.114 HEALTHCARE, BY ROUTE OF DRUG ADMINISTRATION, 2024 TO 2035 (USD Billion)
      115. | 6.115 HEALTHCARE, BY END-USER, 2024 (% SHARE)
      116. | 6.116 HEALTHCARE, BY END-USER, 2024 TO 2035 (USD Billion)
      117. | 6.117 BENCHMARKING OF MAJOR COMPETITORS
    7. LIST OF TABLES
      1. | 7.1 LIST OF ASSUMPTIONS
      2. | | 7.1.1
      3. | 7.2 North America MARKET SIZE ESTIMATES; FORECAST
      4. | | 7.2.1 BY DRUG CLASS, 2025-2035 (USD Billion)
      5. | | 7.2.2 BY INDICATION, 2025-2035 (USD Billion)
      6. | | 7.2.3 BY ROUTE OF DRUG ADMINISTRATION, 2025-2035 (USD Billion)
      7. | | 7.2.4 BY END-USER, 2025-2035 (USD Billion)
      8. | 7.3 US MARKET SIZE ESTIMATES; FORECAST
      9. | | 7.3.1 BY DRUG CLASS, 2025-2035 (USD Billion)
      10. | | 7.3.2 BY INDICATION, 2025-2035 (USD Billion)
      11. | | 7.3.3 BY ROUTE OF DRUG ADMINISTRATION, 2025-2035 (USD Billion)
      12. | | 7.3.4 BY END-USER, 2025-2035 (USD Billion)
      13. | 7.4 Canada MARKET SIZE ESTIMATES; FORECAST
      14. | | 7.4.1 BY DRUG CLASS, 2025-2035 (USD Billion)
      15. | | 7.4.2 BY INDICATION, 2025-2035 (USD Billion)
      16. | | 7.4.3 BY ROUTE OF DRUG ADMINISTRATION, 2025-2035 (USD Billion)
      17. | | 7.4.4 BY END-USER, 2025-2035 (USD Billion)
      18. | 7.5 Europe MARKET SIZE ESTIMATES; FORECAST
      19. | | 7.5.1 BY DRUG CLASS, 2025-2035 (USD Billion)
      20. | | 7.5.2 BY INDICATION, 2025-2035 (USD Billion)
      21. | | 7.5.3 BY ROUTE OF DRUG ADMINISTRATION, 2025-2035 (USD Billion)
      22. | | 7.5.4 BY END-USER, 2025-2035 (USD Billion)
      23. | 7.6 Germany MARKET SIZE ESTIMATES; FORECAST
      24. | | 7.6.1 BY DRUG CLASS, 2025-2035 (USD Billion)
      25. | | 7.6.2 BY INDICATION, 2025-2035 (USD Billion)
      26. | | 7.6.3 BY ROUTE OF DRUG ADMINISTRATION, 2025-2035 (USD Billion)
      27. | | 7.6.4 BY END-USER, 2025-2035 (USD Billion)
      28. | 7.7 UK MARKET SIZE ESTIMATES; FORECAST
      29. | | 7.7.1 BY DRUG CLASS, 2025-2035 (USD Billion)
      30. | | 7.7.2 BY INDICATION, 2025-2035 (USD Billion)
      31. | | 7.7.3 BY ROUTE OF DRUG ADMINISTRATION, 2025-2035 (USD Billion)
      32. | | 7.7.4 BY END-USER, 2025-2035 (USD Billion)
      33. | 7.8 France MARKET SIZE ESTIMATES; FORECAST
      34. | | 7.8.1 BY DRUG CLASS, 2025-2035 (USD Billion)
      35. | | 7.8.2 BY INDICATION, 2025-2035 (USD Billion)
      36. | | 7.8.3 BY ROUTE OF DRUG ADMINISTRATION, 2025-2035 (USD Billion)
      37. | | 7.8.4 BY END-USER, 2025-2035 (USD Billion)
      38. | 7.9 Russia MARKET SIZE ESTIMATES; FORECAST
      39. | | 7.9.1 BY DRUG CLASS, 2025-2035 (USD Billion)
      40. | | 7.9.2 BY INDICATION, 2025-2035 (USD Billion)
      41. | | 7.9.3 BY ROUTE OF DRUG ADMINISTRATION, 2025-2035 (USD Billion)
      42. | | 7.9.4 BY END-USER, 2025-2035 (USD Billion)
      43. | 7.10 Italy MARKET SIZE ESTIMATES; FORECAST
      44. | | 7.10.1 BY DRUG CLASS, 2025-2035 (USD Billion)
      45. | | 7.10.2 BY INDICATION, 2025-2035 (USD Billion)
      46. | | 7.10.3 BY ROUTE OF DRUG ADMINISTRATION, 2025-2035 (USD Billion)
      47. | | 7.10.4 BY END-USER, 2025-2035 (USD Billion)
      48. | 7.11 Spain MARKET SIZE ESTIMATES; FORECAST
      49. | | 7.11.1 BY DRUG CLASS, 2025-2035 (USD Billion)
      50. | | 7.11.2 BY INDICATION, 2025-2035 (USD Billion)
      51. | | 7.11.3 BY ROUTE OF DRUG ADMINISTRATION, 2025-2035 (USD Billion)
      52. | | 7.11.4 BY END-USER, 2025-2035 (USD Billion)
      53. | 7.12 Rest of Europe MARKET SIZE ESTIMATES; FORECAST
      54. | | 7.12.1 BY DRUG CLASS, 2025-2035 (USD Billion)
      55. | | 7.12.2 BY INDICATION, 2025-2035 (USD Billion)
      56. | | 7.12.3 BY ROUTE OF DRUG ADMINISTRATION, 2025-2035 (USD Billion)
      57. | | 7.12.4 BY END-USER, 2025-2035 (USD Billion)
      58. | 7.13 APAC MARKET SIZE ESTIMATES; FORECAST
      59. | | 7.13.1 BY DRUG CLASS, 2025-2035 (USD Billion)
      60. | | 7.13.2 BY INDICATION, 2025-2035 (USD Billion)
      61. | | 7.13.3 BY ROUTE OF DRUG ADMINISTRATION, 2025-2035 (USD Billion)
      62. | | 7.13.4 BY END-USER, 2025-2035 (USD Billion)
      63. | 7.14 China MARKET SIZE ESTIMATES; FORECAST
      64. | | 7.14.1 BY DRUG CLASS, 2025-2035 (USD Billion)
      65. | | 7.14.2 BY INDICATION, 2025-2035 (USD Billion)
      66. | | 7.14.3 BY ROUTE OF DRUG ADMINISTRATION, 2025-2035 (USD Billion)
      67. | | 7.14.4 BY END-USER, 2025-2035 (USD Billion)
      68. | 7.15 India MARKET SIZE ESTIMATES; FORECAST
      69. | | 7.15.1 BY DRUG CLASS, 2025-2035 (USD Billion)
      70. | | 7.15.2 BY INDICATION, 2025-2035 (USD Billion)
      71. | | 7.15.3 BY ROUTE OF DRUG ADMINISTRATION, 2025-2035 (USD Billion)
      72. | | 7.15.4 BY END-USER, 2025-2035 (USD Billion)
      73. | 7.16 Japan MARKET SIZE ESTIMATES; FORECAST
      74. | | 7.16.1 BY DRUG CLASS, 2025-2035 (USD Billion)
      75. | | 7.16.2 BY INDICATION, 2025-2035 (USD Billion)
      76. | | 7.16.3 BY ROUTE OF DRUG ADMINISTRATION, 2025-2035 (USD Billion)
      77. | | 7.16.4 BY END-USER, 2025-2035 (USD Billion)
      78. | 7.17 South Korea MARKET SIZE ESTIMATES; FORECAST
      79. | | 7.17.1 BY DRUG CLASS, 2025-2035 (USD Billion)
      80. | | 7.17.2 BY INDICATION, 2025-2035 (USD Billion)
      81. | | 7.17.3 BY ROUTE OF DRUG ADMINISTRATION, 2025-2035 (USD Billion)
      82. | | 7.17.4 BY END-USER, 2025-2035 (USD Billion)
      83. | 7.18 Malaysia MARKET SIZE ESTIMATES; FORECAST
      84. | | 7.18.1 BY DRUG CLASS, 2025-2035 (USD Billion)
      85. | | 7.18.2 BY INDICATION, 2025-2035 (USD Billion)
      86. | | 7.18.3 BY ROUTE OF DRUG ADMINISTRATION, 2025-2035 (USD Billion)
      87. | | 7.18.4 BY END-USER, 2025-2035 (USD Billion)
      88. | 7.19 Thailand MARKET SIZE ESTIMATES; FORECAST
      89. | | 7.19.1 BY DRUG CLASS, 2025-2035 (USD Billion)
      90. | | 7.19.2 BY INDICATION, 2025-2035 (USD Billion)
      91. | | 7.19.3 BY ROUTE OF DRUG ADMINISTRATION, 2025-2035 (USD Billion)
      92. | | 7.19.4 BY END-USER, 2025-2035 (USD Billion)
      93. | 7.20 Indonesia MARKET SIZE ESTIMATES; FORECAST
      94. | | 7.20.1 BY DRUG CLASS, 2025-2035 (USD Billion)
      95. | | 7.20.2 BY INDICATION, 2025-2035 (USD Billion)
      96. | | 7.20.3 BY ROUTE OF DRUG ADMINISTRATION, 2025-2035 (USD Billion)
      97. | | 7.20.4 BY END-USER, 2025-2035 (USD Billion)
      98. | 7.21 Rest of APAC MARKET SIZE ESTIMATES; FORECAST
      99. | | 7.21.1 BY DRUG CLASS, 2025-2035 (USD Billion)
      100. | | 7.21.2 BY INDICATION, 2025-2035 (USD Billion)
      101. | | 7.21.3 BY ROUTE OF DRUG ADMINISTRATION, 2025-2035 (USD Billion)
      102. | | 7.21.4 BY END-USER, 2025-2035 (USD Billion)
      103. | 7.22 South America MARKET SIZE ESTIMATES; FORECAST
      104. | | 7.22.1 BY DRUG CLASS, 2025-2035 (USD Billion)
      105. | | 7.22.2 BY INDICATION, 2025-2035 (USD Billion)
      106. | | 7.22.3 BY ROUTE OF DRUG ADMINISTRATION, 2025-2035 (USD Billion)
      107. | | 7.22.4 BY END-USER, 2025-2035 (USD Billion)
      108. | 7.23 Brazil MARKET SIZE ESTIMATES; FORECAST
      109. | | 7.23.1 BY DRUG CLASS, 2025-2035 (USD Billion)
      110. | | 7.23.2 BY INDICATION, 2025-2035 (USD Billion)
      111. | | 7.23.3 BY ROUTE OF DRUG ADMINISTRATION, 2025-2035 (USD Billion)
      112. | | 7.23.4 BY END-USER, 2025-2035 (USD Billion)
      113. | 7.24 Mexico MARKET SIZE ESTIMATES; FORECAST
      114. | | 7.24.1 BY DRUG CLASS, 2025-2035 (USD Billion)
      115. | | 7.24.2 BY INDICATION, 2025-2035 (USD Billion)
      116. | | 7.24.3 BY ROUTE OF DRUG ADMINISTRATION, 2025-2035 (USD Billion)
      117. | | 7.24.4 BY END-USER, 2025-2035 (USD Billion)
      118. | 7.25 Argentina MARKET SIZE ESTIMATES; FORECAST
      119. | | 7.25.1 BY DRUG CLASS, 2025-2035 (USD Billion)
      120. | | 7.25.2 BY INDICATION, 2025-2035 (USD Billion)
      121. | | 7.25.3 BY ROUTE OF DRUG ADMINISTRATION, 2025-2035 (USD Billion)
      122. | | 7.25.4 BY END-USER, 2025-2035 (USD Billion)
      123. | 7.26 Rest of South America MARKET SIZE ESTIMATES; FORECAST
      124. | | 7.26.1 BY DRUG CLASS, 2025-2035 (USD Billion)
      125. | | 7.26.2 BY INDICATION, 2025-2035 (USD Billion)
      126. | | 7.26.3 BY ROUTE OF DRUG ADMINISTRATION, 2025-2035 (USD Billion)
      127. | | 7.26.4 BY END-USER, 2025-2035 (USD Billion)
      128. | 7.27 MEA MARKET SIZE ESTIMATES; FORECAST
      129. | | 7.27.1 BY DRUG CLASS, 2025-2035 (USD Billion)
      130. | | 7.27.2 BY INDICATION, 2025-2035 (USD Billion)
      131. | | 7.27.3 BY ROUTE OF DRUG ADMINISTRATION, 2025-2035 (USD Billion)
      132. | | 7.27.4 BY END-USER, 2025-2035 (USD Billion)
      133. | 7.28 GCC Countries MARKET SIZE ESTIMATES; FORECAST
      134. | | 7.28.1 BY DRUG CLASS, 2025-2035 (USD Billion)
      135. | | 7.28.2 BY INDICATION, 2025-2035 (USD Billion)
      136. | | 7.28.3 BY ROUTE OF DRUG ADMINISTRATION, 2025-2035 (USD Billion)
      137. | | 7.28.4 BY END-USER, 2025-2035 (USD Billion)
      138. | 7.29 South Africa MARKET SIZE ESTIMATES; FORECAST
      139. | | 7.29.1 BY DRUG CLASS, 2025-2035 (USD Billion)
      140. | | 7.29.2 BY INDICATION, 2025-2035 (USD Billion)
      141. | | 7.29.3 BY ROUTE OF DRUG ADMINISTRATION, 2025-2035 (USD Billion)
      142. | | 7.29.4 BY END-USER, 2025-2035 (USD Billion)
      143. | 7.30 Rest of MEA MARKET SIZE ESTIMATES; FORECAST
      144. | | 7.30.1 BY DRUG CLASS, 2025-2035 (USD Billion)
      145. | | 7.30.2 BY INDICATION, 2025-2035 (USD Billion)
      146. | | 7.30.3 BY ROUTE OF DRUG ADMINISTRATION, 2025-2035 (USD Billion)
      147. | | 7.30.4 BY END-USER, 2025-2035 (USD Billion)
      148. | 7.31 PRODUCT LAUNCH/PRODUCT DEVELOPMENT/APPROVAL
      149. | | 7.31.1
      150. | 7.32 ACQUISITION/PARTNERSHIP
      151. | | 7.32.1

    Market Segmentation

    Chemotherapy Drug Class Outlook (USD Billion, 2018-2032)

    Mitotic Inhibitors

    Alkylating Agents

    Antimetabolites

    Topoisomerase Inhibitors

    Antitumor Antibiotic

    Chemotherapy Indication Outlook (USD Billion, 2018-2032)

    Breast Cancer

    Lung Cancer

    Colorectal Cancer

    Prostate Cancer

    Stomach Cancer

    Lymphoma

    Leukemia

    Ovarian Cancer

    Chemotherapy Route of Drug Administration Outlook (USD Billion, 2018-2032)

    Intravenous

    Oral

    Subcutaneous

    Intra-Muscular

    Intravesicular

    Topical

    Intraperitoneal

    Intraventricular/Intrathecal

    Chemotherapy End-User Outlook (USD Billion, 2018-2032)

    Specialty Centers

    Hospitals & Clinics

    Chemotherapy Regional Outlook (USD Billion, 2018-2032)

    North America Outlook (USD Billion, 2018-2032)

    North America Chemotherapy by Drug Class

    Mitotic Inhibitors

    Alkylating Agents

    Antimetabolites

    Topoisomerase Inhibitors

    Antitumor Antibiotic

    North America Chemotherapy by Indication

    Breast Cancer

    Lung Cancer

    Colorectal Cancer

    Prostate Cancer

    Stomach Cancer

    Lymphoma

    Leukemia

    Ovarian Cancer

    North America Chemotherapy by Route of Drug Administration

    Intravenous

    Oral

    Subcutaneous

    Intra-Muscular

    Intravesicular

    Topical

    Intraperitoneal

    Intraventricular/Intrathecal

    North America Chemotherapy by End-User

    Specialty Centers

    Hospitals & Clinics

    US Outlook (USD Billion, 2018-2032)

    US Chemotherapy by Drug Class

    Mitotic Inhibitors

    Alkylating Agents

    Antimetabolites

    Topoisomerase Inhibitors

    Antitumor Antibiotic

    US Chemotherapy by Indication

    Breast Cancer

    Lung Cancer

    Colorectal Cancer

    Prostate Cancer

    Stomach Cancer

    Lymphoma

    Leukemia

    Ovarian Cancer

    US Chemotherapy by Route of Drug Administration

    Intravenous

    Oral

    Subcutaneous

    Intra-Muscular

    Intravesicular

    Topical

    Intraperitoneal

    Intraventricular/Intrathecal

    US Chemotherapy by End-User

    Specialty Centers

    Hospitals & Clinics

    CANADA Outlook (USD Billion, 2018-2032)

    CANADA Chemotherapy by Drug Class

    Mitotic Inhibitors

    Alkylating Agents

    Antimetabolites

    Topoisomerase Inhibitors

    Antitumor Antibiotic

    CANADA Chemotherapy by Indication

    Breast Cancer

    Lung Cancer

    Colorectal Cancer

    Prostate Cancer

    Stomach Cancer

    Lymphoma

    Leukemia

    Ovarian Cancer

    CANADA Chemotherapy by Route of Drug Administration

    Intravenous

    Oral

    Subcutaneous

    Intra-Muscular

    Intravesicular

    Topical

    Intraperitoneal

    Intraventricular/Intrathecal

    CANADA Chemotherapy by End-User

    Specialty Centers

    Hospitals & Clinics

    Europe Outlook (USD Billion, 2018-2032)

    Europe Chemotherapy by Drug Class

    Mitotic Inhibitors

    Alkylating Agents

    Antimetabolites

    Topoisomerase Inhibitors

    Antitumor Antibiotic

    Europe Chemotherapy by Indication

    Breast Cancer

    Lung Cancer

    Colorectal Cancer

    Prostate Cancer

    Stomach Cancer

    Lymphoma

    Leukemia

    Ovarian Cancer

    Europe Chemotherapy by Route of Drug Administration

    Intravenous

    Oral

    Subcutaneous

    Intra-Muscular

    Intravesicular

    Topical

    Intraperitoneal

    Intraventricular/Intrathecal

    Europe Chemotherapy by End-User

    Specialty Centers

    Hospitals & Clinics

    Germany Outlook (USD Billion, 2018-2032)

    Germany Chemotherapy by Drug Class

    Mitotic Inhibitors

    Alkylating Agents

    Antimetabolites

    Topoisomerase Inhibitors

    Antitumor Antibiotic

    Germany Chemotherapy by Indication

    Breast Cancer

    Lung Cancer

    Colorectal Cancer

    Prostate Cancer

    Stomach Cancer

    Lymphoma

    Leukemia

    Ovarian Cancer

    Germany Chemotherapy by Route of Drug Administration

    Intravenous

    Oral

    Subcutaneous

    Intra-Muscular

    Intravesicular

    Topical

    Intraperitoneal

    Intraventricular/Intrathecal

    Germany Chemotherapy by End-User

    Specialty Centers

    Hospitals & Clinics

    France Outlook (USD Billion, 2018-2032)

    France Chemotherapy by Drug Class

    Mitotic Inhibitors

    Alkylating Agents

    Antimetabolites

    Topoisomerase Inhibitors

    Antitumor Antibiotic

    France Chemotherapy by Indication

    Breast Cancer

    Lung Cancer

    Colorectal Cancer

    Prostate Cancer

    Stomach Cancer

    Lymphoma

    Leukemia

    Ovarian Cancer

    France Chemotherapy by Route of Drug Administration

    Intravenous

    Oral

    Subcutaneous

    Intra-Muscular

    Intravesicular

    Topical

    Intraperitoneal

    Intraventricular/Intrathecal

    France Chemotherapy by End-User

    Specialty Centers

    Hospitals & Clinics

    UK Outlook (USD Billion, 2018-2032)

    UK Chemotherapy by Drug Class

    Mitotic Inhibitors

    Alkylating Agents

    Antimetabolites

    Topoisomerase Inhibitors

    Antitumor Antibiotic

    UK Chemotherapy by Indication

    Breast Cancer

    Lung Cancer

    Colorectal Cancer

    Prostate Cancer

    Stomach Cancer

    Lymphoma

    Leukemia

    Ovarian Cancer

    UK Chemotherapy by Route of Drug Administration

    Intravenous

    Oral

    Subcutaneous

    Intra-Muscular

    Intravesicular

    Topical

    Intraperitoneal

    Intraventricular/Intrathecal

    UK Chemotherapy by End-User

    Specialty Centers

    Hospitals & Clinics

    ITALY Outlook (USD Billion, 2018-2032)

    ITALY Chemotherapy by Drug Class

    Mitotic Inhibitors

    Alkylating Agents

    Antimetabolites

    Topoisomerase Inhibitors

    Antitumor Antibiotic

    ITALY Chemotherapy by Indication

    Breast Cancer

    Lung Cancer

    Colorectal Cancer

    Prostate Cancer

    Stomach Cancer

    Lymphoma

    Leukemia

    Ovarian Cancer

    ITALY Chemotherapy by Route of Drug Administration

    Intravenous

    Oral

    Subcutaneous

    Intra-Muscular

    Intravesicular

    Topical

    Intraperitoneal

    Intraventricular/Intrathecal

    ITALY Chemotherapy by End-User

    Specialty Centers

    Hospitals & Clinics

    SPAIN Outlook (USD Billion, 2018-2032)

    SPAIN Chemotherapy by Drug Class

    Mitotic Inhibitors

    Alkylating Agents

    Antimetabolites

    Topoisomerase Inhibitors

    Antitumor Antibiotic

    SPAIN Chemotherapy by Indication

    Breast Cancer

    Lung Cancer

    Colorectal Cancer

    Prostate Cancer

    Stomach Cancer

    Lymphoma

    Leukemia

    Ovarian Cancer

    SPAIN Chemotherapy by Route of Drug Administration

    Intravenous

    Oral

    Subcutaneous

    Intra-Muscular

    Intravesicular

    Topical

    Intraperitoneal

    Intraventricular/Intrathecal

    SPAIN Chemotherapy by End-User

    Specialty Centers

    Hospitals & Clinics

    Rest Of Europe Outlook (USD Billion, 2018-2032)

    Rest Of Europe Chemotherapy by Drug Class

    Mitotic Inhibitors

    Alkylating Agents

    Antimetabolites

    Topoisomerase Inhibitors

    Antitumor Antibiotic

    Rest Of Europe Chemotherapy by Indication

    Breast Cancer

    Lung Cancer

    Colorectal Cancer

    Prostate Cancer

    Stomach Cancer

    Lymphoma

    Leukemia

    Ovarian Cancer

    Rest Of Europe Chemotherapy by Route of Drug Administration

    Intravenous

    Oral

    Subcutaneous

    Intra-Muscular

    Intravesicular

    Topical

    Intraperitoneal

    Intraventricular/Intrathecal

    Rest Of Europe Chemotherapy by End-User

    Specialty Centers

    Hospitals & Clinics

    Asia-Pacific Outlook (USD Billion, 2018-2032)

    Asia-Pacific Chemotherapy by Drug Class

    Mitotic Inhibitors

    Alkylating Agents

    Antimetabolites

    Topoisomerase Inhibitors

    Antitumor Antibiotic

    Asia-Pacific Chemotherapy by Indication

    Breast Cancer

    Lung Cancer

    Colorectal Cancer

    Prostate Cancer

    Stomach Cancer

    Lymphoma

    Leukemia

    Ovarian Cancer

    Asia-Pacific Chemotherapy by Route of Drug Administration

    Intravenous

    Oral

    Subcutaneous

    Intra-Muscular

    Intravesicular

    Topical

    Intraperitoneal

    Intraventricular/Intrathecal

    Asia-Pacific Chemotherapy by End-User

    Specialty Centers

    Hospitals & Clinics

    China Outlook (USD Billion, 2018-2032)

    China Chemotherapy by Drug Class

    Mitotic Inhibitors

    Alkylating Agents

    Antimetabolites

    Topoisomerase Inhibitors

    Antitumor Antibiotic

    China Chemotherapy by Indication

    Breast Cancer

    Lung Cancer

    Colorectal Cancer

    Prostate Cancer

    Stomach Cancer

    Lymphoma

    Leukemia

    Ovarian Cancer

    China Chemotherapy by Route of Drug Administration

    Intravenous

    Oral

    Subcutaneous

    Intra-Muscular

    Intravesicular

    Topical

    Intraperitoneal

    Intraventricular/Intrathecal

    China Chemotherapy by End-User

    Specialty Centers

    Hospitals & Clinics

    Japan Outlook (USD Billion, 2018-2032)

    Japan Chemotherapy by Drug Class

    Mitotic Inhibitors

    Alkylating Agents

    Antimetabolites

    Topoisomerase Inhibitors

    Antitumor Antibiotic

    Japan Chemotherapy by Indication

    Breast Cancer

    Lung Cancer

    Colorectal Cancer

    Prostate Cancer

    Stomach Cancer

    Lymphoma

    Leukemia

    Ovarian Cancer

    Japan Chemotherapy by Route of Drug Administration

    Intravenous

    Oral

    Subcutaneous

    Intra-Muscular

    Intravesicular

    Topical

    Intraperitoneal

    Intraventricular/Intrathecal

    Japan Chemotherapy by End-User

    Specialty Centers

    Hospitals & Clinics

    India Outlook (USD Billion, 2018-2032)

    India Chemotherapy by Drug Class

    Mitotic Inhibitors

    Alkylating Agents

    Antimetabolites

    Topoisomerase Inhibitors

    Antitumor Antibiotic

    India Chemotherapy by Indication

    Breast Cancer

    Lung Cancer

    Colorectal Cancer

    Prostate Cancer

    Stomach Cancer

    Lymphoma

    Leukemia

    Ovarian Cancer

    India Chemotherapy by Route of Drug Administration

    Intravenous

    Oral

    Subcutaneous

    Intra-Muscular

    Intravesicular

    Topical

    Intraperitoneal

    Intraventricular/Intrathecal

    India Chemotherapy by End-User

    Specialty Centers

    Hospitals & Clinics

    Australia Outlook (USD Billion, 2018-2032)

    Australia Chemotherapy by Drug Class

    Mitotic Inhibitors

    Alkylating Agents

    Antimetabolites

    Topoisomerase Inhibitors

    Antitumor Antibiotic

    Australia Chemotherapy by Indication

    Breast Cancer

    Lung Cancer

    Colorectal Cancer

    Prostate Cancer

    Stomach Cancer

    Lymphoma

    Leukemia

    Ovarian Cancer

    Australia Chemotherapy by Route of Drug Administration

    Intravenous

    Oral

    Subcutaneous

    Intra-Muscular

    Intravesicular

    Topical

    Intraperitoneal

    Intraventricular/Intrathecal

    Australia Chemotherapy by End-User

    Specialty Centers

    Hospitals & Clinics

    Rest of Asia-Pacific Outlook (USD Billion, 2018-2032)

    Rest of Asia-Pacific Chemotherapy by Drug Class

    Mitotic Inhibitors

    Alkylating Agents

    Antimetabolites

    Topoisomerase Inhibitors

    Antitumor Antibiotic

    Rest of Asia-Pacific Chemotherapy by Indication

    Breast Cancer

    Lung Cancer

    Colorectal Cancer

    Prostate Cancer

    Stomach Cancer

    Lymphoma

    Leukemia

    Ovarian Cancer

    Rest of Asia-Pacific Chemotherapy by Route of Drug Administration

    Intravenous

    Oral

    Subcutaneous

    Intra-Muscular

    Intravesicular

    Topical

    Intraperitoneal

    Intraventricular/Intrathecal

    Rest of Asia-Pacific Chemotherapy by End-User

    Specialty Centers

    Hospitals & Clinics

    Rest of the World Outlook (USD Billion, 2018-2032)

    Rest of the World Chemotherapy by Drug Class

    Mitotic Inhibitors

    Alkylating Agents

    Antimetabolites

    Topoisomerase Inhibitors

    Antitumor Antibiotic

    Rest of the World Chemotherapy by Indication

    Breast Cancer

    Lung Cancer

    Colorectal Cancer

    Prostate Cancer

    Stomach Cancer

    Lymphoma

    Leukemia

    Ovarian Cancer

    Rest of the World Chemotherapy by Route of Drug Administration

    Intravenous

    Oral

    Subcutaneous

    Intra-Muscular

    Intravesicular

    Topical

    Intraperitoneal

    Intraventricular/Intrathecal

    Rest of the World Chemotherapy by End-User

    Specialty Centers

    Hospitals & Clinics

    Middle East Outlook (USD Billion, 2018-2032)

    Middle East Chemotherapy by Drug Class

    Mitotic Inhibitors

    Alkylating Agents

    Antimetabolites

    Topoisomerase Inhibitors

    Antitumor Antibiotic

    Middle East Chemotherapy by Indication

    Breast Cancer

    Lung Cancer

    Colorectal Cancer

    Prostate Cancer

    Stomach Cancer

    Lymphoma

    Leukemia

    Ovarian Cancer

    Middle East Chemotherapy by Route of Drug Administration

    Intravenous

    Oral

    Subcutaneous

    Intra-Muscular

    Intravesicular

    Topical

    Intraperitoneal

    Intraventricular/Intrathecal

    Middle East Chemotherapy by End-User

    Specialty Centers

    Hospitals & Clinics

    Africa Outlook (USD Billion, 2018-2032)

    Africa Chemotherapy by Drug Class

    Mitotic Inhibitors

    Alkylating Agents

    Antimetabolites

    Topoisomerase Inhibitors

    Antitumor Antibiotic

    Africa Chemotherapy by Indication

    Breast Cancer

    Lung Cancer

    Colorectal Cancer

    Prostate Cancer

    Stomach Cancer

    Lymphoma

    Leukemia

    Ovarian Cancer

    Africa Chemotherapy by Route of Drug Administration

    Intravenous

    Oral

    Subcutaneous

    Intra-Muscular

    Intravesicular

    Topical

    Intraperitoneal

    Intraventricular/Intrathecal

    Africa Chemotherapy by End-User

    Specialty Centers

    Hospitals & Clinics

    Latin America Outlook (USD Billion, 2018-2032)

    Latin America Chemotherapy by Drug Class

    Mitotic Inhibitors

    Alkylating Agents

    Antimetabolites

    Topoisomerase Inhibitors

    Antitumor Antibiotic

    Latin America Chemotherapy by Indication

    Breast Cancer

    Lung Cancer

    Colorectal Cancer

    Prostate Cancer

    Stomach Cancer

    Lymphoma

    Leukemia

    Ovarian Cancer

    Latin America Chemotherapy by Route of Drug Administration

    Intravenous

    Oral

    Subcutaneous

    Intra-Muscular

    Intravesicular

    Topical

    Intraperitoneal

    Intraventricular/Intrathecal

    Latin America Chemotherapy by End-User

    Specialty Centers

    Hospitals & Clinics

    Infographic

    Free Sample Request

    Kindly complete the form below to receive a free sample of this Report

    Get Free Sample

    Customer Strories

    “I am very pleased with how market segments have been defined in a relevant way for my purposes (such as "Portable Freezers & refrigerators" and "last-mile"). In general the report is well structured. Thanks very much for your efforts.”

    Victoria Milne

    Founder
    Case Study
    Chemicals and Materials

    Compare Licence

    ×
    Features License Type
    Single User Multiuser License Enterprise User
    Price $4,950 $5,950 $7,250
    Maximum User Access Limit 1 User Upto 10 Users Unrestricted Access Throughout the Organization
    Free Customization
    Direct Access to Analyst
    Deliverable Format
    Platform Access
    Discount on Next Purchase 10% 15% 15%
    Printable Versions