• Cat-intel
  • MedIntelliX
  • Resources
  • About Us
  • Hero Background
    English
    Chinese
    French
    Japanese
    Korean
    German
    Spanish

    Cenospheres Market Share

    ID: MRFR/CnM/0853-HCR
    110 Pages
    Chitranshi Jaiswal
    October 2025

    Cenospheres Market Research Report Information by Type (Gray Cenospheres and White Cenospheres), End-Use Industry (Refractory, Building and Construction, Oil and Gas, Automotive, Paints and Coatings, and Others), and Region (Asia-Pacific, North America, Latin America, Europe, and the Middle East & Africa)—Forecast till 2035

    Share:
    Download PDF ×

    We do not share your information with anyone. However, we may send you emails based on your report interest from time to time. You may contact us at any time to opt-out.

    Cenospheres Market Infographic
    $ 4,950.0
    $ 5,950.0
    $ 7,250.0

    Market Share

    Cenospheres Market Share Analysis

    Market share positioning strategies play a crucial role in the competitive landscape of the Cenospheres Market. Cenospheres, lightweight, hollow ceramic microspheres derived from fly ash, are widely used in various industries like construction, oil & gas, automotive, and aerospace due to their unique properties. In this market, companies employ several strategies to position themselves effectively and capture a larger share. One such strategy is differentiation. Companies differentiate their cenospheres based on quality, purity, particle size distribution, and chemical composition to meet specific industry requirements. By offering superior quality or specialized variations, companies can carve out a niche for themselves and attract customers seeking unique features.

    The growth opportunities are saving the market from the challenging factors. An increase in infrastructure investments in emerging countries is likely to be a growth opportunity during the evaluation period.

    Another significant strategy is cost leadership. Some companies focus on producing cenospheres at the lowest possible cost without compromising quality. By optimizing production processes, sourcing raw materials efficiently, and achieving economies of scale, these companies can offer competitive prices, appealing to price-sensitive customers. Cost leadership can help companies gain a larger market share, especially in price-driven segments where affordability is a primary concern for customers.

    Furthermore, market segmentation is a widely used strategy in the cenospheres market. Companies identify distinct customer segments based on factors such as industry applications, geographic regions, or specific product requirements. By tailoring their marketing efforts, product features, and distribution channels to address the needs of different segments, companies can effectively penetrate various markets and capture a larger share within each segment. For example, a company may focus on supplying high-strength cenospheres to the construction industry while targeting the automotive sector with lightweight variants.

    Additionally, strategic partnerships and collaborations are instrumental in enhancing market share positioning. Companies may form alliances with raw material suppliers, distributors, or research institutions to strengthen their supply chain, expand market reach, or develop innovative products. By leveraging complementary capabilities and resources through partnerships, companies can gain a competitive edge and increase their presence in the market. Collaborations also enable companies to access new markets or technologies, accelerating growth and market penetration.

    Moreover, continuous innovation and product development are key strategies employed by companies in the cenospheres market. By investing in research and development, companies strive to enhance the properties and performance of cenospheres, making them more suitable for a broader range of applications. Innovation can lead to the introduction of novel products with unique features, giving companies a competitive advantage and driving market share growth. Whether it's developing cenospheres with improved strength, thermal insulation properties, or surface characteristics, innovation plays a pivotal role in maintaining market leadership.

    Lastly, effective marketing and branding strategies are essential for market share positioning in the cenospheres market. Companies invest in building strong brand identities, promoting product benefits, and creating awareness among customers about the applications and advantages of cenospheres. Through targeted marketing campaigns, participation in industry events, and online presence, companies aim to establish themselves as preferred suppliers and influencers in the market. A well-executed branding strategy can enhance customer loyalty, increase market visibility, and ultimately drive higher market share.

    Market Summary

    As per Market Research Future Analysis, the global Cenospheres Market is witnessing significant growth due to its lightweight and mechanical properties, primarily driven by the construction and automotive sectors. The market is projected to reach USD 715 million by 2030, with a CAGR of 12.50%. Cenospheres, derived from coal combustion, are utilized across various industries, including oil and gas, paints, and coatings, due to their high thermal insulation and reduced weight. The COVID-19 pandemic posed challenges, leading to economic losses; however, recovery strategies are anticipated to enhance market demand post-pandemic. Key growth drivers include urbanization, industrialization, and increased infrastructure investments in emerging markets, while challenges such as limited raw material supply and quality control issues persist.

    Key Market Trends & Highlights

    The Cenospheres Market is characterized by several key trends and highlights.

    • Market Value expected to reach USD 715 million by 2030.
    • CAGR of 12.50% during the forecast period.
    • North America captured the largest market share in 2018, driven by oil and gas activities.
    • Asia-Pacific predicted to record the highest CAGR due to growth in automotive and construction sectors.

    Market Size & Forecast

    Market Size USD 715 million by 2030
    CAGR 12.50%
    Largest Regional Market Share in 2018 North America
    Highest CAGR Region Asia-Pacific.

    Major Players

    Key players include Petra Buildcare Products, Ceno Technologies, 3M, CenoStar, and Omya.

    Market Trends

    The Global Cenospheres Market is poised for growth, driven by increasing demand in various industries such as construction and automotive, which underscores the material's versatility and eco-friendly attributes.

    U.S. Department of Energy

    Cenospheres Market Market Drivers

    Market Growth Projections

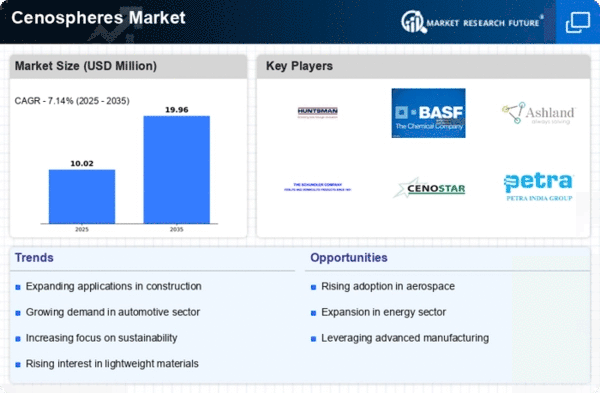
    The Global Cenospheres Market Industry is projected to experience robust growth over the coming years. With a market value anticipated to reach 344 USD Million in 2024 and an impressive increase to 1288.5 USD Million by 2035, the trajectory indicates a strong upward trend. The compound annual growth rate of 12.76% from 2025 to 2035 suggests that the demand for cenospheres will continue to rise as industries increasingly recognize their benefits. This growth is likely to be fueled by the expanding applications and innovations in manufacturing processes, positioning cenospheres as a key material in various sectors.

    Advancements in Oil and Gas Industry

    The Global Cenospheres Market Industry benefits from advancements in the oil and gas sector, where cenospheres are utilized as lightweight additives in drilling fluids and cementing applications. These materials enhance the performance of drilling operations by reducing density and improving flow characteristics. As the global oil and gas industry continues to evolve, the demand for efficient and cost-effective solutions is paramount. The market for cenospheres is likely to expand as companies seek to optimize their operations. This trend is expected to contribute to a projected market value of 1288.5 USD Million by 2035, reflecting a growing reliance on cenospheres in this critical sector.

    Rising Demand in Construction Sector

    The Global Cenospheres Market Industry experiences a notable surge in demand driven by the construction sector. Cenospheres, known for their lightweight and insulating properties, are increasingly utilized in concrete and other building materials. This trend is particularly evident as the global construction market is projected to reach approximately 10 trillion USD by 2024. The incorporation of cenospheres not only enhances the strength-to-weight ratio of construction materials but also contributes to sustainability efforts. As a result, the market for cenospheres is expected to grow significantly, with estimates indicating a market value of 344 USD Million in 2024.

    Increasing Focus on Sustainable Materials

    The Global Cenospheres Market Industry is witnessing a shift towards sustainable materials, as environmental concerns gain prominence across various sectors. Cenospheres, being a byproduct of coal combustion, offer a unique opportunity to utilize waste materials while reducing the carbon footprint. This aligns with global sustainability goals and regulations aimed at minimizing environmental impact. Industries such as automotive and aerospace are increasingly adopting cenospheres for lightweight applications, which enhances fuel efficiency and reduces emissions. The growing emphasis on sustainability is likely to drive the market forward, as companies seek innovative solutions that meet regulatory standards and consumer expectations.

    Technological Innovations in Manufacturing

    The Global Cenospheres Market Industry is significantly influenced by technological innovations in manufacturing processes. Advances in extraction and processing techniques have improved the quality and availability of cenospheres, making them more accessible to various industries. Innovations such as enhanced separation methods and improved purification processes have led to higher purity levels and better performance characteristics. As manufacturers adopt these technologies, the market is expected to witness increased competition and product differentiation. This could potentially lead to a compound annual growth rate of 12.76% from 2025 to 2035, as companies strive to capitalize on the enhanced capabilities of cenospheres.

    Expanding Applications in Various Industries

    The Global Cenospheres Market Industry is characterized by expanding applications across diverse sectors, including automotive, aerospace, and consumer goods. Cenospheres are increasingly utilized in lightweight composites, insulation materials, and as fillers in various products. This versatility is driving demand as industries seek to enhance product performance while reducing weight. For instance, in the automotive sector, the use of cenospheres in body panels and components contributes to improved fuel efficiency. As these applications continue to grow, the market for cenospheres is poised for substantial expansion, reflecting the adaptability of these materials in meeting the evolving needs of various industries.

    Market Segment Insights

    Regional Insights

    Key Companies in the Cenospheres Market market include

    Industry Developments

    In May 2021,

    Omya International AG, a chief market leader in cenospheres manufacturing, announced introducing the newest functionalized Calcium Carbonates product line for PET applications named OmyaPET. It is the latest and most cost-effective opacifier usually used in manufacturing white opaque PET bottles. 


    Report Overview

    The Cenospheres Market Analysis has shown the progress of the market at the global level. The effects of chief existing factors such as the drivers, challenges, opportunities and restraints were discussed in detail. The COVID-19 report stated the loss and further improvements to recover from it. The key players' involvement was studied with their planned strategies. The segmentation analysis report discussed the major segments and their growth. The regional update of the Cenospheres Market shows the regions covered and their progress in every region. The recent developments have propelled the market's demand globally.

    The market will successfully reach the estimated CAGR value during the review period.

    Key Industrial Segments

    By Type 

      • Gray Cenospheres 
      • White Cenospheres

    By End-Use Industry 

      • Refractory
      • Building and Construction
      • Oil and Gas
      • Automotive
      • Paints and Coatings
      • Others

    Future Outlook

    Cenospheres Market Future Outlook

    The Global Cenospheres Market is projected to grow at a 12.76% CAGR from 2024 to 2035, driven by increasing demand in construction, automotive, and energy sectors.

    New opportunities lie in:

    • Develop advanced cenosphere-based composites for lightweight automotive applications.
    • Explore innovative cenosphere utilization in sustainable construction materials.
    • Invest in R&D for cenosphere applications in renewable energy technologies.

    By 2035, the Cenospheres Market is expected to demonstrate robust growth, reflecting evolving industrial applications and technological advancements.

    Market Segmentation

    Market Segmentation

    Some of the key players of the global cenospheres market are
    • Petra Buildcare Products (India)
    • PR Group (India)
    • Ceno Technologies (US)
    • (Australia)
    • 3M (US), CenoStar (US)
    • Cenosphere India Pvt. Ltd (India)
    • Durgesh Merchandise Pvt. Ltd (India)
    • Omya (Switzerland)
    • (Australia)
    • Qingdao Eastchem Inc. (China), and 
    • Delamin Limited (UK).

    Report Scope

    Attribute/Metric Details
      Market Size   2030: USD 715 Million
      CAGR   12.5%(2022-2030)
      Base Year   2021
      Forecast Period   2022-2030
      Historical Data   2018
      Forecast Units    Value (USD Million)
      Report Coverage   Revenue Forecast, Competitive Landscape, Growth Factors, and Trends
      Segments Covered   By Type, End-Use Industry and Region
      Geographies Covered   North America, Europe, Asia-Pacific, and Rest of the World (RoW)
      Key Vendors   Petra Buildcare Products (India), PR Group (India), Ceno Technologies (US), Reslab Microfiller (Australia), 3M (US), CenoStar (US), Cenosphere India Pvt. Ltd (India), Durgesh Merchandise Pvt. Ltd (India), Omya (Switzerland), Envirospheres (Australia), Qingdao Eastchem Inc. (China), and Delamin Limited (UK).
      Key Market Opportunities   Increasing demand for cenospheres in lightweight drilling fluids and drilling cement in oil and gas industry
      Key Market Drivers   Growing urbanization and industrialization and increasing consumption of cenospheres as light-weighting material in construction aggregate

    Market Highlights

    Author

    Chitranshi Jaiswal
    Research Analyst Level I

    She holds an experience of about 6+ years in market research and business consulting, working under the spectrum of information communication technology, telecommunications and semiconductor domains. aarti conceptualizes and implements a scalable business strategy and provides strategic leadership to the clients. her expertise lies in market estimation, competitive intelligence, pipeline analysis, customer assessment, etc.

    Leave a Comment

    Latest Comments

    John Doe
    john@example.com

    This is a great article! Really helped me understand the topic better.

    Posted on July 23, 2025, 10:15 AM
    Jane Smith
    jane@domain.com

    Thanks for sharing this. I’ve bookmarked it for later reference.

    Posted on July 22, 2025, 7:45 PM

    FAQs

    What is the projected valuation for the Cenospheres Market by 2035?

    The Cenospheres Market is slated to achieve a valuation of USD 715 million.

    What is the projected CAGR for the Cenospheres Market during the forecast period of 2020- 2035?

    The projected CAGR would be 12.5% during the forecast 2035.

    What could prevent the Cenospheres Market growth?

    Lack of raw material and quality control can hinder Cenospheres Market growth.

    Which region has the largest Cenospheres Market share?

    The North American Cenospheres Market has the largest market share.

    What is driving the North American Cenospheres Market ahead?

    Oil & gas and shale gas exploration to drive the market ahead.

    1. Executive Summary
    2. Market Introduction
      1. 2.1
      2. Market Definition
      3. Scope of the
        1. Research
        2. Assumptions & Limitations
      4. Study
      5. Objectives
      6. Markets Structure
      7. Key Takeaways
    3. Market Research Methodology
      1. 3.1
      2. Research Process
      3. Primary Research
      4. Secondary Research
      5. 3.4
      6. Market Size Estimation
      7. Forecast Model
    4. Market Dynamics of the Global Cenospheres
      1. Market
      2. Introduction
      3. Drivers
      4. Restraints
      5. Opportunities
      6. 4.5
      7. Challenges
      8. Trends/Technology
    5. Market Factor Analysis of the Global Cenospheres
      1. Market
      2. Supply Chain Analysis
        1. Raw Type Suppliers
        2. Distributors/Retailers/Wholesalers/E-Commerce
        3. End Users
        4. Bargaining
        5. Bargaining Power
        6. Threat of Substitutes
        7. Intensity of Competitive Rivalry
      3. 5.1.2
      4. Manufacturers/Producers
      5. 5.2
      6. Porter’s Five Forces Analysis
      7. 5.2.1
      8. Threat of New Entrants
      9. Power of Buyers
      10. of Suppliers
      11. 5.3
      12. Pricing Analysis
    6. Global Cenospheres Market, by Type
      1. Introduction
      2. Gray Cenospheres
        1. Market Estimates
        2. Market Estimates & Forecast,
      3. & Forecast, 2020−2027
      4. by Region, 2020−2027
      5. White Cenospheres
        1. Market Estimates & Forecast,
        2. Market Estimates & Forecast, by Region, 2020−2027
    7. Global Cenospheres Market, by End-Use Industry
      1. 7.1
      2. Introduction
      3. Refractory
        1. Market
        2. Market Estimates &
      4. Estimates & Forecast, 2020−2027
      5. Forecast, by Region, 2020−2027
      6. Building and Construction
        1. Market Estimates & Forecast, 2020−2027
      7. 7.3.2
    8. Market Estimates & Forecast, by Region, 2020−2027
      1. 7.4
      2. Oil and Gas
      3. 7.5
      4. Automotive
      5. 7.6
      6. Paints and Coatings
      7. 7.7
      8. Others
      9. 8.
    9. Market Estimates & Forecast, 2020−2027
    10. Market Estimates & Forecast, by Region, 2020−2027
    11. Market Estimates & Forecast, 2020−2027
    12. Market Estimates & Forecast, by Region, 2020−2027
    13. Market Estimates & Forecast, 2020−2027
    14. Market Estimates & Forecast, by Region, 2020−2027
    15. Market Estimates & Forecast, 2020−2027
    16. Market Estimates & Forecast, by Region, 2020−2027
    17. Global Cenospheres Market, by Region
      1. Introduction
      2. North America
        1. Market Estimates &
        2. Market Estimates & Forecast,
        3. Market Estimates & Forecast,
        4. US
      3. Forecast, 2020−2027
      4. by Type, 2020−2027
      5. by End-Use Industry, 2020−2027
      6. 8.2.4.2
    18. Market Estimates & Forecast, by Type, 2020−2027
      1. Industry, 2020−2027
      2. 8.2.5.2
    19. Market Estimates & Forecast, End-Use
    20. Canada
    21. Market Estimates & Forecast,
    22. Market Estimates & Forecast, by Type, 2020−2027
      1. Industry, 2020−2027
      2. 8.3.1
      3. Market Estimates & Forecast, 2020−2027
      4. 8.3.2
    23. Market Estimates & Forecast, by End-Use
      1. Europe
    24. Market Estimates & Forecast, by Type, 2020−2027
      1. 8.3.3
    25. Market Estimates & Forecast, by End-Use Industry, 2020−2027
      1. 8.3.4
      2. Germany
      3. 8.3.4.1
      4. Market Estimates & Forecast, 2020−2027
      5. 8.3.4.3
    26. Market Estimates & Forecast, by Type,
    27. Market Estimates & Forecast, by End-Use Industry, 2020−2027
      1. 8.3.5
      2. France
      3. 8.3.5.1
      4. Market Estimates & Forecast, 2020−2027
      5. 8.3.5.3
    28. Market Estimates & Forecast, by Type,
    29. Market Estimates & Forecast, by End-Use Industry, 2020−2027
      1. 8.3.6
      2. Italy
      3. 8.3.6.1
      4. Market Estimates & Forecast, 2020−2027
      5. 8.3.6.3
    30. Market Estimates & Forecast, by Type,
    31. Market Estimates & Forecast, by End-Use Industry, 2020−2027
      1. 8.3.7
      2. Spain
      3. 8.3.7.1
      4. Market Estimates & Forecast, 2020−2027
      5. & Forecast, by End-Use Industry, 2020−2027
      6. 8.3.8
      7. UK
      8. & Forecast, 2020−2027
      9. Forecast, by End-Use Industry, 2020−2027
      10. 8.3.9
      11. Russia
      12. Estimates & Forecast, 2020−2027
      13. & Forecast, by End-Use Industry, 2020−2027
      14. & Forecast, 2020−2027
      15. Forecast, by End-Use Industry, 2020−2027
      16. of Europe
      17. 8.3.11.1
      18. Market Estimates & Forecast, 2020−2027
      19. 8.3.11.3
    32. Market Estimates & Forecast, by Type,2020−2027
    33. Market Estimates
    34. Market Estimates
    35. Market Estimates & Forecast, by Type,2020−2027
    36. Market Estimates &
    37. Market
    38. Market Estimates & Forecast, by Type,2020−2027
    39. Market Estimates
    40. Poland
    41. Market Estimates
    42. Market Estimates & Forecast, by Type, 2020−2027
    43. Market Estimates &
    44. Rest
    45. Market Estimates & Forecast, by Type,
    46. Market Estimates & Forecast, by End-Use Industry, 2020−2027
      1. Asia-Pacific
        1. Market Estimates &
        2. Market Estimates & Forecast,
        3. Market Estimates & Forecast,
        4. China
      2. Forecast, 2020−2027
      3. by Type, 2020−2027
      4. by End-Use Industry, 2020−2027
      5. & Forecast, 2020−2027
      6. & Forecast, by End-Use Industry, 2020−2027
      7. 8.4.5
      8. India
      9. 8.4.5.1
      10. Market Estimates & Forecast, 2020−2027
      11. by Type, 2020−2027
      12. 8.4.5.3
    47. Market Estimates & Forecast, by End-Use Industry, 2020−2027
      1. & Forecast, by Type, 2020−2027
      2. & Forecast, 2020−2027
      3. & Forecast, by End-Use Industry, 2020−2027
      4. 8.4.8
      5. Rest of Asia-Pacific
      6. 8.4.8.1
      7. Market Estimates & Forecast, 2020−2027
      8. by Type, 2020−2027
      9. 8.4.8.3
    48. Japan
    49. Market Estimates & Forecast, 2020−2027
    50. Market Estimates
    51. Market Estimates & Forecast, by End-Use Industry,
    52. Australia & New Zealand
    53. Market Estimates
    54. Market Estimates & Forecast, by Type, 2020−2027
    55. Market Estimates
    56. Market Estimates & Forecast,
    57. Market Estimates & Forecast, by End-Use Industry, 2020−2027
      1. Middle East
        1. Market Estimates & Forecast,
        2. Market Estimates & Forecast, by Type,
        3. Market Estimates & Forecast, by End-Use
        4. GCC
        5. Israel
        6. North Africa
      2. & Africa
      3. Industry, 2020−2027
      4. & Forecast, by Type, 2020−2027
      5. & Forecast, by Type, 2020−2027
      6. 8.5.6.2
    58. Market Estimates & Forecast, by Type, 2020−2027
      1. Industry, 2020−2027
      2. Forecast, 2020−2027
      3. Forecast, by End-Use Industry, 2020−2027
      4. of Middle East & Africa
      5. Forecast, by Type, 2020−2027
      6. Forecast, 2020−2027
      7. by Type, 2020−2027
      8. by End-Use Industry, 2020−2027
      9. & Forecast, 2020−2027
      10. Forecast, by End-Use Industry, 2020−2027
      11. 8.6.5
      12. Argentina
      13. 8.6.5.1
      14. Market Estimates & Forecast, 2020−2027
      15. & Forecast, by End-Use Industry, 2020−2027
      16. 8.6.6
      17. Mexico
      18. 8.6.6.1
      19. Market Estimates & Forecast, 2020−2027
      20. & Forecast, by End-Use Industry, 2020−2027
      21. 8.6.7
      22. Rest of Latin America
      23. by Type, 2020−2027
      24. 8.6.7.3
    59. Market Estimates & Forecast, by End-Use
    60. Turkey
    61. Market Estimates &
    62. Market Estimates & Forecast, by Type, 2020−2027
    63. Market Estimates &
    64. Rest
    65. Market Estimates & Forecast, 2020−2027
    66. Market Estimates &
    67. Market Estimates & Forecast, by End-Use Industry, 2020−2027
      1. Latin America
        1. Market Estimates &
        2. Market Estimates & Forecast,
        3. Market Estimates & Forecast,
        4. Brazil
    68. Market Estimates & Forecast, by End-Use Industry, 2020−2027
    69. Company Landscape
      1. 9.1
      2. Introduction
      3. Market Strategy
      4. Key Development Analysis (Expansion/Mergers & Acquisitions/Joint
      5. Ventures/New Product Development/Agreements/Investments)
      6. 10.
      7. Company Profiles
      8. Petra Buildcare
        1. Financial Updates
        2. Product/Business Segment Overview
        3. Strategy
        4. SWOT Analysis
        5. Company Overview
        6. Strategy
        7. Key Developments
      9. Products
      10. 10.1.1
      11. Company Overview
      12. 10.1.5
      13. Key Developments
      14. 10.2
      15. PR Group
      16. 10.2.2
      17. Financial Updates
      18. 10.2.3
      19. Product/Business Segment Overview
      20. 10.2.6
      21. SWOT Analysis
      22. Ceno Technologies
        1. Company Overview
        2. Financial Updates
        3. Key Developments
        4. SWOT Analysis
      23. 10.3.3
      24. Product/Business Segment Overview
      25. 10.3.4
      26. Strategy
      27. Reslab
        1. Financial Updates
        2. Product/Business Segment Overview
        3. Strategy
        4. SWOT Analysis
        5. Financial Updates
        6. Product/Business Segment Overview
        7. Strategy
        8. SWOT Analysis
        9. Company Overview
        10. Strategy
        11. Key Developments
      28. Microfiller
      29. 10.4.1
      30. Company Overview
      31. 10.4.5
      32. Key Developments
      33. 10.5
      34. 3M
      35. 10.5.1
      36. Company Overview
      37. 10.5.5
      38. Key Developments
      39. 10.6
      40. CenoStar
      41. 10.6.2
      42. Financial Updates
      43. 10.6.3
      44. Product/Business Segment Overview
      45. 10.6.6
      46. SWOT Analysis
      47. Cenosphere India Pvt. Ltd
        1. Financial Updates
        2. Product/Business Segment Overview
        3. Strategy
        4. SWOT Analysis
        5. Company
        6. Financial Updates
        7. Product/Business Segment Overview
        8. Key Developments
        9. SWOT Analysis
        10. Company Overview
        11. Product/Business
        12. Strategy
        13. SWOT Analysis
      48. 10.7.1
      49. Company Overview
      50. 10.7.5
      51. Key Developments
      52. 10.8
      53. Durgesh Merchandise Pvt. Ltd
      54. Overview
      55. 10.8.4
      56. Strategy
      57. 10.9
      58. Omya
      59. 10.9.2
      60. Financial Updates
      61. Segment Overview
      62. 10.9.5
      63. Key Developments
      64. Envirospheres
        1. Company Overview
        2. Strategy
        3. Key Developments
      65. 10.10.2
      66. Financial Updates
      67. 10.10.3
      68. Product/Business Segment Overview
      69. 10.10.6
      70. SWOT Analysis
      71. Qingdao Eastchem Inc.
        1. Company
        2. Financial Updates
        3. Product/Business Segment Overview
        4. Key Developments
        5. SWOT Analysis
      72. Overview
      73. 10.11.4
      74. Strategy
      75. Delamin
        1. Financial
        2. Product/Business Segment
        3. Strategy
        4. SWOT Analysis
      76. Limited
      77. 10.12.1
      78. Company Overview
      79. Updates
      80. Overview
      81. 10.12.5
      82. Key Developments
    70. Conclusion
    71. LIST OF TABLES
    72. Global Cenospheres Market: by Region, 2020−2027
    73. North America: Cenospheres Market, by Country, 2020−2027
    74. Europe: Cenospheres Market, by Country, 2020−2027
    75. Asia-Pacific: Cenospheres Market, by Country, 2020−2027
    76. Middle East & Africa: Cenospheres Market, by Country,
    77. Latin America: Cenospheres Market,
      1. by Country, 2020−2027
    78. Global Cenospheres Type
    79. Market, by Regions, 2020−2027
    80. North America:
    81. Cenospheres Type Market, by Country, 2020−2027
    82. Europe:
    83. Cenospheres Type Market, by Country, 2020−2027
      1. Table10 Asia-Pacific:
    84. Cenospheres Type Market, by Country, 2020−2027
      1. Table11 Middle
    85. East & Africa: Cenospheres Type Market, by Country, 2020−2027
      1. Table12
    86. Latin America: Cenospheres Type Market, by Country, 2020−2027
      1. Table13
    87. Global Cenospheres End-Use Industry Market, by Regions, 2020−2027
      1. Table14 North America: Cenospheres End-Use Industry Market,
      2. by Country, 2020−2027
      3. Table15 Europe: Cenospheres End-Use
    88. Industry Market, by Country, 2020−2027
      1. Table16 Asia-Pacific:
    89. Cenospheres End-Use Industry Market, by Country, 2020−2027
      1. Table17
    90. Middle East & Africa: Cenospheres End-Use Industry Market, by Country,
      1. Table18 Latin America: Cenospheres by End-Use
    91. Industry Market, by Country, 2020-2027
      1. Table19 Global
    92. Type Market, by Region, 2020−2027
      1. Table20 Global End-Use
    93. Industry Market, by Region, 2020−2027
      1. Table21 North
    94. America: Cenospheres Market, by Country, 2020−2027
      1. Table22
    95. North America: Cenospheres Market, by Type, 2020−2027
      1. Table23
    96. North America: Cenospheres Market, by End-Use Industry, 2020−2027
    97. Table24 Europe: Cenospheres Market, by Country, 2020−2027
    98. Table25 Europe: Cenospheres Market, by Type, 2020−2027
    99. Table26 Europe: Cenospheres Market, by End-Use Industry, 2020−2027
    100. Table27 Asia-Pacific: Cenospheres Market, by Country,
      1. Table28 Asia-Pacific: Cenospheres
    101. Market, by Type, 2020−2027
      1. Table29 Asia-Pacific: Cenospheres
    102. Market, by End-Use Industry, 2020−2027
      1. Table30 Middle
    103. East & Africa: Cenospheres Market, by Country, 2020−2027
      1. Table31
    104. Middle East & Africa: Cenospheres Market, by Type, 2020−2027
    105. Table32 Middle East & Africa: Cenospheres Market, by End-Use
      1. Industry, 2020−2027
      2. Table33 Latin America: Cenospheres
    106. Market, by Country, 2020−2027
      1. Table34 Latin
    107. America: Cenospheres Market, by Type, 2020−2027
      1. Table35 Latin
    108. America: Cenospheres Market, by End-Use Industry, 2020−2027
    109. LIST OF FIGURES
    110. Global Cenospheres Market Segmentation
    111. Forecast Research Methodology
      1. FIGURE 3
      2. Five Forces Analysis of Global Cenospheres Market
    112. Value
      1. Chain of Global Cenospheres Market
    113. Global Cenospheres
    114. Market, 2020−2027, by Country, 2020
    115. Share of Global
    116. Cenospheres Market, by Type, 2020−2027
    117. Global Cenospheres
    118. Market Size, by Type, 2020
    119. Share of Global Cenospheres
    120. Market, by Type, 2020−2027
    121. Global Cenospheres Market
      1. Size, by End-Use Industry, 2020
      2. FIGURE10 Share of Global Cenospheres
    122. Market, by End-Use Industry, 2020−2027

    Cenospheres Market Segmentation

    Market Segmentation Overview

    • Detailed segmentation data will be available in the full report
    • Comprehensive analysis by multiple parameters
    • Regional and country-level breakdowns
    • Market size forecasts by segment
    Infographic

    Free Sample Request

    Kindly complete the form below to receive a free sample of this Report

    Get Free Sample

    Customer Strories

    “I am very pleased with how market segments have been defined in a relevant way for my purposes (such as "Portable Freezers & refrigerators" and "last-mile"). In general the report is well structured. Thanks very much for your efforts.”

    Victoria Milne

    Founder
    Case Study
    Chemicals and Materials