• Cat-intel
  • MedIntelliX
  • Resources
  • About Us
  • Hero Background
    English
    Chinese
    French
    Japanese
    Korean
    German
    Spanish

    Captive Power Generation Market Size

    ID: MRFR/E&P/8966-HCR
    111 Pages
    Anshula Mandaokar
    October 2025

    Captive Power Generation Market Research Report By Technology (Heat Exchangers, Turbines, Gas Engines, Transformers, Others), Fuel (Diesel, Gas, Coal, Others), Ownership (Single Ownership and Multiple Ownership), Connectivity (OffGrid and On-Grid), End Use (Industrial, Commercial, Residential) and By Region (North America, Europe, Asia-Pacific, and Rest of the World) –Market Forecast Till 2035

    Share:
    Download PDF ×

    We do not share your information with anyone. However, we may send you emails based on your report interest from time to time. You may contact us at any time to opt-out.

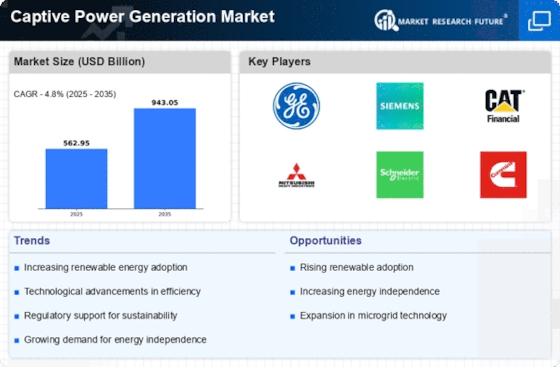
    Captive Power Generation Market Infographic
    $ 4,950.0
    $ 5,950.0
    $ 7,250.0

    Captive Power Generation Size

    Captive Power Generation Market Growth Projections and Opportunities

    The captive power generation market is experiencing dynamic shifts influenced by factors like energy autarky, industrial growth among others as well as the need for reliable power supply. One of the key drivers shaping the market dynamics currently is companies and large commercial establishments striving to be self-sustaining in terms of energy. Captive power generation refers to electricity production by businesses for their own use thereby giving them control of their power supply and reducing reliance on external sources. This self-reliance is especially attractive to high-energy demand industries that ensure a steady uninterrupted flow of electric power. Increasing need for energy security has resulted to rapid adoption of captive power generation hence influencing the market dynamics positively. Industrial growth and expansion of manufacturing facilities are major contributors towards evolving dynamics in captive power generation market. As industries grow, so does their demand for consistent and cost-effective electricity supply. In those regions where grid infrastructure remains unreliable, captive power plants enable industries to effectively meet their energy requirements. The flexibility and reliability offered by captive power generation systems contribute to the market dynamics whereby they address the energy needs of expanding industries thus encouraging growth within the sector.

    Government policies and regulatory frameworks related to energy security and sustainability play a pivotal role in shaping market dynamics of captive power generation system. There are various incentives, tax benefits as well as streamlined regulatory processes through which many governments encourage industrial investment into these plants (Captive Power Plants). These supportive policies create an environment conducive to development of such projects thereby driving investments in this sector hence influencing market dynamics (Captive Power Generation).

    The evolving focus on sustainability and environmental responsibility affects how markets behave with regards to captive power generation today. Now organizations are exploring cleaner sources that can sustainably fuel their operations supporting global efforts targeted at mitigating carbon emissions. In terms of the green alternatives, renewable energy technologies like solar and wind are being integrated into captive power generation systems as a way of changing the market dynamics. The trend towards cleaner energy sources in captive power plants demonstrates how corporate social responsibility and sustainability goals shape the landscape of energy.
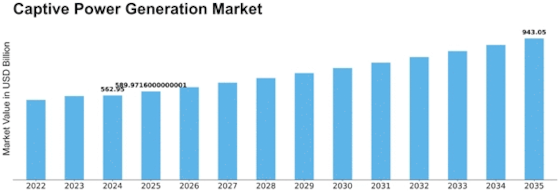
    Captive Power Generation Market Size Graph

    Market Summary

    The Global Captive Power Generation Market is projected to grow from 562.95 USD Billion in 2024 to 943.05 USD Billion by 2035.

    Key Market Trends & Highlights

    Captive Power Generation Key Trends and Highlights

    • The market is expected to witness a compound annual growth rate of 4.8 percent from 2025 to 2035.
    • By 2035, the market valuation is anticipated to reach 942.6 USD Billion, indicating robust growth.
    • in 2024, the market is valued at 562.95 USD Billion, reflecting the increasing demand for energy independence.
    • Growing adoption of renewable energy technologies due to rising energy costs is a major market driver.

    Market Size & Forecast

    2024 Market Size 562.95 (USD Billion)
    2035 Market Size 943.05 (USD Billion)
    CAGR (2025-2035) 4.80%
    Largest Regional Market Share in 2024 latin_america)

    Major Players

    Doosan Corporation, ArcelorMittal, Hindustan Zinc, General Electric, Reliance Industries, Jindal Steel & Power, Hindalco Industries, Essar Steel, Bharat Heavy Electricals, Clarke Energy, a Kohler Company, Thermax Limited, NALCO India, Siemens, Wartsila, LafargeHolcim

    Market Trends

    Rapid industrialization and technological advancements is driving the market growth

    Two strong drivers that have had a considerable impact on the market across many industries, including energy and power generation, are rapid industrialization and technical innovation. These factors, notably the expansion and development of the captive power production business, are crucial in determining the energy landscape.

    As enterprises grow and modernize their processes, rapid industrialization has resulted in a rise in energy demand. There is a growing demand for a steady and uninterrupted power supply as a result of rising urbanization, increased manufacturing, and infrastructure developments. Grid restrictions and sporadic blackouts may result from traditional centralized power networks' inability to keep up with the rate of industrial expansion. Because of this, businesses now have a strong argument for using captive power generation to preserve production continuity and assure energy security.

    The management and optimization of energy systems have undergone a radical change as a result of the confluence of digital technology and smart solutions. Modern monitoring and control systems can be used in industrial facilities to optimize energy use and output, resulting in cost savings and effective operation. Predictive maintenance, real-time monitoring, and data-driven decision-making are all made possible by the Internet of Things (IoT) and artificial intelligence (AI) technologies for captive power production systems. Thus, driving the Captive Power Generation market revenue.

    The trend towards increased self-sufficiency in energy generation is reshaping the landscape of the captive power generation market, as industries seek to mitigate risks associated with grid dependency and enhance operational resilience.

    U.S. Energy Information Administration

    Captive Power Generation Market Market Drivers

    Rising Fuel Prices

    The Global Captive Power Generation Market Industry is also affected by fluctuations in fuel prices, which can significantly impact operational costs for industries relying on traditional energy sources. As global fuel prices rise, companies are increasingly turning to captive power generation as a cost-effective alternative. This shift is particularly evident in sectors such as manufacturing and mining, where energy costs constitute a substantial portion of operational expenses. By investing in captive power systems, businesses can mitigate the risks associated with volatile fuel prices and enhance their energy security. This trend is likely to contribute to the market's growth trajectory as industries seek more stable energy solutions.

    Rising Energy Demand

    The Global Captive Power Generation Market Industry is experiencing a surge in energy demand, driven by rapid industrialization and urbanization across various regions. As economies expand, the need for reliable and uninterrupted power supply becomes paramount. In 2024, the market is valued at 563.0 USD Billion, reflecting the increasing reliance on captive power systems to meet energy needs. Industries such as manufacturing, mining, and data centers are particularly dependent on these systems to ensure operational continuity. This trend is expected to persist, with projections indicating a market growth to 942.6 USD Billion by 2035, highlighting the critical role of captive power generation in supporting global energy requirements.

    Market Growth Projections

    The Global Captive Power Generation Market Industry is poised for substantial growth, with projections indicating a compound annual growth rate (CAGR) of 4.8% from 2025 to 2035. This growth trajectory is driven by various factors, including rising energy demand, technological advancements, and supportive government policies. As industries increasingly adopt captive power systems to enhance energy security and sustainability, the market is expected to expand significantly. By 2035, the market is anticipated to reach a valuation of 942.6 USD Billion, underscoring the critical role of captive power generation in meeting global energy needs. This positive outlook reflects the industry's adaptability and resilience in a rapidly changing energy landscape.

    Technological Advancements

    Technological innovations play a crucial role in shaping the Global Captive Power Generation Market Industry. Advances in energy generation technologies, such as combined heat and power (CHP) systems and renewable energy integration, enhance efficiency and reduce operational costs. These innovations enable industries to optimize their energy consumption while minimizing environmental impact. For instance, the integration of solar and wind energy into captive power systems is becoming increasingly prevalent, allowing businesses to harness clean energy sources. As companies seek to improve sustainability and reduce carbon footprints, the adoption of these technologies is likely to accelerate, further driving market growth.

    Increased Focus on Sustainability

    The Global Captive Power Generation Market Industry is witnessing a growing emphasis on sustainability and environmental responsibility. As stakeholders become more aware of climate change and its implications, industries are increasingly adopting captive power systems that utilize renewable energy sources. This shift not only helps reduce greenhouse gas emissions but also aligns with corporate social responsibility goals. Companies are investing in solar, wind, and biomass energy to power their operations, thereby enhancing their sustainability profiles. This trend is expected to gain momentum, as businesses recognize the long-term benefits of sustainable energy practices, further propelling the growth of the captive power generation market.

    Government Policies and Incentives

    Government policies and incentives significantly influence the Global Captive Power Generation Market Industry. Many countries are implementing regulations that promote the use of renewable energy sources and encourage investments in captive power generation. These policies often include tax benefits, subsidies, and grants aimed at reducing the financial burden on businesses. For example, several nations have established feed-in tariffs for renewable energy projects, making it more attractive for industries to invest in captive power systems. As governments continue to prioritize energy independence and sustainability, the supportive regulatory environment is expected to bolster market growth in the coming years.

    Market Segment Insights

    Captive Power Generation Technology Insights

    The Captive Power Generation market segmentation, based on Technology, includes Heat Exchangers, Turbines, Gas Engines, Transformers, Others. The gas engines segment dominated the market in 2022. There are several uses for gas engines, including mechanical propulsion, cogeneration, and power generation. A gas engine's primary purpose in a gas power plant is to provide power to assist the generator in producing electricity. The Kyoto Protocol and the Paris Agreement, among other environmental rules, assist the decrease of carbon dioxide emissions. Future gas engine expansion is enabled by extensive applications in combined heat and power plants, automotive, marine, and industry.

    Captive Power Generation Fuel Insights

    The Captive Power Generation market segmentation, based on Fuel, includes Diesel, Gas, Coal, Others. The coal category generated the most income in 2022. About one-third of the electricity in the world is produced by coal. An example of a fossil fuel power station is one that burns coal. A pulverized coal-fired boiler burns coal after it has been pulverized.

    Captive Power Generation Ownership Insights

    The Captive Power Generation market segmentation, based on Ownership, includes Single Ownership and Multiple Ownership. The multiple ownership segment dominated the market in 2022. Companies can diversify the risks related to captive power generation by splitting ownership and operating duties. This might ease the pressure on particular firms and give a feeling of security.

    Captive Power Generation Connectivity Insights

    The Captive Power Generation market segmentation, based on Connectivity, includes OffGrid and On-Grid. The on-grid segment dominated the market in 2022. On-grid captive power generation may result in cost savings during periods of low renewable energy production or as a backup power source. This might be particularly helpful in areas with solid grid infrastructure and reasonable electricity prices.

    Captive Power Generation End Use Insights

    The Captive Power Generation market segmentation, based on End Use, includes Industrial, Commercial, and Residential. The industrial segment dominated the market in 2022. Large-scale manufacturing facilities in particular, which are energy-intensive consumers, have encouraged the rise of captive power generation. The cost of industrial electricity from national grids is rising, which has put pressure on manufacturing facilities to lower their profits.

    Figure 1: Captive Power Generation Market, by end use, 2022 & 2032 (USD Billion)

    Source: Secondary Research, Primary Research, Market Research Future Database and Analyst Review

    Get more detailed insights about Captive Power Generation Market Research Report - Global Forecast till 2032

    Regional Insights

    By region, the study provides the market insights into North America, Europe, Asia-Pacific and Rest of the World. The Asia-Pacific Captive Power Generation Market dominated this market in 2022 (45.80%). A number of Asia-Pacific nations have shown a significant commitment to switching to renewable energy sources. In order to meet sustainability objectives and cut carbon emissions, captive power generation using renewable resources like solar and wind has grown in popularity. Moreover, China’s Captive Power Generation market held the largest market share, and the Indian Captive Power Generation market was the fastest growing market in the Asia-Pacific region.

    Further, the major countries studied in the market report are The U.S., Canada, German, France, the UK, Italy, Spain, China, Japan, India, Australia, South Korea, and Brazil.

    Figure 2: Captive Power Generation Market Share By Region 2022 (USD Billion)

    Captive Power Generation Market Share By Region

    Source: Secondary Research, Primary Research, Market Research Future Database and Analyst Review

    The North America Captive Power Generation Market accounts for the second-largest market share. The area has been at the forefront of developments in energy generation technology, including energy storage and renewable energy technologies. As a result, effective and affordable captive power production technologies have been created, further fueling the market's expansion. Further, the U.S. Captive Power Generation market held the largest market share, and the Canada Captive Power Generation market was the fastest growing market in the North America region.

    Europe Captive Power Generation market is expected to grow at the fastest CAGR from 2023 to 2032. The adoption of cleaner and more sustainable energy solutions, such as captive power generation from renewable sources, was influenced by Europe's stringent environmental rules and emission reduction targets. Further, the German Captive Power Generation market held the largest market share, and the UK Captive Power Generation market was the fastest growing market in the European region

    Key Players and Competitive Insights

    Leading market players are investing heavily in research and development in order to expand their product lines, which will help the Captive Power Generation market, grow even more. Market participants are also undertaking a variety of strategic activities to expand their footprint, with important market developments including new product launches, contractual agreements, mergers and acquisitions, higher investments, and collaboration with other organizations. To expand and survive in a more competitive and rising market climate, Captive Power Generation industry must offer cost-effective items.

    Manufacturing locally to minimize operational costs is one of the key business tactics used by manufacturers in the Captive Power Generation industry to benefit clients and increase the market sector. In recent years, the Captive Power Generation industry has offered some of the most significant advantages to medicine.

    Major players in the Captive Power Generation market, including Doosan Corporation, ArcelorMittal, Hindustan Zinc., General Electric, Reliance Industries, Jindal Steel & Power, Hindalco Industries, Essar Steel, Bharat Heavy Electricals, Clarke Energy, a Kohler Company, Thermax Limited, NALCO India, Siemens, Wartsila, and LafargeHolcim, and others, are attempting to increase market demand by investing in research and development operations.

    Hindustan Zinc Ltd. (HZL), a branch of Vedanta Limited, is a mining and metals company. In addition to making sulfuric acid, it also manufactures zinc, lead, and silver. The company manages several mines, including those in Kayad, Rajpura Dariba, Zawar, and Sindesar Khurd. The Debari Zinc Smelter, the Dariba Smelting Complex, and the Chanderiya Lead Zinc Smelter Complex are a few of the smelters it operates in Rajasthan. The company oversees thermal captive power plants with a 561.19 MW capacity for power production in Rajasthan.

    The company also has the ability to generate 273.5 MW of wind energy and 349.19 MW of green energy. HZL's corporate headquarters are in Udaipur, Rajasthan, in India.

    The business Jindal Steel & Power Ltd. (JSPL) develops, constructs, and operates power plants in addition to producing steel, sponge iron, pellets, and castings. Its steel product range consists of TMT bars, long track rails, heads hardened rails, parallel flange beams and columns, angles and channels, plates, coils, wire rods, cast round, and billets. The company generates electricity using thermal, hydroelectric, and renewable energy sources. Additionally, JSPL provides assistance with the growth of industry, aviation, and real estate. It conducts business throughout Asia, Africa, and the Middle East.

    The company has steel mills in Odisha, Chhattisgarh, and Jharkhand as well as power producing facilities in India. The JSPL corporate headquarters are in New Delhi, Delhi, India.

    Key Companies in the Captive Power Generation Market market include

    Industry Developments

    Aug-2022:To cater to the captive needs of round-the-clock power and intermittent energy for Green Hydrogen, Reliance Industries plans on establishing 20 GW of solar energy generation capacity by 2025.

    Future Outlook

    Captive Power Generation Market Future Outlook

    The Global Captive Power Generation Market is projected to grow at a 4.80% CAGR from 2025 to 2035, driven by increasing energy demands, sustainability initiatives, and technological advancements.

    New opportunities lie in:

    • Invest in hybrid energy systems integrating renewables and traditional sources for enhanced reliability.
    • Develop energy management software to optimize captive power usage and reduce costs.
    • Explore partnerships with industries to provide tailored captive power solutions, enhancing energy security.

    By 2035, the market is expected to achieve robust growth, positioning itself as a critical component of global energy strategies.

    Market Segmentation

    Captive Power Generation Fuel Outlook

    • Diesel
    • Gas
    • Coal
    • Others

    Captive Power Generation End Use Outlook

    • Industrial
    • Commercial
    • Residential

    Captive Power Generation Regional Outlook

    • US
    • Canada

    Captive Power Generation Ownership Outlook

    • Single Ownership
    • Multiple Ownership

    Captive Power Generation Technology Outlook

    • Heat Exchangers
    • Turbines
    • Gas Engines
    • Transformers
    • Others

    Captive Power Generation Connectivity Outlook

    • OffGrid
    • On-Grid

    Report Scope

    Report Attribute/Metric Details
    Market Size 2024 USD 562.95 Billion
    Market Size 2035 943.05 (Value (USD Billion))
    Compound Annual Growth Rate (CAGR) 4.80% (2025 - 2035)
    Base Year 2024
    Market Forecast Period 2025 - 2035
    Historical Data 2018- 2022
    Market Forecast Units Value (USD Billion)
    Report Coverage Revenue Forecast, Market Competitive Landscape, Growth Factors, and Trends
    Segments Covered Technology, Fuel, Ownership, Connectivity, End Use, and Region
    Geographies Covered North America, Europe, Asia Pacific, and the Rest of the World
    Countries Covered The U.S., Canada, German, France, UK, Italy, Spain, China, Japan, India, Australia, South Korea, and Brazil
    Key Companies Profiled Doosan Corporation, ArcelorMittal, Hindustan Zinc., General Electric, Reliance Industries, Jindal Steel & Power, Hindalco Industries, Essar Steel, Bharat Heavy Electricals, Clarke Energy, a Kohler Company, Thermax Limited, NALCO India, Siemens, Wartsila, and LafargeHolcim.
    Key Market Opportunities New product launches and R&D Amongst major key Players.
    Key Market Dynamics The Increasing energy intensive industries in developing countries.
    Market Size 2025 589.98 (Value (USD Billion))

    Market Highlights

    Author

    Anshula Mandaokar
    Team Lead - Research

    She holds an experience of about 6+ years in market research and business consulting, working under the spectrum of information communication technology, telecommunications and semiconductor domains. aarti conceptualizes and implements a scalable business strategy and provides strategic leadership to the clients. her expertise lies in market estimation, competitive intelligence, pipeline analysis, customer assessment, etc.

    Leave a Comment

    Latest Comments

    John Doe
    john@example.com

    This is a great article! Really helped me understand the topic better.

    Posted on July 23, 2025, 10:15 AM
    Jane Smith
    jane@domain.com

    Thanks for sharing this. I’ve bookmarked it for later reference.

    Posted on July 22, 2025, 7:45 PM

    FAQs

    How much is the Captive Power Generation market?

    The Captive Power Generation market size was valued at USD 533.6 Billion in 2023.

    What is the growth rate of the Captive Power Generation market?

    The market is projected to grow at a CAGR of 4.80% during the forecast period, 2024-2032.

    Which region held the largest market share in the Captive Power Generation market?

    Asia-Pacific had the largest share in the market

    Who are the key players in the Captive Power Generation market?

    The key players in the market are Doosan Corporation, ArcelorMittal, Hindustan Zinc., General Electric, Reliance Industries, Jindal Steel & Power, Hindalco Industries, Essar Steel, Bharat Heavy Electricals, Clarke Energy, a Kohler Company, Thermax Limited, NALCO India, Siemens, Wartsila, and LafargeHolcim.

    Which fuel led the Captive Power Generation market?

    The Cole category dominated the market in 2022.

    Which technology had the largest market share in the Captive Power Generation market?

    The gas engine had the largest share in the market.

    1. Executive Summary
    2. Market Introduction
      1. Market Definition
      2. Scope of The Study
      3. Market Structure
    3. Research Methodology
      1. Primary Research
      2. Secondary Research
      3. Market Size Estimation
      4. Forecast Model
      5. List of Assumptions
    4. Market Landscape
    5. Market Dynamics
      1. Introduction
      2. Market Drivers
      3. Market Restraints
      4. Market Opportunities
      5. Porter’s Five
        1. Bargaining Power of Suppliers
        2. Threat of Substitutes
        3. Intensity of Rivalry
      6. Value Chain/Supply Chain Analysis
    6. Global Captive Power Generation
      1. Market Estimates & Forecast, by Region,
        1. Market Estimates & Forecast, by Region,
      2. Gas Engines
        1. Market Estimates & Forecast, 2023-2032
        2. Market Estimates
        3. Market Estimates & Forecast, 2023-2032
      3. Transformers
        1. Market Estimates
        2. Market Estimates & Forecast, by Region, 2023-2032
        3. Market Estimates
      4. Others
        1. Market Estimates & Forecast, 2023-2032
        2. Market Estimates &
        3. Market Estimates & Forecast, 2023-2032
    7. Global Captive Power Generation
      1. Market Estimates & Forecast, by Region,
        1. Market
        2. Market Estimates & Forecast, by Region, 2023-2032
      2. Coal
        1. Market Estimates &
      3. Others
        1. Market Estimates & Forecast, 2023-2032
        2. Market Estimates
    8. Global Captive Power Generation Market, by Ownership
      1. Introduction
      2. Single Ownership
        1. Market Estimates
        2. Market Estimates & Forecast, by Region, 2023-2032
      3. Multiple Ownership
        1. Market Estimates
        2. Market Estimates & Forecast, by Region, 2023-2032
    9. Global Captive Power
      1. Introduction
      2. Off-Grid
        1. Market Estimates & Forecast, 2023-2032
        2. Market Estimates
      3. On-Grid
        1. Market Estimates & Forecast, 2023-2032
        2. Market Estimates
    10. Global Captive Power Generation Market, by End Use
      1. Introduction
      2. Industrial
        1. Market Estimates
        2. Market Estimates & Forecast, by Region, 2023-2032
      3. Commercial
        1. Market Estimates
        2. Market Estimates & Forecast, by Region, 2023-2032
      4. Residential
        1. Market Estimates
        2. Market Estimates & Forecast, by Region, 2023-2032
    11. Global Captive Power
      1. Introduction
      2. North America
        1. Market Estimates & Forecast, by Technology, 2023-2032
        2. Market Estimates
        3. Market Estimates & Forecast, by Ownership, 2023-2032
        4. Market Estimates
        5. Market Estimates & Forecast, by End Use,
        6. US
        7. Mexico
        8. Market Estimates & Forecast, by Fuel,
        9. Market Estimates & Forecast, by Connectivity,
        10. Market Estimates & Forecast, by Country,
        11. Russia
        12. France
      3. Asia-Pacific
        1. Market Estimates & Forecast, by Technology,
        2. Market Estimates & Forecast, by Ownership,
        3. Market Estimates & Forecast, by End Use,
        4. China
        5. Japan
        6. Malaysia
      4. Middle East & Africa
        1. Market Estimates & Forecast, by Technology,
        2. Market Estimates & Forecast, by Ownership,
        3. Market Estimates & Forecast, by End Use,
        4. Saudi Arabia
        5. South Africa
        6. Market Estimates & Forecast, by Fuel,
        7. Market Estimates & Forecast, by Connectivity,
        8. Market Estimates & Forecast, by Country,
        9. Argentina
    12. Competitive Landscape
      1. Competitive Benchmarking of the Global Captive
      2. Market Share Analysis: Global Captive Power Generation Market
      3. New Product Developments
      4. Mergers & Acquisitions in the Captive Power Generation
      5. Contracts &
      6. Expansions & Investments in the Captive
    13. Company Profile
      1. Clarke Energy, a Kohler Company
        1. Company Overview
        2. Products/Services Offered
        3. Financial Overview
        4. Key Developments
        5. Key Strategies
        6. SWOT Analysis
      2. Thermax Limited
        1. Company Overview
        2. Products/Services
        3. Financial Overview
        4. Key Developments
        5. Key Strategies
        6. SWOT Analysis
      3. Siemens
        1. Company Overview
        2. Products/Services Offered
        3. Financial Overview
        4. Key Developments
        5. Key Strategies
        6. SWOT Analysis
      4. Wartsila
        1. Company Overview
        2. Products/Services
        3. Financial Overview
        4. Key Developments
        5. Key Strategies
        6. SWOT Analysis
      5. Doosan Corporation
        1. Company Overview
        2. Products/Services Offered
        3. Financial Overview
        4. Key Developments
        5. Key Strategies
        6. SWOT Analysis
      6. ArcelorMittal
        1. Company Overview
        2. Products/Services
        3. Financial Overview
        4. Key Developments
        5. Key Strategies
        6. SWOT Analysis
      7. General Electric
        1. Company Overview
        2. Products/Services Offered
        3. Financial Overview
        4. Key Developments
        5. Key Strategies
        6. SWOT Analysis
      8. Reliance Industries
        1. Company Overview
        2. Products/Services
        3. Company Overview
        4. Products/Services Offered
        5. Financial Overview
        6. Key Developments
        7. Key Strategies
        8. SWOT Analysis
      9. Hindalco Industries
        1. Company Overview
        2. Products/Services Offered
        3. Financial Overview
        4. Key Developments
        5. Key Strategies
        6. SWOT Analysis
      10. Essar Steel
        1. Company Overview
        2. Products/Services
        3. Company Overview
        4. Products/Services Offered
        5. Financial Overview
        6. Key Developments
        7. Key Strategies
        8. SWOT Analysis
    14. Europe Captive Power Generation Market, by Country, 2023-2032 (USD Million)
    15. Europe Captive Power Generation Market, by Technology, 2023-2032 (USD Million)
    16. South America Captive Power Generation Market, by Technology, 2023-2032
    17. South America Captive Power Generation Market, by Fuel, 2023-2032
    18. South America Captive Power Generation Market, by Ownership, 2023-2032
    19. Asia-Pacific Captive Power Generation Market, by End Use, 2023-2032
    20. Global Captive Power Generation Market: by Region, 2023-2032 (USD Million)
    21. US Captive Power Generation Market, by Technology, 2023-2032 (USD Million)
    22. US Captive Power Generation Market, by Connectivity, 2023-2032
    23. Canada Captive Power Generation Market, by Fuel, 2023-2032 (USD Million)
    24. Europe Captive Power Generation Market, by Ownership, 2023-2032
    25. UK Captive Power Generation Market, by Technology, 2023-2032 (USD Million)
    26. UK Captive Power Generation Market, by Connectivity, 2023-2032
    27. France Captive Power Generation Market, by Fuel, 2023-2032 (USD Million)
    28. Germany Captive Power Generation Market, by End Use, 2023-2032
    29. Rest of Europe Captive Power Generation Market, by Technology, 2023-2032
    30. Rest of Europe Captive Power Generation Market, by End Use, 2023-2032
    31. Asia-Pacific Captive Power Generation Market, by Ownership, 2023-2032
    32. China Captive Power Generation Market, by Technology, 2023-2032 (USD Million)
    33. China Captive Power Generation Market, by Connectivity, 2023-2032
    34. India Captive Power Generation Market, by Ownership, 2023-2032
    35. Japan Captive Power Generation Market, by Technology, 2023-2032 (USD Million)
    36. Japan Captive Power Generation Market, by Connectivity, 2023-2032
    37. Australia Captive Power Generation Market, by Ownership, 2023-2032
    38. Malaysia Captive Power Generation Market, by Technology, 2023-2032 (USD Million)
    39. Malaysia Captive Power Generation Market, by End Use, 2023-2032
    40. Rest of Asia-Pacific Captive Power Generation Market, by Connectivity, 2023-2032
    41. Middle East & Africa Captive Power Generation Market, by Region, 2023-2032
    42. Saudi Arabia Captive Power Generation Market, by End Use, 2023-2032
    43. UAE Captive Power Generation Market, by Connectivity, 2023-2032
    44. Rest of Middle East & Africa Captive Power Generation Market, by Technology,
    45. South America Captive Power Generation Market, by Country, 2023-2032
    46. Brazil Captive Power Generation Market, by End Use, 2023-2032
    47. Argentina Captive Power Generation Market, by Connectivity, 2023-2032
    48. Rest of South America Captive Power Generation Market, by Ownership, 2023-2032
    49. Market Dynamics
    50. Impact Analysis: Market Drivers
    51. Global Captive Power Generation Market Share, by Technology, 2023 (%)
    52. (%)
    53. Global Captive Power Generation Market, by Ownership, 2023-2032 (USD Million)
    54. Global Captive Power Generation Market, by End Use, 2023-2032 (USD Million)
    55. North America Captive Power Generation Market, by Country, 2023-2032 (USD Million)
    56. South America Captive Power Generation Market, by Region, 2023-2032 (USD Million)

    Captive Power Generation Market Segmentation

    Captive Power Generation Market Technology Outlook (USD Billion, 2018-2032)

    • Heat Exchangers
    • Turbines
    • Gas Engines
    • Transformers
    • Others

    Captive Power Generation Market Fuel Outlook (USD Billion, 2018-2032)

    • Diesel
    • Gas
    • Coal
    • Others

    Captive Power Generation Market Ownership Outlook (USD Billion, 2018-2032)

    • Single Ownership
    • Multiple Ownership

    Captive Power Generation Market Connectivity Outlook (USD Billion, 2018-2032)

    • OffGrid
    • On-Grid

    Captive Power Generation Market End Use Outlook (USD Billion, 2018-2032)

    • Industrial
    • Commercial
    • Residential

    Captive Power Generation Market Regional Outlook (USD Billion, 2018-2032)

    • North America Outlook (USD Billion, 2018-2032)

      • Captive Power Generation Market by Technology
        • Heat Exchangers
        • Turbines
        • Gas Engines
        • Transformers
        • Others
      • Captive Power Generation Market by Fuel
        • Diesel
        • Gas
        • Coal
        • Others
      • Captive Power Generation Market by Ownership
        • Single Ownership
        • Multiple Ownership
      • Captive Power Generation Market by Connectivity
        • OffGrid
        • On-Grid
      • Captive Power Generation Market by End Use
        • Industrial
        • Commercial
        • Residential
      • US Outlook (USD Billion, 2018-2032)

      • Captive Power Generation Market by Technology
        • Heat Exchangers
        • Turbines
        • Gas Engines
        • Transformers
        • Others
      • Captive Power Generation Market by Fuel
        • Diesel
        • Gas
        • Coal
        • Others
      • Captive Power Generation Market by Ownership
        • Single Ownership
        • Multiple Ownership
      • Captive Power Generation Market by Connectivity
        • OffGrid
        • On-Grid
      • Captive Power Generation Market by End Use
        • Industrial
        • Commercial
        • Residential
      • Canada Outlook (USD Billion, 2018-2032)

      • Captive Power Generation Market by Technology
        • Heat Exchangers
        • Turbines
        • Gas Engines
        • Transformers
        • Others
      • Captive Power Generation Market by Fuel
        • Diesel
        • Gas
        • Coal
        • Others
      • Captive Power Generation Market by Ownership
        • Single Ownership
        • Multiple Ownership
      • Captive Power Generation Market by Connectivity
        • OffGrid
        • On-Grid
      • Captive Power Generation Market by End Use
        • Industrial
        • Commercial
        • Residential
    • Europe Outlook (USD Billion, 2018-2032)

      • Captive Power Generation Market by Technology
        • Heat Exchangers
        • Turbines
        • Gas Engines
        • Transformers
        • Others
      • Captive Power Generation Market by Fuel
        • Diesel
        • Gas
        • Coal
        • Others
      • Captive Power Generation Market by Ownership
        • Single Ownership
        • Multiple Ownership
      • Captive Power Generation Market by Connectivity
        • OffGrid
        • On-Grid
      • Captive Power Generation Market by End Use
        • Industrial
        • Commercial
        • Residential
      • Germany Outlook (USD Billion, 2018-2032)

      • Captive Power Generation Market by Technology
        • Heat Exchangers
        • Turbines
        • Gas Engines
        • Transformers
        • Others
      • Captive Power Generation Market by Fuel
        • Diesel
        • Gas
        • Coal
        • Others
      • Captive Power Generation Market by Ownership
        • Single Ownership
        • Multiple Ownership
      • Captive Power Generation Market by Connectivity
        • OffGrid
        • On-Grid
      • Captive Power Generation Market by End Use
        • Industrial
        • Commercial
        • Residential
      • France Outlook (USD Billion, 2018-2032)

      • Captive Power Generation Market by Technology
        • Heat Exchangers
        • Turbines
        • Gas Engines
        • Transformers
        • Others
      • Captive Power Generation Market by Fuel
        • Diesel
        • Gas
        • Coal
        • Others
      • Captive Power Generation Market by Ownership
        • Single Ownership
        • Multiple Ownership
      • Captive Power Generation Market by Connectivity
        • OffGrid
        • On-Grid
      • Captive Power Generation Market by End Use
        • Industrial
        • Commercial
        • Residential
      • UK Outlook (USD Billion, 2018-2032)

      • Captive Power Generation Market by Technology
        • Heat Exchangers
        • Turbines
        • Gas Engines
        • Transformers
        • Others
      • Captive Power Generation Market by Fuel
        • Diesel
        • Gas
        • Coal
        • Others
      • Captive Power Generation Market by Ownership
        • Single Ownership
        • Multiple Ownership
      • Captive Power Generation Market by Connectivity
        • OffGrid
        • On-Grid
      • Captive Power Generation Market by End Use
        • Industrial
        • Commercial
        • Residential
      • Italy Outlook (USD Billion, 2018-2032)

      • Captive Power Generation Market by Technology
        • Heat Exchangers
        • Turbines
        • Gas Engines
        • Transformers
        • Others
      • Captive Power Generation Market by Fuel
        • Diesel
        • Gas
        • Coal
        • Others
      • Captive Power Generation Market by Ownership
        • Single Ownership
        • Multiple Ownership
      • Captive Power Generation Market by Connectivity
        • OffGrid
        • On-Grid
      • Captive Power Generation Market by End Use
        • Industrial
        • Commercial
        • Residential
      • Spain Outlook (USD Billion, 2018-2032)

      • Captive Power Generation Market by Technology
        • Heat Exchangers
        • Turbines
        • Gas Engines
        • Transformers
        • Others
      • Captive Power Generation Market by Fuel
        • Diesel
        • Gas
        • Coal
        • Others
      • Captive Power Generation Market by Ownership
        • Single Ownership
        • Multiple Ownership
      • Captive Power Generation Market by Connectivity
        • OffGrid
        • On-Grid
      • Captive Power Generation Market by End Use
        • Industrial
        • Commercial
        • Residential
      • Rest Of Europe Outlook (USD Billion, 2018-2032)

      • Captive Power Generation Market by Technology
        • Heat Exchangers
        • Turbines
        • Gas Engines
        • Transformers
        • Others
      • Captive Power Generation Market by Fuel
        • Diesel
        • Gas
        • Coal
        • Others
      • Captive Power Generation Market by Ownership
        • Single Ownership
        • Multiple Ownership
      • Captive Power Generation Market by Connectivity
        • OffGrid
        • On-Grid
      • Captive Power Generation Market by End Use
        • Industrial
        • Commercial
        • Residential
    • Asia-Pacific Outlook (USD Billion, 2018-2032)

      • Captive Power Generation Market by Technology
        • Heat Exchangers
        • Turbines
        • Gas Engines
        • Transformers
        • Others
      • Captive Power Generation Market by Fuel
        • Diesel
        • Gas
        • Coal
        • Others
      • Captive Power Generation Market by Ownership
        • Single Ownership
        • Multiple Ownership
      • Captive Power Generation Market by Connectivity
        • OffGrid
        • On-Grid
      • Captive Power Generation Market by End Use
        • Industrial
        • Commercial
        • Residential
      • China Outlook (USD Billion, 2018-2032)

      • Captive Power Generation Market by Technology
        • Heat Exchangers
        • Turbines
        • Gas Engines
        • Transformers
        • Others
      • Captive Power Generation Market by Fuel
        • Diesel
        • Gas
        • Coal
        • Others
      • Captive Power Generation Market by Ownership
        • Single Ownership
        • Multiple Ownership
      • Captive Power Generation Market by Connectivity
        • OffGrid
        • On-Grid
      • Captive Power Generation Market by End Use
        • Industrial
        • Commercial
        • Residential
      • Japan Outlook (USD Billion, 2018-2032)

      • Captive Power Generation Market by Technology
        • Heat Exchangers
        • Turbines
        • Gas Engines
        • Transformers
        • Others
      • Captive Power Generation Market by Fuel
        • Diesel
        • Gas
        • Coal
        • Others
      • Captive Power Generation Market by Ownership
        • Single Ownership
        • Multiple Ownership
      • Captive Power Generation Market by Connectivity
        • OffGrid
        • On-Grid
      • Captive Power Generation Market by End Use
        • Industrial
        • Commercial
        • Residential
      • India Outlook (USD Billion, 2018-2032)

      • Captive Power Generation Market by Technology
        • Heat Exchangers
        • Turbines
        • Gas Engines
        • Transformers
        • Others
      • Captive Power Generation Market by Fuel
        • Diesel
        • Gas
        • Coal
        • Others
      • Captive Power Generation Market by Ownership
        • Single Ownership
        • Multiple Ownership
      • Captive Power Generation Market by Connectivity
        • OffGrid
        • On-Grid
      • Captive Power Generation Market by End Use
        • Industrial
        • Commercial
        • Residential
      • Australia Outlook (USD Billion, 2018-2032)

      • Captive Power Generation Market by Technology
        • Heat Exchangers
        • Turbines
        • Gas Engines
        • Transformers
        • Others
      • Captive Power Generation Market by Fuel
        • Diesel
        • Gas
        • Coal
        • Others
      • Captive Power Generation Market by Ownership
        • Single Ownership
        • Multiple Ownership
      • Captive Power Generation Market by Connectivity
        • OffGrid
        • On-Grid
      • Captive Power Generation Market by End Use
        • Industrial
        • Commercial
        • Residential
      • Rest of Asia-Pacific Outlook (USD Billion, 2018-2032)

      • Captive Power Generation Market by Technology
        • Heat Exchangers
        • Turbines
        • Gas Engines
        • Transformers
        • Others
      • Captive Power Generation Market by Fuel
        • Diesel
        • Gas
        • Coal
        • Others
      • Captive Power Generation Market by Ownership
        • Single Ownership
        • Multiple Ownership
      • Captive Power Generation Market by Connectivity
        • OffGrid
        • On-Grid
      • Captive Power Generation Market by End Use
        • Industrial
        • Commercial
        • Residential
    • Rest of the World Outlook (USD Billion, 2018-2032)

      • Captive Power Generation Market by Technology
        • Heat Exchangers
        • Turbines
        • Gas Engines
        • Transformers
        • Others
      • Captive Power Generation Market by Fuel
        • Diesel
        • Gas
        • Coal
        • Others
      • Captive Power Generation Market by Ownership
        • Single Ownership
        • Multiple Ownership
      • Captive Power Generation Market by Connectivity
        • OffGrid
        • On-Grid
      • Captive Power Generation Market by End Use
        • Industrial
        • Commercial
        • Residential
      • Middle East Outlook (USD Billion, 2018-2032)

      • Captive Power Generation Market by Technology
        • Heat Exchangers
        • Turbines
        • Gas Engines
        • Transformers
        • Others
      • Captive Power Generation Market by Fuel
        • Diesel
        • Gas
        • Coal
        • Others
      • Captive Power Generation Market by Ownership
        • Single Ownership
        • Multiple Ownership
      • Captive Power Generation Market by Connectivity
        • OffGrid
        • On-Grid
      • Captive Power Generation Market by End Use
        • Industrial
        • Commercial
        • Residential
      • Africa Outlook (USD Billion, 2018-2032)

      • Captive Power Generation Market by Technology
        • Heat Exchangers
        • Turbines
        • Gas Engines
        • Transformers
        • Others
      • Captive Power Generation Market by Fuel
        • Diesel
        • Gas
        • Coal
        • Others
      • Captive Power Generation Market by Ownership
        • Single Ownership
        • Multiple Ownership
      • Captive Power Generation Market by Connectivity
        • OffGrid
        • On-Grid
      • Captive Power Generation Market by End Use
        • Industrial
        • Commercial
        • Residential
      • Latin America Outlook (USD Billion, 2018-2032)

      • Captive Power Generation Market by Technology
        • Heat Exchangers
        • Turbines
        • Gas Engines
        • Transformers
        • Others
      • Captive Power Generation Market by Fuel
        • Diesel
        • Gas
        • Coal
        • Others
      • Captive Power Generation Market by Ownership
        • Single Ownership
        • Multiple Ownership
      • Captive Power Generation Market by Connectivity
        • OffGrid
        • On-Grid
      • Captive Power Generation Market by End Use
        • Industrial
        • Commercial
        • Residential
    Infographic

    Free Sample Request

    Kindly complete the form below to receive a free sample of this Report

    Get Free Sample

    Customer Strories

    “I am very pleased with how market segments have been defined in a relevant way for my purposes (such as "Portable Freezers & refrigerators" and "last-mile"). In general the report is well structured. Thanks very much for your efforts.”

    Victoria Milne

    Founder
    Case Study
    Chemicals and Materials