• Cat-intel
  • MedIntelliX
  • Resources
  • About Us
  • Request Free Sample ×

    Kindly complete the form below to receive a free sample of this Report

    Leading companies partner with us for data-driven Insights

    clients tt-cursor

    Business Travel Market

    ID: MRFR/CR/14610-HCR
    128 Pages
    Pradeep Nandi
    September 2025

    Global Business Travel Market Research Report Information by Type (Managed Business Travel and Unmanaged Business Travel), by Purpose (Marketing, Internal Meetings, Trade Shows, Product Launch, and Others), by Expenditure (Marketing Travel Fare, Lodging, Dining, and Others), by Age Group (Travelers Below 40 Years and Travelers Above 40 Years ), by Traveler (Group Travel, Solo Travel, and Service), by Service (Food and Lodging and Recreation Activity), by Industry (Government and Corporate) And By Region (North America, Europe, Asia-Pacific, ...

    Share:
    Download PDF ×

    We do not share your information with anyone. However, we may send you emails based on your report interest from time to time. You may contact us at any time to opt-out.

    Business Travel Market Research - Global Forecast to 2034 Infographic
    Purchase Options
    $ 4,950.0
    $ 5,950.0
    $ 7,250.0
    Table of Contents

    Business Travel Market Summary

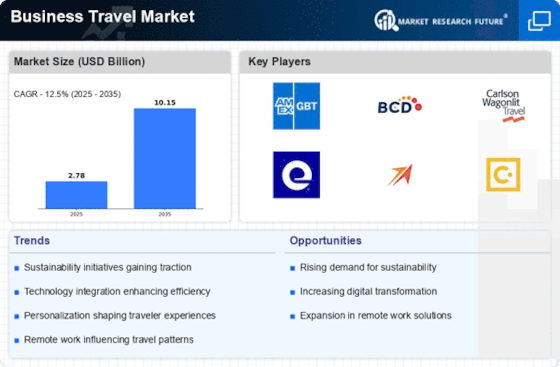
    As per Market Research Future Analysis, the Business Travel Market was valued at 2.78 USD Billion in 2024 and is projected to grow to 9.03 USD Billion by 2034, with a CAGR of 12.50% from 2025 to 2034. Key drivers include globalization and technological advancements that enhance communication and collaboration. The Managed Business Travel segment leads the market, driven by corporate governance and cost control. Internal Meetings account for a significant portion of travel purpose, while Lodging dominates expenditure. The market is primarily driven by travelers below 40 years, with solo travel being the most common type. North America holds the largest market share, followed by Europe and Asia-Pacific, which is expected to grow the fastest.

    Key Market Trends & Highlights

    The Business Travel Market is experiencing significant growth driven by globalization and the need for in-person interactions.

    • Market Size in 2024: USD 2.78 Billion
    • Projected Market Size by 2034: USD 9.03 Billion
    • CAGR from 2025 to 2034: 12.50%
    • Managed Business Travel segment accounts for over 50% of market revenue

    Market Size & Forecast

    2024 Market Size USD 2.78 Billion
    2025 Market Size USD 3.13 Billion
    2034 Market Size USD 9.03 Billion
    CAGR (2025-2034) 12.50%

    Major Players

    Key players include ADEKA CORPORATION, Airbnb, Inc., American Express Company, BCD Group, Booking Holdings, CWT Solutions, Corporate Travel Management, Expedia, Inc., Fareportal, Flight Centre Travel Group Limited, Wexas Travel, Hogg Robinson Ltd, Priceline, Egencia LLC, Frosch International Travel, Ovation Travel Group, and Travel Leaders Group.

    Business Travel Market Trends

    Globalization of businesses is driving market growth

    Market CAGR for Business Travel is being driven by the widespread globalization of businesses. Companies are expanding their operations across borders to tap into new markets. They expand across borders to reach new markets, find diverse talent, and make their supply chains better. Meeting in person is very important even with virtual technology getting better. It helps build understanding, trust, and relationships that are hard to achieve online.

    Meeting face-to-face allows for better understanding through body language, reducing misunderstandings. Trust formed in person is often stronger, affecting big business deals. This needs for good communication and relationships makes professionals travel for conferences, trade shows, and client meetings. So, the business travel market benefits because in-person collaboration is crucial in certain business situations.

    Even though technology has changed how businesses work by allowing virtual collaboration, it also makes business travel more important. As businesses get more complex with global supply chains and diverse teams, being physically present becomes more necessary.

    According to A report by the International Monetary Fund (IMF) says that world trade has been growing, showing that global economies are more connected. In 2021, global trade volumes increased by about 10.2%, showing that businesses are expanding internationally. Because of this, the demand for Business Travel is expected to go up as people prefer face-to-face communication. Thus, driving the Business Travel market revenue.

    The Global Business Travel Market is poised for a robust recovery, driven by increasing corporate investments and a renewed focus on international collaboration.

    U.S. Department of Commerce

    Business Travel Market Drivers

    Global Economic Growth

    The Global Business Travel Market Industry is closely tied to economic performance, with growth in GDP correlating with increased business travel activities. As economies recover and expand, companies are more inclined to invest in travel to explore new markets and strengthen existing partnerships. Projections indicate that by 2035, the market could reach 10.2 USD Billion, underscoring the potential for growth driven by economic factors. Regions experiencing rapid economic development, such as Asia-Pacific, are likely to see a surge in business travel demand, as businesses seek to capitalize on emerging opportunities and enhance their global presence.

    Market Growth Projections

    The Global Business Travel Market Industry is projected to experience robust growth in the coming years, with significant increases in market size anticipated. In 2024, the market is estimated at 2.78 USD Billion, with expectations to reach 10.2 USD Billion by 2035. This growth trajectory suggests a compound annual growth rate of 12.5% from 2025 to 2035, indicating a strong demand for business travel services. The upward trend is likely driven by various factors, including economic recovery, technological advancements, and an increasing focus on networking and collaboration, all contributing to a dynamic and evolving market landscape.

    Technological Advancements

    Technological innovations are reshaping the Global Business Travel Market Industry, enhancing efficiency and convenience for travelers. The integration of artificial intelligence and machine learning in travel management systems allows companies to streamline booking processes and optimize travel itineraries. Additionally, mobile applications facilitate real-time updates and communication, significantly improving the traveler experience. As organizations increasingly adopt these technologies, the market is expected to expand, driven by the need for seamless travel solutions. This shift not only enhances productivity but also aligns with the evolving expectations of modern business travelers, who seek personalized and efficient travel experiences.

    Rising Corporate Expenditures

    The Global Business Travel Market Industry is experiencing a notable increase in corporate expenditures as companies prioritize travel for client meetings, conferences, and networking opportunities. In 2024, the market is projected to reach 2.78 USD Billion, reflecting a growing recognition of the value of face-to-face interactions in fostering business relationships. This trend is particularly evident in sectors such as technology and finance, where personal engagement is deemed essential for closing deals and maintaining client satisfaction. As organizations allocate more resources to travel, the industry is likely to see sustained growth, indicating a robust demand for business travel services.

    Increased Focus on Networking and Collaboration

    The Global Business Travel Market Industry is witnessing a heightened emphasis on networking and collaboration among professionals. As businesses recognize the importance of building relationships and sharing knowledge, travel for conferences, trade shows, and industry events is on the rise. This trend is particularly pronounced in sectors such as healthcare and technology, where collaboration can lead to innovation and competitive advantage. The market's growth is further supported by the expectation of a compound annual growth rate of 12.5% from 2025 to 2035, indicating a sustained commitment to fostering professional connections through travel.

    Corporate Travel Policies and Sustainability Initiatives

    The Global Business Travel Market Industry is increasingly influenced by corporate travel policies that emphasize sustainability and responsible travel practices. Companies are adopting measures to reduce their carbon footprint, such as prioritizing eco-friendly accommodations and transportation options. This shift not only aligns with corporate social responsibility goals but also appeals to a growing segment of environmentally conscious travelers. As organizations implement these policies, the demand for sustainable travel solutions is likely to rise, contributing to the overall growth of the market. This trend reflects a broader societal shift towards sustainability, impacting travel choices and industry practices.

    Market Segment Insights

    Business Travel Type Insights

    The Business Travel market segmentation, based on Type includes Managed Business Travel and Unmanaged Business Travel. The Managed Business Travel segment dominated the market, accounting for more than half of market revenue. This is linked to the increasing emphasis on corporate governance, cost control, and the need for comprehensive travel management solutions.

    Business Travel Purpose Insights

    The Business Travel market segmentation, based on Purpose includes Marketing, Internal Meetings, Trade Shows, Product Launch, and Others. The Internal Meetings segment dominated the market, accounting for more than a quarter of market revenue. This is attributed to Internal meetings being a fundamental aspect of business operations, requiring frequent face-to-face interactions for strategic planning, team collaboration, and decision-making.

    Business Travel Expenditure Insights

    The Business Travel market segmentation, based on Expenditure includes Marketing Travel Fare, Lodging, Dining, and Others. The Lodging segment dominated the market, accounting for above one-third of market revenue. This growth is linked to the high cost of accommodation and its crucial need.

    Business Travel Age Group Insights

    The Business Travel market segmentation, based on Age Groups includes Travelers Below 40 Years and Travelers Above 40 Years. The Travelers Below 40 Years segment dominated the market, accounting for more than half of market revenue.  Younger professionals below 40 years are often more mobile, engaged in networking, and involved in business development activities.

    Business Travel Traveler Insights

    The Global Business Travel market segmentation, based on Travelers includes Group Travel, Solo Travel, and Services. The Solo Travel segment dominated the market, accounting for more than one-third of market revenue. This is attributed to the nature of business tasks that often require individual representation.

    Business Travel Service Insights

    The Business Travel market segmentation, based on Service includes Food and Lodging and Recreation Activities. The Food and Lodging segment dominated the market, accounting for more than half of market revenue. This is attributed to the high cost of accommodation and dining and its indispensable needs.

    Business Travel Industry Insights

    The Business Travel market segmentation, based on Industry includes Government and Corporate. The Corporate segment dominated the market, accounting for more than half of market revenue.  This is linked to business travel being integral to corporate activities such as client meetings, conferences, and project management.

    Figure 1: Global Business Travel Market, by Expenditure, 2022 & 2032 (USD Billion)

    Secondary Research, Primary Research, MRFR Database and Analyst Review

    Get more detailed insights about Business Travel Market Research - Global Forecast to 2034

    Regional Insights

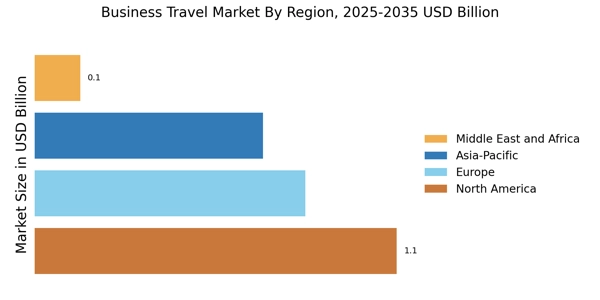
    By region, the study provides market insights into North America, Europe, Asia-Pacific, and Rest of the World. North America dominates due to its economic power, with a high concentration of multinational corporations and a robust business environment. The region's advanced infrastructure, technological innovation, and a large number of corporate headquarters make it a hub for business activities, driving significant demand for business travel services.

    Further, the major countries studied in the market report are The US, Canada, Germany, France, the UK, Italy, Spain, China, Japan, India, Australia, South Korea, and Brazil.

    Figure 2: Global Business Travel Market Share By Region 2022 (USD Billion)

    Global Business Travel Market Share By Region 2022

    Secondary Research, Primary Research, MRFR Database and Analyst Review

    Europe’s Business Travel market accounts for the second-largest market share due to its strong economic ties, extensive business networks, and historical significance as a global business center. Further, the German market held the largest market share, and the UK Business Travel market was the fastest-growing market in the European region

    The Asia-Pacific Market is expected to grow at the fastest CAGR from 2023 to 2032. This is due to rapid economic growth, emerging markets, and a surge in business opportunities. The region's dynamic business landscape, increasing foreign investments, and a growing number of business events position it as a key player in the market. Moreover, China’s Business Travel market held the largest market share, and the Indian Business Travel market was the fastest-growing market in the Asia-Pacific region.

    Key Players and Competitive Insights

    Leading market players are leveraging advanced technologies, such as travel management platforms, mobile apps, and AI-driven solutions, to streamline booking processes, enhance traveler experience, and provide real-time updates. Market participants are also adopting a variety of strategic activities to expand their global presence, with important market developments including new product launches, contractual agreements, mergers and acquisitions, personalization of Services, integration of technology, higher investments, and collaboration with other organizations. To expand and survive in a more competitive and rising market climate, the Business Travel industry must offer comprehensive service solutions.

    Utilizing data analytics to gather insights into traveler behavior, preferences, and spending patterns helps companies tailor their services is one of the key business tactics used by manufacturers in the global Business Travel industry to increase their market share. In recent years, the Business Travel industry has offered some of the most significant advantages to Consumers.

    Major players in the Business Travel market, including ADEKA CORPORATION Airbnb, Inc., Expedia, Inc., Fareportal, Flight Centre Travel Group Limited, Wexas Travel, Hogg Robinson Ltd, Priceline, American Express Company, and others, are attempting to increase market demand by investing in product development to increase their product line and cater to diverse consumer needs.

    Started in 1975 by John Fentener van Vlissingen, BCD Group is now a big name in travel. It has two parts, BCD Travel, and Park ‘N Fly, offering travel services and technology to lots of customers every day. Even though it began with just $10,000, BCD Group has grown a ton, going from a small business to a major player in the travel industry. They focus on being excellent, innovative, and making customers happy, making them a trusted leader in travel.

    In February 2023, BCD Travel expanded its agreement with Amadeus as the forward-thinking travel management company (TMC) refined its global technology approach to capitalize on opportunities in the new era of business travel.

    Founded as a global leader in business travel management services, Corporate Travel Management (CTM) is dedicated to enhancing savings, efficiency, safety, and sustainability for businesses and their travelers worldwide. Choosing CTM means experiencing a distinctive approach to global travel – a bespoke program crafted collaboratively and consistently delivered with expertise across every region of operation. CTM specializes in designing travel programs that yield strategic outcomes for all facets of a business and every team member, ensuring a tailored and impactful travel experience across all operational regions.

    In December 2022, CWT Global B.V. expanded its global partnership with Paramount Global, a multinational media and entertainment conglomerate. This move involved managing Paramount's expanded travel business.

    Key Companies in the Business Travel Market market include

    Industry Developments

    Future Outlook

    Business Travel Market Future Outlook

    The Global Business Travel Market is projected to grow at a 12.5% CAGR from 2024 to 2035, driven by technological advancements, increased corporate spending, and evolving travel preferences.

    New opportunities lie in:

    • Leverage AI-driven travel management solutions to enhance efficiency and cost savings.
    • Expand sustainable travel options to meet growing corporate responsibility demands.
    • Develop personalized travel experiences using data analytics to improve employee satisfaction.

    By 2035, the market is expected to reach unprecedented heights, reflecting robust growth and innovation.

    Market Segmentation

    Business Travel Type Outlook

    • Managed Business Travel
    • Unmanaged Business Travel

    Business Travel Purpose Outlook

    • Marketing
    • Internal Meetings
    • Trade Shows
    • Product Launch
    • Others

    Business Travel Service Outlook

    • Food and Lodging
    • Recreation Activity

    Business Travel Industry Outlook

    • Government
    • Corporate

    Business Travel Regional Outlook

    Asia-Pacific
    • China
    • Japan
    • India
    • Australia
    • South Korea
    • Rest of Asia-Pacific

    Business Travel Traveler Outlook

    • Group Travel
    • Solo Travel
    • Service

    Business Travel Age Group Outlook

    • Travelers Below 40 Years
    • Travelers Above 40 Years

    Business Travel Expenditure Outlook

    • Marketing Travel Fare
    • Lodging
    • Dining
    • Others

    Report Scope

    Report Attribute/Metric Details
    Market Size 2024    2.78 (USD Billion)
    Market Size 2025    3.13 (USD Billion)
    Market Size 2034     9.03 (USD Billion)
    Compound Annual Growth Rate (CAGR)     12.50% (2025 - 2034)
    Report Coverage Revenue Forecast, Competitive Landscape, Growth Factors, and Trends
    Base Year 2024
    Market Forecast Period 2025 - 2034
    Historical Data 2019 - 2023
    Report Coverage Revenue Forecast, Market Competitive Landscape, Growth Factors, and Trends
    Segments Covered Type, Purpose, Expenditure, Age Group, Traveler, Service, Industry, and Region
    Geographies Covered North America, Europe, Asia Pacific, and the Rest of the World
    Countries Covered The US, Canada, Germany, France, UK, Italy, Spain, China, Japan, India, Australia, South Korea, and Brazil
    Key Companies Profiled ADEKA CORPORATION Airbnb, Inc., Expedia, Inc., Fareportal, Flight Centre Travel Group Limited, Wexas Travel, Hogg Robinson Ltd, Priceline, American Express Company, BCD Group, Booking Holdings, CWT Solutions, Corporate Travel Management, Egencia LLC, Frosch International Travel, Ovation Travel Group, and Travel Leaders Group
    Key Market Opportunities ·        Advancements in technology facilitating efficient communication and collaboration across borders contribute to the sustained demand for business travel services.
    Key Market Dynamics ·        The increasing globalization of businesses and the growing need for face-to-face interactions are key drivers propelling the business travel market

    Market Highlights

    Author
    Pradeep Nandi
    Senior Research Analyst

    I have a bachelor's degree in mechanical engineering and an MBA. I have more than two years of expertise in the retail, food, and beverage, chemical, and material industries, and hence have developed a sound cross-domain expertise. A firm believer in lifelong learning and sharing of knowledge. Having a proclivity for hatching ideas and trying to absorb as much information as possible in a short amount of time. Introducing corporates to the data and insight, which enables them to move from probability to possibility, has been my key areas of interest. 

    Leave a Comment

    FAQs

    How much is the Business Travel market?

    The global Business Travel market size was valued at USD 2.78 Billion in 2024.

    What is the growth rate of the Business Travel market?

    The global market is projected to grow at a CAGR of 12.50% during the forecast period, 2025-2034.

    Which region held the largest market share in the Business Travel market?

    North America had the largest share of the global market

    Who are the key players in the Business Travel market?

    The key players in the market are ADEKA CORPORATION Airbnb, Inc., Expedia, Inc., Fareportal, Flight Centre Travel Group Limited, Wexas Travel, Hogg Robinson Ltd, Priceline, and American Express Company.

    Which Type led the Business Travel market?

    The Managed Business Travel category dominated the market in 2022.

    Which Age Group had the largest market share in the Business Travel market?

    The Travelers Below 40 Years had the largest share in the global market.

    1. Executive
    2. summary
    3. Market Introduction
    4. Definition
    5. Scope of the Study
    6. Research Objective
    7. Assumptions
    8. Limitations
    9. Research Methodology
    10. Overview
    11. Data
    12. Mining
    13. Secondary Research
    14. Primary Research
    15. Primary Interviews and Information Gathering Process
    16. Breakdown of Primary Respondents
    17. Forecasting
    18. Model
    19. Market Size Estimation
    20. Bottom-Up
    21. Approach
    22. Top-Down Approach
    23. Data
    24. Triangulation
    25. Validation
    26. Market Dynamics
    27. Overview
    28. Drivers
    29. Restraints
    30. Opportunities
    31. Market Factor Analysis
    32. Value Chain Analysis
    33. Porter’s Five
    34. Forces Analysis
    35. Bargaining Power of
    36. Suppliers
    37. Bargaining Power of Buyers
    38. Threat of New Entrants
    39. Threat of Substitutes
    40. Intensity
    41. of Rivalry
    42. COVID-19 Impact Analysis
    43. Market Impact Analysis
    44. Regional Impact
    45. Opportunity
    46. and Threat Analysis
    47. GLOBAL
    48. BUSINESS TRAVEL MARKET, By Type
    49. Overview
    50. Managed Business
    51. Travel
    52. Unmanaged Business Travel
    53. GLOBAL
    54. BUSINESS TRAVEL MARKET, By Purpose
    55. Overview
    56. Marketing
    57. Internal
    58. Meetings
    59. Trade Shows
    60. Product Launch
    61. Others
    62. GLOBAL
    63. BUSINESS TRAVEL MARKET, By Expenditure
    64. Overview
    65. Marketing
    66. Travel Fare
    67. Lodging
    68. Dining
    69. Others
    70. GLOBAL
    71. BUSINESS TRAVEL MARKET, by Age Group
    72. Overview
    73. Travelers
    74. Below 40 Years
    75. Travelers Above 40 Years
    76. GLOBAL BUSINESS
    77. TRAVEL MARKET, By Traveler
    78. Overview
    79. Group Travel
    80. Solo
    81. Travel
    82. Service
    83. GLOBAL BUSINESS TRAVEL
    84. MARKET, By Service
    85. Overview
    86. Food and Lodging
    87. Recreation
    88. Activity
    89. GLOBAL BUSINESS TRAVEL MARKET, by Industry
    90. Overview
    91. Government
    92. Corporate
    93. GLOBAL
    94. BUSINESS TRAVEL MARKET, by Region
    95. Overview
    96. North America
    97. US
    98. Canada
    99. Europe
    100. Germany
    101. France
    102. UK
    103. Italy
    104. Spain
    105. Rest
    106. of Europe
    107. Asia-Pacific
    108. China
    109. India
    110. Japan
    111. South
    112. Korea
    113. Australia
    114. Rest of Asia-Pacific
    115. Rest
    116. of the World
    117. Middle East
    118. Africa
    119. Latin America
    120. Competitive Landscape
    121. Overview
    122. Competitive
    123. Analysis
    124. Market Share Analysis
    125. Major Growth Strategy in
    126. the Global Business Travel Market,
    127. Competitive Benchmarking
    128. Leading
    129. Players in Terms of Number of Developments in the Global Business Travel Market,
    130. Key
    131. developments and Growth Strategies
    132. New
    133. Product Launch/Service Deployment
    134. Merger
    135. & Acquisitions
    136. Joint Ventures
    137. Major
    138. Players Financial Matrix
    139. Sales &
    140. Operating Income, 2022
    141. Major Players
    142. R&D Expenditure. 2022
    143. Company ProfileS
    144. ADEKA CORPORATION Airbnb, Inc.
    145. Company Overview
    146. Financial Overview
    147. Products
    148. Offered
    149. Key Developments
    150. SWOT Analysis
    151. Key
    152. Strategies
    153. American Express Company
    154. Company Overview
    155. Financial Overview
    156. Products
    157. Offered
    158. Key Developments
    159. SWOT Analysis
    160. Key
    161. Strategies
    162. BCD Group
    163. Company Overview
    164. Financial
    165. Overview
    166. Products Offered
    167. Key Developments
    168. SWOT Analysis
    169. Key Strategies
    170. Booking
    171. Holdings
    172. Company Overview
    173. Financial Overview
    174. Products Offered
    175. Key Developments
    176. SWOT Analysis
    177. Key
    178. Strategies
    179. CWT Solutions
    180. Company Overview
    181. Financial
    182. Overview
    183. Products Offered
    184. Key Developments
    185. SWOT Analysis
    186. Key Strategies
    187. Corporate
    188. Travel Management
    189. Company Overview
    190. Financial Overview
    191. Products Offered
    192. Key Developments
    193. SWOT Analysis
    194. Key
    195. Strategies
    196. Expedia, Inc.
    197. Company Overview
    198. Financial
    199. Overview
    200. Products Offered
    201. Key Developments
    202. SWOT Analysis
    203. Key Strategies
    204. Fareportal
    205. Company Overview
    206. Financial Overview
    207. Products
    208. Offered
    209. Key Developments
    210. SWOT Analysis
    211. Key
    212. Strategies
    213. Flight Centre Travel Group Limited
    214. Company Overview
    215. Financial Overview
    216. Products
    217. Offered
    218. Key Developments
    219. SWOT Analysis
    220. Key
    221. Strategies
    222. Wexas Travel
    223. Company Overview
    224. Financial
    225. Overview
    226. Products Offered
    227. Key Developments
    228. SWOT Analysis
    229. Key Strategies
    230. Hogg
    231. Robinson Ltd
    232. Company Overview
    233. Financial Overview
    234. Products Offered
    235. Key Developments
    236. SWOT Analysis
    237. Key
    238. Strategies
    239. Priceline
    240. Company Overview
    241. Financial
    242. Overview
    243. Products Offered
    244. Key Developments
    245. SWOT Analysis
    246. Key Strategies
    247. Egencia
    248. LLC
    249. Company Overview
    250. Financial Overview
    251. Products
    252. Offered
    253. Key Developments
    254. SWOT Analysis
    255. Key
    256. Strategies
    257. Frosch International Travel
    258. Company Overview
    259. Financial Overview
    260. Products
    261. Offered
    262. Key Developments
    263. SWOT Analysis
    264. Key
    265. Strategies
    266. Ovation Travel Group
    267. Company Overview
    268. Financial
    269. Overview
    270. Products Offered
    271. Key Developments
    272. SWOT Analysis
    273. Key Strategies
    274. Travel
    275. Leaders Group
    276. Company Overview
    277. Financial Overview
    278. Products Offered
    279. Key Developments
    280. SWOT Analysis
    281. Key
    282. Strategies
    283. References
    284. Related Reports
    285. LIST
    286. OF TABLES
    287. Global Business Travel Market, Synopsis, 2018-2032
    288. Global
    289. Business Travel Market, Estimates & Forecast, 2018-2032 (USD BILLION)
    290. GLOBAL
    291. BUSINESS TRAVEL MARKET, By Type, 2018-2032 (USD BILLION)
    292. GLOBAL BUSINESS
    293. TRAVEL MARKET, By Purpose, 2018-2032 (USD BILLION)
    294. GLOBAL BUSINESS TRAVEL
    295. MARKET, By Expenditure, 2018-2032 (USD BILLION)
    296. GLOBAL BUSINESS TRAVEL
    297. MARKET, by Age Group, 2018-2032 (USD BILLION)
    298. GLOBAL BUSINESS TRAVEL
    299. MARKET, By Traveler, 2018-2032 (USD BILLION)
    300. GLOBAL BUSINESS TRAVEL
    301. MARKET, By Service, 2018-2032 (USD BILLION)
    302. GLOBAL BUSINESS TRAVEL MARKET,
    303. by Industry, 2018-2032 (USD BILLION)
    304. North America: BUSINESS TRAVEL
    305. MARKET, By Type, 2018-2032 (USD BILLION)
    306. North America: BUSINESS TRAVEL
    307. MARKET, By Purpose, 2018-2032 (USD BILLION)
    308. North America: BUSINESS
    309. TRAVEL MARKET, By Expenditure, 2018-2032 (USD BILLION)
    310. North america:
    311. BUSINESS TRAVEL MARKET, BY Age Group, 2018-2032 (USD BILLION)
    312. North
    313. America: BUSINESS TRAVEL MARKET, By Traveler, 2018-2032 (USD BILLION)
    314. North
    315. America: BUSINESS TRAVEL MARKET, By Service, 2018-2032 (USD BILLION)
    316. North
    317. america: BUSINESS TRAVEL MARKET, BY Industry, 2018-2032 (USD BILLION)
    318. US:
    319. BUSINESS TRAVEL MARKET, By Type, 2018-2032 (USD BILLION)
    320. US: BUSINESS
    321. TRAVEL MARKET, By Purpose, 2018-2032 (USD BILLION)
    322. US: BUSINESS TRAVEL
    323. MARKET, By Expenditure, 2018-2032 (USD BILLION)
    324. US: BUSINESS TRAVEL
    325. MARKET, BY Age Group, 2018-2032 (USD BILLION)
    326. US: BUSINESS TRAVEL MARKET,
    327. By Traveler, 2018-2032 (USD BILLION)
    328. US: BUSINESS TRAVEL MARKET, By
    329. Service, 2018-2032 (USD BILLION)
    330. US: BUSINESS TRAVEL MARKET, BY Industry,
    331. 2032 (USD BILLION)
    332. Canada: BUSINESS TRAVEL MARKET, By Type, 2018-2032
    333. (USD BILLION)
    334. Canada: BUSINESS TRAVEL MARKET, By Purpose, 2018-2032
    335. (USD BILLION)
    336. Canada: BUSINESS TRAVEL MARKET, By Expenditure, 2018-2032
    337. (USD BILLION)
    338. Canada: BUSINESS TRAVEL MARKET, BY Age Group, 2018-2032
    339. (USD BILLION)
    340. Canada: BUSINESS TRAVEL MARKET, By Traveler, 2018-2032
    341. (USD BILLION)
    342. Canada: BUSINESS TRAVEL MARKET, By Service, 2018-2032
    343. (USD BILLION)
    344. Canada: BUSINESS TRAVEL MARKET, BY Industry, 2018-2032
    345. (USD BILLION)
    346. Europe: BUSINESS TRAVEL MARKET, By Type, 2018-2032 (USD
    347. BILLION)
    348. Europe: BUSINESS TRAVEL MARKET, By Purpose, 2018-2032 (USD
    349. BILLION)
    350. Europe: BUSINESS TRAVEL MARKET, By Expenditure, 2018-2032 (USD
    351. BILLION)
    352. Europe: BUSINESS TRAVEL MARKET,
    353. BY Age Group, 2018-2032 (USD BILLION)
    354. Europe: BUSINESS TRAVEL MARKET,
    355. By Traveler, 2018-2032 (USD BILLION)
    356. Europe: BUSINESS TRAVEL MARKET,
    357. By Service, 2018-2032 (USD BILLION)
    358. Europe:
    359. BUSINESS TRAVEL MARKET, BY Industry, 2018-2032 (USD BILLION)
    360. germany:
    361. BUSINESS TRAVEL MARKET, By Type, 2018-2032 (USD BILLION)
    362. germany: BUSINESS
    363. TRAVEL MARKET, By Purpose, 2018-2032 (USD BILLION)
    364. germany: BUSINESS
    365. TRAVEL MARKET, By Expenditure, 2018-2032 (USD BILLION)
    366. germany: BUSINESS TRAVEL MARKET, BY Age Group, 2018-2032 (USD BILLION)
    367. germany:
    368. BUSINESS TRAVEL MARKET, By Traveler, 2018-2032 (USD BILLION)
    369. germany:
    370. BUSINESS TRAVEL MARKET, By Service, 2018-2032 (USD BILLION)
    371. germany: BUSINESS TRAVEL MARKET, BY Industry, 2018-2032 (USD BILLION)
    372. FRANCE:
    373. BUSINESS TRAVEL MARKET, By Type, 2018-2032 (USD BILLION)
    374. FRANCE: BUSINESS
    375. TRAVEL MARKET, By Purpose, 2018-2032 (USD BILLION)
    376. FRANCE: BUSINESS
    377. TRAVEL MARKET, By Expenditure, 2018-2032 (USD BILLION)
    378. France: BUSINESS TRAVEL MARKET, BY Age Group, 2018-2032 (USD BILLION)
    379. FRANCE:
    380. BUSINESS TRAVEL MARKET, By Traveler, 2018-2032 (USD BILLION)
    381. FRANCE:
    382. BUSINESS TRAVEL MARKET, By Service, 2018-2032 (USD BILLION)
    383. France: BUSINESS TRAVEL MARKET, BY Industry, 2018-2032 (USD BILLION)
    384. italy:
    385. BUSINESS TRAVEL MARKET, By Type, 2018-2032 (USD BILLION)
    386. italy: BUSINESS
    387. TRAVEL MARKET, By Purpose, 2018-2032 (USD BILLION)
    388. italy: BUSINESS TRAVEL
    389. MARKET, By Expenditure, 2018-2032 (USD BILLION)
    390. italy: BUSINESS TRAVEL MARKET, BY Age Group, 2018-2032 (USD BILLION)
    391. italy:
    392. BUSINESS TRAVEL MARKET, By Traveler, 2018-2032 (USD BILLION)
    393. italy:
    394. BUSINESS TRAVEL MARKET, By Service, 2018-2032 (USD BILLION)
    395. italy: BUSINESS TRAVEL MARKET, BY Industry, 2018-2032 (USD BILLION)
    396. spain:
    397. BUSINESS TRAVEL MARKET, By Type, 2018-2032 (USD BILLION)
    398. spain: BUSINESS
    399. TRAVEL MARKET, By Purpose, 2018-2032 (USD BILLION)
    400. spain: BUSINESS TRAVEL
    401. MARKET, By Expenditure, 2018-2032 (USD BILLION)
    402. spain: BUSINESS TRAVEL MARKET, BY Age Group, 2018-2032 (USD BILLION)
    403. spain:
    404. BUSINESS TRAVEL MARKET, By Traveler, 2018-2032 (USD BILLION)
    405. spain:
    406. BUSINESS TRAVEL MARKET, By Service, 2018-2032 (USD BILLION)
    407. spain: BUSINESS TRAVEL MARKET, BY Industry, 2018-2032 (USD BILLION)
    408. UK:
    409. BUSINESS TRAVEL MARKET, By Type, 2018-2032 (USD BILLION)
    410. UK: BUSINESS
    411. TRAVEL MARKET, By Purpose, 2018-2032 (USD BILLION)
    412. UK: BUSINESS TRAVEL
    413. MARKET, By Expenditure, 2018-2032 (USD BILLION)
    414. uk: BUSINESS TRAVEL MARKET, BY Age Group, 2018-2032 (USD BILLION)
    415. UK:
    416. BUSINESS TRAVEL MARKET, By Traveler, 2018-2032 (USD BILLION)
    417. UK: BUSINESS
    418. TRAVEL MARKET, By Service, 2018-2032 (USD BILLION)
    419. uk: BUSINESS TRAVEL MARKET, BY Industry, 2018-2032 (USD BILLION)
    420. rest
    421. of europe: BUSINESS TRAVEL MARKET, By Type, 2018-2032 (USD BILLION)
    422. rest
    423. of europe: BUSINESS TRAVEL MARKET, By Purpose, 2018-2032 (USD BILLION)
    424. rest
    425. of europe: BUSINESS TRAVEL MARKET, By Expenditure, 2018-2032 (USD BILLION)
    426. REST OF EUROPE: BUSINESS TRAVEL MARKET, BY Age Group,
    427. 2032 (USD BILLION)
    428. rest of europe: BUSINESS TRAVEL MARKET, By Traveler,
    429. 2032 (USD BILLION)
    430. rest of europe: BUSINESS TRAVEL MARKET, By Service,
    431. 2032 (USD BILLION)
    432. REST OF EUROPE:
    433. BUSINESS TRAVEL MARKET, BY Industry, 2018-2032 (USD BILLION)
    434. Asia-Pacific:
    435. BUSINESS TRAVEL MARKET, By Type, 2018-2032 (USD BILLION)
    436. Asia-Pacific:
    437. BUSINESS TRAVEL MARKET, By Purpose, 2018-2032 (USD BILLION)
    438. Asia-Pacific:
    439. BUSINESS TRAVEL MARKET, By Expenditure, 2018-2032 (USD BILLION)
    440. ASIA-PACIFIC: BUSINESS TRAVEL MARKET, BY Age Group, 2018-2032 (USD BILLION)
    441. Asia-Pacific:
    442. BUSINESS TRAVEL MARKET, By Traveler, 2018-2032 (USD BILLION)
    443. Asia-Pacific:
    444. BUSINESS TRAVEL MARKET, By Service, 2018-2032 (USD BILLION)
    445. ASIA-PACIFIC: BUSINESS TRAVEL MARKET, BY Industry, 2018-2032 (USD BILLION)
    446. japan:
    447. BUSINESS TRAVEL MARKET, By Type, 2018-2032 (USD BILLION)
    448. japan: BUSINESS
    449. TRAVEL MARKET, By Purpose, 2018-2032 (USD BILLION)
    450. japan: BUSINESS TRAVEL
    451. MARKET, By Expenditure, 2018-2032 (USD BILLION)
    452. japan: BUSINESS TRAVEL MARKET, BY Age Group, 2018-2032 (USD BILLION)
    453. japan:
    454. BUSINESS TRAVEL MARKET, By Traveler, 2018-2032 (USD BILLION)
    455. japan:
    456. BUSINESS TRAVEL MARKET, By Service, 2018-2032 (USD BILLION)
    457. japan: BUSINESS TRAVEL MARKET, BY Industry, 2018-2032 (USD BILLION)
    458. china:
    459. BUSINESS TRAVEL MARKET, By Type, 2018-2032 (USD BILLION)
    460. china: BUSINESS
    461. TRAVEL MARKET, By Purpose, 2018-2032 (USD BILLION)
    462. china: BUSINESS TRAVEL
    463. MARKET, By Expenditure, 2018-2032 (USD BILLION)
    464. china: BUSINESS TRAVEL MARKET, BY Age Group, 2018-2032 (USD BILLION)
    465. china:
    466. BUSINESS TRAVEL MARKET, By Traveler, 2018-2032 (USD BILLION)
    467. china:
    468. BUSINESS TRAVEL MARKET, By Service, 2018-2032 (USD BILLION)
    469. china: BUSINESS TRAVEL MARKET, BY Industry, 2018-2032 (USD BILLION)
    470. india:
    471. BUSINESS TRAVEL MARKET, By Type, 2018-2032 (USD BILLION)
    472. india: BUSINESS
    473. TRAVEL MARKET, By Purpose, 2018-2032 (USD BILLION)
    474. india: BUSINESS TRAVEL
    475. MARKET, By Expenditure, 2018-2032 (USD BILLION)
    476. india: BUSINESS TRAVEL MARKET, BY Age Group, 2018-2032 (USD BILLION)
    477. india:
    478. BUSINESS TRAVEL MARKET, By Traveler, 2018-2032 (USD BILLION)
    479. india:
    480. BUSINESS TRAVEL MARKET, By Service, 2018-2032 (USD BILLION)
    481. india: BUSINESS TRAVEL MARKET, BY Industry, 2018-2032 (USD BILLION)
    482. australia:
    483. BUSINESS TRAVEL MARKET, By Type, 2018-2032 (USD BILLION)
    484. australia:
    485. BUSINESS TRAVEL MARKET, By Purpose, 2018-2032 (USD BILLION)
    486. australia:
    487. BUSINESS TRAVEL MARKET, By Expenditure, 2018-2032 (USD BILLION)
    488. australia: BUSINESS TRAVEL MARKET, BY Age Group, 2018-2032 (USD BILLION)
    489. australia:
    490. BUSINESS TRAVEL MARKET, By Traveler, 2018-2032 (USD BILLION)
    491. australia:
    492. BUSINESS TRAVEL MARKET, By Service, 2018-2032 (USD BILLION)
    493. australia: BUSINESS TRAVEL MARKET, BY Industry, 2018-2032 (USD BILLION)
    494. south
    495. korea: BUSINESS TRAVEL MARKET, By Type, 2018-2032 (USD BILLION)
    496. south
    497. korea: BUSINESS TRAVEL MARKET, By Purpose, 2018-2032 (USD BILLION)
    498. south
    499. korea: BUSINESS TRAVEL MARKET, By Expenditure, 2018-2032 (USD BILLION)
    500. south korea: BUSINESS TRAVEL MARKET, BY Age Group,
    501. 2032 (USD BILLION)
    502. south korea: BUSINESS TRAVEL MARKET, By Traveler,
    503. 2032 (USD BILLION)
    504. south korea: BUSINESS TRAVEL MARKET, By Service,
    505. 2032 (USD BILLION)
    506. south korea:
    507. BUSINESS TRAVEL MARKET, BY Industry, 2018-2032 (USD BILLION)
    508. rest of
    509. asia-pacific: BUSINESS TRAVEL MARKET, By Type, 2018-2032 (USD BILLION)
    510. rest
    511. of asia-pacific: BUSINESS TRAVEL MARKET, By Purpose, 2018-2032 (USD BILLION)
    512. rest
    513. of asia-pacific: BUSINESS TRAVEL MARKET, By Expenditure, 2018-2032 (USD BILLION)
    514. REST OF ASIA-PACIFIC: BUSINESS TRAVEL MARKET, BY
    515. Age Group, 2018-2032 (USD BILLION)
    516. rest of asia-pacific: BUSINESS TRAVEL
    517. MARKET, By Traveler, 2018-2032 (USD BILLION)
    518. rest of asia-pacific: BUSINESS
    519. TRAVEL MARKET, By Service, 2018-2032 (USD BILLION)
    520. REST OF ASIA-PACIFIC: BUSINESS TRAVEL MARKET, BY Industry, 2018-2032 (USD
    521. BILLION)
    522. rest of the world: BUSINESS TRAVEL MARKET, By Type, 2018-2032
    523. (USD BILLION)
    524. rest of the world: BUSINESS TRAVEL MARKET, By Purpose,
    525. 2032 (USD BILLION)
    526. rest of the world: BUSINESS TRAVEL MARKET, By
    527. Expenditure, 2018-2032 (USD BILLION)
    528. REST
    529. OF THE WORLD: BUSINESS TRAVEL MARKET, BY Age Group, 2018-2032 (USD BILLION)
    530. rest
    531. of the world: BUSINESS TRAVEL MARKET, By Traveler, 2018-2032 (USD BILLION)
    532. rest
    533. of the world: BUSINESS TRAVEL MARKET, By Service, 2018-2032 (USD BILLION)
    534. REST OF THE WORLD: BUSINESS TRAVEL MARKET, BY Industry,
    535. 2032 (USD BILLION)
    536. Middle east: BUSINESS TRAVEL MARKET, By Type,
    537. 2032 (USD BILLION)
    538. Middle east: BUSINESS TRAVEL MARKET, By Purpose,
    539. 2032 (USD BILLION)
    540. Middle east: BUSINESS TRAVEL MARKET, By Expenditure,
    541. 2032 (USD BILLION)
    542. MIDDLE EAST:
    543. BUSINESS TRAVEL MARKET, BY Age Group, 2018-2032 (USD BILLION)
    544. Middle
    545. east: BUSINESS TRAVEL MARKET, By Traveler, 2018-2032 (USD BILLION)
    546. Middle
    547. east: BUSINESS TRAVEL MARKET, By Service, 2018-2032 (USD BILLION)
    548. MIDDLE EAST: BUSINESS TRAVEL MARKET, BY Industry, 2018-2032 (USD BILLION)
    549. Africa:
    550. BUSINESS TRAVEL MARKET, By Type, 2018-2032 (USD BILLION)
    551. Africa: BUSINESS
    552. TRAVEL MARKET, By Purpose, 2018-2032 (USD BILLION)
    553. Africa: BUSINESS
    554. TRAVEL MARKET, By Expenditure, 2018-2032 (USD BILLION)
    555. Africa: BUSINESS TRAVEL MARKET, BY AGE GROUP, 2018-2032 (USD BILLION)
    556. Africa:
    557. BUSINESS TRAVEL MARKET, By Traveler, 2018-2032 (USD BILLION)
    558. Africa:
    559. BUSINESS TRAVEL MARKET, By Service, 2018-2032 (USD BILLION)
    560. Africa: BUSINESS TRAVEL MARKET, BY INDUSTRY, 2018-2032 (USD BILLION)
    561. Latin
    562. america: BUSINESS TRAVEL MARKET, By Type, 2018-2032 (USD BILLION)
    563. Latin
    564. america: BUSINESS TRAVEL MARKET, By Purpose, 2018-2032 (USD BILLION)
    565. Latin
    566. america: BUSINESS TRAVEL MARKET, By Expenditure, 2018-2032 (USD BILLION)
    567. LATIN AMERICA: BUSINESS TRAVEL MARKET, BY AGE GROUP,
    568. 2032 (USD BILLION)
    569. Latin america: BUSINESS TRAVEL MARKET, By Traveler,
    570. 2032 (USD BILLION)
    571. Latin america: BUSINESS TRAVEL MARKET, By Service,
    572. 2032 (USD BILLION)
    573. LATIN AMERICA:
    574. BUSINESS TRAVEL MARKET, BY INDUSTRY, 2018-2032 (USD BILLION)
    575. LIST
    576. OF FIGURES
    577. Research Process
    578. Market Structure
    579. for the Global Business Travel Market
    580. Market Dynamics for the Global
    581. Business Travel Market
    582. Global Business Travel Market, Share (%), By
    583. Type, 2022
    584. Global Business Travel Market, Share (%), By Purpose, 2022
    585. Global
    586. Business Travel Market, Share (%), By Expenditure, 2022
    587. Global Business
    588. Travel Market, Share (%), BY Age Group, 2022
    589. Global Business Travel
    590. Market, Share (%), By Traveler, 2022
    591. Global Business Travel Market,
    592. Share (%), By Service, 2022
    593. Global Business Travel Market, Share (%),
    594. BY Industry, 2022
    595. Global Business Travel Market, Share (%), by Region,
    596. north AMERICA: BUSINESS TRAVEL MARKET, SHARE (%), BY REGION, 2022
    597. Europe:
    598. BUSINESS TRAVEL MARKET, SHARE (%), BY REGION, 2022
    599. Asia-Pacific: BUSINESS
    600. TRAVEL MARKET, SHARE (%), BY REGION, 2022
    601. Rest of the world: BUSINESS
    602. TRAVEL MARKET, SHARE (%), BY REGION, 2022
    603. Global Business Travel Market:
    604. Company Share Analysis, 2022 (%)
    605. ADEKA CORPORATION Airbnb, Inc.: FINANCIAL
    606. OVERVIEW SNAPSHOT
    607. ADEKA CORPORATION Airbnb, Inc.: SWOT ANALYSIS
    608. American
    609. Express Company: FINANCIAL OVERVIEW SNAPSHOT
    610. American Express Company:
    611. SWOT ANALYSIS
    612. BCD Group: FINANCIAL OVERVIEW SNAPSHOT
    613. BCD
    614. Group: SWOT ANALYSIS
    615. Booking Holdings: FINANCIAL OVERVIEW SNAPSHOT
    616. Booking
    617. Holdings: SWOT ANALYSIS
    618. Corporate Travel Management: FINANCIAL OVERVIEW
    619. SNAPSHOT
    620. Corporate Travel Management: SWOT ANALYSIS
    621. CWT
    622. Solutions: FINANCIAL OVERVIEW SNAPSHOT
    623. CWT Solutions: SWOT ANALYSIS
    624. Egencia
    625. LLC: FINANCIAL OVERVIEW SNAPSHOT
    626. Egencia LLC: SWOT ANALYSIS
    627. Expedia,
    628. Inc.: FINANCIAL OVERVIEW SNAPSHOT
    629. Expedia, Inc.: SWOT ANALYSIS
    630. Fareportal:
    631. FINANCIAL OVERVIEW SNAPSHOT
    632. Fareportal: SWOT ANALYSIS
    633. Flight
    634. Centre Travel Group Limited: FINANCIAL OVERVIEW SNAPSHOT
    635. Flight Centre
    636. Travel Group Limited: SWOT ANALYSIS
    637. Frosch International Travel: FINANCIAL
    638. OVERVIEW SNAPSHOT
    639. Frosch International Travel: SWOT ANALYSIS
    640. Hogg
    641. Robinson Ltd: FINANCIAL OVERVIEW SNAPSHOT
    642. Hogg Robinson Ltd: SWOT ANALYSIS
    643. Ovation
    644. Travel Group: FINANCIAL OVERVIEW SNAPSHOT
    645. Ovation Travel Group: SWOT
    646. ANALYSIS
    647. Priceline: FINANCIAL OVERVIEW SNAPSHOT
    648. Priceline:
    649. SWOT ANALYSIS
    650. Travel Leaders Group: FINANCIAL OVERVIEW SNAPSHOT
    651. Travel
    652. Leaders Group: SWOT ANALYSIS
    653. Wexas Travel: FINANCIAL OVERVIEW SNAPSHOT
    654. Wexas
    655. Travel: SWOT ANALYSIS

    Business Travel Market Segmentation

    Business Travel Type Outlook (USD Billion, 2018-2032)

    • Managed Business Travel
    • Unmanaged Business Travel

    Business Travel Purpose Outlook (USD Billion, 2018-2032)

    • Marketing
    • Internal Meetings
    • Trade Shows
    • Product Launch
    • Others

    Business Travel Expenditure Outlook (USD Billion, 2018-2032)

    • Marketing Travel Fare
    • Lodging
    • Dining
    • Others

    Business Travel Age Group Outlook (USD Billion, 2018-2032)

    • Travelers Below 40 Years
    • Travelers Above 40 Years

    Business Travel Traveller Outlook (USD Billion, 2018-2032)

    • Group Travel
    • Solo Travel
    • Service

    Business Travel Service Outlook (USD Billion, 2018-2032)

    • Food and Lodging
    • Recreation Activity

    Business Travel Industry Outlook (USD Billion, 2018-2032)

    • Government
    • Corporate

    Business Travel Regional Outlook (USD Billion, 2018-2032)

    • North America Outlook (USD Billion, 2018-2032)

      • North America Business Travel by Type
        • Managed North America Business Travel By
        • Unmanaged North America Business Travel By
      • North America Business Travel by Purpose
        • Marketing
        • Internal Meetings
        • Trade Shows
        • Product Launch
        • Others
      • North America Business Travel by Expenditure
        • Marketing Travel Fare
        • Lodging
        • Dining
        • Others
      • North America Business Travel by Age Group
        • Travelers Below 40 Years
        • Travelers Above 40 Years
      • North America Business Travel by Traveler
        • Group Travel
        • Solo Travel
        • Service
      • North America Business Travel by Service
        • Food and Lodging
        • Recreation Activity
      • North America Business Travel by Industry
        • Government
        • Corporate
      • US Outlook (USD Billion, 2018-2032)

      • US Business Travel by Type
        • Managed US Business Travel By
        • Unmanaged US Business Travel By
      • US Business Travel by Purpose
        • Marketing
        • Internal Meetings
        • Trade Shows
        • Product Launch
        • Others
      • US Business Travel by Expenditure
        • Marketing Travel Fare
        • Lodging
        • Dining
        • Others
      • US Business Travel by Age Group
        • Travelers Below 40 Years
        • Travelers Above 40 Years
      • US Business Travel by Traveler
        • Group Travel
        • Solo Travel
        • Service
      • US Business Travel by Service
        • Food and Lodging
        • Recreation Activity
      • US Business Travel by Industry
        • Government
        • Corporate
      • Canada Outlook (USD Billion, 2018-2032)

      • Canada Business Travel by Type
        • Managed Canada Business Travel By
        • Unmanaged Canada Business Travel By
      • Canada Business Travel by Purpose
        • Marketing
        • Internal Meetings
        • Trade Shows
        • Product Launch
        • Others
      • Canada Business Travel by Expenditure
        • Marketing Travel Fare
        • Lodging
        • Dining
        • Others
      • Canada Business Travel by Age Group
        • Travelers Below 40 Years
        • Travelers Above 40 Years
      • Canada Business Travel by Traveler
        • Group Travel
        • Solo Travel
        • Service
      • Canada Business Travel by Service
        • Food and Lodging
        • Recreation Activity
      • Canada Business Travel by Industry
        • Government
        • Corporate
    • Europe Outlook (USD Billion, 2018-2032)

      • Europe Business Travel by Type
        • Managed Europe Business Travel By
        • Unmanaged Europe Business Travel By
      • Europe Business Travel by Purpose
        • Marketing
        • Internal Meetings
        • Trade Shows
        • Product Launch
        • Others
      • Europe Business Travel by Expenditure
        • Marketing Travel Fare
        • Lodging
        • Dining
        • Others
      • Europe Business Travel by Age Group
        • Travelers Below 40 Years
        • Travelers Above 40 Years
      • Europe Business Travel by Traveler
        • Group Travel
        • Solo Travel
        • Service
      • Europe Business Travel by Service
        • Food and Lodging
        • Recreation Activity
      • Europe Business Travel by Industry
        • Government
        • Corporate
      • Germany Outlook (USD Billion, 2018-2032)

      • Germany Business Travel by Type
        • Managed Germany Business Travel By
        • Unmanaged Germany Business Travel By
      • Germany Business Travel by Purpose
        • Marketing
        • Internal Meetings
        • Trade Shows
        • Product Launch
        • Others
      • Germany Business Travel by Expenditure
        • Marketing Travel Fare
        • Lodging
        • Dining
        • Others
      • Germany Business Travel by Age Group
        • Travelers Below 40 Years
        • Travelers Above 40 Years
      • Germany Business Travel by Traveler
        • Group Travel
        • Solo Travel
        • Service
      • Germany Business Travel by Service
        • Food and Lodging
        • Recreation Activity
      • Germany Business Travel by Industry
        • Government
        • Corporate
      • France Outlook (USD Billion, 2018-2032)

      • France Business Travel by Type
        • Managed France Business Travel By
        • Unmanaged France Business Travel By
      • France Business Travel by Purpose
        • Marketing
        • Internal Meetings
        • Trade Shows
        • Product Launch
        • Others
      • France Business Travel by Expenditure
        • Marketing Travel Fare
        • Lodging
        • Dining
        • Others
      • France Business Travel by Age Group
        • Travelers Below 40 Years
        • Travelers Above 40 Years
      • France Business Travel by Traveler
        • Group Travel
        • Solo Travel
        • Service
      • France Business Travel by Service
        • Food and Lodging
        • Recreation Activity
      • France Business Travel by Industry
        • Government
        • Corporate
      • UK Outlook (USD Billion, 2018-2032)

      • UK Business Travel by Type
        • Managed UK Business Travel By
        • Unmanaged UK Business Travel By
      • UK Business Travel by Purpose
        • Marketing
        • Internal Meetings
        • Trade Shows
        • Product Launch
        • Others
      • UK Business Travel by Expenditure
        • Marketing Travel Fare
        • Lodging
        • Dining
        • Others
      • UK Business Travel by Age Group
        • Travelers Below 40 Years
        • Travelers Above 40 Years
      • UK Business Travel by Traveler
        • Group Travel
        • Solo Travel
        • Service
      • UK Business Travel by Service
        • Food and Lodging
        • Recreation Activity
      • UK Business Travel by Industry
        • Government
        • Corporate
      • Italy Outlook (USD Billion, 2018-2032)

      • Italy Business Travel by Type
        • Managed Italy Business Travel By
        • Unmanaged Italy Business Travel By
      • Italy Business Travel by Purpose
        • Marketing
        • Internal Meetings
        • Trade Shows
        • Product Launch
        • Others
      • Italy Business Travel by Expenditure
        • Marketing Travel Fare
        • Lodging
        • Dining
        • Others
      • Italy Business Travel by Age Group
        • Travelers Below 40 Years
        • Travelers Above 40 Years
      • Italy Business Travel by Traveler
        • Group Travel
        • Solo Travel
        • Service
      • Italy Business Travel by Service
        • Food and Lodging
        • Recreation Activity
      • Italy Business Travel by Industry
        • Government
        • Corporate
      • Spain Outlook (USD Billion, 2018-2032)

      • Spain Business Travel by Type
        • Managed Spain Business Travel By
        • Unmanaged Spain Business Travel By
      • Spain Business Travel by Purpose
        • Marketing
        • Internal Meetings
        • Trade Shows
        • Product Launch
        • Others
      • Spain Business Travel by Expenditure
        • Marketing Travel Fare
        • Lodging
        • Dining
        • Others
      • Spain Business Travel by Age Group
        • Travelers Below 40 Years
        • Travelers Above 40 Years
      • Spain Business Travel by Traveler
        • Group Travel
        • Solo Travel
        • Service
      • Spain Business Travel by Service
        • Food and Lodging
        • Recreation Activity
      • Spain Business Travel by Industry
        • Government
        • Corporate
      • Rest Of Europe Outlook (USD Billion, 2018-2032)

      • Rest of Europe Business Travel by Type
        • Managed Rest of Europe Business Travel By
        • Unmanaged Rest of Europe Business Travel By
      • Rest of Europe Business Travel by Purpose
        • Marketing
        • Internal Meetings
        • Trade Shows
        • Product Launch
        • Others
      • Rest of Europe Business Travel by Expenditure
        • Marketing Travel Fare
        • Lodging
        • Dining
        • Others
      • Rest of Europe Business Travel by Age Group
        • Travelers Below 40 Years
        • Travelers Above 40 Years
      • Rest of Europe Business Travel by Traveler
        • Group Travel
        • Solo Travel
        • Service
      • Rest of Europe Business Travel by Service
        • Food and Lodging
        • Recreation Activity
      • Rest of Europe Business Travel by Industry
        • Government
        • Corporate
    • Asia-Pacific Outlook (USD Billion, 2018-2032)

      • Asia Pacific Business Travel by Type
        • Managed Asia Pacific Business Travel By
        • Unmanaged Asia Pacific Business Travel By
      • Asia Pacific Business Travel by Purpose
        • Marketing
        • Internal Meetings
        • Trade Shows
        • Product Launch
        • Others
      • Asia Pacific Business Travel by Expenditure
        • Marketing Travel Fare
        • Lodging
        • Dining
        • Others
      • Asia Pacific Business Travel by Age Group
        • Travelers Below 40 Years
        • Travelers Above 40 Years
      • Asia Pacific Business Travel by Traveler
        • Group Travel
        • Solo Travel
        • Service
      • Asia Pacific Business Travel by Service
        • Food and Lodging
        • Recreation Activity
      • Asia Pacific Business Travel by Industry
        • Government
        • Corporate
      • China Outlook (USD Billion, 2018-2032)

      • China Business Travel by Type
        • Managed China Business Travel By
        • Unmanaged China Business Travel By
      • China Business Travel by Purpose
        • Marketing
        • Internal Meetings
        • Trade Shows
        • Product Launch
        • Others
      • China Business Travel by Expenditure
        • Marketing Travel Fare
        • Lodging
        • Dining
        • Others
      • China Business Travel by Age Group
        • Travelers Below 40 Years
        • Travelers Above 40 Years
      • China Business Travel by Traveler
        • Group Travel
        • Solo Travel
        • Service
      • China Business Travel by Service
        • Food and Lodging
        • Recreation Activity
      • China Business Travel by Industry
        • Government
        • Corporate
      • Japan Outlook (USD Billion, 2018-2032)

      • Japan Business Travel by Type
        • Managed Japan Business Travel By
        • Unmanaged Japan Business Travel By
      • Japan Business Travel by Purpose
        • Marketing
        • Internal Meetings
        • Trade Shows
        • Product Launch
        • Others
      • Japan Business Travel by Expenditure
        • Marketing Travel Fare
        • Lodging
        • Dining
        • Others
      • Japan Business Travel by Age Group
        • Travelers Below 40 Years
        • Travelers Above 40 Years
      • Japan Business Travel by Traveler
        • Group Travel
        • Solo Travel
        • Service
      • Japan Business Travel by Service
        • Food and Lodging
        • Recreation Activity
      • Japan Business Travel by Industry
        • Government
        • Corporate
      • India Outlook (USD Billion, 2018-2032)

      • India Business Travel by Type
        • Managed India Business Travel By
        • Unmanaged India Business Travel By
      • India Business Travel by Purpose
        • Marketing
        • Internal Meetings
        • Trade Shows
        • Product Launch
        • Others
      • India Business Travel by Expenditure
        • Marketing Travel Fare
        • Lodging
        • Dining
        • Others
      • India Business Travel by Age Group
        • Travelers Below 40 Years
        • Travelers Above 40 Years
      • India Business Travel by Traveler
        • Group Travel
        • Solo Travel
        • Service
      • India Business Travel by Service
        • Food and Lodging
        • Recreation Activity
      • India Business Travel by Industry
        • Government
        • Corporate
      • Australia Outlook (USD Billion, 2018-2032)

      • Australia Business Travel by Type
        • Managed Australia Business Travel By
        • Unmanaged Australia Business Travel By
      • Australia Business Travel by Purpose
        • Marketing
        • Internal Meetings
        • Trade Shows
        • Product Launch
        • Others
      • Australia Business Travel by Expenditure
        • Marketing Travel Fare
        • Lodging
        • Dining
        • Others
      • Australia Business Travel by Age Group
        • Travelers Below 40 Years
        • Travelers Above 40 Years
      • Australia Business Travel by Traveler
        • Group Travel
        • Solo Travel
        • Service
      • Australia Business Travel by Service
        • Food and Lodging
        • Recreation Activity
      • Australia Business Travel by Industry
        • Government
        • Corporate
      • Rest of Asia-Pacific Outlook (USD Billion, 2018-2032)

      • Rest of Asia Pacific Business Travel by Type
        • Managed Rest of Asia Pacific Business Travel By
        • Unmanaged Rest of Asia Pacific Business Travel By
      • Rest of Asia Pacific Business Travel by Purpose
        • Marketing
        • Internal Meetings
        • Trade Shows
        • Product Launch
        • Others
      • Rest of Asia Pacific Business Travel by Expenditure
        • Marketing Travel Fare
        • Lodging
        • Dining
        • Others
      • Rest of Asia Pacific Business Travel by Age Group
        • Travelers Below 40 Years
        • Travelers Above 40 Years
      • Rest of Asia Pacific Business Travel by Traveler
        • Group Travel
        • Solo Travel
        • Service
      • Rest of Asia Pacific Business Travel by Service
        • Food and Lodging
        • Recreation Activity
      • Rest of Asia Pacific Business Travel by Industry
        • Government
        • Corporate
    • Rest of the World Outlook (USD Billion, 2018-2032)

      • Rest of the World Business Travel by Type
        • Managed Rest of the World Business Travel By
        • Unmanaged Rest of the World Business Travel By
      • Rest of the World Business Travel by Purpose
        • Marketing
        • Internal Meetings
        • Trade Shows
        • Product Launch
        • Others
      • Rest of the World Business Travel by Expenditure
        • Marketing Travel Fare
        • Lodging
        • Dining
        • Others
      • Rest of the World Business Travel by Age Group
        • Travelers Below 40 Years
        • Travelers Above 40 Years
      • Rest of the World Business Travel by Traveler
        • Group Travel
        • Solo Travel
        • Service
      • Rest of the World Business Travel by Service
        • Food and Lodging
        • Recreation Activity
      • Rest of the World Business Travel by Industry
        • Government
        • Corporate
      • Middle East Outlook (USD Billion, 2018-2032)

      • Middle East Business Travel by Type
        • Managed Middle East Business Travel By
        • Unmanaged Middle East Business Travel By
      • Middle East Business Travel by Purpose
        • Marketing
        • Internal Meetings
        • Trade Shows
        • Product Launch
        • Others
      • Middle East Business Travel by Expenditure
        • Marketing Travel Fare
        • Lodging
        • Dining
        • Others
      • Middle East Business Travel by Age Group
        • Travelers Below 40 Years
        • Travelers Above 40 Years
      • Middle East Business Travel by Traveler
        • Group Travel
        • Solo Travel
        • Service
      • Middle East Business Travel by Service
        • Food and Lodging
        • Recreation Activity
      • Middle East Business Travel by Industry
        • Government
        • Corporate
      • Africa Outlook (USD Billion, 2018-2032)

      • Africa Business Travel by Type
        • Managed Africa Business Travel By
        • Unmanaged Africa Business Travel By
      • Africa Business Travel by Purpose
        • Marketing
        • Internal Meetings
        • Trade Shows
        • Product Launch
        • Others
      • Africa Business Travel by Expenditure
        • Marketing Travel Fare
        • Lodging
        • Dining
        • Others
      • Africa Business Travel by Age Group
        • Travelers Below 40 Years
        • Travelers Above 40 Years
      • Africa Business Travel by Traveler
        • Group Travel
        • Solo Travel
        • Service
      • Africa Business Travel by Service
        • Food and Lodging
        • Recreation Activity
      • Africa Business Travel by Industry
        • Government
        • Corporate
      • Latin America Outlook (USD Billion, 2018-2032)

      • Latin America Business Travel by Type
        • Managed Latin America Business Travel By
        • Unmanaged Latin America Business Travel By
      • Latin America Business Travel by Purpose
        • Marketing
        • Internal Meetings
        • Trade Shows
        • Product Launch
        • Others
      • Latin America Business Travel by Expenditure
        • Marketing Travel Fare
        • Lodging
        • Dining
        • Others
      • Latin America Business Travel by Age Group
        • Travelers Below 40 Years
        • Travelers Above 40 Years
      • Latin America Business Travel by Traveler
        • Group Travel
        • Solo Travel
        • Service
      • Latin America Business Travel by Service
        • Food and Lodging
        • Recreation Activity
      • Latin America Business Travel by Industry
        • Government
        • Corporate
    Report Infographic
    Free Sample Request

    Kindly complete the form below to receive a free sample of this Report

    Customer Strories

    “I am very pleased with how market segments have been defined in a relevant way for my purposes (such as "Portable Freezers & refrigerators" and "last-mile"). In general the report is well structured. Thanks very much for your efforts.”

    Victoria Milne Founder
    Case Study

    Chemicals and Materials