• Cat-intel
  • MedIntelliX
  • Resources
  • About Us
  • Hero Background
    English
    Chinese
    French
    Japanese
    Korean
    German
    Spanish

    Blenders Market Trends

    ID: MRFR/CR/10140-HCR
    128 Pages
    Sakshi Gupta
    October 2025

    Blenders Market Research Report Information By Product Type (Countertop Blenders, Personal Blenders and Hand Blenders), By Material Type (Plastic, Stainless Steel, Glass and Others (Aluminum, Copper etc.)), By Power (> 200 Watts, 200 to 399 Watts, 400 to 699 Watts, 700 to 999 Watts and > 1,000 Watts), By Sales Channel (Offline Channel and Online Channel) And By Region (North America, Euro...

    Share:
    Download PDF ×

    We do not share your information with anyone. However, we may send you emails based on your report interest from time to time. You may contact us at any time to opt-out.

    Blenders Market Infographic
    Purchase Options

    Market Trends

    Key Emerging Trends in the Blenders Market

    The Blenders Market works in a changing and smart kitchen gadget world, affected by many things to meet the different food needs and healthy life choices of people who buy it. A big reason why this market is growing fast is because more and more people want to stay healthy. Blenders help in making food that's good for you, so they are very important too. People want easy and quick ways to mix fruits, vegetables, and other stuff. That's why they always need blenders. The market has many kinds of blenders with different features and designs to match people's likes, needs in the kitchen or lifestyle.

    People's likes and food habits are very important in deciding how the blenders market works. As more people care about eating healthy, they want blenders that work well, can do lots of things and are easy to use. They buy these machines for making smoothies at home. The market offers choices like small blenders for making smoothies on the run, powerful ones for expert-style mixing and easy to use models that save space.

    The economy greatly affects the blenders market. When people have more money to spend, they might be ready to buy high-quality and techy blender models that do extra things well and last long. On the other hand, when times are tough for businesses and money is tight, people might look for cheaper choices. This shows that there need to be different cost levels in stores so everyone can find something they can afford.

    Technology improvements in blender shape and skill help the market grow. Things like strong engines, speed controls you can change, smart phone connections and tough blade parts make blenders better to use. When tech and things you use in the kitchen come together, it leads to blenders that not only mix well but also fit what people want who are looking for quick tools with many uses.

    Changing food habits and culture shape the market for blenders. As people's thoughts about eating healthy and making food at home change, companies might adjust what they sell to fit with new tastes in cooking. The mix of things in the market lets many kinds of blenders be made. Some are small and look good for tiny kitchens, while others are strong enough to use by people who really love cooking or baking stuff.

    Thinking about safety rules and product quality for blenders is very important in deciding how the market changes. Following the rules makes kitchen machines safe. This includes working engines, secure blades and long-lasting parts so buyers can trust they are using a good tool in their homes without danger.

    Author
    Sakshi Gupta
    Research Analyst Level II

    I have about two years of experience working in the consumer goods and retail industries and I am a biotech graduate.A tech-savvy analytically focused professional with a strong capabilities in identification, concept generation, and strategy evaluation. I can produce data-driven solutions while fusing unusual viewpoints with original concepts. I have been extensively working on business case studies, competitive & comparative analyses, and strategic reports. My primary areas of experience include client management, financial analysis, supply chain evaluation, market entry strategy evaluation, and estimating and forecasting market size.

    Leave a Comment

    FAQs

    How much is the blenders market?

    The Blenders Market size was valued at USD 3.30 Billion in 2023.

    What is the growth rate of the blenders market?

    The global market is projected to grow at a CAGR of 5.2% during the forecast period, 2025-2034.

    Which region held the largest market share in the blenders market?

    North America had the largest share in the global market

    Who are the key players in the blenders market?

    The key players in the market are Vitamix Corporation, Blendtec, Inc., Hamilton Beach Brands Holding Company, Conair Corporation, Cuisinart, Nutribullet, LLC, Oster, Philips Electronics N.V.

    Which product type led the blenders market?

    The hand blenders category dominated the market in 2023.

    Which sales channel had the largest market share in the blenders market?

    The online channel category had the largest share in the global market.

    Market Summary

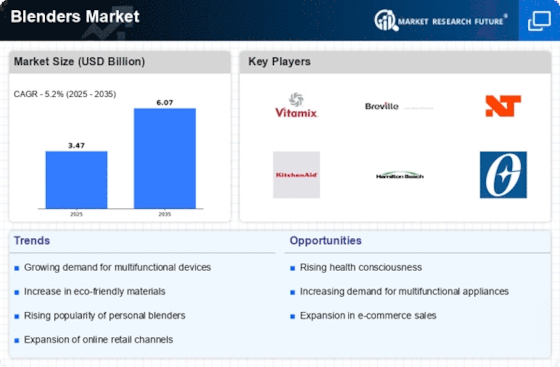
    As per Market Research Future Analysis, the Global Blenders Market was valued at USD 3.47 billion in 2024 and is projected to grow to USD 6.06 billion by 2035, with a CAGR of 5.20% from 2025 to 2035. The market is driven by the increasing demand for hand blenders due to their enhanced functionality and performance, alongside a growing trend towards healthier eating habits. Urbanization and rising disposable incomes are also contributing to market growth, particularly in affluent urban areas. The online sales channel has seen significant growth, enhancing product visibility and accessibility for consumers.

    Key Market Trends & Highlights

    Key trends driving the blenders market include urbanization, health consciousness, and online retail growth.

    • Blenders Market Size in 2024: USD 3.47 billion.
    • Projected Market Size by 2035: USD 6.06 billion.
    • CAGR from 2025 to 2035: 5.20%.
    • Hand blenders segment dominated the market due to space-saving needs in urban areas.

    Market Size & Forecast

    2024 Market Size USD 3.47 billion
    2035 Market Size USD 6.06 billion
    CAGR (2025-2035) 5.20%
    Largest Regional Market Share in 2024 North America.

    Major Players

    Key players include Vitamix Corporation, Blendtec, Hamilton Beach Brands, Conair, Cuisinart, Nutribullet, Oster, Philips Electronics, Black+Decker, Breville, KitchenAid, Ninja Kitchen, and Electrolux.

    Market Trends

    Shifting Trends Towards a Healthier Lifestyle and Eating Patterns to Drive Market Growth

    Globally, people's fast-paced lifestyles and evolving work situations have led to unrestrained eating habits and an increase in diseases. According to statistics from the Centers for Disease Control and Prevention, almost 1 in 10 Americans regularly consume fruits and vegetables, which helps them avoid chronic diseases like cancer and heart disease. Fruits and vegetables are being consumed more frequently as a result of the increase in ailments that people are developing. One can simply adopt healthy eating habits while saving time thanks to the many advantages of blenders.

    The consumption of smoothies and milkshakes has increased as a result of heightened knowledge of the advantages of a balanced diet and growing social media influence. To ensure that their bodies are getting the nutrients and vitamins they need each day, the majority of consumers are switching to healthy options that can be consumed on-the-go. In the future years, it is anticipated that the shifting trend towards breakfast and smoothies created at home and consumed on the move would increase demand for blenders.

    Urbanization is a key driver of the blender market's expansion because it boosted the need for convenience in busy urban lifestyles and gave rise to a booming middle class. The demand for kitchen equipment is higher in the urban market, especially in affluent cities. Two more significant factors influencing the market expansion for kitchen appliances are rising urbanization and product innovation. Rising urbanization levels are fueling demand for luxury and high-end homes, which is paving the way for a bright future for high-end kitchen appliances.

    It is anticipated that an increase in extra cash and a growth in the working population in metropolitan countries will fuel the need for kitchen equipment. High-income groups are a potential market for lifestyle products. Therefore, it is anticipated that the trend towards urbanization will offer a lucrative opportunity for the growth of the market CAGR.

    The growth of the sector is particularly being driven by rising online retail sales. Online demand for blenders has significantly increased over the last few years. Through online channels, market vendors' various products and brands have gained more visibility. Due to the presence of a wide range of products, online shopping channels have also grown. The success of internet commerce is due in part to the extension of customer reach and cost savings in inventory management.

    Additionally, it is anticipated that growing internet connectivity, expanding mobile device adoption, and rising consumer awareness will all contribute to the growth of the global market via the e-commerce platform. Thus, driving the blenders market revenue.

    The Global Blenders Market appears to be experiencing a notable shift towards multifunctional appliances, reflecting consumers' increasing demand for convenience and versatility in food preparation.

    U.S. Department of Commerce

    Blenders Market Market Drivers

    Growing E-commerce Sales

    The surge in e-commerce platforms seems to be reshaping the purchasing landscape for the Global Blenders Market Industry. Online shopping offers consumers convenience and access to a broader range of products, including various blender brands and models. This shift towards digital retail channels is evidenced by the increasing number of consumers opting to purchase kitchen appliances online. As e-commerce continues to grow, it is expected to drive sales in the Global Blenders Market Industry, contributing to the projected market value of 6.71 USD Billion by 2035. Retailers are likely to enhance their online presence to capture this expanding consumer base.

    Market Growth Projections

    The Global Blenders Market Industry is projected to experience substantial growth, with a market value expected to reach 6.71 USD Billion by 2035. This growth trajectory suggests a compound annual growth rate (CAGR) of 6.17% from 2025 to 2035, indicating a robust expansion phase. The increasing demand for kitchen appliances, coupled with evolving consumer preferences, is likely to drive this growth. As manufacturers continue to innovate and enhance product offerings, the Global Blenders Market Industry is poised for a promising future, reflecting the dynamic nature of consumer needs and market trends.

    Technological Advancements

    Technological innovations in blender design and functionality seem to play a crucial role in shaping the Global Blenders Market Industry. The introduction of smart blenders equipped with advanced features such as touch controls, programmable settings, and connectivity options enhances user experience and convenience. For instance, blenders that can connect to mobile applications for recipe guidance are gaining traction. This technological evolution not only attracts tech-savvy consumers but also contributes to the overall market growth, as evidenced by the anticipated CAGR of 6.17% from 2025 to 2035. Such advancements are likely to redefine consumer expectations and drive sales in the Global Blenders Market Industry.

    Rising Health Consciousness

    The increasing awareness of health and wellness among consumers appears to be a pivotal driver for the Global Blenders Market Industry. As individuals seek to incorporate nutritious foods and beverages into their diets, the demand for blenders that can efficiently prepare smoothies, soups, and sauces is on the rise. This trend is reflected in the projected market value of 3.47 USD Billion in 2024, indicating a robust consumer shift towards healthier eating habits. The Global Blenders Market Industry is likely to benefit from this growing inclination, as manufacturers innovate to produce high-performance blenders that cater to health-conscious consumers.

    Diverse Culinary Applications

    The versatility of blenders in various culinary applications appears to significantly influence the Global Blenders Market Industry. Consumers utilize blenders for a wide range of tasks, from making smoothies and sauces to grinding spices and preparing baby food. This diverse functionality caters to different consumer needs, thereby expanding the market reach. As culinary trends evolve, the demand for multifunctional blenders is expected to rise, further propelling the market. The Global Blenders Market Industry is likely to see increased sales as consumers recognize the value of investing in high-quality blenders that can perform multiple tasks efficiently.

    Consumer Preference for Sustainable Products

    The rising consumer preference for sustainable and eco-friendly products appears to be a significant driver for the Global Blenders Market Industry. As environmental concerns grow, consumers are increasingly seeking kitchen appliances made from sustainable materials and energy-efficient technologies. Brands that prioritize sustainability in their product offerings are likely to attract environmentally conscious consumers. This trend may lead to a shift in market dynamics, as companies innovate to meet these demands. The Global Blenders Market Industry is expected to evolve in response to this consumer behavior, potentially influencing product development and marketing strategies.

    Market Segment Insights

    Blenders Product Type Insights

    The Blenders Market segmentation, based on product type includes Countertop Blenders, Personal Blenders and Hand Blenders. The hand blenders segment dominated the market. Due to the reduction in size of houses and kitchens, particularly in urban areas, consumers have felt the need to maximize space. Smaller hand-held blenders as a result have recently become more popular and outsold conventional table-top blenders in sales.

    Figure 1: Blenders Market, by Type, 2022 & 2032 (USD billion)

    Source: Secondary Research, Primary Research, Market Research Future Database and Analyst Review

    Blenders Material Type Insights

    The Blenders Market segmentation, based on material type, includes Plastic, Stainless Steel, Glass and Others (Aluminum, Copper etc.). The plastic category generated the most income. Plastic blenders have become much more popular, which can be ascribed to their portability and ease of use when traveling. The product is lightweight, as is its durability. Customers are consuming more as a result. Plastic blenders are a highly common product due to the risk of breakage when dropped.

    Blenders Power Insights

    The Blenders Market segmentation, based on power, includes > 200 Watts, 200 to 399 Watts, 400 to 699 Watts, 700 to 999 Watts and > 1,000 Watts. The 700 to 999 watts category generated the most income. The toughest ingredients can be blended with ease with a 700 watt motor. They are therefore excellent for soups, salad dressings, infant food, and other things. In households that don't prepare meals from scratch, a lower-watt blender can be used.

    Blenders Material Sales Channel Insights

    The Blenders Market segmentation, based on sales channel, includes Offline Channel and Online Channel. The online channel category generated the most income because of the channel's excellent shopping accessibility and convenience. In addition, online shopping choices for home electronics, such as hand blenders, are significantly influenced by online channels like social media and google AdWords.

    Get more detailed insights about Blenders Market Research Report—Global Forecast till 2035

    Regional Insights

    By region, the study provides the market insights into North America, Europe, Asia-Pacific and Rest of the World. The North American blenders market area will dominate this market. The evolving preferences of customers towards energy-efficient products, which is a major driver of regional growth, are to be attributed. The American populace is open to adopting and purchasing more expensive technology that can aid in energy conservation. In comparison to traditional blenders, blenders use less energy. In North America, the household market has a growing demand for blenders.

    Further, the major countries studied in the market report are The US, Canada, German, France, the UK, Italy, Spain, China, Japan, India, Australia, South Korea, and Brazil.

    Figure 2: BLENDERS MARKET SHARE BY REGION 2022 (%)

    BLENDERS MARKET SHARE BY REGION 2022 (%)

    Source: Secondary Research, Primary Research, Market Research Future Database and Analyst Review

    Europe blenders market accounts for the second-largest market share. Rising disposable income in Germany, the United Kingdom, France, and the rest of Europe, as well as consumer demand for wholesome food and beverages with new and better flavors, are anticipated to propel the market to grow at a significant rate during the forecast period. Government initiatives include enhancing food and beverage manufacturing and processing in the processed food sector. Further, the German blenders market held the largest market share, and the UK blenders market was the fastest growing market in the European region

    The Asia-Pacific Blenders Market is expected to grow at the fastest CAGR from 2023 to 2032. The region's growth is mostly related to the region's expanding population and quick urbanization. More than half of the population of the world resides in this area, which is driving up demand for home appliances. According to the World Bank Database, the region's population is more than 45% urban. The area is described as having a developing economy, a growing middle class, and modest living standards.

    The demand for blenders is being driven by the expanding millennial population and the widespread adoption of healthy eating habits. Moreover, China’s blenders market held the largest market share, and the Indian blenders market was the fastest growing market in the Asia-Pacific region.

    Key Players and Competitive Insights

    Leading market players are investing heavily in research and development in order to expand their product lines, which will help the blenders market, grow even more. Market participants are also undertaking a variety of strategic activities to expand their global footprint, with important market developments including new product launches, contractual agreements, mergers and acquisitions, higher investments, and collaboration with other organizations. To expand and survive in a more competitive and rising market climate, blenders industry must offer cost-effective items.

    Manufacturing locally to minimize operational costs is one of the key business tactics used by manufacturers in the global blenders industry to benefit clients and increase the market sector. In recent years, the blenders industry has offered some of the most significant advantages.

    Major players in the blenders market attempting to increase market demand by investing in research and development operations include Vitamix Corporation, Blendtec, Inc., Hamilton Beach Brands Holding Company, Conair Corporation, Cuisinart, Nutribullet, LLC, Oster, Philips Electronics N.V., Black+Decker Inc., Breville Group Limited, KitchenAid, Ninja Kitchen, Sunbeam Products Inc., Waring Commercial, Inc., Panasonic Corporation, Kuvings, Magimix, Braun GmbH, JTC Electronics Ltd and Electrolux AB.

    Koninklijke Philips NV (Philips) is a diversified technology firm that creates and produces consumer electronics and medical solutions. Diagnostic imaging, image-guided treatment, ultrasound, monitoring and analytics, enterprise diagnostic informatics, sleep and respiratory care, population health management, linked care informatics, and therapeutic care are all sectors in which the business provides products and solutions. Products available include power toothbrushes, sterilisers, breast pumps, shavers, brush heads, baby bottles, groomers, trimmers, and items for skin, hair, and hair removal. It also sells personal care and dental healthcare items.

    A variety of electric and electronic goods are developed, manufactured, sold, and serviced by Panasonic Holdings Corp. (Panasonic), originally known as Panasonic Corp. The range of products offered by Panasonic includes air conditioners for individual rooms, TVs, landlines, digital cameras, video equipment, audio equipment for the house, rice cookers, lights, wiring devices, air conditioners, air purifiers, and bicycles. Additionally, it provides projectors, batteries, electric motors, electronic materials, electronic components, electronic materials, semiconductors, LCD panels, mounting machines, welding equipment, PCs and tablets.

    Key Companies in the Blenders Market market include

    Industry Developments

    July 2022 Philips Domestic Appliances India Ltd., a significant player in the small appliance market in India, has introduced the HL7703 Mixer Grinder. Retail outlets and the company's official website (e-store) will both sell it. The company claims that the new mixer grinder has innovative technology and can grind anything in just 90 seconds. With a 1000W motor that offers best-in-class performance, the small mixer grinder is powerful.

    March 2022 For cordless hand blenders, a new lineup of motor choices from Power Motor is offered. The PT2730 and PT555PM range of cordless hand blenders and mixers offer a full motion solution. The highly integrated product assembly consists of the low voltage permanent motor driver, magnet DC motor, and rechargeable battery pack.

    Future Outlook

    Blenders Market Future Outlook

    The Global Blenders Market is projected to grow at a 5.20% CAGR from 2025 to 2035, driven by increasing health consciousness, technological advancements, and rising demand for home appliances.

    New opportunities lie in:

    • Develop smart blenders with IoT integration for personalized nutrition.
    • Expand product lines to include eco-friendly and sustainable materials.
    • Leverage e-commerce platforms for direct-to-consumer sales strategies.

    By 2035, the Global Blenders Market is expected to achieve substantial growth, reflecting evolving consumer preferences and technological innovations.

    Market Segmentation

    Blenders Power Outlook (USD Billion, 2018-2032)

    • > 200 Watts
    • 200 to 399 Watts
    • 400 to 699 Watts
    • > 1,000 Watts

    Blenders Regional Outlook (USD Billion, 2018-2032)

    North America
    • US
    • Canada

    Blenders Product Type Outlook (USD Billion, 2018-2032)

    • Countertop Blenders
    • Personal Blenders
    • Hand Blenders

    Blenders Material Type Outlook (USD Billion, 2018-2032)

    • Plastic
    • Stainless Steel
    • Glass
    • Others (Aluminum, Copper etc.)

    Blenders Sales Channel Outlook (USD Billion, 2018-2032)

    • Offline Channel
    • Online Channel

    Report Scope

    Report Attribute/Metric Details
    Market Size 2024 USD 3.47 billion
    Market Size 2025 USD 3.65 billion
    Market Size 2035 6.06 (Value (USD Billion))
    Compound Annual Growth Rate (CAGR) 5.20% (2025 - 2035)
    Base Year 2024
    Market Forecast Period 2025 - 2035
    Historical Data 2019- 2023
    Market Forecast Units Value (USD Billion)
    Report Coverage Revenue Forecast, Market Competitive Landscape, Growth Factors, and Trends
    Segments Covered Product Type, Material Type, Power, Sales Channel, and Region
    Geographies Covered North America, Europe, Asia Pacific, and the Rest of the World
    Countries Covered The US, Canada, German, France, UK, Italy, Spain, China, Japan, India, Australia, South Korea, and Brazil
    Key Companies Profiled Vitamix Corporation, Blendtec, Inc., Hamilton Beach Brands Holding Company, Conair Corporation, Cuisinart, Nutribullet, LLC, Oster, Philips Electronics N.V., Black+Decker Inc., Breville Group Limited, KitchenAid, Ninja Kitchen, Sunbeam Products Inc., Waring Commercial, Inc., Panasonic Corporation, Kuvings, Magimix, Braun GmbH, JTC Electronics Ltd and Electrolux AB
    Key Market Opportunities Rising growth of e-commerce sector
    Key Market Dynamics Shifting trends towards a healthier lifestyle and eating patterns, Rapid urbanization

    FAQs

    How much is the blenders market?

    The Blenders Market size was valued at USD 3.30 Billion in 2023.

    What is the growth rate of the blenders market?

    The global market is projected to grow at a CAGR of 5.2% during the forecast period, 2025-2034.

    Which region held the largest market share in the blenders market?

    North America had the largest share in the global market

    Who are the key players in the blenders market?

    The key players in the market are Vitamix Corporation, Blendtec, Inc., Hamilton Beach Brands Holding Company, Conair Corporation, Cuisinart, Nutribullet, LLC, Oster, Philips Electronics N.V.

    Which product type led the blenders market?

    The hand blenders category dominated the market in 2023.

    Which sales channel had the largest market share in the blenders market?

    The online channel category had the largest share in the global market.

    1. SECTION I: EXECUTIVE SUMMARY AND KEY HIGHLIGHTS
      1. | 1.1 EXECUTIVE SUMMARY
      2. | | 1.1.1 Market Overview
      3. | | 1.1.2 Key Findings
      4. | | 1.1.3 Market Segmentation
      5. | | 1.1.4 Competitive Landscape
      6. | | 1.1.5 Challenges and Opportunities
      7. | | 1.1.6 Future Outlook
    2. SECTION II: SCOPING, METHODOLOGY AND MARKET STRUCTURE
      1. | 2.1 MARKET INTRODUCTION
      2. | | 2.1.1 Definition
      3. | | 2.1.2 Scope of the study
      4. | | | 2.1.2.1 Research Objective
      5. | | | 2.1.2.2 Assumption
      6. | | | 2.1.2.3 Limitations
      7. | 2.2 RESEARCH METHODOLOGY
      8. | | 2.2.1 Overview
      9. | | 2.2.2 Data Mining
      10. | | 2.2.3 Secondary Research
      11. | | 2.2.4 Primary Research
      12. | | | 2.2.4.1 Primary Interviews and Information Gathering Process
      13. | | | 2.2.4.2 Breakdown of Primary Respondents
      14. | | 2.2.5 Forecasting Model
      15. | | 2.2.6 Market Size Estimation
      16. | | | 2.2.6.1 Bottom-Up Approach
      17. | | | 2.2.6.2 Top-Down Approach
      18. | | 2.2.7 Data Triangulation
      19. | | 2.2.8 Validation
    3. SECTION III: QUALITATIVE ANALYSIS
      1. | 3.1 MARKET DYNAMICS
      2. | | 3.1.1 Overview
      3. | | 3.1.2 Drivers
      4. | | 3.1.3 Restraints
      5. | | 3.1.4 Opportunities
      6. | 3.2 MARKET FACTOR ANALYSIS
      7. | | 3.2.1 Value chain Analysis
      8. | | 3.2.2 Porter's Five Forces Analysis
      9. | | | 3.2.2.1 Bargaining Power of Suppliers
      10. | | | 3.2.2.2 Bargaining Power of Buyers
      11. | | | 3.2.2.3 Threat of New Entrants
      12. | | | 3.2.2.4 Threat of Substitutes
      13. | | | 3.2.2.5 Intensity of Rivalry
      14. | | 3.2.3 COVID-19 Impact Analysis
      15. | | | 3.2.3.1 Market Impact Analysis
      16. | | | 3.2.3.2 Regional Impact
      17. | | | 3.2.3.3 Opportunity and Threat Analysis
    4. SECTION IV: QUANTITATIVE ANALYSIS
      1. | 4.1 Consumer and Retail, BY Type (USD Billion)
      2. | | 4.1.1 Countertop Blenders
      3. | | 4.1.2 Personal Blenders
      4. | | 4.1.3 Hand Blenders
      5. | 4.2 Consumer and Retail, BY Material Type (USD Billion)
      6. | | 4.2.1 Plastic
      7. | | 4.2.2 Stainless Steel
      8. | | 4.2.3 Glass
      9. | | 4.2.4 Others (Aluminum, Copper etc.)
      10. | 4.3 Consumer and Retail, BY Power (USD Billion)
      11. | | 4.3.1 > 200 Watts
      12. | | 4.3.2 200 to 399 Watts
      13. | | 4.3.3 400 to 699 Watts
      14. | | 4.3.4 700 to 999 Watts
      15. | | 4.3.5 > 1,000 Watts
      16. | 4.4 Consumer and Retail, BY Sales Channel (USD Billion)
      17. | | 4.4.1 Offline Channel
      18. | | 4.4.2 Online Channel
      19. | 4.5 Consumer and Retail, BY Region (USD Billion)
      20. | | 4.5.1 North America
      21. | | | 4.5.1.1 US
      22. | | | 4.5.1.2 Canada
      23. | | 4.5.2 Europe
      24. | | | 4.5.2.1 Germany
      25. | | | 4.5.2.2 UK
      26. | | | 4.5.2.3 France
      27. | | | 4.5.2.4 Russia
      28. | | | 4.5.2.5 Italy
      29. | | | 4.5.2.6 Spain
      30. | | | 4.5.2.7 Rest of Europe
      31. | | 4.5.3 APAC
      32. | | | 4.5.3.1 China
      33. | | | 4.5.3.2 India
      34. | | | 4.5.3.3 Japan
      35. | | | 4.5.3.4 South Korea
      36. | | | 4.5.3.5 Malaysia
      37. | | | 4.5.3.6 Thailand
      38. | | | 4.5.3.7 Indonesia
      39. | | | 4.5.3.8 Rest of APAC
      40. | | 4.5.4 South America
      41. | | | 4.5.4.1 Brazil
      42. | | | 4.5.4.2 Mexico
      43. | | | 4.5.4.3 Argentina
      44. | | | 4.5.4.4 Rest of South America
      45. | | 4.5.5 MEA
      46. | | | 4.5.5.1 GCC Countries
      47. | | | 4.5.5.2 South Africa
      48. | | | 4.5.5.3 Rest of MEA
    5. SECTION V: COMPETITIVE ANALYSIS
      1. | 5.1 Competitive Landscape
      2. | | 5.1.1 Overview
      3. | | 5.1.2 Competitive Analysis
      4. | | 5.1.3 Market share Analysis
      5. | | 5.1.4 Major Growth Strategy in the Consumer and Retail
      6. | | 5.1.5 Competitive Benchmarking
      7. | | 5.1.6 Leading Players in Terms of Number of Developments in the Consumer and Retail
      8. | | 5.1.7 Key developments and growth strategies
      9. | | | 5.1.7.1 New Product Launch/Service Deployment
      10. | | | 5.1.7.2 Merger & Acquisitions
      11. | | | 5.1.7.3 Joint Ventures
      12. | | 5.1.8 Major Players Financial Matrix
      13. | | | 5.1.8.1 Sales and Operating Income
      14. | | | 5.1.8.2 Major Players R&D Expenditure. 2023
      15. | 5.2 Company Profiles
      16. | | 5.2.1 Vitamix (US)
      17. | | | 5.2.1.1 Financial Overview
      18. | | | 5.2.1.2 Products Offered
      19. | | | 5.2.1.3 Key Developments
      20. | | | 5.2.1.4 SWOT Analysis
      21. | | | 5.2.1.5 Key Strategies
      22. | | 5.2.2 Breville (AU)
      23. | | | 5.2.2.1 Financial Overview
      24. | | | 5.2.2.2 Products Offered
      25. | | | 5.2.2.3 Key Developments
      26. | | | 5.2.2.4 SWOT Analysis
      27. | | | 5.2.2.5 Key Strategies
      28. | | 5.2.3 Ninja (US)
      29. | | | 5.2.3.1 Financial Overview
      30. | | | 5.2.3.2 Products Offered
      31. | | | 5.2.3.3 Key Developments
      32. | | | 5.2.3.4 SWOT Analysis
      33. | | | 5.2.3.5 Key Strategies
      34. | | 5.2.4 KitchenAid (US)
      35. | | | 5.2.4.1 Financial Overview
      36. | | | 5.2.4.2 Products Offered
      37. | | | 5.2.4.3 Key Developments
      38. | | | 5.2.4.4 SWOT Analysis
      39. | | | 5.2.4.5 Key Strategies
      40. | | 5.2.5 Hamilton Beach (US)
      41. | | | 5.2.5.1 Financial Overview
      42. | | | 5.2.5.2 Products Offered
      43. | | | 5.2.5.3 Key Developments
      44. | | | 5.2.5.4 SWOT Analysis
      45. | | | 5.2.5.5 Key Strategies
      46. | | 5.2.6 Oster (US)
      47. | | | 5.2.6.1 Financial Overview
      48. | | | 5.2.6.2 Products Offered
      49. | | | 5.2.6.3 Key Developments
      50. | | | 5.2.6.4 SWOT Analysis
      51. | | | 5.2.6.5 Key Strategies
      52. | | 5.2.7 Cuisinart (US)
      53. | | | 5.2.7.1 Financial Overview
      54. | | | 5.2.7.2 Products Offered
      55. | | | 5.2.7.3 Key Developments
      56. | | | 5.2.7.4 SWOT Analysis
      57. | | | 5.2.7.5 Key Strategies
      58. | | 5.2.8 Philips (NL)
      59. | | | 5.2.8.1 Financial Overview
      60. | | | 5.2.8.2 Products Offered
      61. | | | 5.2.8.3 Key Developments
      62. | | | 5.2.8.4 SWOT Analysis
      63. | | | 5.2.8.5 Key Strategies
      64. | | 5.2.9 Bosch (DE)
      65. | | | 5.2.9.1 Financial Overview
      66. | | | 5.2.9.2 Products Offered
      67. | | | 5.2.9.3 Key Developments
      68. | | | 5.2.9.4 SWOT Analysis
      69. | | | 5.2.9.5 Key Strategies
      70. | 5.3 Appendix
      71. | | 5.3.1 References
      72. | | 5.3.2 Related Reports
    6. LIST OF FIGURES
      1. | 6.1 MARKET SYNOPSIS
      2. | 6.2 NORTH AMERICA MARKET ANALYSIS
      3. | 6.3 US MARKET ANALYSIS BY TYPE
      4. | 6.4 US MARKET ANALYSIS BY MATERIAL TYPE
      5. | 6.5 US MARKET ANALYSIS BY POWER
      6. | 6.6 US MARKET ANALYSIS BY SALES CHANNEL
      7. | 6.7 CANADA MARKET ANALYSIS BY TYPE
      8. | 6.8 CANADA MARKET ANALYSIS BY MATERIAL TYPE
      9. | 6.9 CANADA MARKET ANALYSIS BY POWER
      10. | 6.10 CANADA MARKET ANALYSIS BY SALES CHANNEL
      11. | 6.11 EUROPE MARKET ANALYSIS
      12. | 6.12 GERMANY MARKET ANALYSIS BY TYPE
      13. | 6.13 GERMANY MARKET ANALYSIS BY MATERIAL TYPE
      14. | 6.14 GERMANY MARKET ANALYSIS BY POWER
      15. | 6.15 GERMANY MARKET ANALYSIS BY SALES CHANNEL
      16. | 6.16 UK MARKET ANALYSIS BY TYPE
      17. | 6.17 UK MARKET ANALYSIS BY MATERIAL TYPE
      18. | 6.18 UK MARKET ANALYSIS BY POWER
      19. | 6.19 UK MARKET ANALYSIS BY SALES CHANNEL
      20. | 6.20 FRANCE MARKET ANALYSIS BY TYPE
      21. | 6.21 FRANCE MARKET ANALYSIS BY MATERIAL TYPE
      22. | 6.22 FRANCE MARKET ANALYSIS BY POWER
      23. | 6.23 FRANCE MARKET ANALYSIS BY SALES CHANNEL
      24. | 6.24 RUSSIA MARKET ANALYSIS BY TYPE
      25. | 6.25 RUSSIA MARKET ANALYSIS BY MATERIAL TYPE
      26. | 6.26 RUSSIA MARKET ANALYSIS BY POWER
      27. | 6.27 RUSSIA MARKET ANALYSIS BY SALES CHANNEL
      28. | 6.28 ITALY MARKET ANALYSIS BY TYPE
      29. | 6.29 ITALY MARKET ANALYSIS BY MATERIAL TYPE
      30. | 6.30 ITALY MARKET ANALYSIS BY POWER
      31. | 6.31 ITALY MARKET ANALYSIS BY SALES CHANNEL
      32. | 6.32 SPAIN MARKET ANALYSIS BY TYPE
      33. | 6.33 SPAIN MARKET ANALYSIS BY MATERIAL TYPE
      34. | 6.34 SPAIN MARKET ANALYSIS BY POWER
      35. | 6.35 SPAIN MARKET ANALYSIS BY SALES CHANNEL
      36. | 6.36 REST OF EUROPE MARKET ANALYSIS BY TYPE
      37. | 6.37 REST OF EUROPE MARKET ANALYSIS BY MATERIAL TYPE
      38. | 6.38 REST OF EUROPE MARKET ANALYSIS BY POWER
      39. | 6.39 REST OF EUROPE MARKET ANALYSIS BY SALES CHANNEL
      40. | 6.40 APAC MARKET ANALYSIS
      41. | 6.41 CHINA MARKET ANALYSIS BY TYPE
      42. | 6.42 CHINA MARKET ANALYSIS BY MATERIAL TYPE
      43. | 6.43 CHINA MARKET ANALYSIS BY POWER
      44. | 6.44 CHINA MARKET ANALYSIS BY SALES CHANNEL
      45. | 6.45 INDIA MARKET ANALYSIS BY TYPE
      46. | 6.46 INDIA MARKET ANALYSIS BY MATERIAL TYPE
      47. | 6.47 INDIA MARKET ANALYSIS BY POWER
      48. | 6.48 INDIA MARKET ANALYSIS BY SALES CHANNEL
      49. | 6.49 JAPAN MARKET ANALYSIS BY TYPE
      50. | 6.50 JAPAN MARKET ANALYSIS BY MATERIAL TYPE
      51. | 6.51 JAPAN MARKET ANALYSIS BY POWER
      52. | 6.52 JAPAN MARKET ANALYSIS BY SALES CHANNEL
      53. | 6.53 SOUTH KOREA MARKET ANALYSIS BY TYPE
      54. | 6.54 SOUTH KOREA MARKET ANALYSIS BY MATERIAL TYPE
      55. | 6.55 SOUTH KOREA MARKET ANALYSIS BY POWER
      56. | 6.56 SOUTH KOREA MARKET ANALYSIS BY SALES CHANNEL
      57. | 6.57 MALAYSIA MARKET ANALYSIS BY TYPE
      58. | 6.58 MALAYSIA MARKET ANALYSIS BY MATERIAL TYPE
      59. | 6.59 MALAYSIA MARKET ANALYSIS BY POWER
      60. | 6.60 MALAYSIA MARKET ANALYSIS BY SALES CHANNEL
      61. | 6.61 THAILAND MARKET ANALYSIS BY TYPE
      62. | 6.62 THAILAND MARKET ANALYSIS BY MATERIAL TYPE
      63. | 6.63 THAILAND MARKET ANALYSIS BY POWER
      64. | 6.64 THAILAND MARKET ANALYSIS BY SALES CHANNEL
      65. | 6.65 INDONESIA MARKET ANALYSIS BY TYPE
      66. | 6.66 INDONESIA MARKET ANALYSIS BY MATERIAL TYPE
      67. | 6.67 INDONESIA MARKET ANALYSIS BY POWER
      68. | 6.68 INDONESIA MARKET ANALYSIS BY SALES CHANNEL
      69. | 6.69 REST OF APAC MARKET ANALYSIS BY TYPE
      70. | 6.70 REST OF APAC MARKET ANALYSIS BY MATERIAL TYPE
      71. | 6.71 REST OF APAC MARKET ANALYSIS BY POWER
      72. | 6.72 REST OF APAC MARKET ANALYSIS BY SALES CHANNEL
      73. | 6.73 SOUTH AMERICA MARKET ANALYSIS
      74. | 6.74 BRAZIL MARKET ANALYSIS BY TYPE
      75. | 6.75 BRAZIL MARKET ANALYSIS BY MATERIAL TYPE
      76. | 6.76 BRAZIL MARKET ANALYSIS BY POWER
      77. | 6.77 BRAZIL MARKET ANALYSIS BY SALES CHANNEL
      78. | 6.78 MEXICO MARKET ANALYSIS BY TYPE
      79. | 6.79 MEXICO MARKET ANALYSIS BY MATERIAL TYPE
      80. | 6.80 MEXICO MARKET ANALYSIS BY POWER
      81. | 6.81 MEXICO MARKET ANALYSIS BY SALES CHANNEL
      82. | 6.82 ARGENTINA MARKET ANALYSIS BY TYPE
      83. | 6.83 ARGENTINA MARKET ANALYSIS BY MATERIAL TYPE
      84. | 6.84 ARGENTINA MARKET ANALYSIS BY POWER
      85. | 6.85 ARGENTINA MARKET ANALYSIS BY SALES CHANNEL
      86. | 6.86 REST OF SOUTH AMERICA MARKET ANALYSIS BY TYPE
      87. | 6.87 REST OF SOUTH AMERICA MARKET ANALYSIS BY MATERIAL TYPE
      88. | 6.88 REST OF SOUTH AMERICA MARKET ANALYSIS BY POWER
      89. | 6.89 REST OF SOUTH AMERICA MARKET ANALYSIS BY SALES CHANNEL
      90. | 6.90 MEA MARKET ANALYSIS
      91. | 6.91 GCC COUNTRIES MARKET ANALYSIS BY TYPE
      92. | 6.92 GCC COUNTRIES MARKET ANALYSIS BY MATERIAL TYPE
      93. | 6.93 GCC COUNTRIES MARKET ANALYSIS BY POWER
      94. | 6.94 GCC COUNTRIES MARKET ANALYSIS BY SALES CHANNEL
      95. | 6.95 SOUTH AFRICA MARKET ANALYSIS BY TYPE
      96. | 6.96 SOUTH AFRICA MARKET ANALYSIS BY MATERIAL TYPE
      97. | 6.97 SOUTH AFRICA MARKET ANALYSIS BY POWER
      98. | 6.98 SOUTH AFRICA MARKET ANALYSIS BY SALES CHANNEL
      99. | 6.99 REST OF MEA MARKET ANALYSIS BY TYPE
      100. | 6.100 REST OF MEA MARKET ANALYSIS BY MATERIAL TYPE
      101. | 6.101 REST OF MEA MARKET ANALYSIS BY POWER
      102. | 6.102 REST OF MEA MARKET ANALYSIS BY SALES CHANNEL
      103. | 6.103 KEY BUYING CRITERIA OF CONSUMER AND RETAIL
      104. | 6.104 RESEARCH PROCESS OF MRFR
      105. | 6.105 DRO ANALYSIS OF CONSUMER AND RETAIL
      106. | 6.106 DRIVERS IMPACT ANALYSIS: CONSUMER AND RETAIL
      107. | 6.107 RESTRAINTS IMPACT ANALYSIS: CONSUMER AND RETAIL
      108. | 6.108 SUPPLY / VALUE CHAIN: CONSUMER AND RETAIL
      109. | 6.109 CONSUMER AND RETAIL, BY TYPE, 2024 (% SHARE)
      110. | 6.110 CONSUMER AND RETAIL, BY TYPE, 2024 TO 2035 (USD Billion)
      111. | 6.111 CONSUMER AND RETAIL, BY MATERIAL TYPE, 2024 (% SHARE)
      112. | 6.112 CONSUMER AND RETAIL, BY MATERIAL TYPE, 2024 TO 2035 (USD Billion)
      113. | 6.113 CONSUMER AND RETAIL, BY POWER, 2024 (% SHARE)
      114. | 6.114 CONSUMER AND RETAIL, BY POWER, 2024 TO 2035 (USD Billion)
      115. | 6.115 CONSUMER AND RETAIL, BY SALES CHANNEL, 2024 (% SHARE)
      116. | 6.116 CONSUMER AND RETAIL, BY SALES CHANNEL, 2024 TO 2035 (USD Billion)
      117. | 6.117 BENCHMARKING OF MAJOR COMPETITORS
    7. LIST OF TABLES
      1. | 7.1 LIST OF ASSUMPTIONS
      2. | | 7.1.1
      3. | 7.2 North America MARKET SIZE ESTIMATES; FORECAST
      4. | | 7.2.1 BY TYPE, 2025-2035 (USD Billion)
      5. | | 7.2.2 BY MATERIAL TYPE, 2025-2035 (USD Billion)
      6. | | 7.2.3 BY POWER, 2025-2035 (USD Billion)
      7. | | 7.2.4 BY SALES CHANNEL, 2025-2035 (USD Billion)
      8. | 7.3 US MARKET SIZE ESTIMATES; FORECAST
      9. | | 7.3.1 BY TYPE, 2025-2035 (USD Billion)
      10. | | 7.3.2 BY MATERIAL TYPE, 2025-2035 (USD Billion)
      11. | | 7.3.3 BY POWER, 2025-2035 (USD Billion)
      12. | | 7.3.4 BY SALES CHANNEL, 2025-2035 (USD Billion)
      13. | 7.4 Canada MARKET SIZE ESTIMATES; FORECAST
      14. | | 7.4.1 BY TYPE, 2025-2035 (USD Billion)
      15. | | 7.4.2 BY MATERIAL TYPE, 2025-2035 (USD Billion)
      16. | | 7.4.3 BY POWER, 2025-2035 (USD Billion)
      17. | | 7.4.4 BY SALES CHANNEL, 2025-2035 (USD Billion)
      18. | 7.5 Europe MARKET SIZE ESTIMATES; FORECAST
      19. | | 7.5.1 BY TYPE, 2025-2035 (USD Billion)
      20. | | 7.5.2 BY MATERIAL TYPE, 2025-2035 (USD Billion)
      21. | | 7.5.3 BY POWER, 2025-2035 (USD Billion)
      22. | | 7.5.4 BY SALES CHANNEL, 2025-2035 (USD Billion)
      23. | 7.6 Germany MARKET SIZE ESTIMATES; FORECAST
      24. | | 7.6.1 BY TYPE, 2025-2035 (USD Billion)
      25. | | 7.6.2 BY MATERIAL TYPE, 2025-2035 (USD Billion)
      26. | | 7.6.3 BY POWER, 2025-2035 (USD Billion)
      27. | | 7.6.4 BY SALES CHANNEL, 2025-2035 (USD Billion)
      28. | 7.7 UK MARKET SIZE ESTIMATES; FORECAST
      29. | | 7.7.1 BY TYPE, 2025-2035 (USD Billion)
      30. | | 7.7.2 BY MATERIAL TYPE, 2025-2035 (USD Billion)
      31. | | 7.7.3 BY POWER, 2025-2035 (USD Billion)
      32. | | 7.7.4 BY SALES CHANNEL, 2025-2035 (USD Billion)
      33. | 7.8 France MARKET SIZE ESTIMATES; FORECAST
      34. | | 7.8.1 BY TYPE, 2025-2035 (USD Billion)
      35. | | 7.8.2 BY MATERIAL TYPE, 2025-2035 (USD Billion)
      36. | | 7.8.3 BY POWER, 2025-2035 (USD Billion)
      37. | | 7.8.4 BY SALES CHANNEL, 2025-2035 (USD Billion)
      38. | 7.9 Russia MARKET SIZE ESTIMATES; FORECAST
      39. | | 7.9.1 BY TYPE, 2025-2035 (USD Billion)
      40. | | 7.9.2 BY MATERIAL TYPE, 2025-2035 (USD Billion)
      41. | | 7.9.3 BY POWER, 2025-2035 (USD Billion)
      42. | | 7.9.4 BY SALES CHANNEL, 2025-2035 (USD Billion)
      43. | 7.10 Italy MARKET SIZE ESTIMATES; FORECAST
      44. | | 7.10.1 BY TYPE, 2025-2035 (USD Billion)
      45. | | 7.10.2 BY MATERIAL TYPE, 2025-2035 (USD Billion)
      46. | | 7.10.3 BY POWER, 2025-2035 (USD Billion)
      47. | | 7.10.4 BY SALES CHANNEL, 2025-2035 (USD Billion)
      48. | 7.11 Spain MARKET SIZE ESTIMATES; FORECAST
      49. | | 7.11.1 BY TYPE, 2025-2035 (USD Billion)
      50. | | 7.11.2 BY MATERIAL TYPE, 2025-2035 (USD Billion)
      51. | | 7.11.3 BY POWER, 2025-2035 (USD Billion)
      52. | | 7.11.4 BY SALES CHANNEL, 2025-2035 (USD Billion)
      53. | 7.12 Rest of Europe MARKET SIZE ESTIMATES; FORECAST
      54. | | 7.12.1 BY TYPE, 2025-2035 (USD Billion)
      55. | | 7.12.2 BY MATERIAL TYPE, 2025-2035 (USD Billion)
      56. | | 7.12.3 BY POWER, 2025-2035 (USD Billion)
      57. | | 7.12.4 BY SALES CHANNEL, 2025-2035 (USD Billion)
      58. | 7.13 APAC MARKET SIZE ESTIMATES; FORECAST
      59. | | 7.13.1 BY TYPE, 2025-2035 (USD Billion)
      60. | | 7.13.2 BY MATERIAL TYPE, 2025-2035 (USD Billion)
      61. | | 7.13.3 BY POWER, 2025-2035 (USD Billion)
      62. | | 7.13.4 BY SALES CHANNEL, 2025-2035 (USD Billion)
      63. | 7.14 China MARKET SIZE ESTIMATES; FORECAST
      64. | | 7.14.1 BY TYPE, 2025-2035 (USD Billion)
      65. | | 7.14.2 BY MATERIAL TYPE, 2025-2035 (USD Billion)
      66. | | 7.14.3 BY POWER, 2025-2035 (USD Billion)
      67. | | 7.14.4 BY SALES CHANNEL, 2025-2035 (USD Billion)
      68. | 7.15 India MARKET SIZE ESTIMATES; FORECAST
      69. | | 7.15.1 BY TYPE, 2025-2035 (USD Billion)
      70. | | 7.15.2 BY MATERIAL TYPE, 2025-2035 (USD Billion)
      71. | | 7.15.3 BY POWER, 2025-2035 (USD Billion)
      72. | | 7.15.4 BY SALES CHANNEL, 2025-2035 (USD Billion)
      73. | 7.16 Japan MARKET SIZE ESTIMATES; FORECAST
      74. | | 7.16.1 BY TYPE, 2025-2035 (USD Billion)
      75. | | 7.16.2 BY MATERIAL TYPE, 2025-2035 (USD Billion)
      76. | | 7.16.3 BY POWER, 2025-2035 (USD Billion)
      77. | | 7.16.4 BY SALES CHANNEL, 2025-2035 (USD Billion)
      78. | 7.17 South Korea MARKET SIZE ESTIMATES; FORECAST
      79. | | 7.17.1 BY TYPE, 2025-2035 (USD Billion)
      80. | | 7.17.2 BY MATERIAL TYPE, 2025-2035 (USD Billion)
      81. | | 7.17.3 BY POWER, 2025-2035 (USD Billion)
      82. | | 7.17.4 BY SALES CHANNEL, 2025-2035 (USD Billion)
      83. | 7.18 Malaysia MARKET SIZE ESTIMATES; FORECAST
      84. | | 7.18.1 BY TYPE, 2025-2035 (USD Billion)
      85. | | 7.18.2 BY MATERIAL TYPE, 2025-2035 (USD Billion)
      86. | | 7.18.3 BY POWER, 2025-2035 (USD Billion)
      87. | | 7.18.4 BY SALES CHANNEL, 2025-2035 (USD Billion)
      88. | 7.19 Thailand MARKET SIZE ESTIMATES; FORECAST
      89. | | 7.19.1 BY TYPE, 2025-2035 (USD Billion)
      90. | | 7.19.2 BY MATERIAL TYPE, 2025-2035 (USD Billion)
      91. | | 7.19.3 BY POWER, 2025-2035 (USD Billion)
      92. | | 7.19.4 BY SALES CHANNEL, 2025-2035 (USD Billion)
      93. | 7.20 Indonesia MARKET SIZE ESTIMATES; FORECAST
      94. | | 7.20.1 BY TYPE, 2025-2035 (USD Billion)
      95. | | 7.20.2 BY MATERIAL TYPE, 2025-2035 (USD Billion)
      96. | | 7.20.3 BY POWER, 2025-2035 (USD Billion)
      97. | | 7.20.4 BY SALES CHANNEL, 2025-2035 (USD Billion)
      98. | 7.21 Rest of APAC MARKET SIZE ESTIMATES; FORECAST
      99. | | 7.21.1 BY TYPE, 2025-2035 (USD Billion)
      100. | | 7.21.2 BY MATERIAL TYPE, 2025-2035 (USD Billion)
      101. | | 7.21.3 BY POWER, 2025-2035 (USD Billion)
      102. | | 7.21.4 BY SALES CHANNEL, 2025-2035 (USD Billion)
      103. | 7.22 South America MARKET SIZE ESTIMATES; FORECAST
      104. | | 7.22.1 BY TYPE, 2025-2035 (USD Billion)
      105. | | 7.22.2 BY MATERIAL TYPE, 2025-2035 (USD Billion)
      106. | | 7.22.3 BY POWER, 2025-2035 (USD Billion)
      107. | | 7.22.4 BY SALES CHANNEL, 2025-2035 (USD Billion)
      108. | 7.23 Brazil MARKET SIZE ESTIMATES; FORECAST
      109. | | 7.23.1 BY TYPE, 2025-2035 (USD Billion)
      110. | | 7.23.2 BY MATERIAL TYPE, 2025-2035 (USD Billion)
      111. | | 7.23.3 BY POWER, 2025-2035 (USD Billion)
      112. | | 7.23.4 BY SALES CHANNEL, 2025-2035 (USD Billion)
      113. | 7.24 Mexico MARKET SIZE ESTIMATES; FORECAST
      114. | | 7.24.1 BY TYPE, 2025-2035 (USD Billion)
      115. | | 7.24.2 BY MATERIAL TYPE, 2025-2035 (USD Billion)
      116. | | 7.24.3 BY POWER, 2025-2035 (USD Billion)
      117. | | 7.24.4 BY SALES CHANNEL, 2025-2035 (USD Billion)
      118. | 7.25 Argentina MARKET SIZE ESTIMATES; FORECAST
      119. | | 7.25.1 BY TYPE, 2025-2035 (USD Billion)
      120. | | 7.25.2 BY MATERIAL TYPE, 2025-2035 (USD Billion)
      121. | | 7.25.3 BY POWER, 2025-2035 (USD Billion)
      122. | | 7.25.4 BY SALES CHANNEL, 2025-2035 (USD Billion)
      123. | 7.26 Rest of South America MARKET SIZE ESTIMATES; FORECAST
      124. | | 7.26.1 BY TYPE, 2025-2035 (USD Billion)
      125. | | 7.26.2 BY MATERIAL TYPE, 2025-2035 (USD Billion)
      126. | | 7.26.3 BY POWER, 2025-2035 (USD Billion)
      127. | | 7.26.4 BY SALES CHANNEL, 2025-2035 (USD Billion)
      128. | 7.27 MEA MARKET SIZE ESTIMATES; FORECAST
      129. | | 7.27.1 BY TYPE, 2025-2035 (USD Billion)
      130. | | 7.27.2 BY MATERIAL TYPE, 2025-2035 (USD Billion)
      131. | | 7.27.3 BY POWER, 2025-2035 (USD Billion)
      132. | | 7.27.4 BY SALES CHANNEL, 2025-2035 (USD Billion)
      133. | 7.28 GCC Countries MARKET SIZE ESTIMATES; FORECAST
      134. | | 7.28.1 BY TYPE, 2025-2035 (USD Billion)
      135. | | 7.28.2 BY MATERIAL TYPE, 2025-2035 (USD Billion)
      136. | | 7.28.3 BY POWER, 2025-2035 (USD Billion)
      137. | | 7.28.4 BY SALES CHANNEL, 2025-2035 (USD Billion)
      138. | 7.29 South Africa MARKET SIZE ESTIMATES; FORECAST
      139. | | 7.29.1 BY TYPE, 2025-2035 (USD Billion)
      140. | | 7.29.2 BY MATERIAL TYPE, 2025-2035 (USD Billion)
      141. | | 7.29.3 BY POWER, 2025-2035 (USD Billion)
      142. | | 7.29.4 BY SALES CHANNEL, 2025-2035 (USD Billion)
      143. | 7.30 Rest of MEA MARKET SIZE ESTIMATES; FORECAST
      144. | | 7.30.1 BY TYPE, 2025-2035 (USD Billion)
      145. | | 7.30.2 BY MATERIAL TYPE, 2025-2035 (USD Billion)
      146. | | 7.30.3 BY POWER, 2025-2035 (USD Billion)
      147. | | 7.30.4 BY SALES CHANNEL, 2025-2035 (USD Billion)
      148. | 7.31 PRODUCT LAUNCH/PRODUCT DEVELOPMENT/APPROVAL
      149. | | 7.31.1
      150. | 7.32 ACQUISITION/PARTNERSHIP
      151. | | 7.32.1

    Blenders Market Segmentation

    Blenders Product Type Outlook (USD Billion, 2018-2032)

    • Countertop Blenders
    • Personal Blenders
    • Hand Blenders

    Blenders Material Product Type Outlook (USD Billion, 2018-2032)

    • Plastic
    • Stainless Steel
    • Glass
    • Others (Aluminum, Copper etc.)

    Blenders Power Outlook (USD Billion, 2018-2032)

    • > 200 Watts
    • 200 to 399 Watts
    • 400 to 699 Watts
    • > 1,000 Watts

    Blenders Sales Channel Outlook (USD Billion, 2018-2032)

    • Offline Channel
    • Online Channel

    Blenders Regional Outlook (USD Billion, 2018-2032)

    • North America Outlook (USD Billion, 2018-2032)

      • North America Blenders by Product Type
        • Countertop Blenders
        • Personal Blenders
        • Hand Blenders
      • North America Blenders by Material Product Type
        • Plastic
        • Stainless Steel
        • Glass
        • Others (Aluminum, Copper etc.)
      • North America Blenders by Power
        • > 200 Watts
        • 200 to 399 Watts
        • 400 to 699 Watts
        • > 1,000 Watts
      • North America Blenders by Sales Channel
        • Offline Channel
        • Online Channel
      • US Outlook (USD Billion, 2018-2032)

      • US Blenders by Product Type
        • Countertop Blenders
        • Personal Blenders
        • Hand Blenders
      • US Blenders by Material Product Type
        • Plastic
        • Stainless Steel
        • Glass
        • Others (Aluminum, Copper etc.)
      • US Blenders by Power
        • > 200 Watts
        • 200 to 399 Watts
        • 400 to 699 Watts
        • > 1,000 Watts
      • US Blenders by Sales Channel
        • Offline Channel
        • Online Channel
      • CANADA Outlook (USD Billion, 2018-2032)

      • CANADA Blenders by Product Type
        • Countertop Blenders
        • Personal Blenders
        • Hand Blenders
      • CANADA Blenders by Material Product Type
        • Plastic
        • Stainless Steel
        • Glass
        • Others (Aluminum, Copper etc.)
      • CANADA Blenders by Power
        • > 200 Watts
        • 200 to 399 Watts
        • 400 to 699 Watts
        • > 1,000 Watts
      • CANADA Blenders by Sales Channel
        • Offline Channel
        • Online Channel
    • Europe Outlook (USD Billion, 2018-2032)

      • Europe Blenders by Product Type
        • Countertop Blenders
        • Personal Blenders
        • Hand Blenders
      • Europe Blenders by Material Product Type
        • Plastic
        • Stainless Steel
        • Glass
        • Others (Aluminum, Copper etc.)
      • Europe Blenders by Power
        • > 200 Watts
        • 200 to 399 Watts
        • 400 to 699 Watts
        • > 1,000 Watts
      • Europe Blenders by Sales Channel
        • Offline Channel
        • Online Channel
      • Germany Outlook (USD Billion, 2018-2032)

      • Germany Blenders by Product Type
        • Countertop Blenders
        • Personal Blenders
        • Hand Blenders
      • Germany Blenders by Material Product Type
        • Plastic
        • Stainless Steel
        • Glass
        • Others (Aluminum, Copper etc.)
      • Germany Blenders by Power
        • > 200 Watts
        • 200 to 399 Watts
        • 400 to 699 Watts
        • > 1,000 Watts
      • Germany Blenders by Sales Channel
        • Offline Channel
        • Online Channel
      • France Outlook (USD Billion, 2018-2032)

      • France Blenders by Product Type
        • Countertop Blenders
        • Personal Blenders
        • Hand Blenders
      • France Blenders by Material Product Type
        • Plastic
        • Stainless Steel
        • Glass
        • Others (Aluminum, Copper etc.)
      • France Blenders by Power
        • > 200 Watts
        • 200 to 399 Watts
        • 400 to 699 Watts
        • > 1,000 Watts
      • France Blenders by Sales Channel
        • Offline Channel
        • Online Channel
      • UK Outlook (USD Billion, 2018-2032)

      • UK Blenders by Product Type
        • Countertop Blenders
        • Personal Blenders
        • Hand Blenders
      • UK Blenders by Material Product Type
        • Plastic
        • Stainless Steel
        • Glass
        • Others (Aluminum, Copper etc.)
      • UK Blenders by Power
        • > 200 Watts
        • 200 to 399 Watts
        • 400 to 699 Watts
        • > 1,000 Watts
      • UK Blenders by Sales Channel
        • Offline Channel
        • Online Channel
      • ITALY Outlook (USD Billion, 2018-2032)

      • ITALY Blenders by Product Type
        • Countertop Blenders
        • Personal Blenders
        • Hand Blenders
      • ITALY Blenders by Material Product Type
        • Plastic
        • Stainless Steel
        • Glass
        • Others (Aluminum, Copper etc.)
      • ITALY Blenders by Power
        • > 200 Watts
        • 200 to 399 Watts
        • 400 to 699 Watts
        • > 1,000 Watts
      • ITALY Blenders by Sales Channel
        • Offline Channel
        • Online Channel
      • SPAIN Outlook (USD Billion, 2018-2032)

      • Spain Blenders by Product Type
        • Countertop Blenders
        • Personal Blenders
        • Hand Blenders
      • Spain Blenders by Material Product Type
        • Plastic
        • Stainless Steel
        • Glass
        • Others (Aluminum, Copper etc.)
      • Spain Blenders by Power
        • > 200 Watts
        • 200 to 399 Watts
        • 400 to 699 Watts
        • > 1,000 Watts
      • Spain Blenders by Sales Channel
        • Offline Channel
        • Online Channel
      • Rest Of Europe Outlook (USD Billion, 2018-2032)

      • Rest Of Europe Blenders by Product Type
        • Countertop Blenders
        • Personal Blenders
        • Hand Blenders
      • REST OF EUROPE Blenders by Material Product Type
        • Plastic
        • Stainless Steel
        • Glass
        • Others (Aluminum, Copper etc.)
      • REST OF EUROPE Blenders by Power
        • > 200 Watts
        • 200 to 399 Watts
        • 400 to 699 Watts
        • > 1,000 Watts
      • REST OF EUROPE Blenders by Sales Channel
        • Offline Channel
        • Online Channel
    • Asia-Pacific Outlook (USD Billion, 2018-2032)

      • Asia-Pacific Blenders by Product Type
        • Countertop Blenders
        • Personal Blenders
        • Hand Blenders
      • Asia-Pacific Blenders by Material Product Type
        • Plastic
        • Stainless Steel
        • Glass
        • Others (Aluminum, Copper etc.)
      • Asia-Pacific Blenders by Power
        • > 200 Watts
        • 200 to 399 Watts
        • 400 to 699 Watts
        • > 1,000 Watts
      • Asia-Pacific Blenders by Sales Channel
        • Offline Channel
        • Online Channel
      • China Outlook (USD Billion, 2018-2032)

      • China Blenders by Product Type
        • Countertop Blenders
        • Personal Blenders
        • Hand Blenders
      • China Blenders by Material Product Type
        • Plastic
        • Stainless Steel
        • Glass
        • Others (Aluminum, Copper etc.)
      • China Blenders by Power
        • > 200 Watts
        • 200 to 399 Watts
        • 400 to 699 Watts
        • > 1,000 Watts
      • China Blenders by Sales Channel
        • Offline Channel
        • Online Channel
      • Japan Outlook (USD Billion, 2018-2032)

      • Japan Blenders by Product Type
        • Countertop Blenders
        • Personal Blenders
        • Hand Blenders
      • Japan Blenders by Material Product Type
        • Plastic
        • Stainless Steel
        • Glass
        • Others (Aluminum, Copper etc.)
      • Japan Blenders by Power
        • > 200 Watts
        • 200 to 399 Watts
        • 400 to 699 Watts
        • > 1,000 Watts
      • Japan Blenders by Sales Channel
        • Offline Channel
        • Online Channel
      • India Outlook (USD Billion, 2018-2032)

      • India Blenders by Product Type
        • Countertop Blenders
        • Personal Blenders
        • Hand Blenders
      • India Blenders by Material Product Type
        • Plastic
        • Stainless Steel
        • Glass
        • Others (Aluminum, Copper etc.)
      • India Blenders by Power
        • > 200 Watts
        • 200 to 399 Watts
        • 400 to 699 Watts
        • > 1,000 Watts
      • India Blenders by Sales Channel
        • Offline Channel
        • Online Channel
      • Australia Outlook (USD Billion, 2018-2032)

      • Australia Blenders by Product Type
        • Countertop Blenders
        • Personal Blenders
        • Hand Blenders
      • Australia Blenders by Material Product Type
        • Plastic
        • Stainless Steel
        • Glass
        • Others (Aluminum, Copper etc.)
      • Australia Blenders by Power
        • > 200 Watts
        • 200 to 399 Watts
        • 400 to 699 Watts
        • > 1,000 Watts
      • Australia Blenders by Sales Channel
        • Offline Channel
        • Online Channel
      • Rest of Asia-Pacific Outlook (USD Billion, 2018-2032)

      • Rest of Asia-Pacific Blenders by Product Type
        • Countertop Blenders
        • Personal Blenders
        • Hand Blenders
      • Rest of Asia-Pacific Blenders by Material Product Type
        • Plastic
        • Stainless Steel
        • Glass
        • Others (Aluminum, Copper etc.)
      • Rest of Asia-Pacific Blenders by Power
        • > 200 Watts
        • 200 to 399 Watts
        • 400 to 699 Watts
        • > 1,000 Watts
      • Rest of Asia-Pacific Blenders by Sales Channel
        • Offline Channel
        • Online Channel
    • Rest of the World Outlook (USD Billion, 2018-2032)

      • Rest of the World Blenders by Product Type
        • Countertop Blenders
        • Personal Blenders
        • Hand Blenders
      • Rest of the World Blenders by Material Product Type
        • Plastic
        • Stainless Steel
        • Glass
        • Others (Aluminum, Copper etc.)
      • Rest of the World Blenders by Power
        • > 200 Watts
        • 200 to 399 Watts
        • 400 to 699 Watts
        • > 1,000 Watts
      • Rest of the World Blenders by Sales Channel
        • Offline Channel
        • Online Channel
      • Middle East Outlook (USD Billion, 2018-2032)

      • Middle East Blenders by Product Type
        • Countertop Blenders
        • Personal Blenders
        • Hand Blenders
      • Middle East Blenders by Material Product Type
        • Plastic
        • Stainless Steel
        • Glass
        • Others (Aluminum, Copper etc.)
      • Middle East Blenders by Power
        • > 200 Watts
        • 200 to 399 Watts
        • 400 to 699 Watts
        • > 1,000 Watts
      • Middle East Blenders by Sales Channel
        • Offline Channel
        • Online Channel
      • Africa Outlook (USD Billion, 2018-2032)

      • Africa Blenders by Product Type
        • Countertop Blenders
        • Personal Blenders
        • Hand Blenders
      • Africa Blenders by Material Product Type
        • Plastic
        • Stainless Steel
        • Glass
        • Others (Aluminum, Copper etc.)
      • Africa Blenders by Power
        • > 200 Watts
        • 200 to 399 Watts
        • 400 to 699 Watts
        • > 1,000 Watts
      • Africa Blenders by Sales Channel
        • Offline Channel
        • Online Channel
      • Latin America Outlook (USD Billion, 2018-2032)

      • Latin America Blenders by Product Type
        • Countertop Blenders
        • Personal Blenders
        • Hand Blenders
      • Latin America Blenders by Material Product Type
        • Plastic
        • Stainless Steel
        • Glass
        • Others (Aluminum, Copper etc.)
      • Latin America Blenders by Power
        • > 200 Watts
        • 200 to 399 Watts
        • 400 to 699 Watts
        • > 1,000 Watts
      • Latin America Blenders by Sales Channel
        • Offline Channel
        • Online Channel
    Infographic

    Free Sample Request

    Kindly complete the form below to receive a free sample of this Report

    Get Free Sample

    Customer Strories

    “I am very pleased with how market segments have been defined in a relevant way for my purposes (such as "Portable Freezers & refrigerators" and "last-mile"). In general the report is well structured. Thanks very much for your efforts.”

    Victoria Milne

    Founder
    Case Study
    Chemicals and Materials

    Compare Licence

    ×
    Features License Type
    Single User Multiuser License Enterprise User
    Price $4,950 $5,950 $7,250
    Maximum User Access Limit 1 User Upto 10 Users Unrestricted Access Throughout the Organization
    Free Customization
    Direct Access to Analyst
    Deliverable Format
    Platform Access
    Discount on Next Purchase 10% 15% 15%
    Printable Versions