• Cat-intel
  • MedIntelliX
  • Resources
  • About Us
  • Request Free Sample ×

    Kindly complete the form below to receive a free sample of this Report

    Leading companies partner with us for data-driven Insights

    clients tt-cursor

    Biological Indicator Incubator Market

    ID: MRFR/LS/35125-HCR
    100 Pages
    Rahul Gotadki
    September 2025

    Biological Indicator Incubator Market Research Report By Type (Horizontal Incubator, Vertical Incubator, Portable Incubator, Hybrid Incubator), By Application (Microbial Identification, Sterilization Monitoring, Quality Control, Research and Development), By End Use (Healthcare, Pharmaceuticals, Biotechnology, Food and Beverage), By Capacity (Small Capacity, Medium Capacity, Large Capacity) and By Regional (North America, Europe, South America, Asia Pacific, Middle East and Africa) - Forecast to 2034

    Share:
    Download PDF ×

    We do not share your information with anyone. However, we may send you emails based on your report interest from time to time. You may contact us at any time to opt-out.

    Biological Indicator Incubator Market Research Report — Global Forecast till 2034 Infographic
    Purchase Options
    $ 4,950.0
    $ 5,950.0
    $ 7,250.0
    Table of Contents

    Biological Indicator Incubator Market Summary

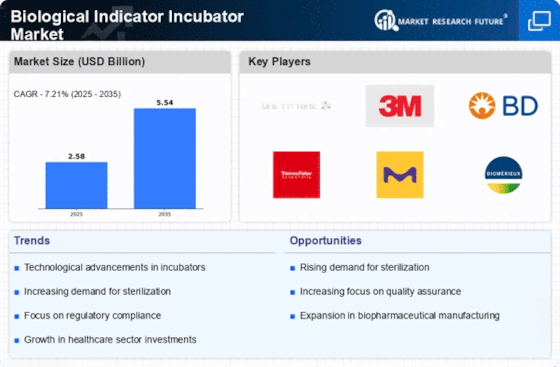
    The Global Biological Indicator Incubator Market is projected to grow from 2.58 USD Billion in 2024 to 5.54 USD Billion by 2035, reflecting a robust growth trajectory.

    Key Market Trends & Highlights

    Biological Indicator Incubator Key Trends and Highlights

    • The market is expected to expand at a compound annual growth rate (CAGR) of 7.2 percent from 2025 to 2035.
    • By 2035, the market valuation is anticipated to reach 5.54 USD Billion, indicating substantial growth opportunities.
    • In 2024, the market is valued at 2.58 USD Billion, laying a solid foundation for future expansion.
    • Growing adoption of biological indicators due to increasing regulatory requirements is a major market driver.

    Market Size & Forecast

    2024 Market Size 2.58 (USD Billion)
    2035 Market Size 5.54 (USD Billion)
    CAGR (2025-2035) 7.2%

    Major Players

    Biotest, 3M, Cherwell Scientific, Himedia Laboratories, Sartorius, Hach, Laboratory Equipment Company, Mesa Labs, Becton Dickinson, ATCC, bioMérieux, Thermo Fisher Scientific, Eppendorf

    Biological Indicator Incubator Market Trends

    The increasing emphasis on sterilization processes across various industries appears to drive the demand for biological indicator incubators, which are essential for ensuring the efficacy of sterilization methods.

    U.S. Food and Drug Administration (FDA)

    Biological Indicator Incubator Market Drivers

    Rising Demand for Sterilization Services

    The Global Biological Indicator Incubator Market Industry is experiencing a surge in demand for sterilization services across various sectors, including healthcare and pharmaceuticals. This trend is driven by the increasing need for effective sterilization methods to ensure patient safety and product integrity. As hospitals and laboratories adopt stringent sterilization protocols, the demand for biological indicators, which verify the efficacy of sterilization processes, is likely to grow. In 2024, the market is projected to reach 2.58 USD Billion, reflecting the critical role of biological indicators in maintaining compliance with health regulations.

    Market Segment Insights

    Get more detailed insights about Biological Indicator Incubator Market Research Report — Global Forecast till 2034

    Regional Insights

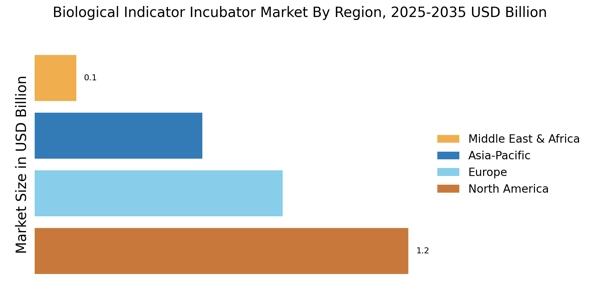
    The Biological Indicator Incubator Market, valued at 2.25 USD Billion in 2023, is projected to witness substantial growth across various regions, reflecting the rising demand for effective biological safety assurance processes. North America holds a prominent position in this market, being valued at 0.9 USD Billion in 2023, which underlines its significance as a leading hub for biotechnology and pharmaceutical advancements, with expectations of reaching 1.7 USD Billion by 2032.

    Europe follows with a valuation of 0.6 USD Billion in 2023, anticipated to escalate to 1.1 USD Billion, driven by stringent regulatory frameworks ensuring environmental safety. The APAC region, valued at 0.5 USD Billion, shows potential for rapid growth, expected to reach 1.0 USD Billion, supported by increasing investments in health infrastructure and bio-research.

    South America and the MEA regions, although smaller in market size at 0.1 USD Billion each in 2023, are experiencing slow but steady advancements in their healthcare sectors, projected to grow to 0.3 USD Billion and 0.2 USD Billion, respectively, by 2032.

    The diverse opportunities and expanding applications in each region position the Biological Indicator Incubator Market as a vital component in ensuring laboratory safety and process validation across various industrial sectors.

    Biological Indicator Incubator Market Regional Insights

    Source: Primary Research, Secondary Research, Market Research Future Database and Analyst Review

    Key Players and Competitive Insights

    The Biological Indicator Incubator Market represents a pivotal aspect of the healthcare and life sciences industry, focusing on ensuring sterility and the efficacy of sterilization processes. With an increasing emphasis on patient safety and quality assurance in healthcare settings, the competition in this market is intensifying.

    Companies are investing heavily in technological advancements to improve the functionality and reliability of biological indicator incubators. Trends indicate a growing demand for these incubators for various applications, including pharmaceutical manufacturing, surgical procedures, and laboratory research.

    As regulatory standards evolve and companies seek to enhance their operational efficiencies, this market is expected to experience significant growth driven by innovation and a commitment to providing superior bioprocessing solutions. Biotest stands out in the Biological Indicator Incubator Market, characterized by its strong focus on the development of high-quality biological indicators.

    The company boasts a comprehensive product portfolio that caters to diverse customer needs, thereby solidifying its market presence. One of the key strengths of Biotest is its commitment to research and development, which allows it to stay ahead of emerging trends and technological advancements in incubator technology.

    This proactive approach enables Biotest to offer state-of-the-art products that comply with the stringent requirements of regulatory bodies. Additionally, Biotest emphasizes robust customer service and support, ensuring that clients can effectively implement and utilize their biological indicator solutions without any hurdles.

    Such strengths contribute to the company’s reputation as a reliable partner in achieving optimal sterilization processes. 3M is highly regarded in the Biological Indicator Incubator Market, leveraging its extensive history and expertise in industrial solutions.

    The company demonstrates significant strength in providing innovative products that align with evolving industry standards, particularly in the areas of sterilization and bioburden testing. 3M's biological indicator incubators are designed to offer precise and reliable performance, enhancing the reliability of sterilization results.

    One of its distinct advantages lies in its strong supply chain and distribution network, ensuring that its products are readily available to clients across various regions. Furthermore, 3M continually invests in cutting-edge research to improve the efficiency and functionality of its incubators, enabling healthcare facilities to maintain high-quality standards in patient care.

    The company's dedication to excellence in its service offerings and technological innovation significantly fortifies its competitive edge in the market.

    Key Companies in the Biological Indicator Incubator Market market include

    Industry Developments

    Recent developments in the Biological Indicator Incubator Market have shown significant growth, with companies like Thermo Fisher Scientific and Sartorius leading innovative advancements in incubation technologies aimed at enhancing microbial testing and sterility assurance. The heightened demand due to stringent regulations in biotechnology and pharmaceuticals is driving market expansion.

    Current affairs indicate an ongoing focus on enhancing product efficacy and standardization as companies strive to meet growing laboratory needs. In terms of mergers and acquisitions, Biotest and Becton Dickinson have been involved in noteworthy activities recently, consolidating their positions in the market through strategic partnerships that enhance their biological indicator portfolios.

    Notably, 3M is also expanding its reach through acquisition, particularly enhancing its capabilities in laboratory reusable products. Furthermore, increased investments in research and development by companies like Mesa Labs and Eppendorf are significantly impacting the market's valuation.

    The collective efforts of these organizations and the continuous growth trend exhibit a flourishing market environment characterized by technological advancements and strategic business maneuvers aimed at improving reliability and efficiency within laboratories.

    Future Outlook

    Biological Indicator Incubator Market Future Outlook

    The Global Biological Indicator Incubator Market is projected to grow at a 7.2% CAGR from 2024 to 2035, driven by technological advancements and increasing regulatory requirements.

    New opportunities lie in:

    • Develop smart incubators with IoT integration for real-time monitoring.
    • Expand product lines to include eco-friendly materials and energy-efficient designs.
    • Leverage AI for predictive maintenance and enhanced user experience.

    By 2035, the market is expected to achieve substantial growth, reflecting evolving industry needs and technological innovations.

    Market Segmentation

    Biological Indicator Incubator Market Type Outlook

    • Horizontal Incubator
    • Vertical Incubator
    • Portable Incubator
    • Hybrid Incubator

    Biological Indicator Incubator Market End Use Outlook

    • Healthcare
    • Pharmaceuticals
    • Biotechnology
    • Food and Beverage

    Biological Indicator Incubator Market Capacity Outlook

    • Small Capacity
    • Medium Capacity
    • Large Capacity

    Biological Indicator Incubator Market Regional Outlook

    • North America
    • Europe
    • South America
    • Asia Pacific
    • Middle East and Africa

    Biological Indicator Incubator Market Application Outlook

    • Microbial Identification
    • Sterilization Monitoring
    • Quality Control
    • Research and Development

    Report Scope

    Report Attribute/Metric Details
    Market Size 2024    2.58 (USD Billion)
    Market Size 2025    2.76 (USD Billion)
    Market Size 2034    5.17 (USD Billion)
    Compound Annual Growth Rate (CAGR)    7.21 % (2025 - 2034)
    Report Coverage Revenue Forecast, Competitive Landscape, Growth Factors, and Trends
    Base Year 2024
    Market Forecast Period 2025 - 2034
    Historical Data 2020 - 2024
    Market Forecast Units USD Billion
    Key Companies Profiled Biotest, 3M, Cherwell Scientific, Himedia Laboratories, Sartorius, Hach, Laboratory Equipment Company, Mesa Labs, Becton Dickinson, ATCC, bioMérieux, Thermo Fisher Scientific, Eppendorf
    Segments Covered Type, Application, End Use, Capacity, Regional
    Key Market Opportunities Technological advancements in incubators, Growing healthcare and pharmaceutical sectors, Increased regulatory standards compliance, Rising awareness of infection control, Expansion in emerging markets
    Key Market Dynamics Increasing demand for sterilization, Growing healthcare infrastructure, Rising awareness of infection control, Technological advancements in incubators, Expansion of biopharmaceutical industry
    Countries Covered North America, Europe, APAC, South America, MEA

    Market Highlights

    Author
    Rahul Gotadki
    Assistant Manager

    He holds an experience of about 7+ years in Market Research and Business Consulting, working under the spectrum of Life Sciences and Healthcare domains. Rahul conceptualizes and implements a scalable business strategy and provides strategic leadership to the clients. His expertise lies in market estimation, competitive intelligence, pipeline analysis, customer assessment, etc. In addition to the above, his other responsibility includes strategic tracking of high growth markets & advising clients on the potential areas of focus they could direct their business initiatives

    Leave a Comment

    FAQs

    What is the expected market size of the Biological Indicator Incubator Market in 2034?

    The Biological Indicator Incubator Market is expected to be valued at 5.17 USD Billion in 2034.

    What is the projected CAGR for the Biological Indicator Incubator Market from 2024 to 2034?

    The expected CAGR for the Biological Indicator Incubator Market during the period from 2025 to 2034 is 7.21%.

    Which region is projected to have the largest market share in 2032?

    North America is projected to have the largest market share, valued at 1.7 USD Billion in 2032.

    What are the expected market values for the different types of incubators in 2032?

    By 2032, Horizontal Incubators are expected to be valued at 1.6 USD Billion, Vertical Incubators at 1.1 USD Billion, Portable Incubators at 0.85 USD Billion, and Hybrid Incubators at 0.65 USD Billion.

    Who are the major players in the Biological Indicator Incubator Market?

    Key players in the market include Biotest, 3M, Cherwell Scientific, Himedia Laboratories, Sartorius, Hach, Laboratory Equipment Company, Mesa Labs, Becton Dickinson, ATCC, bioMérieux, Thermo Fisher Scientific, and Eppendorf.

    What is the market size of the Biological Indicator Incubator Market in 2023?

    In 2023, the Biological Indicator Incubator Market is valued at 2.25 USD Billion.

    Which region shows substantial growth potential in the upcoming years?

    The APAC region shows substantial growth potential, with an expected market value of 1.0 USD Billion in 2032.

    What challenges might affect the Biological Indicator Incubator Market's growth?

    Challenges affecting market growth may include technological advancements and regulatory compliance issues.

    How is the market expected to evolve between 2024 and 2032?

    The market is expected to experience significant growth driven by increasing demand for sterile testing in various industries between 2024 and 2032.

    What is the market value for South America in 2032?

    The market value for South America in 2032 is expected to reach 0.3 USD Billion.

    1. EXECUTIVE SUMMARY
    2. Market Overview
      1. Key Findings
      2. Market Segmentation
    3. Competitive Landscape
      1. Challenges and Opportunities
      2. Future Outlook
    4. MARKET INTRODUCTION
      1. Definition
      2. Scope of the study
        1. Research Objective
        2. Assumption
        3. Limitations
    5. RESEARCH METHODOLOGY
      1. Overview
    6. Data Mining
      1. Secondary Research
      2. Primary Research
    7. Primary Interviews and Information Gathering Process
      1. Breakdown of Primary
    8. Respondents
      1. Forecasting Model
      2. Market Size Estimation
    9. Bottom-Up Approach
      1. Top-Down Approach
      2. Data Triangulation
      3. Validation
    10. MARKET DYNAMICS
      1. Overview
      2. Drivers
      3. Restraints
      4. Opportunities
    11. MARKET FACTOR ANALYSIS
      1. Value chain Analysis
      2. Porter's Five Forces
    12. Analysis
      1. Bargaining Power of Suppliers
        1. Bargaining Power
    13. of Buyers
      1. Threat of New Entrants
        1. Threat of Substitutes
        2. Intensity of Rivalry
      2. COVID-19 Impact Analysis
    14. Market Impact Analysis
      1. Regional Impact
        1. Opportunity and
    15. Threat Analysis
    16. BIOLOGICAL INDICATOR INCUBATOR MARKET,
    17. BY TYPE (USD BILLION)
      1. Horizontal Incubator
      2. Vertical Incubator
      3. Portable Incubator
      4. Hybrid Incubator
    18. BIOLOGICAL INDICATOR
    19. INCUBATOR MARKET, BY APPLICATION (USD BILLION)
      1. Microbial Identification
      2. Sterilization Monitoring
      3. Quality Control
      4. Research
    20. and Development
    21. BIOLOGICAL INDICATOR INCUBATOR MARKET, BY END USE (USD
    22. BILLION)
      1. Healthcare
      2. Pharmaceuticals
      3. Biotechnology
      4. Food and Beverage
    23. BIOLOGICAL INDICATOR INCUBATOR MARKET, BY
    24. CAPACITY (USD BILLION)
      1. Small Capacity
      2. Medium Capacity
      3. Large Capacity
    25. BIOLOGICAL INDICATOR INCUBATOR MARKET, BY REGIONAL
    26. (USD BILLION)
      1. North America
        1. US
        2. Canada
      2. Europe
        1. Germany
        2. UK
        3. France
    27. Russia
      1. Italy
        1. Spain
        2. Rest of Europe
      2. APAC
        1. China
        2. India
        3. Japan
    28. South Korea
      1. Malaysia
        1. Thailand
        2. Indonesia
        3. Rest of APAC
      2. South America
        1. Brazil
    29. Mexico
      1. Argentina
        1. Rest of South America
      2. MEA
        1. GCC Countries
        2. South Africa
        3. Rest of MEA
    30. COMPETITIVE LANDSCAPE
      1. Overview
    31. Competitive Analysis
      1. Market share Analysis
      2. Major Growth
    32. Strategy in the Biological Indicator Incubator Market
      1. Competitive Benchmarking
      2. Leading Players in Terms of Number of Developments in the Biological
    33. Indicator Incubator Market
      1. Key developments and growth strategies
        1. New Product Launch/Service Deployment
        2. Merger & Acquisitions
        3. Joint Ventures
      2. Major Players Financial Matrix
    34. Sales and Operating Income
      1. Major Players R&D Expenditure. 2023
    35. COMPANY PROFILES
      1. Biotest
        1. Financial Overview
        2. Products Offered
        3. Key Developments
        4. SWOT
    36. Analysis
      1. Key Strategies
      2. 3M
        1. Financial Overview
        2. Products Offered
        3. Key Developments
        4. SWOT
    37. Analysis
      1. Key Strategies
      2. Cherwell Scientific
    38. Financial Overview
      1. Products Offered
        1. Key Developments
        2. SWOT Analysis
        3. Key Strategies
      2. Himedia Laboratories
        1. Financial Overview
        2. Products Offered
        3. Key
    39. Developments
      1. SWOT Analysis
        1. Key Strategies
    40. Sartorius
      1. Financial Overview
        1. Products Offered
    41. Key Developments
      1. SWOT Analysis
        1. Key Strategies
    42. Hach
      1. Financial Overview
        1. Products Offered
    43. Key Developments
      1. SWOT Analysis
        1. Key Strategies
    44. Laboratory Equipment Company
      1. Financial Overview
        1. Products
    45. Offered
      1. Key Developments
        1. SWOT Analysis
    46. Key Strategies
      1. Mesa Labs
        1. Financial Overview
    47. Products Offered
      1. Key Developments
        1. SWOT Analysis
        2. Key Strategies
      2. Becton Dickinson
        1. Financial Overview
        2. Products Offered
        3. Key Developments
        4. SWOT
    48. Analysis
      1. Key Strategies
      2. ATCC
        1. Financial
    49. Overview
      1. Products Offered
        1. Key Developments
    50. SWOT Analysis
      1. Key Strategies
      2. bioMérieux
    51. Financial Overview
      1. Products Offered
        1. Key Developments
        2. SWOT Analysis
        3. Key Strategies
      2. Thermo Fisher
    52. Scientific
      1. Financial Overview
        1. Products Offered
        2. Key Developments
        3. SWOT Analysis
        4. Key Strategies
      2. Eppendorf
        1. Financial Overview
        2. Products
    53. Offered
      1. Key Developments
        1. SWOT Analysis
    54. Key Strategies
    55. APPENDIX
      1. References
      2. Related Reports
    56. AMERICA BIOLOGICAL INDICATOR INCUBATOR MARKET SIZE ESTIMATES & FORECAST, BY
    57. TYPE, 2019-2032 (USD BILLIONS)
    58. INCUBATOR MARKET SIZE ESTIMATES & FORECAST, BY APPLICATION, 2019-2032 (USD BILLIONS)
    59. & FORECAST, BY END USE, 2019-2032 (USD BILLIONS)
    60. BIOLOGICAL INDICATOR INCUBATOR MARKET SIZE ESTIMATES & FORECAST, BY CAPACITY,
    61. 2032 (USD BILLIONS)
    62. MARKET SIZE ESTIMATES & FORECAST, BY REGIONAL, 2019-2032 (USD BILLIONS)
    63. BY TYPE, 2019-2032 (USD BILLIONS)
    64. MARKET SIZE ESTIMATES & FORECAST, BY APPLICATION, 2019-2032 (USD BILLIONS)
    65. BY END USE, 2019-2032 (USD BILLIONS)
    66. MARKET SIZE ESTIMATES & FORECAST, BY CAPACITY, 2019-2032 (USD BILLIONS)
    67. BY REGIONAL, 2019-2032 (USD BILLIONS)
    68. INCUBATOR MARKET SIZE ESTIMATES & FORECAST, BY TYPE, 2019-2032 (USD BILLIONS)
    69. FORECAST, BY APPLICATION, 2019-2032 (USD BILLIONS)
    70. INDICATOR INCUBATOR MARKET SIZE ESTIMATES & FORECAST, BY END USE, 2019-2032
    71. (USD BILLIONS)
    72. ESTIMATES & FORECAST, BY CAPACITY, 2019-2032 (USD BILLIONS)
    73. CANADA BIOLOGICAL INDICATOR INCUBATOR MARKET SIZE ESTIMATES & FORECAST, BY REGIONAL,
    74. 2032 (USD BILLIONS)
    75. SIZE ESTIMATES & FORECAST, BY TYPE, 2019-2032 (USD BILLIONS)
    76. EUROPE BIOLOGICAL INDICATOR INCUBATOR MARKET SIZE ESTIMATES & FORECAST, BY APPLICATION,
    77. 2032 (USD BILLIONS)
    78. SIZE ESTIMATES & FORECAST, BY END USE, 2019-2032 (USD BILLIONS)
    79. EUROPE BIOLOGICAL INDICATOR INCUBATOR MARKET SIZE ESTIMATES & FORECAST,
    80. BY CAPACITY, 2019-2032 (USD BILLIONS)
    81. INCUBATOR MARKET SIZE ESTIMATES & FORECAST, BY REGIONAL, 2019-2032 (USD BILLIONS)
    82. FORECAST, BY TYPE, 2019-2032 (USD BILLIONS)
    83. INCUBATOR MARKET SIZE ESTIMATES & FORECAST, BY APPLICATION, 2019-2032 (USD BILLIONS)
    84. FORECAST, BY END USE, 2019-2032 (USD BILLIONS)
    85. INDICATOR INCUBATOR MARKET SIZE ESTIMATES & FORECAST, BY CAPACITY, 2019-2032
    86. (USD BILLIONS)
    87. ESTIMATES & FORECAST, BY REGIONAL, 2019-2032 (USD BILLIONS)
    88. UK BIOLOGICAL INDICATOR INCUBATOR MARKET SIZE ESTIMATES & FORECAST, BY TYPE,
    89. 2032 (USD BILLIONS)
    90. SIZE ESTIMATES & FORECAST, BY APPLICATION, 2019-2032 (USD BILLIONS)
    91. UK BIOLOGICAL INDICATOR INCUBATOR MARKET SIZE ESTIMATES & FORECAST, BY END
    92. USE, 2019-2032 (USD BILLIONS)
    93. MARKET SIZE ESTIMATES & FORECAST, BY CAPACITY, 2019-2032 (USD BILLIONS)
    94. BY REGIONAL, 2019-2032 (USD BILLIONS)
    95. INCUBATOR MARKET SIZE ESTIMATES & FORECAST, BY TYPE, 2019-2032 (USD BILLIONS)
    96. FORECAST, BY APPLICATION, 2019-2032 (USD BILLIONS)
    97. INDICATOR INCUBATOR MARKET SIZE ESTIMATES & FORECAST, BY END USE, 2019-2032
    98. (USD BILLIONS)
    99. ESTIMATES & FORECAST, BY CAPACITY, 2019-2032 (USD BILLIONS)
    100. FRANCE BIOLOGICAL INDICATOR INCUBATOR MARKET SIZE ESTIMATES & FORECAST, BY REGIONAL,
    101. 2032 (USD BILLIONS)
    102. SIZE ESTIMATES & FORECAST, BY TYPE, 2019-2032 (USD BILLIONS)
    103. RUSSIA BIOLOGICAL INDICATOR INCUBATOR MARKET SIZE ESTIMATES & FORECAST, BY APPLICATION,
    104. 2032 (USD BILLIONS)
    105. SIZE ESTIMATES & FORECAST, BY END USE, 2019-2032 (USD BILLIONS)
    106. RUSSIA BIOLOGICAL INDICATOR INCUBATOR MARKET SIZE ESTIMATES & FORECAST,
    107. BY CAPACITY, 2019-2032 (USD BILLIONS)
    108. INCUBATOR MARKET SIZE ESTIMATES & FORECAST, BY REGIONAL, 2019-2032 (USD BILLIONS)
    109. FORECAST, BY TYPE, 2019-2032 (USD BILLIONS)
    110. INCUBATOR MARKET SIZE ESTIMATES & FORECAST, BY APPLICATION, 2019-2032 (USD BILLIONS)
    111. FORECAST, BY END USE, 2019-2032 (USD BILLIONS)
    112. INDICATOR INCUBATOR MARKET SIZE ESTIMATES & FORECAST, BY CAPACITY, 2019-2032
    113. (USD BILLIONS)
    114. ESTIMATES & FORECAST, BY REGIONAL, 2019-2032 (USD BILLIONS)
    115. SPAIN BIOLOGICAL INDICATOR INCUBATOR MARKET SIZE ESTIMATES & FORECAST, BY TYPE,
    116. 2032 (USD BILLIONS)
    117. SIZE ESTIMATES & FORECAST, BY APPLICATION, 2019-2032 (USD BILLIONS)
    118. SPAIN BIOLOGICAL INDICATOR INCUBATOR MARKET SIZE ESTIMATES & FORECAST, BY
    119. END USE, 2019-2032 (USD BILLIONS)
    120. MARKET SIZE ESTIMATES & FORECAST, BY CAPACITY, 2019-2032 (USD BILLIONS)
    121. BY REGIONAL, 2019-2032 (USD BILLIONS)
    122. INDICATOR INCUBATOR MARKET SIZE ESTIMATES & FORECAST, BY TYPE, 2019-2032 (USD
    123. BILLIONS)
    124. ESTIMATES & FORECAST, BY APPLICATION, 2019-2032 (USD BILLIONS)
    125. REST OF EUROPE BIOLOGICAL INDICATOR INCUBATOR MARKET SIZE ESTIMATES & FORECAST,
    126. BY END USE, 2019-2032 (USD BILLIONS)
    127. INCUBATOR MARKET SIZE ESTIMATES & FORECAST, BY CAPACITY, 2019-2032 (USD BILLIONS)
    128. & FORECAST, BY REGIONAL, 2019-2032 (USD BILLIONS)
    129. INDICATOR INCUBATOR MARKET SIZE ESTIMATES & FORECAST, BY TYPE, 2019-2032 (USD
    130. BILLIONS)
    131. & FORECAST, BY APPLICATION, 2019-2032 (USD BILLIONS)
    132. INDICATOR INCUBATOR MARKET SIZE ESTIMATES & FORECAST, BY END USE, 2019-2032
    133. (USD BILLIONS)
    134. & FORECAST, BY CAPACITY, 2019-2032 (USD BILLIONS)
    135. INDICATOR INCUBATOR MARKET SIZE ESTIMATES & FORECAST, BY REGIONAL, 2019-2032
    136. (USD BILLIONS)
    137. ESTIMATES & FORECAST, BY TYPE, 2019-2032 (USD BILLIONS)
    138. BIOLOGICAL INDICATOR INCUBATOR MARKET SIZE ESTIMATES & FORECAST, BY APPLICATION,
    139. 2032 (USD BILLIONS)
    140. SIZE ESTIMATES & FORECAST, BY END USE, 2019-2032 (USD BILLIONS)
    141. CHINA BIOLOGICAL INDICATOR INCUBATOR MARKET SIZE ESTIMATES & FORECAST, BY
    142. CAPACITY, 2019-2032 (USD BILLIONS)
    143. MARKET SIZE ESTIMATES & FORECAST, BY REGIONAL, 2019-2032 (USD BILLIONS)
    144. BY TYPE, 2019-2032 (USD BILLIONS)
    145. MARKET SIZE ESTIMATES & FORECAST, BY APPLICATION, 2019-2032 (USD BILLIONS)
    146. BY END USE, 2019-2032 (USD BILLIONS)
    147. INCUBATOR MARKET SIZE ESTIMATES & FORECAST, BY CAPACITY, 2019-2032 (USD BILLIONS)
    148. FORECAST, BY REGIONAL, 2019-2032 (USD BILLIONS)
    149. INDICATOR INCUBATOR MARKET SIZE ESTIMATES & FORECAST, BY TYPE, 2019-2032 (USD
    150. BILLIONS)
    151. & FORECAST, BY APPLICATION, 2019-2032 (USD BILLIONS)
    152. INDICATOR INCUBATOR MARKET SIZE ESTIMATES & FORECAST, BY END USE, 2019-2032
    153. (USD BILLIONS)
    154. ESTIMATES & FORECAST, BY CAPACITY, 2019-2032 (USD BILLIONS)
    155. JAPAN BIOLOGICAL INDICATOR INCUBATOR MARKET SIZE ESTIMATES & FORECAST, BY REGIONAL,
    156. 2032 (USD BILLIONS)
    157. MARKET SIZE ESTIMATES & FORECAST, BY TYPE, 2019-2032 (USD BILLIONS)
    158. SOUTH KOREA BIOLOGICAL INDICATOR INCUBATOR MARKET SIZE ESTIMATES & FORECAST,
    159. BY APPLICATION, 2019-2032 (USD BILLIONS)
    160. INDICATOR INCUBATOR MARKET SIZE ESTIMATES & FORECAST, BY END USE, 2019-2032
    161. (USD BILLIONS)
    162. SIZE ESTIMATES & FORECAST, BY CAPACITY, 2019-2032 (USD BILLIONS)
    163. SOUTH KOREA BIOLOGICAL INDICATOR INCUBATOR MARKET SIZE ESTIMATES & FORECAST,
    164. BY REGIONAL, 2019-2032 (USD BILLIONS)
    165. INCUBATOR MARKET SIZE ESTIMATES & FORECAST, BY TYPE, 2019-2032 (USD BILLIONS)
    166. FORECAST, BY APPLICATION, 2019-2032 (USD BILLIONS)
    167. INDICATOR INCUBATOR MARKET SIZE ESTIMATES & FORECAST, BY END USE, 2019-2032
    168. (USD BILLIONS)
    169. ESTIMATES & FORECAST, BY CAPACITY, 2019-2032 (USD BILLIONS)
    170. MALAYSIA BIOLOGICAL INDICATOR INCUBATOR MARKET SIZE ESTIMATES & FORECAST, BY
    171. REGIONAL, 2019-2032 (USD BILLIONS)
    172. INCUBATOR MARKET SIZE ESTIMATES & FORECAST, BY TYPE, 2019-2032 (USD BILLIONS)
    173. FORECAST, BY APPLICATION, 2019-2032 (USD BILLIONS)
    174. INDICATOR INCUBATOR MARKET SIZE ESTIMATES & FORECAST, BY END USE, 2019-2032
    175. (USD BILLIONS)
    176. ESTIMATES & FORECAST, BY CAPACITY, 2019-2032 (USD BILLIONS)
    177. THAILAND BIOLOGICAL INDICATOR INCUBATOR MARKET SIZE ESTIMATES & FORECAST, BY
    178. REGIONAL, 2019-2032 (USD BILLIONS)
    179. INCUBATOR MARKET SIZE ESTIMATES & FORECAST, BY TYPE, 2019-2032 (USD BILLIONS)
    180. FORECAST, BY APPLICATION, 2019-2032 (USD BILLIONS)
    181. INDICATOR INCUBATOR MARKET SIZE ESTIMATES & FORECAST, BY END USE, 2019-2032
    182. (USD BILLIONS)
    183. ESTIMATES & FORECAST, BY CAPACITY, 2019-2032 (USD BILLIONS)
    184. INDONESIA BIOLOGICAL INDICATOR INCUBATOR MARKET SIZE ESTIMATES & FORECAST, BY
    185. REGIONAL, 2019-2032 (USD BILLIONS)
    186. INCUBATOR MARKET SIZE ESTIMATES & FORECAST, BY TYPE, 2019-2032 (USD BILLIONS)
    187. & FORECAST, BY APPLICATION, 2019-2032 (USD BILLIONS)
    188. APAC BIOLOGICAL INDICATOR INCUBATOR MARKET SIZE ESTIMATES & FORECAST, BY END
    189. USE, 2019-2032 (USD BILLIONS)
    190. INCUBATOR MARKET SIZE ESTIMATES & FORECAST, BY CAPACITY, 2019-2032 (USD BILLIONS)
    191. & FORECAST, BY REGIONAL, 2019-2032 (USD BILLIONS)
    192. BIOLOGICAL INDICATOR INCUBATOR MARKET SIZE ESTIMATES & FORECAST, BY TYPE, 2019-2032
    193. (USD BILLIONS)
    194. SIZE ESTIMATES & FORECAST, BY APPLICATION, 2019-2032 (USD BILLIONS)
    195. SOUTH AMERICA BIOLOGICAL INDICATOR INCUBATOR MARKET SIZE ESTIMATES & FORECAST,
    196. BY END USE, 2019-2032 (USD BILLIONS)
    197. INCUBATOR MARKET SIZE ESTIMATES & FORECAST, BY CAPACITY, 2019-2032 (USD BILLIONS)
    198. & FORECAST, BY REGIONAL, 2019-2032 (USD BILLIONS)
    199. INDICATOR INCUBATOR MARKET SIZE ESTIMATES & FORECAST, BY TYPE, 2019-2032 (USD
    200. BILLIONS)
    201. & FORECAST, BY APPLICATION, 2019-2032 (USD BILLIONS)
    202. BIOLOGICAL INDICATOR INCUBATOR MARKET SIZE ESTIMATES & FORECAST, BY END USE,
    203. 2032 (USD BILLIONS)
    204. MARKET SIZE ESTIMATES & FORECAST, BY CAPACITY, 2019-2032 (USD BILLIONS)
    205. BY REGIONAL, 2019-2032 (USD BILLIONS)
    206. INCUBATOR MARKET SIZE ESTIMATES & FORECAST, BY TYPE, 2019-2032 (USD BILLIONS)
    207. FORECAST, BY APPLICATION, 2019-2032 (USD BILLIONS)
    208. INDICATOR INCUBATOR MARKET SIZE ESTIMATES & FORECAST, BY END USE, 2019-2032
    209. (USD BILLIONS)
    210. ESTIMATES & FORECAST, BY CAPACITY, 2019-2032 (USD BILLIONS)
    211. MEXICO BIOLOGICAL INDICATOR INCUBATOR MARKET SIZE ESTIMATES & FORECAST, BY REGIONAL,
    212. 2032 (USD BILLIONS)
    213. MARKET SIZE ESTIMATES & FORECAST, BY TYPE, 2019-2032 (USD BILLIONS)
    214. ARGENTINA BIOLOGICAL INDICATOR INCUBATOR MARKET SIZE ESTIMATES & FORECAST,
    215. BY APPLICATION, 2019-2032 (USD BILLIONS)
    216. INCUBATOR MARKET SIZE ESTIMATES & FORECAST, BY END USE, 2019-2032 (USD BILLIONS)
    217. & FORECAST, BY CAPACITY, 2019-2032 (USD BILLIONS)
    218. BIOLOGICAL INDICATOR INCUBATOR MARKET SIZE ESTIMATES & FORECAST, BY REGIONAL,
    219. 2032 (USD BILLIONS)
    220. INCUBATOR MARKET SIZE ESTIMATES & FORECAST, BY TYPE, 2019-2032 (USD BILLIONS)
    221. ESTIMATES & FORECAST, BY APPLICATION, 2019-2032 (USD BILLIONS)
    222. REST OF SOUTH AMERICA BIOLOGICAL INDICATOR INCUBATOR MARKET SIZE ESTIMATES &
    223. FORECAST, BY END USE, 2019-2032 (USD BILLIONS)
    224. BIOLOGICAL INDICATOR INCUBATOR MARKET SIZE ESTIMATES & FORECAST, BY CAPACITY,
    225. 2032 (USD BILLIONS)
    226. INCUBATOR MARKET SIZE ESTIMATES & FORECAST, BY REGIONAL, 2019-2032 (USD BILLIONS)
    227. FORECAST, BY TYPE, 2019-2032 (USD BILLIONS)
    228. INCUBATOR MARKET SIZE ESTIMATES & FORECAST, BY APPLICATION, 2019-2032 (USD BILLIONS)
    229. FORECAST, BY END USE, 2019-2032 (USD BILLIONS)
    230. INCUBATOR MARKET SIZE ESTIMATES & FORECAST, BY CAPACITY, 2019-2032 (USD BILLIONS)
    231. FORECAST, BY REGIONAL, 2019-2032 (USD BILLIONS)
    232. INDICATOR INCUBATOR MARKET SIZE ESTIMATES & FORECAST, BY TYPE, 2019-2032 (USD
    233. BILLIONS)
    234. ESTIMATES & FORECAST, BY APPLICATION, 2019-2032 (USD BILLIONS)
    235. GCC COUNTRIES BIOLOGICAL INDICATOR INCUBATOR MARKET SIZE ESTIMATES & FORECAST,
    236. BY END USE, 2019-2032 (USD BILLIONS)
    237. INCUBATOR MARKET SIZE ESTIMATES & FORECAST, BY CAPACITY, 2019-2032 (USD BILLIONS)
    238. & FORECAST, BY REGIONAL, 2019-2032 (USD BILLIONS)
    239. BIOLOGICAL INDICATOR INCUBATOR MARKET SIZE ESTIMATES & FORECAST, BY TYPE, 2019-2032
    240. (USD BILLIONS)
    241. SIZE ESTIMATES & FORECAST, BY APPLICATION, 2019-2032 (USD BILLIONS)
    242. SOUTH AFRICA BIOLOGICAL INDICATOR INCUBATOR MARKET SIZE ESTIMATES & FORECAST,
    243. BY END USE, 2019-2032 (USD BILLIONS)
    244. INCUBATOR MARKET SIZE ESTIMATES & FORECAST, BY CAPACITY, 2019-2032 (USD BILLIONS)
    245. & FORECAST, BY REGIONAL, 2019-2032 (USD BILLIONS)
    246. BIOLOGICAL INDICATOR INCUBATOR MARKET SIZE ESTIMATES & FORECAST, BY TYPE, 2019-2032
    247. (USD BILLIONS)
    248. SIZE ESTIMATES & FORECAST, BY APPLICATION, 2019-2032 (USD BILLIONS)
    249. REST OF MEA BIOLOGICAL INDICATOR INCUBATOR MARKET SIZE ESTIMATES & FORECAST,
    250. BY END USE, 2019-2032 (USD BILLIONS)
    251. INCUBATOR MARKET SIZE ESTIMATES & FORECAST, BY CAPACITY, 2019-2032 (USD BILLIONS)
    252. & FORECAST, BY REGIONAL, 2019-2032 (USD BILLIONS)
    253. DEVELOPMENT/APPROVAL
    254. INDICATOR INCUBATOR MARKET ANALYSIS
    255. MARKET ANALYSIS BY TYPE
    256. ANALYSIS BY APPLICATION
    257. ANALYSIS BY END USE
    258. BY CAPACITY
    259. REGIONAL
    260. TYPE
    261. GERMANY BIOLOGICAL INDICATOR INCUBATOR MARKET ANALYSIS BY TYPE
    262. GERMANY BIOLOGICAL INDICATOR INCUBATOR MARKET ANALYSIS BY APPLICATION
    263. GERMANY BIOLOGICAL INDICATOR INCUBATOR MARKET ANALYSIS BY END USE
    264. GERMANY BIOLOGICAL INDICATOR INCUBATOR MARKET ANALYSIS BY CAPACITY
    265. GERMANY BIOLOGICAL INDICATOR INCUBATOR MARKET ANALYSIS BY REGIONAL
    266. UK BIOLOGICAL INDICATOR INCUBATOR MARKET ANALYSIS BY TYPE
    267. BIOLOGICAL INDICATOR INCUBATOR MARKET ANALYSIS BY APPLICATION
    268. BIOLOGICAL INDICATOR INCUBATOR MARKET ANALYSIS BY END USE
    269. INDICATOR INCUBATOR MARKET ANALYSIS BY CAPACITY
    270. INCUBATOR MARKET ANALYSIS BY REGIONAL
    271. INCUBATOR MARKET ANALYSIS BY TYPE
    272. MARKET ANALYSIS BY APPLICATION
    273. MARKET ANALYSIS BY END USE
    274. MARKET ANALYSIS BY CAPACITY
    275. MARKET ANALYSIS BY REGIONAL
    276. MARKET ANALYSIS BY TYPE
    277. ANALYSIS BY APPLICATION
    278. ANALYSIS BY END USE
    279. ANALYSIS BY CAPACITY
    280. ANALYSIS BY REGIONAL
    281. ANALYSIS BY TYPE
    282. BY APPLICATION
    283. BY END USE
    284. BY CAPACITY
    285. BY REGIONAL
    286. BY TYPE
    287. APPLICATION
    288. BY END USE
    289. BY CAPACITY
    290. BY REGIONAL
    291. ANALYSIS BY TYPE
    292. MARKET ANALYSIS BY APPLICATION
    293. INCUBATOR MARKET ANALYSIS BY END USE
    294. INDICATOR INCUBATOR MARKET ANALYSIS BY CAPACITY
    295. BIOLOGICAL INDICATOR INCUBATOR MARKET ANALYSIS BY REGIONAL
    296. BIOLOGICAL INDICATOR INCUBATOR MARKET ANALYSIS
    297. INDICATOR INCUBATOR MARKET ANALYSIS BY TYPE
    298. INCUBATOR MARKET ANALYSIS BY APPLICATION
    299. INCUBATOR MARKET ANALYSIS BY END USE
    300. INCUBATOR MARKET ANALYSIS BY CAPACITY
    301. INCUBATOR MARKET ANALYSIS BY REGIONAL
    302. INCUBATOR MARKET ANALYSIS BY TYPE
    303. MARKET ANALYSIS BY APPLICATION
    304. MARKET ANALYSIS BY END USE
    305. MARKET ANALYSIS BY CAPACITY
    306. MARKET ANALYSIS BY REGIONAL
    307. MARKET ANALYSIS BY TYPE
    308. ANALYSIS BY APPLICATION
    309. ANALYSIS BY END USE
    310. ANALYSIS BY CAPACITY
    311. ANALYSIS BY REGIONAL
    312. MARKET ANALYSIS BY TYPE
    313. MARKET ANALYSIS BY APPLICATION
    314. INCUBATOR MARKET ANALYSIS BY END USE
    315. INCUBATOR MARKET ANALYSIS BY CAPACITY
    316. INCUBATOR MARKET ANALYSIS BY REGIONAL
    317. INCUBATOR MARKET ANALYSIS BY TYPE
    318. INCUBATOR MARKET ANALYSIS BY APPLICATION
    319. INCUBATOR MARKET ANALYSIS BY END USE
    320. INCUBATOR MARKET ANALYSIS BY CAPACITY
    321. INCUBATOR MARKET ANALYSIS BY REGIONAL
    322. INCUBATOR MARKET ANALYSIS BY TYPE
    323. INCUBATOR MARKET ANALYSIS BY APPLICATION
    324. INCUBATOR MARKET ANALYSIS BY END USE
    325. INCUBATOR MARKET ANALYSIS BY CAPACITY
    326. INCUBATOR MARKET ANALYSIS BY REGIONAL
    327. INCUBATOR MARKET ANALYSIS BY TYPE
    328. INCUBATOR MARKET ANALYSIS BY APPLICATION
    329. INCUBATOR MARKET ANALYSIS BY END USE
    330. INCUBATOR MARKET ANALYSIS BY CAPACITY
    331. INCUBATOR MARKET ANALYSIS BY REGIONAL
    332. INCUBATOR MARKET ANALYSIS BY TYPE
    333. INCUBATOR MARKET ANALYSIS BY APPLICATION
    334. INDICATOR INCUBATOR MARKET ANALYSIS BY END USE
    335. INDICATOR INCUBATOR MARKET ANALYSIS BY CAPACITY
    336. INDICATOR INCUBATOR MARKET ANALYSIS BY REGIONAL
    337. INDICATOR INCUBATOR MARKET ANALYSIS
    338. INCUBATOR MARKET ANALYSIS BY TYPE
    339. MARKET ANALYSIS BY APPLICATION
    340. MARKET ANALYSIS BY END USE
    341. MARKET ANALYSIS BY CAPACITY
    342. MARKET ANALYSIS BY REGIONAL
    343. MARKET ANALYSIS BY TYPE
    344. ANALYSIS BY APPLICATION
    345. ANALYSIS BY END USE
    346. ANALYSIS BY CAPACITY
    347. ANALYSIS BY REGIONAL
    348. MARKET ANALYSIS BY TYPE
    349. MARKET ANALYSIS BY APPLICATION
    350. INCUBATOR MARKET ANALYSIS BY END USE
    351. INCUBATOR MARKET ANALYSIS BY CAPACITY
    352. INCUBATOR MARKET ANALYSIS BY REGIONAL
    353. INDICATOR INCUBATOR MARKET ANALYSIS BY TYPE
    354. BIOLOGICAL INDICATOR INCUBATOR MARKET ANALYSIS BY APPLICATION
    355. REST OF SOUTH AMERICA BIOLOGICAL INDICATOR INCUBATOR MARKET ANALYSIS BY END USE
    356. BY CAPACITY
    357. MARKET ANALYSIS BY REGIONAL
    358. MARKET ANALYSIS
    359. ANALYSIS BY TYPE
    360. MARKET ANALYSIS BY APPLICATION
    361. INCUBATOR MARKET ANALYSIS BY END USE
    362. INDICATOR INCUBATOR MARKET ANALYSIS BY CAPACITY
    363. BIOLOGICAL INDICATOR INCUBATOR MARKET ANALYSIS BY REGIONAL
    364. AFRICA BIOLOGICAL INDICATOR INCUBATOR MARKET ANALYSIS BY TYPE
    365. SOUTH AFRICA BIOLOGICAL INDICATOR INCUBATOR MARKET ANALYSIS BY APPLICATION
    366. SOUTH AFRICA BIOLOGICAL INDICATOR INCUBATOR MARKET ANALYSIS BY END USE
    367. REGIONAL
    368. BY TYPE
    369. BY APPLICATION
    370. ANALYSIS BY END USE
    371. MARKET ANALYSIS BY CAPACITY
    372. MARKET ANALYSIS BY REGIONAL
    373. INDICATOR INCUBATOR MARKET
    374. DRO ANALYSIS OF BIOLOGICAL INDICATOR INCUBATOR MARKET
    375. IMPACT ANALYSIS: BIOLOGICAL INDICATOR INCUBATOR MARKET
    376. IMPACT ANALYSIS: BIOLOGICAL INDICATOR INCUBATOR MARKET
    377. / VALUE CHAIN: BIOLOGICAL INDICATOR INCUBATOR MARKET
    378. INDICATOR INCUBATOR MARKET, BY TYPE, 2024 (% SHARE)
    379. INDICATOR INCUBATOR MARKET, BY TYPE, 2019 TO 2032 (USD Billions)
    380. BIOLOGICAL INDICATOR INCUBATOR MARKET, BY APPLICATION, 2024 (% SHARE)
    381. BIOLOGICAL INDICATOR INCUBATOR MARKET, BY APPLICATION, 2019 TO 2032 (USD Billions)
    382. (USD Billions)
    383. (% SHARE)
    384. TO 2032 (USD Billions)
    385. BY REGIONAL, 2024 (% SHARE)
    386. BY REGIONAL, 2019 TO 2032 (USD Billions)
    387. COMPETITORS

    Biological Indicator Incubator Market Segmentation

    Market Segmentation Overview

    • Detailed segmentation data will be available in the full report
    • Comprehensive analysis by multiple parameters
    • Regional and country-level breakdowns
    • Market size forecasts by segment
    Report Infographic
    Free Sample Request

    Kindly complete the form below to receive a free sample of this Report

    Customer Strories

    “I am very pleased with how market segments have been defined in a relevant way for my purposes (such as "Portable Freezers & refrigerators" and "last-mile"). In general the report is well structured. Thanks very much for your efforts.”

    Victoria Milne Founder
    Case Study

    Chemicals and Materials