• Cat-intel
  • MedIntelliX
  • Resources
  • About Us
  • Request Free Sample ×

    Kindly complete the form below to receive a free sample of this Report

    Leading companies partner with us for data-driven Insights

    clients tt-cursor

    Biodegradable Tableware Market

    ID: MRFR/CR/7157-HCR
    128 Pages
    Snehal Singh
    September 2025

    Biodegradable Tableware Market Research Report Information By Product Type (Plates, Bowls, Cups, Cutlery, and Others), By Material Type (Silk, Paper, Bioplastic, Wood, and Others), By Distribution Channel (Store-Based, and Non-Store-Based), And By Region (North America, Europe, Asia-Pacific, And Rest Of The World) –Market Forecast Till 2032

    Share:
    Download PDF ×

    We do not share your information with anyone. However, we may send you emails based on your report interest from time to time. You may contact us at any time to opt-out.

    Biodegradable Tableware Market Research Report - Forecast till 2032 Infographic
    Purchase Options
    $ 4,950.0
    $ 5,950.0
    $ 7,250.0
    Table of Contents

    Biodegradable Tableware Market Summary

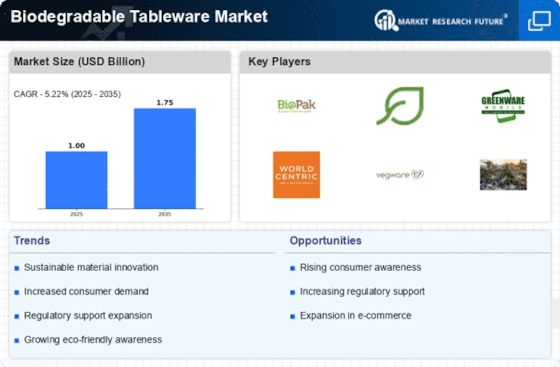
    As per Market Research Future Analysis, the Global Biodegradable Tableware Market was valued at USD 0.95 billion in 2023 and is projected to reach USD 1.51 billion by 2032, growing at a CAGR of 5.2% from 2024 to 2032. The market is driven by increasing industrialization, awareness of plastic's negative impacts, and government regulations against non-biodegradable products. The demand for biodegradable tableware is rising due to its environmental benefits and hygiene standards, particularly in healthcare settings. The market is characterized by a shift towards eco-friendly materials such as rice husk, coconut coir, and sugarcane bagasse, with significant growth in the cutlery segment and bioplastic material type.

    Key Market Trends & Highlights

    Key trends driving the biodegradable tableware market include environmental awareness and regulatory support.

    • Market size in 2023: USD 0.95 billion; projected to reach USD 1.51 billion by 2032.
    • CAGR from 2024 to 2032: 5.2%; driven by rising concerns over plastic pollution.
    • Plates segment held the majority market share in 2022; cutlery is the fastest-growing category.
    • Bioplastic dominated the material type in 2022; wood is the fastest-growing segment.

    Market Size & Forecast

    2023 Market Size USD 0.95 Billion
    2024 Market Size USD 1.00 Billion
    2032 Market Size USD 1.51 Billion
    CAGR (2024-2032) 5.2%

    Major Players

    Key players include Huhtamäki Oyj, Dart Container Corporation, Georgia-Pacific LLC, Pactiv LLC, and Vegware.

    Biodegradable Tableware Market Trends

    Increasing adoption of non-toxic and petroleum-free products to boost the market growth

    Expanding market demand is mostly due to growing worries about the harmful impacts of non-biodegradable plastics. Moreover, utilizing biodegradable silverware contributes to a decrease in ocean pollution. For example, in 2019 the US monthly magazine National Geographic claimed that because to the incapacity of single-use plastic to break down, 18 billion pounds of all varieties of plastic were polluting the ocean. In addition, the demand for biodegradable dinnerware is expected to increase in the upcoming years due to strict restrictions implemented by various governments worldwide that forbid the use of non-biodegradable plastics.

    Because biodegradable tableware is single-use and guarantees a high quality of hygiene, it is crucial for preventing infections and the transmission of illnesses. This is especially true in hospitals and other locations where there is a significant danger of contamination.

    Biodegradable tableware is made from residual materials like rice husk, coconut coir, and sugarcane bagasse, and is environmentally friendly. Growing public awareness of environmental issues is driving the global market for biodegradable tableware. The proliferation of recently founded green businesses worldwide is expanding the potential for creating and using biodegradable tableware. Growing public awareness of the negative effects of plastic, especially on birds and aquatic life, is driving the industry's growth. The ease of disposable plates is paired with the benefit of biodegradable tableware, which produces very little to no environmental damage.

    It has raised the compound annual growth rate of the biodegradable tableware market worldwide in recent years.

    Nonetheless, chains of upscale hotels, caterers, and quick service restaurants (QSRs) are aware of the advantages of utilizing eco-friendly disposable dinnerware. In an attempt to expand the market penetration of their products, disposable tableware producers have partnered with several QSR and hotel & restaurant chains to use compostable or biodegradable dinnerware. Furthermore, several companies, such as Edibles by Jack and Edible Pro, manufacture silverware and spoons, forks, and chopsticks that are intended for single use only.

    The increasing consumer awareness regarding environmental sustainability is driving a notable shift towards biodegradable tableware, reflecting a broader commitment to reducing plastic waste and promoting eco-friendly alternatives.

    U.S. Environmental Protection Agency

    Biodegradable Tableware Market Drivers

    Market Growth Charts

    Rising Environmental Awareness

    The increasing global consciousness regarding environmental sustainability drives the Global Biodegradable Tableware Market Industry. Consumers are becoming more aware of the detrimental effects of plastic waste on ecosystems, prompting a shift towards biodegradable alternatives. This trend is evident as more individuals and businesses seek eco-friendly products, leading to a projected market value of 1 USD Billion in 2024. As awareness continues to grow, the demand for biodegradable tableware is likely to rise, influencing manufacturers to innovate and expand their product lines to meet consumer expectations.

    Shifts in Consumer Preferences

    Changing consumer preferences towards sustainable products are reshaping the Global Biodegradable Tableware Market Industry. A growing segment of the population is prioritizing eco-friendly options, leading to increased demand for biodegradable tableware in various sectors, including food service and catering. This shift is reflected in the rising number of restaurants and events opting for biodegradable products over traditional plastic. As consumers continue to favor sustainable choices, the market is expected to expand, aligning with broader trends in environmental responsibility and ethical consumption.

    Growth of the Food Delivery Sector

    The expansion of the food delivery sector plays a pivotal role in the Global Biodegradable Tableware Market Industry. With the rise of online food ordering, there is a heightened need for disposable tableware that aligns with sustainability goals. Many food delivery services are now opting for biodegradable packaging to meet consumer demand for environmentally friendly options. This trend is likely to drive market growth, as the food delivery industry continues to flourish, further solidifying the position of biodegradable tableware as a preferred choice among consumers.

    Government Regulations and Policies

    Government initiatives aimed at reducing plastic waste significantly influence the Global Biodegradable Tableware Market Industry. Many countries are implementing stringent regulations to limit single-use plastics, thereby encouraging the adoption of biodegradable options. For instance, various jurisdictions have introduced bans on plastic straws and utensils, which has led to a surge in demand for biodegradable alternatives. This regulatory environment is expected to contribute to the market's growth, with projections indicating a market value of 1.76 USD Billion by 2035, as businesses adapt to comply with new policies.

    Technological Advancements in Production

    Technological innovations in the production of biodegradable materials are enhancing the feasibility and appeal of the Global Biodegradable Tableware Market Industry. Advances in manufacturing processes allow for the creation of more durable and cost-effective biodegradable products, which can compete with traditional plastic tableware. For example, the development of plant-based materials and improved composting techniques has made biodegradable tableware more accessible to consumers. As these technologies evolve, they are likely to stimulate market growth, contributing to an anticipated CAGR of 5.26% from 2025 to 2035.

    Market Segment Insights

    Biodegradable Tableware Market Segment Insights

    Biodegradable Tableware Market Segment Insights

    Biodegradable Tableware Product Type Insights

    The biodegradable tableware market segmentation, based on product type, includes plates, bowls, cups, cutlery, and others. The plates segment held the majority share in 2022 of the biodegradable tableware market revenue. This is primarily due to the availability of different types of designs. Furthermore, disposable paper plates are safe and convenient compared to reusable plates that must be washed and dried after each use. However, cutlery is the fastest-growing category over the forecast period as they are environmentally gentle and biodegradable.

    Biodegradable Tableware Material Type Insights

    The biodegradable tableware market segmentation, based on material type, includes paper, bioplastic, wood, and others. The bioplastic segment dominated the market in 2022 and is projected to be the faster-growing segment during the forecast period, 2023-2030. Plastic biodegradable tableware is projected to grow significantly over the coming years due to the high adoption of biodegradable plastic tableware by online food retail chains and stringent government initiatives to promote the use of biodegradable tableware to avoid the risk of environmental pollution positively impact the market growth.

    However, wood is the fastest-growing category over the forecast period due to rising awareness regarding wood tableware and the benefits of environmentally friendly tableware.

    Biodegradable Tableware Distribution Channel Insights

    The biodegradable tableware market data has been bifurcated by distribution channels into store-based and non-store-based. The residential segment dominated the market in 2022 and is projected to be the faster-growing segment during the forecast period, 2022-2030.Store-based held the largest segment share in 2022, as offline stores and roadside vendors deal with different biodegradable tableware cheaply. Users find it easy to purchase instantly and when required. However, non-store-based is the fastest-growing category due to increasing internet penetration, facilitating sales demand for such products. The varied collections that online stores sell surge the demand for such products.

    Figure 1: Biodegradable Tableware Market, by Distribution Channel, 2022 & 2030(USD Billion)

    Source: Secondary Research, Primary Research, Market Research Future Database and Analyst Review

    Get more detailed insights about Biodegradable Tableware Market Research Report - Forecast till 2032

    Regional Insights

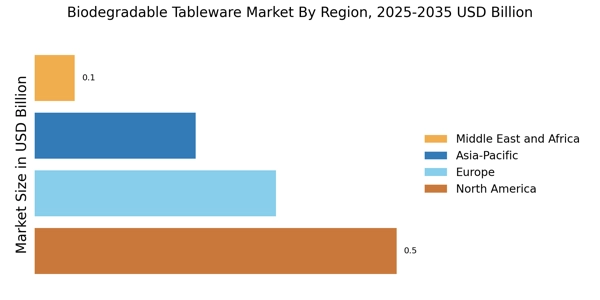
    By Region, the study provides market insights into North America, Europe, Asia-Pacific and the Rest of the World. The North America biodegradable tableware market accounted for USD 0.41billion in 2022 and is expected to exhibit a significant CAGR growth during the study period. This is attributed to rising concerns about the ill effects of plastic tableware, rising emphasis on non-toxic and petroleum-free products, stringent rules & regulations on using single-use plastic products, rapid acceptance of takeaways and online food services and increasing preference for environment-friendly tableware in this region.

    Further, the US biodegradable tableware market held the largest market share, and the Canada biodegradable tableware market was the fastest-growing market in the North America region.

    Further, the major countries studied in the market report are: The U.S, Canada, Germany, France, the UK, Italy, Spain, China, Japan, India, Australia, South Korea, and Brazil.

    Figure 2: BIODEGRADABLE TABLEWARE MARKET SHARE BY REGION 2022 (%)BIODEGRADABLE TABLEWARE MARKET SHARE BY REGION 2022

    Source: Secondary Research, Primary Research, Market Research Future Database and Analyst Review

    Europe biodegradable tableware market accounts for the second-largest market share owing to consumers' awareness and inclination towards buying products that offer environmental benefits. Demand from the food service industry significantly influences the biodegradable disposable tableware market. Further, the Germany biodegradable tableware market held the largest market share, and the UK biodegradable tableware market was the fastest-growing market in the European region.

    The Asia-Pacific biodegradable tableware market is expected to grow at the fastest CAGR from 2022 to 2030. This is due to the rising demand for packaged foods, and online food delivery is anticipated to increase demand for biodegradable disposable tableware in the Asia-Pacific. Moreover, China biodegradable tableware market held the largest market share, and the India biodegradable tableware market was the fastest-growing market in the Asia-Pacific region.

    Key Players and Competitive Insights

    Major market players are spending a lot of money on R&D to increase their product lines, which will help the biodegradable tableware market grow even more. Market participants are also taking various strategic initiatives to grow their worldwide footprint, with key market developments such as new product launches, contractual agreements, mergers and acquisitions, increased investments, and collaboration with other organizations. Competitors in the biodegradable tableware industry must offer cost-effective items to expand and survive in an increasingly competitive and rising market environment.

    Manufacturing locally to reduce operating costs is one of the primary business strategies manufacturers adopt in the biodegradable tableware industry to benefit clients and expand the market sector. The biodegradable tableware market major player such as Huhtamäki Oyj (Finland), Dart Container Corporation (US), Georgia-Pacific LLC (US), and others are working on expanding the market demand by investing in research and development activities.

    Zomato is an Indian multinational restaurant aggregator and food delivery company founded by Deepinder Goyal and Pankaj Chaddah in 2008. Zomato provides information, menus, user reviews of restaurants, and food delivery options from partner restaurants in more than 1,000 Indian cities as of 2022. In June 2022, Zomato announced its acquisition of Blinkit for US$568 million in an all-stock deal. The acquisition was done on August 10, 2022.

    Also, Georgia-Pacific LLC is an American pulp and paper company based in Atlanta, Georgia. It is one of the world's largest manufacturers and distributors of tissue, pulp, paper, toilet and paper towel dispensers, packaging, building products and related chemicals. In August 2022, Georgia Pacific, a leading maker of tissue, pulp, packaging, and building products, expanded its operations and business in Clarendon County to cater to the rising demand of customers and increase its manufacturing capacity.

    Key Companies in the Biodegradable Tableware Market market include

    Industry Developments

    July 2021:  Defence Research and Development Organization (DRDO), an Indian government agency, launched biodegradable packaging products from natural and plant-based food-grade materials to eliminate single-use plastic.

    In 2023, The Kerala Biodegradable Paper Products makers Association (KBPPMA), a state-wide umbrella association of biodegradable paper makers, was established. Nebu Thomas, the proprietor of Anna Polymers in Alappuzha, came up with the idea for biodegradable paper goods. Nebu, who had seen similar biodegradable paper products in other wealthy countries, researched the concept for several years.

    April 24, 2024:Georgia's Albany, GeorgiaAlbany Lumber in Pacific has produced its one billionth boardfoot. Four years after the plant debuted in 2020, on April 18, the record-setting board came off the production line. The mill uses an internal database to track production, providing real-time volume information to workers and helping them identify significant milestones. In 2018, work on the 320,000-square-foot, $150 million, state-of-the-art facility got underway. At the moment, Albany Lumber, one of the two biggest mills in Georgia, has about 150 full-time workers. The Albany Area Chamber of Commerce also named the mill "Star Business of the Week" recently.

    Future Outlook

    Biodegradable Tableware Market Future Outlook

    The Global Biodegradable Tableware Market is projected to grow at a 5.26% CAGR from 2024 to 2035, driven by increasing environmental awareness and regulatory support.

    New opportunities lie in:

    • Develop innovative materials that enhance biodegradability and performance.
    • Expand distribution channels to include e-commerce platforms for wider reach.
    • Collaborate with food service providers to create customized biodegradable solutions.

    By 2035, the market is expected to achieve substantial growth, reflecting heightened consumer demand for sustainable alternatives.

    Market Segmentation

    Biodegradable Tableware Regional Outlook

    • US
    • Canada

    Biodegradable Tableware Product Type Outlook

    • Plates
    • Bowls
    • Cups
    • Cutlery
    • Others

    Biodegradable Tableware Material Type Outlook

    • Paper
    • Bioplastic
    • Wood
    • Others

    Biodegradable Tableware Distribution Channel Outlook

    • Store-Based
    • Non-Store-Based

    Report Scope

    Report Attribute/Metric Details
    Market Size 2023 USD 0.95 billion
    Market Size 2024 USD 1.00 billion
    Market Size 2032 USD 1.51 billion
    Compound Annual Growth Rate (CAGR) 5.2% (2024-2032)
    Base Year 2023
    Market Forecast Period 2024-2032
    Historical Data 2019- 2022
    Market Forecast Units Value (USD Billion)
    Report Coverage Revenue Forecast, Market Competitive Landscape, Growth Factors, and Trends
    Segments Covered Product Type, Material Type, Distribution Channel and Region
    Geographies Covered North America, Europe, AsiaPacific, and the Rest of the World
    Countries Covered The U.S, Canada, Germany, France, the UK, Italy, Spain, China, Japan, India, Australia, South Korea, and Brazil
    Key Companies Profiled Huhtamäki Oyj (Finland), Dart Container Corporation (US), Georgia-Pacific LLC (US), Lollicup USA Inc. (US), Solia, Inc. (US), Natural Tableware, (Netherlands), Reynolds Consumer Products LLC (US), Pactiv LLC (US), Eco Guardian (Canada), and Genpak, LLC (US)
    Key Market Opportunities Rising environment consciousness. Government initiatives.
    Key Market Dynamics Demand for non-toxic, compostable, and environmentally friendly tableware.

    Market Highlights

    Author
    Snehal Singh
    Assistant Manager - Research

    High acumen in analyzing complex macro & micro markets with more than 6 years of work experience in the field of market research. By implementing her analytical skills in forecasting and estimation into market research reports, she has expertise in Packaging, Construction, and Equipment domains. She handles a team size of 20-25 resources and ensures smooth running of the projects, associated marketing activities, and client servicing.

    Leave a Comment

    FAQs

    How much is the biodegradable tableware market?

    The biodegradable tableware market size was valued at USD 1.51 Billion in 2032.

    What is the growth rate of the biodegradable tableware market?

    The market is projected to grow at a CAGR of 5.2% during the forecast period, 2024-2032.

    Which region held the largest market share in the biodegradable tableware market?

    North America had the largest share of the market

    Who are the key players in the biodegradable tableware market?

    The key players in the market are Huhtamäki Oyj (Finland), Dart Container Corporation (US), Georgia-Pacific LLC (US), Lollicup USA Inc. (US), Solia, Inc. (US), Natural Tableware (Netherlands), and Reynolds Consumer Products LLC (US).

    Which product type led the biodegradable tableware market?

    The plates category dominated the market in 2023.

    Which material type had the largest market share in the biodegradable tableware market?

    Bioplastic had the largest share in the market.

    Which distribution channel had the largest market share in the biodegradable tableware market?

    The store-based had the largest share in the market.

    1. 'Table of
    2. Contents
    3. EXECUTIVE SUMMARY
    4. MARKET INTRODUCTION
    5. Market Definition
    6. Scope of the Study
    7. Research Objectives
    8. Assumptions & Limitations
      1. Market Structure
    9. MARKET RESEARCH METHODOLOGY
      1. Research Process
      2. Secondary Research
      3. Primary Research
      4. Forecast Model
    10. MARKET LANDSCAPE
      1. Supply Chain Analysis
        1. Raw Material Suppliers
        2. Manufacturers/Producers
        3. Distributors/Retailers/Wholesalers/E-Commerce
        4. Distribution Channels
      2. Porter’s Five
    11. Forces Analysis
    12. Threat of New Entrants
    13. Bargaining Power of Buyers
      1. Bargaining Power of Suppliers
        1. Threat of Substitutes
        2. Internal Rivalry
    14. MARKET DYNAMICS OF THE GLOBAL BIODEGRADABLE TABLEWARE
    15. MARKET
    16. Introduction
    17. Drivers
    18. Restraints
    19. Opportunities
    20. Challenges
    21. GLOBAL BIODEGRADABLE TABLEWARE MARKET, BY PRODUCT TYPE
      1. Introduction
        1. Market Estimates & Forecast, by Product
    22. Type, 2024–2032
    23. Market Estimates & Forecast, by Region, 2024–2032
      1. Plates
        1. Plates: Market Estimates & Forecast, 2024–2032
        2. Plates: Market
    24. Estimates & Forecast, by Region, 2024–2032
      1. Bowls
        1. Bowls: Market Estimates & Forecast, 2024–2032
        2. Bowls: Market
    25. Estimates & Forecast, by Region, 2024–2032
      1. Cups
        1. Cups: Market Estimates & Forecast, 2024–2032
        2. Cups: Market Estimates
    26. & Forecast, by Region, 2024–2032
      1. Cutlery
        1. Cutlery: Market Estimates & Forecast,
    27. Cutlery: Market Estimates & Forecast, by Region, 2024–2032
      1. Others
        1. Others: Market Estimates
    28. & Forecast, 2024–2032
      1. Others: Market Estimates & Forecast, by Region, 2024–2032
    29. GLOBAL BIODEGRADABLE
      1. Introduction
        1. Market Estimates & Forecast, by Material
    30. Type, 2024–2032
    31. Market Estimates & Forecast, by Region, 2024–2032
      1. Paper
        1. Paper: Market Estimates & Forecast, 2024–2032
        2. Paper: Market
    32. Estimates & Forecast, by Region, 2024–2032
      1. Bioplastic
        1. Bioplastic: Market Estimates & Forecast,
    33. Bioplastic: Market Estimates & Forecast, by Region, 2024–2032
      1. Wood
        1. Wood: Market Estimates
    34. & Forecast, 2024–2032
      1. Wood: Market Estimates & Forecast, by Region, 2024–2032
      2. Others
        1. Others: Market
    35. Estimates & Forecast, 2024–2032
      1. Others: Market Estimates & Forecast, by
    36. Region, 2024–2032
    37. GLOBAL BIODEGRADABLE TABLEWARE MARKET, BY DISTRIBUTION CHANNEL
      1. Introduction
        1. Market Estimates
    38. & Forecast, by Distribution Channel, 2024–2032
      1. Market Estimates & Forecast, by Region,
    39. Store-Based
    40. Store-Based: Market Estimates & Forecast, 2024–2032
      1. Store-Based: Market Estimates
    41. & Forecast, by Region, 2024–2032
      1. Supermarkets & Hypermarkets
        1. Supermarkets
    42. & Hypermarkets: Market Estimates & Forecast, 2024–2032
      1. Supermarkets & Hypermarkets:
    43. Market Estimates & Forecast, by Region, 2024–2032
      1. Convenience Stores
        1. Convenience Stores: Market Estimates &
    44. Forecast, 2024–2032
      1. Convenience Stores: Market Estimates & Forecast, by Region,
    45. Others
    46. Others: Market Estimates & Forecast, 2024–2032
      1. Others: Market Estimates & Forecast,
    47. by Region, 2024–2032
      1. Non-Store-Based
        1. Non-Store-Based: Market Estimates & Forecast, 2024–2032
        2. Non-Store-Based:
    48. Market Estimates & Forecast, by Region, 2024–2032
    49. GLOBAL BIODEGRADABLE TABLEWARE MARKET, BY REGION
      1. Introduction
      2. North America
        1. Market Estimates
    50. & Forecast, 2024–2032
      1. Market Estimates & Forecast, by Product Type, 2024–2032
        1. Market Estimates
    51. & Forecast, by Material Type, 2024–2032
      1. Market Estimates & Forecast, by Distribution
    52. Channel, 2024–2032
      1. Market Estimates & Forecast, by Country, 2024–2032
        1. US
    53. Forecast, by Product Type, 2024–2032
      1. Market Estimates & Forecast, by Material
    54. Type, 2024–2032
    55. Market Estimates & Forecast, by Distribution Channel, 2024–2032
      1. Canada
        1. Market Estimates
    56. & Forecast, by Product Type, 2024–2032
      1. Market Estimates & Forecast, by Material
    57. Type, 2024–2032
    58. Market Estimates & Forecast, by Distribution Channel, 2024–2032
      1. Mexico
        1. Market Estimates
    59. & Forecast, by Product Type, 2024–2032
      1. Market Estimates & Forecast, by Material
    60. Type, 2024–2032
    61. Market Estimates & Forecast, by Distribution Channel, 2024–2032
      1. Europe
        1. Market Estimates
    62. & Forecast, 2024–2032
      1. Market Estimates & Forecast, by Product Type, 2024–2032
        1. Market Estimates
    63. & Forecast, by Material Type, 2024–2032
      1. Market Estimates & Forecast, by Distribution
    64. Channel, 2024–2032
      1. Market Estimates & Forecast, by Country, 2024–2032
        1. Germany
    65. & Forecast, by Product Type, 2024–2032
      1. Market Estimates & Forecast, by Material
    66. Type, 2024–2032
    67. Market Estimates & Forecast, by Distribution Channel, 2024–2032
      1. UK
        1. Market Estimates &
    68. Forecast, by Product Type, 2024–2032
      1. Market Estimates & Forecast, by Material
    69. Type, 2024–2032
    70. Market Estimates & Forecast, by Distribution Channel, 2024–2032
      1. France
        1. Market Estimates
    71. & Forecast, by Product Type, 2024–2032
      1. Market Estimates & Forecast, by Material
    72. Type, 2024–2032
    73. Market Estimates & Forecast, by Distribution Channel, 2024–2032
      1. Spain
        1. Market Estimates
    74. & Forecast, by Product Type, 2024–2032
      1. Market Estimates & Forecast, by Material
    75. Type, 2024–2032
    76. Market Estimates & Forecast, by Distribution Channel, 2024–2032
      1. Italy
        1. Market Estimates
    77. & Forecast, by Product Type, 2024–2032
      1. Market Estimates & Forecast, by Material
    78. Type, 2024–2032
    79. Market Estimates & Forecast, by Distribution Channel, 2024–2032
      1. Rest of Europe
        1. Market Estimates
    80. & Forecast, by Product Type, 2024–2032
      1. Market Estimates & Forecast, by Material
    81. Type, 2024–2032
    82. Market Estimates & Forecast, by Distribution Channel, 2024–2032
      1. Asia-Pacific
        1. Market Estimates
    83. & Forecast, 2024–2032
      1. Market Estimates & Forecast, by Product Type, 2024–2032
        1. Market Estimates
    84. & Forecast, by Material Type, 2024–2032
      1. Market Estimates & Forecast, by Distribution
    85. Channel, 2024–2032
      1. Market Estimates & Forecast, by Country, 2024–2032
        1. China
    86. & Forecast, by Product Type, 2024–2032
      1. Market Estimates & Forecast, by Material
    87. Type, 2024–2032
    88. Market Estimates & Forecast, by Distribution Channel, 2024–2032
      1. Japan
        1. Market Estimates
    89. & Forecast, by Product Type, 2024–2032
      1. Market Estimates & Forecast, by Material
    90. Type, 2024–2032
    91. Market Estimates & Forecast, by Distribution Channel, 2024–2032
      1. India
        1. Market Estimates
    92. & Forecast, by Product Type, 2024–2032
      1. Market Estimates & Forecast, by Material
    93. Type, 2024–2032
    94. Market Estimates & Forecast, by Distribution Channel, 2024–2032
      1. Australia &
    95. New Zealand
    96. Market Estimates & Forecast, by Product Type, 2024–2032
      1. Market Estimates &
    97. Forecast, by Material Type, 2024–2032
      1. Market Estimates & Forecast, by Distribution
    98. Channel, 2024–2032
      1. Rest of Asia-Pacific
        1. Market Estimates & Forecast, by Product
    99. Type, 2024–2032
    100. Market Estimates & Forecast, by Material Type, 2024–2032
      1. Market Estimates &
    101. Forecast, by Distribution Channel, 2024–2032
      1. Rest of the World
        1. Market Estimates & Forecast, 2024–2032
        2. Market Estimates
    102. & Forecast, by Product Type, 2024–2032
      1. Market Estimates & Forecast, by Material
    103. Type, 2024–2032
    104. Market Estimates & Forecast, by Distribution Channel, 2024–2032
      1. Market Estimates
    105. & Forecast, by Region, 2024–2032
      1. South America
        1. Market Estimates & Forecast, by Product
    106. Type, 2024–2032
    107. Market Estimates & Forecast, by Material Type, 2024–2032
      1. Market Estimates &
    108. Forecast, by Distribution Channel, 2024–2032
      1. Middle East
        1. Market Estimates & Forecast, by Product
    109. Type, 2024–2032
    110. Market Estimates & Forecast, by Material Type, 2024–2032
      1. Market Estimates &
    111. Forecast, by Distribution Channel, 2024–2032
      1. Africa
        1. Market Estimates & Forecast, by Product
    112. Type, 2024–2032
    113. Market Estimates & Forecast, by Material Type, 2024–2032
      1. Market Estimates &
    114. Forecast, by Distribution Channel, 2024–2032
    115. COMPETITIVE LANDSCAPE
      1. Introduction
      2. Market Strategy
      3. Key Development Analysis
    116. (Expansions/Mergers & Acquisitions/Joint
    117. Ventures/New Product Developments/Agreements/Investments)
    118. COMPANY PROFILES
      1. Huhtamäki Oyj
        1. Company Overview
        2. Financial Updates
        3. Product/Business Segment Overview
        4. Strategies
        5. Key Developments
        6. SWOT Analysis
      2. Dart Container
    119. Corporation
    120. Company Overview
    121. Financial Updates
    122. Product/Business Segment Overview
      1. Strategies
        1. Key Developments
        2. SWOT Analysis
      2. Georgia-Pacific LLC
      3. Company Overview
        1. Financial Updates
        2. Product/Business Segment Overview
        3. Strategies
        4. Key Developments
        5. SWOT Analysis
      4. Lollicup USA Inc.
        1. Company Overview
        2. Financial Updates
        3. Product/Business
    123. Segment Overview
    124. Strategies
    125. Key Developments
    126. SWOT Analysis
    127. Solia, Inc.
    128. Company Overview
    129. Financial Updates
    130. Product/Business Segment Overview
      1. Strategies
        1. Key Developments
        2. SWOT Analysis
      2. Natural Tableware
        1. Company Overview
        2. Financial Updates
        3. Product/Business Segment Overview
        4. Strategies
        5. Key Developments
        6. SWOT Analysis
      3. Reynolds Consumer
    131. Products LLC
    132. Company Overview
    133. Financial Updates
    134. Product/Business Segment Overview
      1. Strategies
        1. Key Developments
        2. SWOT Analysis
      2. Pactiv LLC
        1. Company Overview
        2. Financial Updates
        3. Product/Business Segment Overview
        4. Strategies
        5. Key Developments
        6. SWOT Analysis
      3. Eco Guardian
        1. Company Overview
        2. Financial Updates
        3. Product/Business
    135. Segment Overview
    136. Strategies
    137. Key Developments
    138. SWOT Analysis
    139. Genpak, LLC
    140. Company Overview
    141. Financial Updates
    142. Product/Business Segment Overview
      1. Strategies
        1. Key Developments
        2. SWOT Analysis
      2. Biotrem
        1. Company Overview
        2. Financial Updates
        3. Product/Business Segment Overview
        4. Strategies
        5. Key Developments
        6. SWOT Analysis
      3. Better Earth LLC
        1. Company Overview
        2. Financial Updates
        3. Product/Business
    143. Segment Overview
    144. Strategies
    145. Key Developments
    146. SWOT Analysis
    147. Vegware
    148. Company Overview
    149. Financial Updates
    150. Product/Business Segment Overview
      1. Strategies
        1. Key Developments
        2. SWOT Analysis
      2. Papstar GmbH
        1. Company Overview
        2. Financial Updates
        3. Product/Business Segment Overview
        4. Strategies
        5. Key Developments
        6. SWOT Analysis
      3. Bionatic GmbH
    151. & Co. KG (Germany)
    152. Company Overview
    153. Financial Updates
    154. Product/Business Segment Overview
      1. Strategies
        1. Key Developments
        2. SWOT Analysis
    155. APPENDIX
      1. General Sources & References
      2. List of Abbreviations
    156. Product Type, 2024–2032 (USD Million)
    157. Material Type, 2024–2032 (USD Million)
    158. Distribution Channel, 2024–2032 (USD Million)
    159. by Country, 2024–2032 (USD Million)
    160. by Product Type, 2024–2032 (USD Million)
    161. by Material Type, 2024–2032 (USD Million)
    162. by Distribution Channel, 2024–2032 (USD Million)
    163. Type, 2024–2032 (USD Million)
    164. Type, 2024–2032 (USD Million)
    165. Channel, 2024–2032 (USD Million)
    166. Type, 2024–2032 (USD Million)
    167. Type, 2024–2032 (USD Million)
    168. Channel, 2024–2032 (USD Million)
    169. Type, 2024–2032 (USD Million)
    170. Type, 2024–2032 (USD Million)
    171. Channel, 2024–2032 (USD Million)
    172. –2032 (USD Million)
    173. (USD Million)
    174. Europe: Biodegradable Tableware Market, by Material Type, 2024–2032 (USD
    175. Million)
    176. Europe: Biodegradable Tableware Market, by Distribution Channel, 2024–2032
    177. (USD Million)
    178. Germany: Biodegradable Tableware Market, by Product Type, 2024–2032 (USD
    179. Million)
    180. Germany: Biodegradable Tableware Market, by Material Type, 2024–2032 (USD
    181. Million)
    182. Germany: Biodegradable Tableware Market, by Distribution Channel, 2024–2032
    183. (USD Million)
    184. France: Biodegradable Tableware Market, by Product Type, 2024–2032 (USD
    185. Million)
    186. France: Biodegradable Tableware Market, by Material Type, 2024–2032 (USD
    187. Million)
    188. France: Biodegradable Tableware Market, by Distribution Channel, 2024–2032
    189. (USD Million)
    190. Italy: Biodegradable Tableware Market, by Product Type, 2024–2032 (USD
    191. Million)
    192. Italy: Biodegradable Tableware Market, by Material Type, 2024–2032 (USD
    193. Million)
    194. Italy: Biodegradable Tableware Market, by Distribution Channel, 2024–2032
    195. (USD Million)
    196. Spain: Biodegradable Tableware Market, by Product Type, 2024–2032 (USD
    197. Million)
    198. Spain: Biodegradable Tableware Market, by Material Type, 2024–2032 (USD
    199. Million)
    200. Spain: Biodegradable Tableware Market, by Distribution Channel, 2024–2032
    201. (USD Million)
    202. UK: Biodegradable Tableware Market, by Product Type, 2024–2032 (USD Million)
    203. Biodegradable Tableware Market, by Material Type, 2024–2032 (USD Million)
    204. Biodegradable Tableware Market, by Distribution Channel, 2024–2032 (USD Million)
    205. of Europe: Biodegradable Tableware Market, by Product Type, 2024–2032 (USD
    206. Million)
    207. Rest of Europe: Biodegradable Tableware Market, by Material Type, 2024–2032
    208. (USD Million)
    209. Rest of Europe: Biodegradable Tableware Market, by Distribution Channel, 2024–2032
    210. (USD Million)
    211. Asia-Pacific: Biodegradable Tableware Market, by Country, 2024–2032 (USD
    212. Million)
    213. Asia-Pacific: Biodegradable Tableware Market, by Product Type, 2024–2032
    214. (USD Million)
    215. Asia-Pacific: Biodegradable Tableware Market, by Material Type, 2024–2032
    216. (USD Million)
    217. Asia-Pacific: Biodegradable Tableware Market, by Distribution Channel, 2024–2032
    218. (USD Million)
    219. China: Biodegradable Tableware Market, by Product Type, 2024–2032 (USD
    220. Million)
    221. China: Biodegradable Tableware Market, by Material Type, 2024–2032 (USD
    222. Million)
    223. China: Biodegradable Tableware Market, by Distribution Channel, 2024–2032
    224. (USD Million)
    225. India: Biodegradable Tableware Market, by Product Type, 2024–2032 (USD
    226. Million)
    227. India: Biodegradable Tableware Market, by Material Type, 2024–2032 (USD
    228. Million)
    229. India: Biodegradable Tableware Market, by Distribution Channel, 2024–2032
    230. (USD Million)
    231. Japan: Biodegradable Tableware Market, by Product Type, 2024–2032 (USD
    232. Million)
    233. Japan: Biodegradable Tableware Market, by Material Type, 2024–2032 (USD
    234. Million)
    235. Japan: Biodegradable Tableware Market, by Distribution Channel, 2024–2032
    236. (USD Million)
    237. Rest of Asia-Pacific: Biodegradable Tableware Market, by Product Type, 2024–2032
    238. (USD Million)
    239. Rest of Asia-Pacific: Biodegradable Tableware Market, by Material Type, 2024–2032
    240. (USD Million)
    241. Rest of Asia-Pacific: Biodegradable Tableware Market, by Distribution Channel,
    242. –2032 (USD Million)
    243. Country, 2024–2032 (USD Million)
    244. Market, by Product Type, 2024–2032 (USD Million)
    245. Market, by Material Type, 2024–2032 (USD Million)
    246. Market, by Distribution Channel, 2024–2032 (USD Million)
    247. Biodegradable Tableware Market, by Product Type, 2024–2032 (USD Million)
    248. Biodegradable Tableware Market, by Material Type, 2024–2032 (USD Million)
    249. East: Biodegradable Tableware Market, by Distribution Channel, 2024–2032 (USD
    250. Million)
    251. Africa: Biodegradable Tableware Market, by Product Type, 2024–2032 (USD
    252. Million)
    253. Africa: Biodegradable Tableware Market, by Material Type, 2024–2032 (USD
    254. Million)
    255. Africa: Biodegradable Tableware Market, by Distribution Channel, 2024–2032
    256. (USD Million)
    257. LIST
    258. OF FIGURES
    259. Global Biodegradable Tableware Market Segmentation
    260. Analysis of the Global Biodegradable Tableware Market
    261. Share of the Global Biodegradable Tableware Market in 2022, by Region (%)
    262. Product Type, 2024–2032
    263. Global Biodegradable Tableware Market Type, by Material Type, 2024–2032
    264. Biodegradable Tableware Market, by Material Type, 2024–2032 (%)
    265. by Distribution Channel, 2024–2032 (%)'

    Market Segmentation

    Biodegradable Tableware Product Type Outlook (USD Billion, 2019-2030)

    • Plates
    • Bowls
    • Cups
    • Cutlery
    • Others

    Biodegradable Tableware Material Outlook (USD Billion, 2019-2030)

    • Paper
    • Bioplastic
    • Wood
    • Others

    Biodegradable Tableware Distribution Channel Outlook (USD Billion, 2019-2030)

    • Store-Based
    • Non-Store-Based

    Biodegradable Tableware Regional Outlook (USD Billion, 2019-2030)

    • North America Outlook (USD Billion, 2019-2030)

      • North America Biodegradable Tableware by Product Type
        • Plates
        • Bowls
        • Cups
        • Cutlery
        • Others
      • North America Biodegradable Tableware by Material
        • Paper
        • Bioplastic
        • Wood
        • Others
      • North America Biodegradable Tableware by Distribution Channel
        • Store-Based
        • Non-Store-Based
      • US Outlook (USD Billion, 2019-2030)

      • US Biodegradable Tableware by Product Type
        • Plates
        • Bowls
        • Cups
        • Cutlery
        • Others
      • US Biodegradable Tableware by Material
        • Paper
        • Bioplastic
        • Wood
        • Others
      • US Biodegradable Tableware by Distribution Channel
        • Store-Based
        • Non-Store-Based
      • CANADA Outlook (USD Billion, 2019-2030)

      • CANADA Biodegradable Tableware by Product Type
        • Plates
        • Bowls
        • Cups
        • Cutlery
        • Others
      • CANADA Biodegradable Tableware by Material
        • Paper
        • Bioplastic
        • Wood
        • Others
      • CANADA Biodegradable Tableware by Distribution Channel
        • Store-Based
        • Non-Store-Based
    • Europe Outlook (USD Billion, 2019-2030)

      • Europe Biodegradable Tableware by Product Type
        • Plates
        • Bowls
        • Cups
        • Cutlery
        • Others
      • Europe Biodegradable Tableware by Material
        • Paper
        • Bioplastic
        • Wood
        • Others
      • Europe Biodegradable Tableware by Distribution Channel
        • Store-Based
        • Non-Store-Based
      • Germany Outlook (USD Billion, 2019-2030)

      • Germany Biodegradable Tableware by Product Type
        • Plates
        • Bowls
        • Cups
        • Cutlery
        • Others
      • Germany Biodegradable Tableware by Material
        • Paper
        • Bioplastic
        • Wood
        • Others
      • Germany Biodegradable Tableware by Distribution Channel
        • Store-Based
        • Non-Store-Based
      • France Outlook (USD Billion, 2019-2030)

      • France Biodegradable Tableware by Product Type
        • Plates
        • Bowls
        • Cups
        • Cutlery
        • Others
      • France Biodegradable Tableware by Material
        • Paper
        • Bioplastic
        • Wood
        • Others
      • France Biodegradable Tableware by Distribution Channel
        • Store-Based
        • Non-Store-Based
      • UKOutlook (USD Billion, 2019-2030)

      • UK Biodegradable Tableware by Product Type
        • Plates
        • Bowls
        • Cups
        • Cutlery
        • Others
      • UK Biodegradable Tableware by Material
        • Paper
        • Bioplastic
        • Wood
        • Others
      • UK Biodegradable Tableware by Distribution Channel
        • Store-Based
        • Non-Store-Based
      • ITALYOutlook (USD Billion, 2019-2030)

      • ITALY Biodegradable Tableware by Product Type
        • Plates
        • Bowls
        • Cups
        • Cutlery
        • Others
      • ITALY Biodegradable Tableware by Material
        • Paper
        • Bioplastic
        • Wood
        • Others
      • ITALY Biodegradable Tableware by Distribution Channel
        • Store-Based
        • Non-Store-Based
      • SPAINOutlook (USD Billion, 2019-2030)

      • Spain Biodegradable Tableware by Product Type
        • Plates
        • Bowls
        • Cups
        • Cutlery
        • Others
      • Spain Biodegradable Tableware by Material
        • Paper
        • Bioplastic
        • Wood
        • Others
      • Spain Biodegradable Tableware by Distribution Channel
        • Store-Based
        • Non-Store-Based
      • Rest Of Europe Outlook (USD Billion, 2019-2030)

      • Rest Of Europe Biodegradable Tableware by Product Type
        • Plates
        • Bowls
        • Cups
        • Cutlery
        • Others
      • REST OF EUROPE Biodegradable Tableware by Material
        • Paper
        • Bioplastic
        • Wood
        • Others
      • REST OF EUROPE Biodegradable Tableware by Distribution Channel
        • Store-Based
        • Non-Store-Based
    • Asia-Pacific Outlook (USD Billion, 2019-2030)

      • Asia-Pacific Biodegradable Tableware by Product Type
        • Plates
        • Bowls
        • Cups
        • Cutlery
        • Others
      • Asia-Pacific Biodegradable Tableware by Material
        • Paper
        • Bioplastic
        • Wood
        • Others
      • Asia-Pacific Biodegradable Tableware by Distribution Channel
        • Store-Based
        • Non-Store-Based
      • China Outlook (USD Billion, 2019-2030)

      • China Biodegradable Tableware by Product Type
        • Plates
        • Bowls
        • Cups
        • Cutlery
        • Others
      • China Biodegradable Tableware by Material
        • Paper
        • Bioplastic
        • Wood
        • Others
      • China Biodegradable Tableware by Distribution Channel
        • Store-Based
        • Non-Store-Based
      • Japan Outlook (USD Billion, 2019-2030)

      • Japan Biodegradable Tableware by Product Type
        • Plates
        • Bowls
        • Cups
        • Cutlery
        • Others
      • Japan Biodegradable Tableware by Material
        • Paper
        • Bioplastic
        • Wood
        • Others
      • Japan Biodegradable Tableware by Distribution Channel
        • Store-Based
        • Non-Store-Based
      • India Outlook (USD Billion, 2019-2030)

      • India Biodegradable Tableware by Product Type
        • Plates
        • Bowls
        • Cups
        • Cutlery
        • Others
      • India Biodegradable Tableware by Material
        • Paper
        • Bioplastic
        • Wood
        • Others
      • India Biodegradable Tableware by Distribution Channel
        • Store-Based
        • Non-Store-Based
      • Australia Outlook (USD Billion, 2019-2030)

      • Australia Biodegradable Tableware by Product Type
        • Plates
        • Bowls
        • Cups
        • Cutlery
        • Others
      • Australia Biodegradable Tableware by Material
        • Paper
        • Bioplastic
        • Wood
        • Others
      • Australia Biodegradable Tableware by Distribution Channel
        • Store-Based
        • Non-Store-Based
      • Rest of Asia-Pacific Outlook (USD Billion, 2019-2030)

      • Rest of Asia-Pacific Biodegradable Tableware by Product Type
        • Plates
        • Bowls
        • Cups
        • Cutlery
        • Others
      • Rest of Asia-Pacific Biodegradable Tableware by Material
        • Paper
        • Bioplastic
        • Wood
        • Others
      • Rest of Asia-Pacific Biodegradable Tableware by Distribution Channel
        • Store-Based
        • Non-Store-Based
    • Rest of the WorldOutlook (USD Billion, 2019-2030)

      • Rest of the World Biodegradable Tableware by Product Type
        • Plates
        • Bowls
        • Cups
        • Cutlery
        • Others
      • Rest of the World Biodegradable Tableware by Material
        • Paper
        • Bioplastic
        • Wood
        • Others
      • Rest of the World Biodegradable Tableware by Distribution Channel
        • Store-Based
        • Non-Store-Based
      • Middle East Outlook (USD Billion, 2019-2030)

      • Middle East Biodegradable Tableware by Product Type
        • Plates
        • Bowls
        • Cups
        • Cutlery
        • Others
      • Middle East Biodegradable Tableware by Material
        • Paper
        • Bioplastic
        • Wood
        • Others
      • Middle East Biodegradable Tableware by Distribution Channel
        • Store-Based
        • Non-Store-Based
      • Africa Outlook (USD Billion, 2019-2030)

      • Africa Biodegradable Tableware by Product Type
        • Plates
        • Bowls
        • Cups
        • Cutlery
        • Others
      • Africa Biodegradable Tableware by Material
        • Paper
        • Bioplastic
        • Wood
        • Others
      • Africa Biodegradable Tableware by Distribution Channel
        • Store-Based
        • Non-Store-Based
      • Latin America Outlook (USD Billion, 2019-2030)

      • Latin America Biodegradable Tableware by Product Type
        • Plates
        • Bowls
        • Cups
        • Cutlery
        • Others
      • Latin America Biodegradable Tableware by Material
        • Paper
        • Bioplastic
        • Wood
        • Others
      • Latin America Biodegradable Tableware by Distribution Channel
        • Store-Based
        • Non-Store-Based
    Biodegradable Tableware Market Research Report - Forecast till 2032 Infographic
    Free Sample Request

    Kindly complete the form below to receive a free sample of this Report

    Customer Strories

    “I am very pleased with how market segments have been defined in a relevant way for my purposes (such as "Portable Freezers & refrigerators" and "last-mile"). In general the report is well structured. Thanks very much for your efforts.”

    Victoria Milne Founder
    Case Study

    Chemicals and Materials