• Cat-intel
  • MedIntelliX
  • Resources
  • About Us
  • Request Free Sample ×

    Kindly complete the form below to receive a free sample of this Report

    Leading companies partner with us for data-driven Insights

    clients tt-cursor

    Automated Fare Collection System Market

    ID: MRFR/ICT/20799-HCR
    128 Pages
    Aarti Dhapte
    September 2025

    Automated Fare Collection System Market Research Report: By Type (Open-Loop Systems, Closed-Loop Systems), By Technology (Radio Frequency Identification (RFID), Magnetic Stripe, Smart Cards, Contactless Smart Cards, Biometrics), By Application (Public Transportation, Parking, Vending, Ticketing) and By Regional (North America, Europe, South America, Asia Pacific, Middle East and Africa) - Forecast to 2034

    Share:
    Download PDF ×

    We do not share your information with anyone. However, we may send you emails based on your report interest from time to time. You may contact us at any time to opt-out.

    Automated Fare Collection System Market Research Report - Global Forecast till 2034 Infographic
    Purchase Options
    $ 4,950.0
    $ 5,950
    $ 7,250.0
    Table of Contents

    Automated Fare Collection System Market Summary

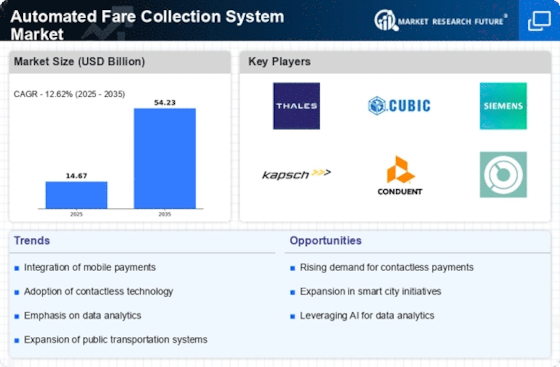
    The Global Automated Fare Collection System Market is projected to grow significantly from 14.8 USD Billion in 2024 to 54.2 USD Billion by 2035.

    Key Market Trends & Highlights

    Automated Fare Collection System Key Trends and Highlights

    • The market is expected to experience a compound annual growth rate (CAGR) of 12.53% from 2025 to 2035.
    • By 2035, the market valuation is anticipated to reach 54.2 USD Billion, indicating robust growth potential.
    • In 2024, the market is valued at 14.8 USD Billion, reflecting a strong foundation for future expansion.
    • Growing adoption of automated fare collection technology due to increasing urbanization is a major market driver.

    Market Size & Forecast

    2024 Market Size 14.8 (USD Billion)
    2035 Market Size 54.2 (USD Billion)
    CAGR (2025-2035) 12.53%

    Major Players

    CRRC Corporation Limited, Hitachi Rail, Cubic Transportation Systems, Siemens Mobility, Scheidt Bachmann, Vix Technology, NXP Semiconductors, Kapsch TrafficCom, Alstom, CAFINIT, Motorola Solutions, Thales Group, Bombardier Transportation

    Automated Fare Collection System Market Trends

    The increasing demand for cashless and contactless payment methods has significantly contributed to the growth of the Automated Fare Collection (AFC) system market. The integration of advanced technologies such as smart cards, mobile ticketing, and Biometrics is enhancing the convenience and efficiency of fare collection systems. Moreover, the rising urbanization and population density in major cities are driving the need for efficient and streamlined transportation systems, which has fueled the demand for AFC solutions. Additionally, government initiatives to promote sustainable and environmentally friendly transportation modes are positively impacting market growth. 

    The ongoing evolution of urban mobility solutions appears to be driving the adoption of automated fare collection systems, which are increasingly viewed as essential for enhancing operational efficiency and improving user experience in public transportation.

    U.S. Department of Transportation

    Automated Fare Collection System Market Drivers

    Market Growth Projections

    The Global Automated Fare Collection System Market Industry is poised for substantial growth, with projections indicating a market size of 14.8 USD Billion in 2024 and an anticipated increase to 54.2 USD Billion by 2035. This growth trajectory suggests a robust demand for automated fare collection solutions, driven by factors such as technological advancements, urbanization, and government initiatives. The market is expected to experience a compound annual growth rate (CAGR) of 12.53% from 2025 to 2035, reflecting the increasing adoption of these systems across various regions. This upward trend underscores the critical role of automated fare collection in shaping the future of public transportation.

    Technological Advancements

    The Global Automated Fare Collection System Market Industry is experiencing a surge in technological advancements, particularly in contactless payment solutions and mobile ticketing applications. These innovations enhance user convenience and streamline operations for transit authorities. For instance, the integration of Near Field Communication (NFC) technology allows passengers to use smartphones for fare payments, reducing wait times and improving overall efficiency. As a result, the market is projected to reach 14.8 USD Billion in 2024, reflecting the growing demand for seamless travel experiences. This trend indicates a shift towards more integrated and user-friendly fare collection systems.

    Government Initiatives and Funding

    Government initiatives and funding play a pivotal role in the expansion of the Global Automated Fare Collection System Market Industry. Many governments are investing in smart city projects that incorporate automated fare collection as a key component of modern public transportation infrastructure. For example, various countries are allocating budgets to upgrade existing systems and implement new technologies that enhance fare collection efficiency. This financial support not only facilitates the adoption of advanced systems but also encourages public-private partnerships, fostering innovation in the sector. Such initiatives are likely to contribute to a robust market growth trajectory, with a projected CAGR of 12.53% from 2025 to 2035.

    Urbanization and Population Growth

    Rapid urbanization and population growth are driving the Global Automated Fare Collection System Market Industry. As cities expand, the demand for efficient public transportation systems increases, necessitating advanced fare collection solutions. According to recent statistics, urban areas are expected to accommodate 68 percent of the global population by 2050. This demographic shift compels transit authorities to adopt automated systems that can handle higher passenger volumes while ensuring operational efficiency. Consequently, the market is anticipated to grow significantly, with projections indicating a rise to 54.2 USD Billion by 2035, highlighting the critical role of automated fare collection in modern urban transit.

    Increased Focus on Customer Experience

    The Global Automated Fare Collection System Market Industry is increasingly focused on enhancing customer experience. Transit authorities recognize that user satisfaction is paramount for encouraging public transport usage. As a result, many are implementing features such as real-time updates, user-friendly interfaces, and personalized fare options. These enhancements aim to create a more engaging and efficient travel experience for passengers. By prioritizing customer needs, transit systems can potentially increase ridership and revenue. This shift towards customer-centric solutions is indicative of broader trends within the industry, suggesting that automated fare collection systems will continue to evolve to meet changing consumer expectations.

    Environmental Sustainability Initiatives

    Environmental sustainability initiatives are becoming a driving force in the Global Automated Fare Collection System Market Industry. As cities strive to reduce their carbon footprints, there is a growing emphasis on promoting public transportation as a greener alternative to private vehicle use. Automated fare collection systems facilitate this transition by making public transport more accessible and efficient. For instance, cities that implement these systems often report increased ridership and reduced traffic congestion, contributing to lower emissions. This alignment with sustainability goals is likely to propel market growth, as more municipalities recognize the importance of integrating automated fare collection into their environmental strategies.

    Market Segment Insights

    Automated Fare Collection System Market Type Insights

    The Automated Fare Collection System Market is segmented by type into open-loop systems and closed-loop systems. Open-loop systems use contactless smart cards or mobile devices to store value and pay for fares, while closed-loop systems use proprietary cards or tokens that can only be used on a specific transit system. Open-loop systems are more common in large cities and metropolitan areas, as they are a more convenient and efficient way to pay for fares. They are also becoming increasingly popular in smaller cities and towns, as they are a more convenient and efficient way to pay for fares.

    Closed-loop systems are typically used on smaller transit systems, such as buses and ferries, but they are also used on light rail and commuter rail systems. The Automated Fare Collection System Market revenue for open-loop systems is expected to reach $25.46 billion by 2024, and the market for closed-loop systems is expected to reach $15.29 billion by 2024. The growth of the Automated Fare Collection System Market is being driven by a number of factors, including the increasing popularity of public transportation, the need for more efficient and convenient fare payment systems, and the growth of contactless payment technologies.

    Figure 2 : Automated Fare Collection System Market By Condition, 2023 & 2032 

    However, there are some key insights from the type segment of the Automated Fare Collection System Market. For example, open-loop systems are becoming increasingly popular due to their convenience and efficiency, while closed-loop systems are still used on some smaller transit systems. However, their market share is declining. In conclusion, the growth of the Automated Fare Collection System Market is being driven by the popularity of public transportation, the need for more efficient fare payment systems, and the adoption of contactless payment technologies. 

    Figure 2 : Automated Fare Collection System Market By Condition, 2023 & 2032 

    Source: Primary Research, Secondary Research, Market Research Future Database and Analyst Review

    Automated Fare Collection System Market Technology Insights

    The growth of the Technology segment of the Automated Fare Collection System Market will continue to increase rapidly in the years to come. Firstly, the revenue share of the Radio Frequency Identification technology system will keep rising. It is beneficial because it allows for the making of contactless payments and grants a higher level of security. Secondly, Smart Cards will gain from the increasing popularity boosted further because they require less fuss than other alternatives and can be used to save multiple payment options.

    Finally, Biometrics is gaining popularity because customers want a tool that is both highly secure and contactless.

    The increasing introduction of high-line technologies within the Automated Fare Collection System Market will encourage its further growth and facilitate income growth. Word Count: 108.

    Automated Fare Collection System Market Application Insights

    The Automated Fare Collection System Market is segmented by Application into Public Transportation, Parking, Vending, and Ticketing. The Public Transportation segment held the largest market share in 2023 and is expected to continue to dominate the market throughout the forecast period. The growth of this segment can be attributed to the increasing adoption of automated fare collection systems in public transportation networks around the world.

    The Parking segment is expected to witness significant growth during the forecast period due to the rising demand for automated parking solutions in commercial and residential areas. The Vending segment is also expected to grow steadily over the forecast period, driven by the increasing popularity of cashless vending machines. The Ticketing segment is expected to grow at a moderate pace due to the increasing adoption of digital ticketing solutions in various industries.

    Get more detailed insights about Automated Fare Collection System Market Research Report - Global Forecast till 2034

    Regional Insights

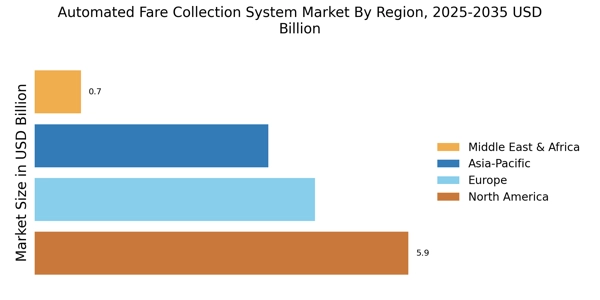
    The regional segmentation of the Automated Fare Collection System Market offers valuable insights into the market's geographical distribution and growth dynamics. North America is projected to dominate the market in 2023, with a revenue of USD 6.92 billion. The region's advanced public transportation infrastructure and high adoption of contactless payment technologies drive its growth. Europe follows closely with a revenue of USD 5.68 billion, driven by government initiatives to modernize public transportation and reduce fare evasion.

    APAC is expected to witness significant growth, with a projected revenue of USD 4.21 billion in 2023. The region's rapidly expanding urban population and increasing investment in transportation infrastructure contribute to its growth. South America and MEA represent emerging markets with growing potential for automated fare collection systems as they seek to improve their public transportation networks. 

    Figure 3 : Automated Fare Collection System Market By Regional, 2023 & 2032

    Automated_Fare_Collection_System_Market_3

    Source: Primary Research, Secondary Research, Market Research Future Database and Analyst Review

    Key Players and Competitive Insights

    A lot of players in the industry have focused on innovations and developing new technologies. They are spending a lot on developing effective and user-friendly systems. Thus, the innovation in the Environmental Testing Equipment is connected with launching products and services that are more convenient and affordable for the users. Because of the above-mentioned factors, it is beneficial to say that the Automated Fare Collection System Market will continue growing for many years.

    There are a lot of new entrances into the Automated Fare Collection System Market industry, which are expanding product offerings. This will definitely lead to more competitive pressure within the industry, meaning that the prices will go down. At the same time, the quality of the products or services will increase.

    One of the biggest players in the Automated Fare Collection System market is Schneider Electric. It provides AFC systems, including smart cards, readers, and validators. The AFC systems of Schneider Electric are mainly focused on Asia-Pacific, and the company is now actively promoting its products in other parts of the world. Another major player in the Automated Fare Collection System Market is Cubic Transportation Systems. The company also provides AFC solutions such as fare collection systems, revenue management systems, and passenger information systems. The major areas of the systems are North America and Europe.

    In conclusion, it is beneficial to add that there are still many other smaller players in the AFC Market, which are mainly focused on smaller and less important issues. At the same time, these smaller companies can also be a danger to the bigger ones if they succeed in offering innovative or cost-effective solutions. Overall, the Automated Fare Collection System Market will remain competitive for many years feud. New entrants and new products will appear.

    Key Companies in the Automated Fare Collection System Market market include

    Industry Developments

    • Q2 2024: Cubic Awarded Contract to Upgrade Fare Collection System for New York Metropolitan Transportation Authority Cubic Corporation announced it was awarded a contract by the New York Metropolitan Transportation Authority (MTA) to upgrade its automated fare collection system, including new contactless payment options and mobile ticketing.
    • Q2 2024: Thales and Hitachi Rail Announce Partnership to Develop Next-Generation Automated Fare Collection Solutions Thales and Hitachi Rail revealed a strategic partnership to co-develop advanced automated fare collection systems, focusing on AI-powered fraud detection and seamless multi-modal integration for urban transit networks.
    • Q2 2024: Masabi Secures $20 Million Series C Funding to Expand Mobile Ticketing Platform Masabi, a mobile ticketing and fare collection technology provider, raised $20 million in Series C funding to accelerate its global expansion and invest in new product development for public transport agencies.
    • Q3 2024: Siemens Mobility Launches Cloud-Based Fare Collection System for European Transit Operators Siemens Mobility introduced a new cloud-based automated fare collection platform designed for European transit agencies, enabling real-time data analytics and integration with contactless payment systems.
    • Q3 2024: Cubic Opens New R&D Facility in Singapore to Advance Fare Collection Technologies Cubic Corporation inaugurated a research and development center in Singapore focused on developing next-generation automated fare collection solutions for the Asia-Pacific market.
    • Q3 2024: Alstom Wins Contract to Supply Automated Fare Collection System for Mumbai Metro Line 5 Alstom secured a contract to deliver and install a comprehensive automated fare collection system for Mumbai Metro Line 5, including smart card and mobile payment integration.
    • Q4 2024: Transit Startup Flowbird Raises $35 Million to Scale Contactless Fare Collection Solutions Flowbird, a provider of contactless fare collection and ticketing solutions, closed a $35 million funding round to expand its product offerings and support new deployments in North America and Europe.
    • Q4 2024: Hitachi Rail Launches Open Payment Fare Collection System for London Buses Hitachi Rail announced the launch of an open payment automated fare collection system for London buses, allowing passengers to pay fares using contactless bank cards and mobile wallets.
    • Q1 2025: Cubic Corporation Appoints New CEO to Lead Global Fare Collection Expansion Cubic Corporation named a new Chief Executive Officer to drive its global strategy in automated fare collection systems and accelerate innovation in digital payment technologies.
    • Q1 2025: Masabi Partners with Deutsche Bahn to Deploy Mobile Ticketing Across German Rail Network Masabi entered a partnership with Deutsche Bahn to implement its mobile ticketing and automated fare collection technology across Germany’s national rail network.
    • Q2 2025: Thales Wins Contract for Automated Fare Collection System in Sydney Metro Extension Thales was awarded a contract to supply and install an automated fare collection system for the Sydney Metro extension, featuring contactless payment and real-time passenger analytics.
    • Q2 2025: Cubic Corporation Announces Strategic Acquisition of FareTech to Expand AFC Portfolio Cubic Corporation completed the acquisition of FareTech, a specialist in automated fare collection hardware, to broaden its product portfolio and enhance its global market presence.

    Future Outlook

    Automated Fare Collection System Market Future Outlook

    The Automated Fare Collection System Market is projected to grow at a 12.53% CAGR from 2024 to 2035, driven by technological advancements, urbanization, and increasing demand for seamless transit solutions.

    New opportunities lie in:

    • Develop AI-driven fare optimization tools for enhanced revenue management.
    • Implement contactless payment solutions to improve user experience and reduce transaction times.
    • Expand integration capabilities with mobile apps for real-time transit updates and ticketing.

    By 2035, the Automated Fare Collection System Market is expected to achieve substantial growth, reflecting evolving consumer needs and technological innovations.

    Market Segmentation

    Automated Fare Collection System Market Type Outlook

    • Open-Loop Systems
    • Closed-Loop Systems

    Automated Fare Collection System Market Regional Outlook

    • North America
    • Europe
    • South America
    • Asia Pacific
    • Middle East and Africa

    Automated Fare Collection System Market Technology Outlook

    • Radio Frequency Identification (RFID)
    • Magnetic Stripe
    • Smart Cards
    • Contactless Smart Cards
    • Biometrics

    Automated Fare Collection System Market Application Outlook

    • Public Transportation
    • Parking
    • Vending
    • Ticketing

    Report Scope

    Report Attribute/Metric Details
    Market Size 2024 14.66 (USD Billion)
    Market Size 2025 16.52 (USD Billion)
    Market Size 2034 48.14 (USD Billion)
    Compound Annual Growth Rate (CAGR) 12.62% (2025 - 2034)
    Report Coverage Revenue Forecast, Competitive Landscape, Growth Factors, and Trends
    Base Year 2024
    Market Forecast Period 2025 - 2034
    Historical Data 2019 - 2023
    Market Forecast Units USD Billion
    Key Companies Profiled CRRC Corporation Limited, Hitachi Rail, Cubic Transportation Systems, Siemens Mobility, Scheidt Bachmann, Vix Technology, NXP Semiconductors, Kapsch TrafficCom, Alstom, CAF, INIT, Motorola Solutions, Thales Group, Bombardier Transportation
    Segments Covered Type, Technology, Application, Regional
    Key Market Opportunities 1 Contactless Payments Expansion2 CloudBased Solutions Growth3 Smart Cities Integration4 Biometrics Adoption5 Intermodal Connectivity Rise
    Key Market Dynamics 1 Rising demand for contactless payments2 Government initiatives for smart transportation3 Growing adoption of mobile ticketing4 Integration with smart city initiatives5 Focus on improving passenger convenience
    Countries Covered North America, Europe, APAC, South America, MEA

    Market Highlights

    Author
    Aarti Dhapte
    Team Lead - Research

    She holds an experience of about 6+ years in Market Research and Business Consulting, working under the spectrum of Information Communication Technology, Telecommunications and Semiconductor domains. Aarti conceptualizes and implements a scalable business strategy and provides strategic leadership to the clients. Her expertise lies in market estimation, competitive intelligence, pipeline analysis, customer assessment, etc.

    Leave a Comment

    FAQs

    What is the expected market valuation of the Automated Fare Collection System Market in 2032?

    The Automated Fare Collection System Market is projected to reach an overall valuation of 48.14 billion USD by 2034, exhibiting a CAGR of 12.62%.

    What are the key factors driving the growth of the Automated Fare Collection System?

    The increasing demand for seamless and efficient transportation, coupled with government initiatives to modernize public transportation systems, are major drivers of growth for the Automated Fare Collection System market.

    Which region is expected to hold the largest market share in the Automated Fare Collection System?

    North America is anticipated to dominate the Automated Fare Collection System market due to rapid urbanization, population growth, and government investments in transportation infrastructure.

    What are the major applications of the Automated Fare Collection System?

    Automated Fare Collection Systems are primarily used in public transportation systems such as buses, trains, metros, and light rail, enabling contactless and convenient fare payment.

    Who are the key competitors in the Automated Fare Collection System Market?

    Prominent players in the Automated Fare Collection System market include Cubic Corporation, Scheidt Bachmann, Thales Group, INIT, and Conduent Transportation.

    What is the estimated market size of the Automated Fare Collection System in 2023?

    In 2023, the Automated Fare Collection System market was valued at approximately 13.25 billion USD.

    What are the emerging trends in the Automated Fare Collection System?

    Advancements in mobile ticketing, integration with mobile payment platforms, and the adoption of artificial intelligence (AI) for fraud prevention and passenger flow management are emerging trends in the Automated Fare Collection System market.

    How is the Automated Fare Collection System Market Segmented?

    The Automated Fare Collection System market is segmented based on component (hardware, software, and services), technology (contactless cards, mobile ticketing, and Biometrics), application (public transportation, retail, and healthcare), and geography (North America, Europe, Asia-Pacific, and Rest of the World).

    What are the key challenges faced by the Automated Fare Collection System Market?

    Challenges faced by the Automated Fare Collection System market include interoperability issues between different systems, cybersecurity concerns, and the need for seamless integration with existing transportation infrastructure.

    What is the future outlook for the Automated Fare Collection System Market?

    The future of the Automated Fare Collection System market appears promising, driven by the increasing demand for smart and integrated transportation solutions, government initiatives, and technological advancements.

    1. EXECUTIVE SUMMARY
      1. Market Overview
      2. Key Findings
      3. Market Segmentation
      4. Competitive Landscape
      5. Challenges and Opportunities
      6. Future Outlook
    2. MARKET INTRODUCTION
      1. Definition
      2. Scope of the study
    3. Research Objective
      1. Assumption
        1. Limitations
    4. RESEARCH
    5. METHODOLOGY
      1. Overview
      2. Data Mining
      3. Secondary Research
      4. Primary Research
        1. Primary Interviews and Information Gathering
    6. Process
      1. Breakdown of Primary Respondents
      2. Forecasting Model
      3. Market Size Estimation
        1. Bottom-Up Approach
        2. Top-Down
    7. Approach
      1. Data Triangulation
      2. Validation
    8. MARKET
    9. DYNAMICS
      1. Overview
      2. Drivers
      3. Restraints
    10. Opportunities
    11. MARKET FACTOR ANALYSIS
      1. Value chain Analysis
      2. Porter's Five Forces Analysis
        1. Bargaining Power of Suppliers
        2. Bargaining Power of Buyers
        3. Threat of New Entrants
        4. Threat of Substitutes
        5. Intensity of Rivalry
      3. COVID-19
    12. Impact Analysis
      1. Market Impact Analysis
        1. Regional Impact
        2. Opportunity and Threat Analysis
    13. AUTOMATED FARE COLLECTION
    14. SYSTEM MARKET, BY TYPE (USD BILLION)
      1. Open-Loop Systems
      2. Closed-Loop
    15. Systems
    16. AUTOMATED FARE COLLECTION SYSTEM MARKET, BY TECHNOLOGY (USD BILLION)
      1. Radio Frequency Identification (RFID)
      2. Magnetic Stripe
      3. Smart Cards
      4. Contactless Smart Cards
      5. Biometrics
    17. AUTOMATED FARE COLLECTION SYSTEM MARKET, BY APPLICATION (USD BILLION)
    18. Public Transportation
      1. Parking
      2. Vending
      3. Ticketing
    19. AUTOMATED FARE COLLECTION SYSTEM MARKET, BY REGIONAL (USD BILLION)
      1. North America
        1. US
        2. Canada
      2. Europe
    20. Germany
      1. UK
        1. France
        2. Russia
        3. Italy
        4. Spain
        5. Rest of Europe
      2. APAC
        1. China
        2. India
        3. Japan
        4. South Korea
        5. Malaysia
        6. Thailand
        7. Indonesia
        8. Rest of APAC
    21. South America
      1. Brazil
        1. Mexico
        2. Argentina
        3. Rest of South America
      2. MEA
        1. GCC Countries
    22. South Africa
      1. Rest of MEA
    23. COMPETITIVE LANDSCAPE
      1. Overview
      2. Competitive Analysis
      3. Market share Analysis
      4. Major Growth Strategy in the Automated Fare Collection System Market
      5. Competitive Benchmarking
      6. Leading Players in Terms of Number
    24. of Developments in the Automated Fare Collection System Market
      1. Key developments
    25. and growth strategies
      1. New Product Launch/Service Deployment
    26. Merger & Acquisitions
      1. Joint Ventures
      2. Major Players
    27. Financial Matrix
      1. Sales and Operating Income
        1. Major Players
    28. R&D Expenditure. 2023
    29. COMPANY PROFILES
      1. CRRC Corporation
    30. Limited
      1. Financial Overview
        1. Products Offered
    31. Key Developments
      1. SWOT Analysis
        1. Key Strategies
    32. Hitachi Rail
      1. Financial Overview
        1. Products Offered
        2. Key Developments
        3. SWOT Analysis
        4. Key Strategies
      2. Cubic Transportation Systems
        1. Financial Overview
    33. Products Offered
      1. Key Developments
        1. SWOT Analysis
        2. Key Strategies
      2. Siemens Mobility
        1. Financial Overview
        2. Products Offered
        3. Key Developments
        4. SWOT
    34. Analysis
      1. Key Strategies
      2. Scheidt Bachmann
    35. Financial Overview
      1. Products Offered
        1. Key Developments
        2. SWOT Analysis
        3. Key Strategies
      2. Vix Technology
        1. Financial Overview
        2. Products Offered
        3. Key
    36. Developments
      1. SWOT Analysis
        1. Key Strategies
    37. NXP Semiconductors
      1. Financial Overview
        1. Products Offered
        2. Key Developments
        3. SWOT Analysis
        4. Key Strategies
      2. Kapsch TrafficCom
        1. Financial Overview
        2. Products
    38. Offered
      1. Key Developments
        1. SWOT Analysis
    39. Key Strategies
      1. Alstom
        1. Financial Overview
    40. Products Offered
      1. Key Developments
        1. SWOT Analysis
        2. Key Strategies
      2. CAF
        1. Financial Overview
        2. Products Offered
        3. Key Developments
        4. SWOT
    41. Analysis
      1. Key Strategies
      2. INIT
        1. Financial
    42. Overview
      1. Products Offered
        1. Key Developments
    43. SWOT Analysis
      1. Key Strategies
      2. Motorola Solutions
        1. Financial Overview
        2. Products Offered
        3. Key
    44. Developments
      1. SWOT Analysis
        1. Key Strategies
    45. Thales Group
      1. Financial Overview
        1. Products Offered
        2. Key Developments
        3. SWOT Analysis
        4. Key Strategies
      2. Bombardier Transportation
        1. Financial Overview
    46. Products Offered
      1. Key Developments
        1. SWOT Analysis
        2. Key Strategies
    47. APPENDIX
      1. References
    48. Related Reports
    49. & FORECAST, BY TYPE, 2019-2032 (USD BILLIONS)
    50. FARE COLLECTION SYSTEM MARKET SIZE ESTIMATES & FORECAST, BY TECHNOLOGY, 2019-2032
    51. (USD BILLIONS)
    52. SIZE ESTIMATES & FORECAST, BY APPLICATION, 2019-2032 (USD BILLIONS)
    53. NORTH AMERICA AUTOMATED FARE COLLECTION SYSTEM MARKET SIZE ESTIMATES & FORECAST,
    54. BY REGIONAL, 2019-2032 (USD BILLIONS)
    55. SYSTEM MARKET SIZE ESTIMATES & FORECAST, BY TYPE, 2019-2032 (USD BILLIONS)
    56. BY TECHNOLOGY, 2019-2032 (USD BILLIONS)
    57. SYSTEM MARKET SIZE ESTIMATES & FORECAST, BY APPLICATION, 2019-2032 (USD BILLIONS)
    58. BY REGIONAL, 2019-2032 (USD BILLIONS)
    59. SYSTEM MARKET SIZE ESTIMATES & FORECAST, BY TYPE, 2019-2032 (USD BILLIONS)
    60. FORECAST, BY TECHNOLOGY, 2019-2032 (USD BILLIONS)
    61. FARE COLLECTION SYSTEM MARKET SIZE ESTIMATES & FORECAST, BY APPLICATION, 2019-2032
    62. (USD BILLIONS)
    63. ESTIMATES & FORECAST, BY REGIONAL, 2019-2032 (USD BILLIONS)
    64. EUROPE AUTOMATED FARE COLLECTION SYSTEM MARKET SIZE ESTIMATES & FORECAST, BY
    65. TYPE, 2019-2032 (USD BILLIONS)
    66. SYSTEM MARKET SIZE ESTIMATES & FORECAST, BY TECHNOLOGY, 2019-2032 (USD BILLIONS)
    67. FORECAST, BY APPLICATION, 2019-2032 (USD BILLIONS)
    68. FARE COLLECTION SYSTEM MARKET SIZE ESTIMATES & FORECAST, BY REGIONAL, 2019-2032
    69. (USD BILLIONS)
    70. ESTIMATES & FORECAST, BY TYPE, 2019-2032 (USD BILLIONS)
    71. AUTOMATED FARE COLLECTION SYSTEM MARKET SIZE ESTIMATES & FORECAST, BY TECHNOLOGY,
    72. 2032 (USD BILLIONS)
    73. MARKET SIZE ESTIMATES & FORECAST, BY APPLICATION, 2019-2032 (USD BILLIONS)
    74. FORECAST, BY REGIONAL, 2019-2032 (USD BILLIONS)
    75. COLLECTION SYSTEM MARKET SIZE ESTIMATES & FORECAST, BY TYPE, 2019-2032 (USD
    76. BILLIONS)
    77. & FORECAST, BY TECHNOLOGY, 2019-2032 (USD BILLIONS)
    78. FARE COLLECTION SYSTEM MARKET SIZE ESTIMATES & FORECAST, BY APPLICATION, 2019-2032
    79. (USD BILLIONS)
    80. & FORECAST, BY REGIONAL, 2019-2032 (USD BILLIONS)
    81. FARE COLLECTION SYSTEM MARKET SIZE ESTIMATES & FORECAST, BY TYPE, 2019-2032
    82. (USD BILLIONS)
    83. ESTIMATES & FORECAST, BY TECHNOLOGY, 2019-2032 (USD BILLIONS)
    84. FRANCE AUTOMATED FARE COLLECTION SYSTEM MARKET SIZE ESTIMATES & FORECAST, BY
    85. APPLICATION, 2019-2032 (USD BILLIONS)
    86. SYSTEM MARKET SIZE ESTIMATES & FORECAST, BY REGIONAL, 2019-2032 (USD BILLIONS)
    87. FORECAST, BY TYPE, 2019-2032 (USD BILLIONS)
    88. COLLECTION SYSTEM MARKET SIZE ESTIMATES & FORECAST, BY TECHNOLOGY, 2019-2032
    89. (USD BILLIONS)
    90. ESTIMATES & FORECAST, BY APPLICATION, 2019-2032 (USD BILLIONS)
    91. RUSSIA AUTOMATED FARE COLLECTION SYSTEM MARKET SIZE ESTIMATES & FORECAST, BY
    92. REGIONAL, 2019-2032 (USD BILLIONS)
    93. SYSTEM MARKET SIZE ESTIMATES & FORECAST, BY TYPE, 2019-2032 (USD BILLIONS)
    94. BY TECHNOLOGY, 2019-2032 (USD BILLIONS)
    95. SYSTEM MARKET SIZE ESTIMATES & FORECAST, BY APPLICATION, 2019-2032 (USD BILLIONS)
    96. FORECAST, BY REGIONAL, 2019-2032 (USD BILLIONS)
    97. FARE COLLECTION SYSTEM MARKET SIZE ESTIMATES & FORECAST, BY TYPE, 2019-2032
    98. (USD BILLIONS)
    99. ESTIMATES & FORECAST, BY TECHNOLOGY, 2019-2032 (USD BILLIONS)
    100. SPAIN AUTOMATED FARE COLLECTION SYSTEM MARKET SIZE ESTIMATES & FORECAST, BY
    101. APPLICATION, 2019-2032 (USD BILLIONS)
    102. SYSTEM MARKET SIZE ESTIMATES & FORECAST, BY REGIONAL, 2019-2032 (USD BILLIONS)
    103. & FORECAST, BY TYPE, 2019-2032 (USD BILLIONS)
    104. AUTOMATED FARE COLLECTION SYSTEM MARKET SIZE ESTIMATES & FORECAST, BY TECHNOLOGY,
    105. 2032 (USD BILLIONS)
    106. SYSTEM MARKET SIZE ESTIMATES & FORECAST, BY APPLICATION, 2019-2032 (USD BILLIONS)
    107. & FORECAST, BY REGIONAL, 2019-2032 (USD BILLIONS)
    108. FARE COLLECTION SYSTEM MARKET SIZE ESTIMATES & FORECAST, BY TYPE, 2019-2032
    109. (USD BILLIONS)
    110. ESTIMATES & FORECAST, BY TECHNOLOGY, 2019-2032 (USD BILLIONS)
    111. APAC AUTOMATED FARE COLLECTION SYSTEM MARKET SIZE ESTIMATES & FORECAST, BY APPLICATION,
    112. 2032 (USD BILLIONS)
    113. SIZE ESTIMATES & FORECAST, BY REGIONAL, 2019-2032 (USD BILLIONS)
    114. CHINA AUTOMATED FARE COLLECTION SYSTEM MARKET SIZE ESTIMATES & FORECAST,
    115. BY TYPE, 2019-2032 (USD BILLIONS)
    116. SYSTEM MARKET SIZE ESTIMATES & FORECAST, BY TECHNOLOGY, 2019-2032 (USD BILLIONS)
    117. FORECAST, BY APPLICATION, 2019-2032 (USD BILLIONS)
    118. FARE COLLECTION SYSTEM MARKET SIZE ESTIMATES & FORECAST, BY REGIONAL, 2019-2032
    119. (USD BILLIONS)
    120. ESTIMATES & FORECAST, BY TYPE, 2019-2032 (USD BILLIONS)
    121. AUTOMATED FARE COLLECTION SYSTEM MARKET SIZE ESTIMATES & FORECAST, BY TECHNOLOGY,
    122. 2032 (USD BILLIONS)
    123. MARKET SIZE ESTIMATES & FORECAST, BY APPLICATION, 2019-2032 (USD BILLIONS)
    124. BY REGIONAL, 2019-2032 (USD BILLIONS)
    125. SYSTEM MARKET SIZE ESTIMATES & FORECAST, BY TYPE, 2019-2032 (USD BILLIONS)
    126. BY TECHNOLOGY, 2019-2032 (USD BILLIONS)
    127. SYSTEM MARKET SIZE ESTIMATES & FORECAST, BY APPLICATION, 2019-2032 (USD BILLIONS)
    128. FORECAST, BY REGIONAL, 2019-2032 (USD BILLIONS)
    129. FARE COLLECTION SYSTEM MARKET SIZE ESTIMATES & FORECAST, BY TYPE, 2019-2032
    130. (USD BILLIONS)
    131. SIZE ESTIMATES & FORECAST, BY TECHNOLOGY, 2019-2032 (USD BILLIONS)
    132. SOUTH KOREA AUTOMATED FARE COLLECTION SYSTEM MARKET SIZE ESTIMATES & FORECAST,
    133. BY APPLICATION, 2019-2032 (USD BILLIONS)
    134. COLLECTION SYSTEM MARKET SIZE ESTIMATES & FORECAST, BY REGIONAL, 2019-2032 (USD
    135. BILLIONS)
    136. ESTIMATES & FORECAST, BY TYPE, 2019-2032 (USD BILLIONS)
    137. AUTOMATED FARE COLLECTION SYSTEM MARKET SIZE ESTIMATES & FORECAST, BY TECHNOLOGY,
    138. 2032 (USD BILLIONS)
    139. MARKET SIZE ESTIMATES & FORECAST, BY APPLICATION, 2019-2032 (USD BILLIONS)
    140. FORECAST, BY REGIONAL, 2019-2032 (USD BILLIONS)
    141. FARE COLLECTION SYSTEM MARKET SIZE ESTIMATES & FORECAST, BY TYPE, 2019-2032
    142. (USD BILLIONS)
    143. SIZE ESTIMATES & FORECAST, BY TECHNOLOGY, 2019-2032 (USD BILLIONS)
    144. THAILAND AUTOMATED FARE COLLECTION SYSTEM MARKET SIZE ESTIMATES & FORECAST,
    145. BY APPLICATION, 2019-2032 (USD BILLIONS)
    146. COLLECTION SYSTEM MARKET SIZE ESTIMATES & FORECAST, BY REGIONAL, 2019-2032 (USD
    147. BILLIONS)
    148. ESTIMATES & FORECAST, BY TYPE, 2019-2032 (USD BILLIONS)
    149. AUTOMATED FARE COLLECTION SYSTEM MARKET SIZE ESTIMATES & FORECAST, BY TECHNOLOGY,
    150. 2032 (USD BILLIONS)
    151. MARKET SIZE ESTIMATES & FORECAST, BY APPLICATION, 2019-2032 (USD BILLIONS)
    152. FORECAST, BY REGIONAL, 2019-2032 (USD BILLIONS)
    153. FARE COLLECTION SYSTEM MARKET SIZE ESTIMATES & FORECAST, BY TYPE, 2019-2032
    154. (USD BILLIONS)
    155. SIZE ESTIMATES & FORECAST, BY TECHNOLOGY, 2019-2032 (USD BILLIONS)
    156. REST OF APAC AUTOMATED FARE COLLECTION SYSTEM MARKET SIZE ESTIMATES & FORECAST,
    157. BY APPLICATION, 2019-2032 (USD BILLIONS)
    158. FARE COLLECTION SYSTEM MARKET SIZE ESTIMATES & FORECAST, BY REGIONAL, 2019-2032
    159. (USD BILLIONS)
    160. SIZE ESTIMATES & FORECAST, BY TYPE, 2019-2032 (USD BILLIONS)
    161. SOUTH AMERICA AUTOMATED FARE COLLECTION SYSTEM MARKET SIZE ESTIMATES & FORECAST,
    162. BY TECHNOLOGY, 2019-2032 (USD BILLIONS)
    163. FARE COLLECTION SYSTEM MARKET SIZE ESTIMATES & FORECAST, BY APPLICATION, 2019-2032
    164. (USD BILLIONS)
    165. SIZE ESTIMATES & FORECAST, BY REGIONAL, 2019-2032 (USD BILLIONS)
    166. BRAZIL AUTOMATED FARE COLLECTION SYSTEM MARKET SIZE ESTIMATES & FORECAST,
    167. BY TYPE, 2019-2032 (USD BILLIONS)
    168. SYSTEM MARKET SIZE ESTIMATES & FORECAST, BY TECHNOLOGY, 2019-2032 (USD BILLIONS)
    169. FORECAST, BY APPLICATION, 2019-2032 (USD BILLIONS)
    170. FARE COLLECTION SYSTEM MARKET SIZE ESTIMATES & FORECAST, BY REGIONAL, 2019-2032
    171. (USD BILLIONS)
    172. ESTIMATES & FORECAST, BY TYPE, 2019-2032 (USD BILLIONS)
    173. AUTOMATED FARE COLLECTION SYSTEM MARKET SIZE ESTIMATES & FORECAST, BY TECHNOLOGY,
    174. 2032 (USD BILLIONS)
    175. MARKET SIZE ESTIMATES & FORECAST, BY APPLICATION, 2019-2032 (USD BILLIONS)
    176. FORECAST, BY REGIONAL, 2019-2032 (USD BILLIONS)
    177. FARE COLLECTION SYSTEM MARKET SIZE ESTIMATES & FORECAST, BY TYPE, 2019-2032
    178. (USD BILLIONS)
    179. SIZE ESTIMATES & FORECAST, BY TECHNOLOGY, 2019-2032 (USD BILLIONS)
    180. ARGENTINA AUTOMATED FARE COLLECTION SYSTEM MARKET SIZE ESTIMATES & FORECAST,
    181. BY APPLICATION, 2019-2032 (USD BILLIONS)
    182. COLLECTION SYSTEM MARKET SIZE ESTIMATES & FORECAST, BY REGIONAL, 2019-2032 (USD
    183. BILLIONS)
    184. MARKET SIZE ESTIMATES & FORECAST, BY TYPE, 2019-2032 (USD BILLIONS)
    185. REST OF SOUTH AMERICA AUTOMATED FARE COLLECTION SYSTEM MARKET SIZE ESTIMATES
    186. & FORECAST, BY TECHNOLOGY, 2019-2032 (USD BILLIONS)
    187. SOUTH AMERICA AUTOMATED FARE COLLECTION SYSTEM MARKET SIZE ESTIMATES & FORECAST,
    188. BY APPLICATION, 2019-2032 (USD BILLIONS)
    189. AUTOMATED FARE COLLECTION SYSTEM MARKET SIZE ESTIMATES & FORECAST, BY REGIONAL,
    190. 2032 (USD BILLIONS)
    191. SIZE ESTIMATES & FORECAST, BY TYPE, 2019-2032 (USD BILLIONS)
    192. MEA AUTOMATED FARE COLLECTION SYSTEM MARKET SIZE ESTIMATES & FORECAST, BY TECHNOLOGY,
    193. 2032 (USD BILLIONS)
    194. SIZE ESTIMATES & FORECAST, BY APPLICATION, 2019-2032 (USD BILLIONS)
    195. MEA AUTOMATED FARE COLLECTION SYSTEM MARKET SIZE ESTIMATES & FORECAST,
    196. BY REGIONAL, 2019-2032 (USD BILLIONS)
    197. COLLECTION SYSTEM MARKET SIZE ESTIMATES & FORECAST, BY TYPE, 2019-2032 (USD
    198. BILLIONS)
    199. SIZE ESTIMATES & FORECAST, BY TECHNOLOGY, 2019-2032 (USD BILLIONS)
    200. GCC COUNTRIES AUTOMATED FARE COLLECTION SYSTEM MARKET SIZE ESTIMATES &
    201. FORECAST, BY APPLICATION, 2019-2032 (USD BILLIONS)
    202. AUTOMATED FARE COLLECTION SYSTEM MARKET SIZE ESTIMATES & FORECAST, BY REGIONAL,
    203. 2032 (USD BILLIONS)
    204. SYSTEM MARKET SIZE ESTIMATES & FORECAST, BY TYPE, 2019-2032 (USD BILLIONS)
    205. & FORECAST, BY TECHNOLOGY, 2019-2032 (USD BILLIONS)
    206. AUTOMATED FARE COLLECTION SYSTEM MARKET SIZE ESTIMATES & FORECAST, BY APPLICATION,
    207. 2032 (USD BILLIONS)
    208. SYSTEM MARKET SIZE ESTIMATES & FORECAST, BY REGIONAL, 2019-2032 (USD BILLIONS)
    209. & FORECAST, BY TYPE, 2019-2032 (USD BILLIONS)
    210. FARE COLLECTION SYSTEM MARKET SIZE ESTIMATES & FORECAST, BY TECHNOLOGY, 2019-2032
    211. (USD BILLIONS)
    212. SIZE ESTIMATES & FORECAST, BY APPLICATION, 2019-2032 (USD BILLIONS)
    213. REST OF MEA AUTOMATED FARE COLLECTION SYSTEM MARKET SIZE ESTIMATES & FORECAST,
    214. BY REGIONAL, 2019-2032 (USD BILLIONS)
    215. MARKET SYNOPSIS
    216. MARKET ANALYSIS
    217. BY TYPE
    218. GERMANY AUTOMATED FARE COLLECTION SYSTEM MARKET ANALYSIS BY TYPE
    219. GERMANY AUTOMATED FARE COLLECTION SYSTEM MARKET ANALYSIS BY TECHNOLOGY
    220. GERMANY AUTOMATED FARE COLLECTION SYSTEM MARKET ANALYSIS BY APPLICATION
    221. BY TYPE
    222. ANALYSIS BY TECHNOLOGY
    223. SYSTEM MARKET ANALYSIS BY APPLICATION
    224. FARE COLLECTION SYSTEM MARKET ANALYSIS BY REGIONAL
    225. FARE COLLECTION SYSTEM MARKET ANALYSIS
    226. SYSTEM MARKET ANALYSIS BY TYPE
    227. SYSTEM MARKET ANALYSIS BY TECHNOLOGY
    228. SYSTEM MARKET ANALYSIS BY APPLICATION
    229. SYSTEM MARKET ANALYSIS BY REGIONAL
    230. SYSTEM MARKET ANALYSIS BY TYPE
    231. SYSTEM MARKET ANALYSIS BY TECHNOLOGY
    232. SYSTEM MARKET ANALYSIS BY APPLICATION
    233. SYSTEM MARKET ANALYSIS BY REGIONAL
    234. SYSTEM MARKET ANALYSIS BY TYPE
    235. SYSTEM MARKET ANALYSIS BY TECHNOLOGY
    236. SYSTEM MARKET ANALYSIS BY APPLICATION
    237. SYSTEM MARKET ANALYSIS BY REGIONAL
    238. SYSTEM MARKET ANALYSIS BY TYPE
    239. SYSTEM MARKET ANALYSIS BY TECHNOLOGY
    240. COLLECTION SYSTEM MARKET ANALYSIS BY APPLICATION
    241. FARE COLLECTION SYSTEM MARKET ANALYSIS BY REGIONAL
    242. FARE COLLECTION SYSTEM MARKET ANALYSIS BY TYPE
    243. FARE COLLECTION SYSTEM MARKET ANALYSIS BY TECHNOLOGY
    244. FARE COLLECTION SYSTEM MARKET ANALYSIS BY APPLICATION
    245. AUTOMATED FARE COLLECTION SYSTEM MARKET ANALYSIS BY REGIONAL
    246. AUTOMATED FARE COLLECTION SYSTEM MARKET ANALYSIS BY TYPE
    247. AUTOMATED FARE COLLECTION SYSTEM MARKET ANALYSIS BY TECHNOLOGY
    248. THAILAND AUTOMATED FARE COLLECTION SYSTEM MARKET ANALYSIS BY APPLICATION
    249. THAILAND AUTOMATED FARE COLLECTION SYSTEM MARKET ANALYSIS BY REGIONAL
    250. INDONESIA AUTOMATED FARE COLLECTION SYSTEM MARKET ANALYSIS BY TYPE
    251. INDONESIA AUTOMATED FARE COLLECTION SYSTEM MARKET ANALYSIS BY TECHNOLOGY
    252. TYPE
    253. BY TECHNOLOGY
    254. ANALYSIS BY APPLICATION
    255. SYSTEM MARKET ANALYSIS BY REGIONAL
    256. COLLECTION SYSTEM MARKET ANALYSIS
    257. SYSTEM MARKET ANALYSIS BY TYPE
    258. SYSTEM MARKET ANALYSIS BY TECHNOLOGY
    259. SYSTEM MARKET ANALYSIS BY APPLICATION
    260. SYSTEM MARKET ANALYSIS BY REGIONAL
    261. SYSTEM MARKET ANALYSIS BY TYPE
    262. SYSTEM MARKET ANALYSIS BY TECHNOLOGY
    263. SYSTEM MARKET ANALYSIS BY APPLICATION
    264. SYSTEM MARKET ANALYSIS BY REGIONAL
    265. SYSTEM MARKET ANALYSIS BY TYPE
    266. SYSTEM MARKET ANALYSIS BY TECHNOLOGY
    267. SYSTEM MARKET ANALYSIS BY APPLICATION
    268. COLLECTION SYSTEM MARKET ANALYSIS BY REGIONAL
    269. AUTOMATED FARE COLLECTION SYSTEM MARKET ANALYSIS BY TYPE
    270. SOUTH AMERICA AUTOMATED FARE COLLECTION SYSTEM MARKET ANALYSIS BY TECHNOLOGY
    271. BY APPLICATION
    272. SYSTEM MARKET ANALYSIS BY REGIONAL
    273. SYSTEM MARKET ANALYSIS
    274. SYSTEM MARKET ANALYSIS BY TYPE
    275. SYSTEM MARKET ANALYSIS BY TECHNOLOGY
    276. COLLECTION SYSTEM MARKET ANALYSIS BY APPLICATION
    277. AUTOMATED FARE COLLECTION SYSTEM MARKET ANALYSIS BY REGIONAL
    278. AFRICA AUTOMATED FARE COLLECTION SYSTEM MARKET ANALYSIS BY TYPE
    279. SOUTH AFRICA AUTOMATED FARE COLLECTION SYSTEM MARKET ANALYSIS BY TECHNOLOGY
    280. REGIONAL
    281. BY TYPE
    282. BY TECHNOLOGY
    283. ANALYSIS BY APPLICATION
    284. SYSTEM MARKET ANALYSIS BY REGIONAL
    285. FARE COLLECTION SYSTEM MARKET
    286. DRO ANALYSIS OF AUTOMATED FARE COLLECTION SYSTEM MARKET
    287. IMPACT ANALYSIS: AUTOMATED FARE COLLECTION SYSTEM MARKET
    288. IMPACT ANALYSIS: AUTOMATED FARE COLLECTION SYSTEM MARKET
    289. / VALUE CHAIN: AUTOMATED FARE COLLECTION SYSTEM MARKET
    290. FARE COLLECTION SYSTEM MARKET, BY TYPE, 2024 (% SHARE)
    291. FARE COLLECTION SYSTEM MARKET, BY TYPE, 2019 TO 2032 (USD Billions)
    292. AUTOMATED FARE COLLECTION SYSTEM MARKET, BY TECHNOLOGY, 2024 (% SHARE)
    293. (USD Billions)
    294. (% SHARE)
    295. TO 2032 (USD Billions)
    296. BY REGIONAL, 2024 (% SHARE)
    297. BY REGIONAL, 2019 TO 2032 (USD Billions)
    298. COMPETITORS

    Automated Fare Collection System Market Segmentation

    • Automated Fare Collection System Market By Type (USD Billion, 2019-2032)

      • Open-Loop Systems
      • Closed-Loop Systems


    • Automated Fare Collection System Market By Technology (USD Billion, 2019-2032)

      • Radio Frequency Identification (RFID)
      • Magnetic Stripe
      • Smart Cards
      • Contactless Smart Cards
      • Biometrics


    • Automated Fare Collection System Market By Application (USD Billion, 2019-2032)

      • Public Transportation
      • Parking
      • Vending
      • Ticketing


    • Automated Fare Collection System Market By Regional (USD Billion, 2019-2032)

      • North America
      • Europe
      • South America
      • Asia Pacific
      • Middle East and Africa


    Automated Fare Collection System Market Regional Outlook (USD Billion, 2019-2032)


    • North America Outlook (USD Billion, 2019-2032)

      • North America Automated Fare Collection System Market by Type

        • Open-Loop Systems
        • Closed-Loop Systems
      • North America Automated Fare Collection System Market by Technology Type

        • Radio Frequency Identification (RFID)
        • Magnetic Stripe
        • Smart Cards
        • Contactless Smart Cards
        • Biometrics
      • North America Automated Fare Collection System Market by Application Type

        • Public Transportation
        • Parking
        • Vending
        • Ticketing
      • North America Automated Fare Collection System Market by Regional Type

        • US
        • Canada
      • US Outlook (USD Billion, 2019-2032)
      • US Automated Fare Collection System Market by Type

        • Open-Loop Systems
        • Closed-Loop Systems
      • US Automated Fare Collection System Market by Technology Type

        • Radio Frequency Identification (RFID)
        • Magnetic Stripe
        • Smart Cards
        • Contactless Smart Cards
        • Biometrics
      • US Automated Fare Collection System Market by Application Type

        • Public Transportation
        • Parking
        • Vending
        • Ticketing
      • CANADA Outlook (USD Billion, 2019-2032)
      • CANADA Automated Fare Collection System Market by Type

        • Open-Loop Systems
        • Closed-Loop Systems
      • CANADA Automated Fare Collection System Market by Technology Type

        • Radio Frequency Identification (RFID)
        • Magnetic Stripe
        • Smart Cards
        • Contactless Smart Cards
        • Biometrics
      • CANADA Automated Fare Collection System Market by Application Type

        • Public Transportation
        • Parking
        • Vending
        • Ticketing
    • Europe Outlook (USD Billion, 2019-2032)

      • Europe Automated Fare Collection System Market by Type

        • Open-Loop Systems
        • Closed-Loop Systems
      • Europe Automated Fare Collection System Market by Technology Type

        • Radio Frequency Identification (RFID)
        • Magnetic Stripe
        • Smart Cards
        • Contactless Smart Cards
        • Biometrics
      • Europe Automated Fare Collection System Market by Application Type

        • Public Transportation
        • Parking
        • Vending
        • Ticketing
      • Europe Automated Fare Collection System Market by Regional Type

        • Germany
        • UK
        • France
        • Russia
        • Italy
        • Spain
        • Rest of Europe
      • GERMANY Outlook (USD Billion, 2019-2032)
      • GERMANY Automated Fare Collection System Market by Type

        • Open-Loop Systems
        • Closed-Loop Systems
      • GERMANY Automated Fare Collection System Market by Technology Type

        • Radio Frequency Identification (RFID)
        • Magnetic Stripe
        • Smart Cards
        • Contactless Smart Cards
        • Biometrics
      • GERMANY Automated Fare Collection System Market by Application Type

        • Public Transportation
        • Parking
        • Vending
        • Ticketing
      • UK Outlook (USD Billion, 2019-2032)
      • UK Automated Fare Collection System Market by Type

        • Open-Loop Systems
        • Closed-Loop Systems
      • UK Automated Fare Collection System Market by Technology Type

        • Radio Frequency Identification (RFID)
        • Magnetic Stripe
        • Smart Cards
        • Contactless Smart Cards
        • Biometrics
      • UK Automated Fare Collection System Market by Application Type

        • Public Transportation
        • Parking
        • Vending
        • Ticketing
      • FRANCE Outlook (USD Billion, 2019-2032)
      • FRANCE Automated Fare Collection System Market by Type

        • Open-Loop Systems
        • Closed-Loop Systems
      • FRANCE Automated Fare Collection System Market by Technology Type

        • Radio Frequency Identification (RFID)
        • Magnetic Stripe
        • Smart Cards
        • Contactless Smart Cards
        • Biometrics
      • FRANCE Automated Fare Collection System Market by Application Type

        • Public Transportation
        • Parking
        • Vending
        • Ticketing
      • RUSSIA Outlook (USD Billion, 2019-2032)
      • RUSSIA Automated Fare Collection System Market by Type

        • Open-Loop Systems
        • Closed-Loop Systems
      • RUSSIA Automated Fare Collection System Market by Technology Type

        • Radio Frequency Identification (RFID)
        • Magnetic Stripe
        • Smart Cards
        • Contactless Smart Cards
        • Biometrics
      • RUSSIA Automated Fare Collection System Market by Application Type

        • Public Transportation
        • Parking
        • Vending
        • Ticketing
      • ITALY Outlook (USD Billion, 2019-2032)
      • ITALY Automated Fare Collection System Market by Type

        • Open-Loop Systems
        • Closed-Loop Systems
      • ITALY Automated Fare Collection System Market by Technology Type

        • Radio Frequency Identification (RFID)
        • Magnetic Stripe
        • Smart Cards
        • Contactless Smart Cards
        • Biometrics
      • ITALY Automated Fare Collection System Market by Application Type

        • Public Transportation
        • Parking
        • Vending
        • Ticketing
      • SPAIN Outlook (USD Billion, 2019-2032)
      • SPAIN Automated Fare Collection System Market by Type

        • Open-Loop Systems
        • Closed-Loop Systems
      • SPAIN Automated Fare Collection System Market by Technology Type

        • Radio Frequency Identification (RFID)
        • Magnetic Stripe
        • Smart Cards
        • Contactless Smart Cards
        • Biometrics
      • SPAIN Automated Fare Collection System Market by Application Type

        • Public Transportation
        • Parking
        • Vending
        • Ticketing
      • REST OF EUROPE Outlook (USD Billion, 2019-2032)
      • REST OF EUROPE Automated Fare Collection System Market by Type

        • Open-Loop Systems
        • Closed-Loop Systems
      • REST OF EUROPE Automated Fare Collection System Market by Technology Type

        • Radio Frequency Identification (RFID)
        • Magnetic Stripe
        • Smart Cards
        • Contactless Smart Cards
        • Biometrics
      • REST OF EUROPE Automated Fare Collection System Market by Application Type

        • Public Transportation
        • Parking
        • Vending
        • Ticketing
    • APAC Outlook (USD Billion, 2019-2032)

      • APAC Automated Fare Collection System Market by Type

        • Open-Loop Systems
        • Closed-Loop Systems
      • APAC Automated Fare Collection System Market by Technology Type

        • Radio Frequency Identification (RFID)
        • Magnetic Stripe
        • Smart Cards
        • Contactless Smart Cards
        • Biometrics
      • APAC Automated Fare Collection System Market by Application Type

        • Public Transportation
        • Parking
        • Vending
        • Ticketing
      • APAC Automated Fare Collection System Market by Regional Type

        • China
        • India
        • Japan
        • South Korea
        • Malaysia
        • Thailand
        • Indonesia
        • Rest of APAC
      • CHINA Outlook (USD Billion, 2019-2032)
      • CHINA Automated Fare Collection System Market by Type

        • Open-Loop Systems
        • Closed-Loop Systems
      • CHINA Automated Fare Collection System Market by Technology Type

        • Radio Frequency Identification (RFID)
        • Magnetic Stripe
        • Smart Cards
        • Contactless Smart Cards
        • Biometrics
      • CHINA Automated Fare Collection System Market by Application Type

        • Public Transportation
        • Parking
        • Vending
        • Ticketing
      • INDIA Outlook (USD Billion, 2019-2032)
      • INDIA Automated Fare Collection System Market by Type

        • Open-Loop Systems
        • Closed-Loop Systems
      • INDIA Automated Fare Collection System Market by Technology Type

        • Radio Frequency Identification (RFID)
        • Magnetic Stripe
        • Smart Cards
        • Contactless Smart Cards
        • Biometrics
      • INDIA Automated Fare Collection System Market by Application Type

        • Public Transportation
        • Parking
        • Vending
        • Ticketing
      • JAPAN Outlook (USD Billion, 2019-2032)
      • JAPAN Automated Fare Collection System Market by Type

        • Open-Loop Systems
        • Closed-Loop Systems
      • JAPAN Automated Fare Collection System Market by Technology Type

        • Radio Frequency Identification (RFID)
        • Magnetic Stripe
        • Smart Cards
        • Contactless Smart Cards
        • Biometrics
      • JAPAN Automated Fare Collection System Market by Application Type

        • Public Transportation
        • Parking
        • Vending
        • Ticketing
      • SOUTH KOREA Outlook (USD Billion, 2019-2032)
      • SOUTH KOREA Automated Fare Collection System Market by Type

        • Open-Loop Systems
        • Closed-Loop Systems
      • SOUTH KOREA Automated Fare Collection System Market by Technology Type

        • Radio Frequency Identification (RFID)
        • Magnetic Stripe
        • Smart Cards
        • Contactless Smart Cards
        • Biometrics
      • SOUTH KOREA Automated Fare Collection System Market by Application Type

        • Public Transportation
        • Parking
        • Vending
        • Ticketing
      • MALAYSIA Outlook (USD Billion, 2019-2032)
      • MALAYSIA Automated Fare Collection System Market by Type

        • Open-Loop Systems
        • Closed-Loop Systems
      • MALAYSIA Automated Fare Collection System Market by Technology Type

        • Radio Frequency Identification (RFID)
        • Magnetic Stripe
        • Smart Cards
        • Contactless Smart Cards
        • Biometrics
      • MALAYSIA Automated Fare Collection System Market by Application Type

        • Public Transportation
        • Parking
        • Vending
        • Ticketing
      • THAILAND Outlook (USD Billion, 2019-2032)
      • THAILAND Automated Fare Collection System Market by Type

        • Open-Loop Systems
        • Closed-Loop Systems
      • THAILAND Automated Fare Collection System Market by Technology Type

        • Radio Frequency Identification (RFID)
        • Magnetic Stripe
        • Smart Cards
        • Contactless Smart Cards
        • Biometrics
      • THAILAND Automated Fare Collection System Market by Application Type

        • Public Transportation
        • Parking
        • Vending
        • Ticketing
      • INDONESIA Outlook (USD Billion, 2019-2032)
      • INDONESIA Automated Fare Collection System Market by Type

        • Open-Loop Systems
        • Closed-Loop Systems
      • INDONESIA Automated Fare Collection System Market by Technology Type

        • Radio Frequency Identification (RFID)
        • Magnetic Stripe
        • Smart Cards
        • Contactless Smart Cards
        • Biometrics
      • INDONESIA Automated Fare Collection System Market by Application Type

        • Public Transportation
        • Parking
        • Vending
        • Ticketing
      • REST OF APAC Outlook (USD Billion, 2019-2032)
      • REST OF APAC Automated Fare Collection System Market by Type

        • Open-Loop Systems
        • Closed-Loop Systems
      • REST OF APAC Automated Fare Collection System Market by Technology Type

        • Radio Frequency Identification (RFID)
        • Magnetic Stripe
        • Smart Cards
        • Contactless Smart Cards
        • Biometrics
      • REST OF APAC Automated Fare Collection System Market by Application Type

        • Public Transportation
        • Parking
        • Vending
        • Ticketing
    • South America Outlook (USD Billion, 2019-2032)

      • South America Automated Fare Collection System Market by Type

        • Open-Loop Systems
        • Closed-Loop Systems
      • South America Automated Fare Collection System Market by Technology Type

        • Radio Frequency Identification (RFID)
        • Magnetic Stripe
        • Smart Cards
        • Contactless Smart Cards
        • Biometrics
      • South America Automated Fare Collection System Market by Application Type

        • Public Transportation
        • Parking
        • Vending
        • Ticketing
      • South America Automated Fare Collection System Market by Regional Type

        • Brazil
        • Mexico
        • Argentina
        • Rest of South America
      • BRAZIL Outlook (USD Billion, 2019-2032)
      • BRAZIL Automated Fare Collection System Market by Type

        • Open-Loop Systems
        • Closed-Loop Systems
      • BRAZIL Automated Fare Collection System Market by Technology Type

        • Radio Frequency Identification (RFID)
        • Magnetic Stripe
        • Smart Cards
        • Contactless Smart Cards
        • Biometrics
      • BRAZIL Automated Fare Collection System Market by Application Type

        • Public Transportation
        • Parking
        • Vending
        • Ticketing
      • MEXICO Outlook (USD Billion, 2019-2032)
      • MEXICO Automated Fare Collection System Market by Type

        • Open-Loop Systems
        • Closed-Loop Systems
      • MEXICO Automated Fare Collection System Market by Technology Type

        • Radio Frequency Identification (RFID)
        • Magnetic Stripe
        • Smart Cards
        • Contactless Smart Cards
        • Biometrics
      • MEXICO Automated Fare Collection System Market by Application Type

        • Public Transportation
        • Parking
        • Vending
        • Ticketing
      • ARGENTINA Outlook (USD Billion, 2019-2032)
      • ARGENTINA Automated Fare Collection System Market by Type

        • Open-Loop Systems
        • Closed-Loop Systems
      • ARGENTINA Automated Fare Collection System Market by Technology Type

        • Radio Frequency Identification (RFID)
        • Magnetic Stripe
        • Smart Cards
        • Contactless Smart Cards
        • Biometrics
      • ARGENTINA Automated Fare Collection System Market by Application Type

        • Public Transportation
        • Parking
        • Vending
        • Ticketing
      • REST OF SOUTH AMERICA Outlook (USD Billion, 2019-2032)
      • REST OF SOUTH AMERICA Automated Fare Collection System Market by Type

        • Open-Loop Systems
        • Closed-Loop Systems
      • REST OF SOUTH AMERICA Automated Fare Collection System Market by Technology Type

        • Radio Frequency Identification (RFID)
        • Magnetic Stripe
        • Smart Cards
        • Contactless Smart Cards
        • Biometrics
      • REST OF SOUTH AMERICA Automated Fare Collection System Market by Application Type

        • Public Transportation
        • Parking
        • Vending
        • Ticketing
    • MEA Outlook (USD Billion, 2019-2032)

      • MEA Automated Fare Collection System Market by Type

        • Open-Loop Systems
        • Closed-Loop Systems
      • MEA Automated Fare Collection System Market by Technology Type

        • Radio Frequency Identification (RFID)
        • Magnetic Stripe
        • Smart Cards
        • Contactless Smart Cards
        • Biometrics
      • MEA Automated Fare Collection System Market by Application Type

        • Public Transportation
        • Parking
        • Vending
        • Ticketing
      • MEA Automated Fare Collection System Market by Regional Type

        • GCC Countries
        • South Africa
        • Rest of MEA
      • GCC COUNTRIES Outlook (USD Billion, 2019-2032)
      • GCC COUNTRIES Automated Fare Collection System Market by Type

        • Open-Loop Systems
        • Closed-Loop Systems
      • GCC COUNTRIES Automated Fare Collection System Market by Technology Type

        • Radio Frequency Identification (RFID)
        • Magnetic Stripe
        • Smart Cards
        • Contactless Smart Cards
        • Biometrics
      • GCC COUNTRIES Automated Fare Collection System Market by Application Type

        • Public Transportation
        • Parking
        • Vending
        • Ticketing
      • SOUTH AFRICA Outlook (USD Billion, 2019-2032)
      • SOUTH AFRICA Automated Fare Collection System Market by Type

        • Open-Loop Systems
        • Closed-Loop Systems
      • SOUTH AFRICA Automated Fare Collection System Market by Technology Type

        • Radio Frequency Identification (RFID)
        • Magnetic Stripe
        • Smart Cards
        • Contactless Smart Cards
        • Biometrics
      • SOUTH AFRICA Automated Fare Collection System Market by Application Type

        • Public Transportation
        • Parking
        • Vending
        • Ticketing
      • REST OF MEA Outlook (USD Billion, 2019-2032)
      • REST OF MEA Automated Fare Collection System Market by Type

        • Open-Loop Systems
        • Closed-Loop Systems
      • REST OF MEA Automated Fare Collection System Market by Technology Type

        • Radio Frequency Identification (RFID)
        • Magnetic Stripe
        • Smart Cards
        • Contactless Smart Cards
        • Biometrics
      • REST OF MEA Automated Fare Collection System Market by Application Type

        • Public Transportation
        • Parking
        • Vending
        • Ticketing
    Automated Fare Collection System Market Research Report - Global Forecast till 2034 Infographic
    Free Sample Request

    Kindly complete the form below to receive a free sample of this Report

    Customer Strories

    “I am very pleased with how market segments have been defined in a relevant way for my purposes (such as "Portable Freezers & refrigerators" and "last-mile"). In general the report is well structured. Thanks very much for your efforts.”

    Victoria Milne Founder
    Case Study

    Chemicals and Materials