• Cat-intel
  • MedIntelliX
  • Resources
  • About Us
  • Hero Background
    English
    Chinese
    French
    Japanese
    Korean
    German
    Spanish

    Automated Cell Counters Market Analysis

    ID: MRFR/MED/10561-HCR
    128 Pages
    Rahul Gotadki
    October 2025

    Automated Cell Counters Market Research Report Information By Product Type (Fluorescence Image-based Cell Counter, Flow Cytometer and Coulter Counter), By Application (Blood Cells, Cell lines, Microbial cells and Others), By End-use (Pharmaceutical & Biotechnology Companies, Hospitals, Diagnostic Laboratories, Research Institutes and Others) And By Region (North America, Europe, Asia-Pacifi...

    Share:
    Download PDF ×

    We do not share your information with anyone. However, we may send you emails based on your report interest from time to time. You may contact us at any time to opt-out.

    Automated Cell Counters Market Infographic
    $ 4,950.0
    $ 5,950.0
    $ 7,250.0

    Market Analysis

    In-depth Analysis of Automated Cell Counters Market Industry Landscape

    The market dynamics of automated cell counters reflect a rapidly evolving landscape driven by technological advancements, rising demand for efficient cell counting solutions, and a growing focus on research and development in life sciences. Automated cell counters play a pivotal role in various fields, including biotechnology, pharmaceuticals, and clinical diagnostics, offering a streamlined and accurate approach to cell counting compared to traditional manual methods.

    One key driver influencing the automated cell counters market is the increasing prevalence of diseases and the subsequent demand for advanced diagnostic tools. As researchers and healthcare professionals seek more precise and efficient ways to analyze cell samples, the adoption of automated cell counters has witnessed a notable upswing. These instruments provide not only rapid results but also reduce the chances of human error, ensuring the reliability of cell counting data.

    Technological innovations have been a major catalyst in shaping the market dynamics. The integration of artificial intelligence and machine learning algorithms into automated cell counting systems has significantly enhanced their capabilities. This allows for more sophisticated and accurate analysis of diverse cell types, paving the way for personalized medicine and tailored treatment approaches. Additionally, the development of high-throughput automated cell counters has addressed the need for processing large volumes of samples in a time-efficient manner, further fueling market growth.

    The competitive landscape of the automated cell counters market is characterized by the presence of established players and a surge in new entrants aiming to capitalize on the growing demand. Companies are actively investing in research and development to introduce innovative features, such as enhanced imaging technologies and connectivity options. This not only intensifies competition but also contributes to a continuous cycle of advancements, driving market expansion.

    The pharmaceutical and biotechnology sectors are significant contributors to the demand for automated cell counters. These industries rely heavily on precise cell counting for various applications, including drug development, vaccine production, and bioprocessing. The need for standardized and reproducible results has led to a widespread adoption of automated cell counting solutions, creating a substantial market opportunity.

    Moreover, the increasing focus on regenerative medicine and stem cell research has further propelled the demand for advanced cell counting technologies. Automated cell counters equipped with specialized algorithms for different cell types cater to the unique requirements of these cutting-edge fields. This expanding application scope broadens the market's horizons and presents manufacturers with lucrative prospects.

    However, challenges such as the high initial cost of automated cell counters and the need for skilled personnel to operate these sophisticated instruments can potentially impede market growth. Addressing these challenges through strategic pricing models, user-friendly interfaces, and comprehensive training programs becomes crucial for market players to maximize their reach and impact.

    Market Summary

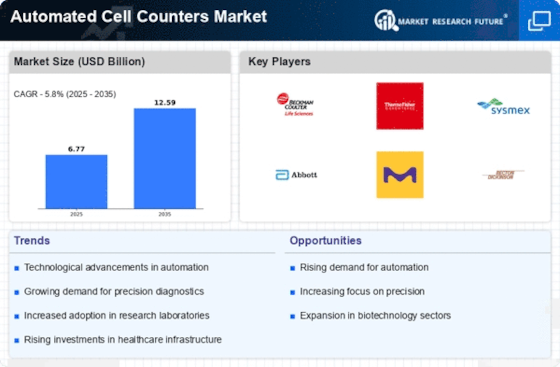
    As per MRFR analysis, the Automated Cell Counters Market Size was estimated at 6.771 USD Billion in 2024. The Automated Cell Counters industry is projected to grow from 7.164 USD Billion in 2025 to 12.59 USD Billion by 2035, exhibiting a compound annual growth rate (CAGR) of 5.8 during the forecast period 2025 - 2035.

    Key Market Trends & Highlights

    The Automated Cell Counters Market is experiencing robust growth driven by technological advancements and increasing demand for cell-based research.

    • North America remains the largest market for automated cell counters, driven by advanced healthcare infrastructure.
    • The Asia-Pacific region is emerging as the fastest-growing market, fueled by rapid technological adoption and increasing research activities.
    • Fluorescence image-based cell counters dominate the market, while flow cytometers are witnessing the fastest growth due to their advanced capabilities.
    • Technological advancements in automated cell counters and the rising demand for cell-based research are key drivers propelling market expansion.

    Market Size & Forecast

    2024 Market Size 6.771 (USD Billion)
    2035 Market Size 12.59 (USD Billion)
    CAGR (2025 - 2035) 5.8%
    Largest Regional Market Share in 2024 North America

    Major Players

    <p>Beckman Coulter (US), Thermo Fisher Scientific (US), Sysmex Corporation (JP), Abbott Laboratories (US), Merck KGaA (DE), Becton Dickinson and Company (US), Nexcelom Bioscience LLC (US), Bio-Rad Laboratories (US), ChemoMetec A/S (DK)</p>

    Market Trends

    The Automated Cell Counters Market is currently experiencing a notable transformation, driven by advancements in technology and increasing demand for precise cell analysis in various applications. The integration of artificial intelligence and machine learning into cell counting devices appears to enhance accuracy and efficiency, thereby attracting a broader range of users, including research institutions and clinical laboratories. Furthermore, the growing emphasis on personalized medicine and regenerative therapies seems to propel the need for reliable cell counting solutions, as these fields require meticulous monitoring of cell populations. As a result, manufacturers are likely to invest in innovative features that cater to these evolving requirements, potentially leading to a more competitive landscape. In addition, the rising prevalence of chronic diseases and the expanding biopharmaceutical sector may further stimulate growth within the Automated Cell Counters Market. The increasing focus on drug development and the necessity for rigorous quality control in biomanufacturing processes suggest that automated solutions will become indispensable. Moreover, the trend towards automation in laboratories indicates a shift towards more streamlined workflows, which could enhance productivity and reduce human error. Overall, the market appears poised for continued expansion, driven by technological advancements and the growing need for efficient cell counting solutions across various sectors.

    Integration of AI and Machine Learning

    The incorporation of artificial intelligence and machine learning technologies into automated cell counters is reshaping the market. These innovations enhance the precision and speed of cell analysis, making devices more appealing to laboratories and research facilities.

    Focus on Personalized Medicine

    The increasing emphasis on personalized medicine is driving demand for accurate cell counting solutions. As therapies become more tailored to individual patients, the need for reliable monitoring of cell populations is likely to grow, influencing market dynamics.

    Automation in Laboratory Workflows

    The trend towards automation in laboratory environments is expected to streamline processes and improve efficiency. Automated cell counters are becoming essential tools, as they reduce human error and enhance productivity in various applications.

    The increasing demand for precision in cell analysis is driving advancements in automated cell counting technologies, which are becoming integral to research and clinical applications.

    U.S. National Institutes of Health

    Automated Cell Counters Market Market Drivers

    Rising Demand for Cell-Based Research

    The Automated Cell Counters Market is significantly influenced by the rising demand for cell-based research across various sectors, including pharmaceuticals and biotechnology. As the focus on drug discovery and development intensifies, the need for efficient and accurate cell counting methods becomes paramount. The market is estimated to reach a valuation of USD 1.5 billion by 2026, reflecting the growing investment in research and development activities. This trend is further supported by the increasing prevalence of chronic diseases, which necessitates extensive research into cellular mechanisms. Consequently, automated cell counters are becoming indispensable tools in laboratories, enabling researchers to conduct high-throughput analyses with greater precision. The ongoing advancements in cell counting technologies are likely to cater to this demand, ensuring that the market continues to expand in response to evolving research needs.

    Growing Adoption of Automation in Healthcare

    The growing adoption of automation in healthcare is a pivotal factor influencing the Automated Cell Counters Market. As healthcare facilities strive to improve operational efficiency and patient outcomes, the integration of automated solutions becomes increasingly important. The market is anticipated to grow at a CAGR of approximately 9% in the coming years, driven by the need for rapid and accurate diagnostic tools. Automated cell counters facilitate high-throughput screening and analysis, which are essential in clinical laboratories. This trend is further supported by the increasing emphasis on reducing turnaround times for test results, thereby enhancing patient care. As healthcare providers continue to embrace automation, the demand for automated cell counting technologies is expected to rise, positioning these solutions as integral components of modern healthcare diagnostics.

    Increased Focus on Quality Control in Laboratories

    Quality control remains a critical aspect of laboratory operations, and the Automated Cell Counters Market is adapting to meet these stringent requirements. Laboratories are increasingly adopting automated solutions to ensure consistent and reliable results in cell counting, which is essential for maintaining compliance with regulatory standards. The market is projected to witness a steady growth trajectory, with an anticipated CAGR of around 7% over the next few years. This growth is driven by the need for enhanced accuracy and reproducibility in experimental results, particularly in clinical diagnostics and research applications. Automated cell counters provide a level of precision that manual counting methods cannot achieve, thereby reducing variability and improving overall data integrity. As laboratories prioritize quality assurance, the demand for automated cell counting solutions is expected to rise, further solidifying their role in modern laboratory practices.

    Technological Advancements in Automated Cell Counters

    The Automated Cell Counters Market is experiencing a surge in technological advancements, particularly in imaging and analysis techniques. Innovations such as high-resolution imaging and advanced algorithms enhance the accuracy and efficiency of cell counting. These developments are crucial as they allow for the analysis of complex cell populations, which is increasingly important in research and clinical settings. The market is projected to grow at a compound annual growth rate (CAGR) of approximately 8% over the next five years, driven by the demand for precise and rapid cell analysis. Furthermore, the integration of automation in laboratory workflows is likely to streamline processes, thereby reducing human error and increasing throughput. As laboratories seek to improve productivity, the adoption of advanced automated cell counters is expected to rise, further propelling the market forward.

    Expansion of Biotechnology and Pharmaceutical Industries

    The expansion of the biotechnology and pharmaceutical industries is a significant driver for the Automated Cell Counters Market. As these sectors continue to grow, the demand for advanced laboratory equipment, including automated cell counters, is likely to increase. The market is projected to experience robust growth, with estimates suggesting a value of USD 1.8 billion by 2027. This growth is attributed to the increasing number of biopharmaceutical companies focusing on cell-based therapies and personalized medicine. Automated cell counters play a vital role in these applications by providing accurate cell quantification, which is essential for developing effective therapies. Furthermore, the rise in funding for biotechnology research is expected to bolster the market, as more laboratories seek to invest in cutting-edge technologies to enhance their research capabilities.

    Market Segment Insights

    By Product Type: Fluorescence Image-Based Cell Counter (Largest) vs. Flow Cytometer (Fastest-Growing)

    <p>In the Automated Cell Counters Market, the segmentation by product type reveals significant differentiation in market share distribution among fluorescence image-based cell counters, flow cytometers, and Coulter counters. The fluorescence image-based cell counter holds the largest share, appealing primarily to research laboratories and healthcare institutions due to its precision in analyzing cell populations. In contrast, flow cytometers are gaining traction across various applications like immunology and clinical diagnostics, accounting for a rapid increase in demand despite possessing a smaller market share compared to fluorescence counters. Coulter counters maintain a stable presence by offering reliable cell counting solutions but are gradually being overshadowed by newer technologies. Growth trends in the Automated Cell Counters Market indicate a pronounced shift towards fluorescence image-based counters, driven by advancements in imaging technology and enhanced user experience. Meanwhile, flow cytometers are recognized as the fastest-growing segment, fueled by rising investments in biotechnology and personalized medicine. The increasing focus on automation and efficiency in laboratories also propels the demand for these advanced counting instruments. As healthcare applications expand and the need for accurate cell analysis intensifies, both fluorescence and flow cytometry technologies will likely see continued growth and innovation.</p>

    <p>Fluorescence Image-Based Cell Counter (Dominant) vs. Flow Cytometer (Emerging)</p>

    <p>The fluorescence image-based cell counter is a dominant force in the Automated Cell Counters Market, primarily known for its high accuracy and efficiency in a range of applications from clinical diagnostics to basic research. This technology leverages fluorescent dyes to provide detailed analysis and visualization of cell structures, making it indispensable in environments where precision is crucial. On the other hand, flow cytometers represent an emerging segment, characterized by their ability to perform simultaneous multi-parametric analysis of single cells as they flow in front of a laser. These instruments are rapidly evolving, driven by innovations in microfluidics and data analysis software, catering to diverse fields such as immunology and cell biology. As the demand for comprehensive cellular analysis continues to grow, both product types exemplify significant advancements in the automated counting landscape.</p>

    By Application: Blood Cells (Largest) vs. Cell lines (Fastest-Growing)

    <p>In the Automated Cell Counters Market, the application segments are dominated by blood cells, which hold the largest market share. This segment's significant prevalence in clinical laboratories and hospitals showcases its integral role in standard diagnostic procedures. Meanwhile, the cell lines application is emerging as the fastest-growing segment, driven by the increasing demand for biopharmaceuticals and cell-based therapies, reflecting on industry's innovative shifts.</p>

    <p>Blood Cells (Dominant) vs. Cell Lines (Emerging)</p>

    <p>The blood cells segment is characterized by the widespread use of automated cell counters in hematology for rapid and accurate diagnosis of blood disorders. With a robust presence in laboratories worldwide, this segment relies on advanced technologies to enhance precision in blood cell counting. On the other hand, the cell lines application is gaining traction, fueled by advancements in research related to cancer, drug discovery, and regenerative medicine. This segment is emerging as a key player as biomanufacturing practices expand and the bio-pharmaceutical industry continues to innovate, generating a significant uptick in demand for reliable cell line counting methodologies.</p>

    By End-use: Pharmaceutical & biotechnology companies (Largest) vs. Hospitals (Fastest-Growing)

    <p>In the Automated Cell Counters Market, pharmaceutical and biotechnology companies hold the largest share, driven by the increasing demand for precision in drug development and quality control processes. This segment utilizes automated cell counters extensively for cell analysis, leading to a significant market presence. On the other hand, hospitals are emerging as a fast-growing segment, largely due to improvements in patient care and the need for rapid diagnostic solutions. Hospitals increasingly rely on these technologies for various applications, resulting in robust growth in this area.</p>

    <p>Pharmaceutical & biotechnology companies: Dominant vs. Hospitals: Emerging</p>

    <p>Pharmaceutical and biotechnology companies represent the most dominant end-user segment in the Automated Cell Counters Market. Their advanced research and development activities require precise and reliable cell counting, making these technologies indispensable. These companies often enhance their research capabilities through automation, thus increasing efficiency and throughput in laboratory settings. Whereas hospitals, classified as an emerging segment, are rapidly adopting automated cell counters to enhance diagnostic accuracy and turnaround times. This increasing reliance on technology in clinical settings reflects a broader trend towards automation in healthcare, allowing hospitals to improve patient outcomes by delivering timely and accurate lab results.</p>

    Get more detailed insights about Automated Cell Counters Market Research Report 2034

    Regional Insights

    North America : Innovation and Market Leadership

    North America is the largest market for automated cell counters, holding approximately 45% of the global market share. The region's growth is driven by advanced healthcare infrastructure, increasing demand for rapid diagnostics, and significant investments in research and development. Regulatory support from agencies like the FDA further catalyzes market expansion, ensuring that innovative products meet stringent safety and efficacy standards. The United States leads the market, with key players such as Beckman Coulter, Thermo Fisher Scientific, and Abbott Laboratories dominating the landscape. The competitive environment is characterized by continuous innovation and strategic partnerships, enhancing product offerings. Canada also contributes significantly, focusing on improving healthcare outcomes through advanced diagnostic technologies. The presence of established companies ensures a robust supply chain and access to cutting-edge technology.

    Europe : Regulatory Framework and Growth

    Europe is the second-largest market for automated cell counters, accounting for approximately 30% of the global market share. The region's growth is fueled by increasing investments in healthcare technology, a rising geriatric population, and stringent regulatory frameworks that ensure product quality and safety. The European Medicines Agency (EMA) plays a crucial role in regulating medical devices, fostering innovation while maintaining high standards. Germany and the United Kingdom are the leading countries in this market, with a strong presence of key players like Merck KGaA and Becton Dickinson. The competitive landscape is marked by collaborations between manufacturers and research institutions, driving advancements in technology. Additionally, the focus on personalized medicine and early disease detection is propelling demand for automated cell counters, making Europe a vital region for market growth.

    Asia-Pacific : Rapid Growth and Adoption

    Asia-Pacific is witnessing rapid growth in the automated cell counters market, holding approximately 20% of the global market share. The region's expansion is driven by increasing healthcare expenditure, a growing population, and rising awareness of advanced diagnostic technologies. Countries like China and India are investing heavily in healthcare infrastructure, which is expected to further boost market demand in the coming years. China is the largest market in the region, with significant contributions from local manufacturers and international players like Sysmex Corporation. The competitive landscape is evolving, with a focus on innovation and affordability. India is also emerging as a key player, with a growing number of startups entering the market. The presence of established companies ensures a competitive environment, fostering advancements in technology and product offerings.

    Middle East and Africa : Untapped Potential and Growth

    The Middle East and Africa region is gradually emerging in the automated cell counters market, holding about 5% of the global market share. The growth is primarily driven by increasing healthcare investments, rising disease prevalence, and a growing focus on improving healthcare infrastructure. Governments in countries like Saudi Arabia and South Africa are implementing initiatives to enhance healthcare services, which is expected to boost market demand. South Africa is the leading market in this region, with a growing number of healthcare facilities adopting advanced diagnostic technologies. The competitive landscape is characterized by a mix of local and international players, creating opportunities for innovation and market entry. As healthcare systems evolve, the demand for automated cell counters is anticipated to rise, making this region a potential hotspot for future growth.

    Key Players and Competitive Insights

    The Automated Cell Counters Market is currently characterized by a dynamic competitive landscape, driven by technological advancements and increasing demand for efficient laboratory processes. Key players such as Beckman Coulter (US), Thermo Fisher Scientific (US), and Sysmex Corporation (JP) are at the forefront, each adopting distinct strategies to enhance their market positioning. Beckman Coulter (US) emphasizes innovation in product development, focusing on integrating advanced analytics into their cell counting solutions. Meanwhile, Thermo Fisher Scientific (US) is pursuing a strategy of regional expansion, particularly in emerging markets, to capitalize on the growing demand for automated solutions. Sysmex Corporation (JP) appears to be concentrating on partnerships and collaborations to enhance its technological capabilities, thereby shaping a competitive environment that is increasingly reliant on innovation and strategic alliances.

    In terms of business tactics, companies are localizing manufacturing and optimizing supply chains to enhance operational efficiency. The market structure is moderately fragmented, with several key players exerting influence over various segments. This fragmentation allows for a diverse range of products and services, catering to different customer needs while fostering competition among established and emerging players.

    In August 2025, Beckman Coulter (US) announced the launch of a new automated cell counter that utilizes artificial intelligence to improve accuracy and speed in cell analysis. This strategic move not only reinforces their commitment to innovation but also positions them to meet the increasing demands for precision in laboratory settings. The integration of AI into their product line is likely to enhance their competitive edge, appealing to laboratories seeking cutting-edge technology.

    In September 2025, Thermo Fisher Scientific (US) expanded its manufacturing capabilities in Southeast Asia, aiming to streamline production and reduce lead times for its automated cell counters. This expansion is strategically significant as it allows the company to better serve the growing demand in the Asia-Pacific region, which is witnessing rapid advancements in healthcare and research. By optimizing its supply chain, Thermo Fisher is likely to enhance its market responsiveness and operational efficiency.

    In July 2025, Sysmex Corporation (JP) entered into a strategic partnership with a leading biotechnology firm to co-develop next-generation cell counting technologies. This collaboration is indicative of Sysmex's focus on leveraging external expertise to accelerate innovation. Such partnerships may not only enhance their product offerings but also position them favorably against competitors who may lack similar collaborative initiatives.

    As of October 2025, the competitive trends in the Automated Cell Counters Market are increasingly defined by digitalization, sustainability, and the integration of artificial intelligence. Strategic alliances are becoming pivotal in shaping the landscape, as companies seek to combine resources and expertise to drive innovation. Looking ahead, it is anticipated that competitive differentiation will evolve, shifting from traditional price-based competition to a focus on technological advancements, innovation, and supply chain reliability. This transition underscores the importance of adaptability and forward-thinking strategies in maintaining a competitive edge.

    Key Companies in the Automated Cell Counters Market market include

    Industry Developments

    • Q2 2024: Beckman Coulter Life Sciences Launches New AQUIOS STEM System for Automated Stem Cell Analysis Beckman Coulter Life Sciences announced the launch of its AQUIOS STEM System, an automated cell counter designed for stem cell enumeration in clinical laboratories, aiming to streamline and standardize stem cell analysis workflows.
    • Q2 2024: Sysmex Launches Next-Generation Automated Hematology Analyzer XN-1000V Sysmex Corporation introduced the XN-1000V, a new automated hematology analyzer with enhanced cell counting and analysis capabilities, targeting improved efficiency and accuracy in clinical diagnostics.
    • Q2 2024: ChemoMetec Announces Opening of New Production Facility in Denmark ChemoMetec, a manufacturer of automated cell counters, opened a new production facility in Denmark to expand manufacturing capacity and meet growing global demand for its cell counting instruments.
    • Q3 2024: NanoCellect Biomedical Announces Strategic Partnership with Thermo Fisher Scientific NanoCellect Biomedical entered a strategic partnership with Thermo Fisher Scientific to integrate NanoCellect’s automated cell sorting and counting technology into Thermo Fisher’s cell analysis workflows.
    • Q3 2024: Bio-Rad Laboratories Launches TC20e Automated Cell Counter Bio-Rad Laboratories launched the TC20e Automated Cell Counter, featuring enhanced image analysis and data connectivity for improved cell counting accuracy in research and clinical laboratories.
    • Q3 2024: Nexcelom Bioscience Receives CE Mark for Cellaca MX High-Throughput Automated Cell Counter Nexcelom Bioscience received CE Mark approval for its Cellaca MX High-Throughput Automated Cell Counter, enabling commercialization in the European market for clinical and research applications.
    • Q4 2024: Agilent Technologies Acquires Cell Analysis Company BioVision Technologies Agilent Technologies completed the acquisition of BioVision Technologies, a developer of automated cell counting and viability analysis instruments, to expand its cell analysis portfolio.
    • Q4 2024: Thermo Fisher Scientific Launches Invitrogen Countess 4 Automated Cell Counter Thermo Fisher Scientific launched the Invitrogen Countess 4 Automated Cell Counter, offering advanced fluorescence and brightfield imaging for rapid and accurate cell counting.
    • Q1 2025: Beckman Coulter Life Sciences Announces FDA 510(k) Clearance for AQUIOS STEM System Beckman Coulter Life Sciences received FDA 510(k) clearance for its AQUIOS STEM System, allowing clinical laboratories in the United States to use the automated cell counter for stem cell enumeration.
    • Q1 2025: ChemoMetec Appoints New Chief Executive Officer ChemoMetec announced the appointment of a new Chief Executive Officer to lead the company’s global expansion and innovation in automated cell counting technologies.
    • Q2 2025: NanoCellect Biomedical Raises $30 Million in Series C Funding NanoCellect Biomedical secured $30 million in Series C funding to accelerate the development and commercialization of its automated cell sorting and counting platforms.
    • Q2 2025: Sysmex Corporation Opens New R&D Center Focused on Automated Cell Analysis Sysmex Corporation opened a new research and development center dedicated to advancing automated cell analysis technologies, including next-generation cell counters.

    Future Outlook

    Automated Cell Counters Market Future Outlook

    <p>The Automated Cell Counters Market is projected to grow at a 5.8% CAGR from 2024 to 2035, driven by technological advancements, increasing demand for precision diagnostics, and rising healthcare expenditures.</p>

    New opportunities lie in:

    • <p>Integration of AI for enhanced data analysis capabilities.</p>
    • <p>Development of portable cell counters for field applications.</p>
    • <p>Expansion into emerging markets with tailored product offerings.</p>

    <p>By 2035, the market is expected to solidify its position as a leader in diagnostic technology.</p>

    Market Segmentation

    Automated Cell Counters Market End-use Outlook

    • Pharmaceutical & biotechnology companies
    • Hospitals
    • Diagnostic laboratories
    • Research institutes
    • Others

    Automated Cell Counters Market Application Outlook

    • Blood Cells
    • Cell lines
    • Microbial cells
    • Others

    Automated Cell Counters Market Product Type Outlook

    • Fluorescence image-based cell counter
    • Flow cytometer
    • Coulter counter

    Report Scope

    MARKET SIZE 20246.771(USD Billion)
    MARKET SIZE 20257.164(USD Billion)
    MARKET SIZE 203512.59(USD Billion)
    COMPOUND ANNUAL GROWTH RATE (CAGR)5.8% (2024 - 2035)
    REPORT COVERAGERevenue Forecast, Competitive Landscape, Growth Factors, and Trends
    BASE YEAR2024
    Market Forecast Period2025 - 2035
    Historical Data2019 - 2024
    Market Forecast UnitsUSD Billion
    Key Companies ProfiledMarket analysis in progress
    Segments CoveredMarket segmentation analysis in progress
    Key Market OpportunitiesIntegration of artificial intelligence enhances accuracy and efficiency in the Automated Cell Counters Market.
    Key Market DynamicsTechnological advancements drive innovation in automated cell counters, enhancing accuracy and efficiency in laboratory settings.
    Countries CoveredNorth America, Europe, APAC, South America, MEA

    Market Highlights

    Author

    Rahul Gotadki
    Assistant Manager

    She holds an experience of about 6+ years in market research and business consulting, working under the spectrum of information communication technology, telecommunications and semiconductor domains. aarti conceptualizes and implements a scalable business strategy and provides strategic leadership to the clients. her expertise lies in market estimation, competitive intelligence, pipeline analysis, customer assessment, etc.

    Leave a Comment

    Latest Comments

    John Doe
    john@example.com

    This is a great article! Really helped me understand the topic better.

    Posted on July 23, 2025, 10:15 AM
    Jane Smith
    jane@domain.com

    Thanks for sharing this. I’ve bookmarked it for later reference.

    Posted on July 22, 2025, 7:45 PM

    FAQs

    What is the projected market valuation of the Automated Cell Counters Market by 2035?

    The Automated Cell Counters Market is projected to reach a valuation of 12.59 USD Billion by 2035.

    What was the market valuation of the Automated Cell Counters Market in 2024?

    In 2024, the market valuation of the Automated Cell Counters Market was 6.771 USD Billion.

    What is the expected CAGR for the Automated Cell Counters Market during the forecast period 2025 - 2035?

    The expected CAGR for the Automated Cell Counters Market during the forecast period 2025 - 2035 is 5.8%.

    Which product type segment is projected to have the highest growth in the Automated Cell Counters Market?

    The Flow cytometer segment is projected to grow from 2.8 USD Billion in 2024 to 5.0 USD Billion by 2035.

    What applications are driving growth in the Automated Cell Counters Market?

    Blood Cells and Cell lines applications are expected to drive growth, with Blood Cells projected to increase from 2.5 USD Billion to 4.5 USD Billion by 2035.

    Who are the key players in the Automated Cell Counters Market?

    Key players in the Automated Cell Counters Market include Beckman Coulter, Thermo Fisher Scientific, and Sysmex Corporation.

    1. Market Introduction\r\n 2.1. Definition\r\n
      1. Scope of the Study\r\n
        1. Research Objective\r\n
        2. Assumptions\r\n
        3. Limitations\r\n 3. Research Methodology\r\n
      2. Overview\r\n 3.2.
      3. Data Mining\r\n 3.3. Secondary Research\r\n
      4. Primary Research\r\n
        1. Primary Interviews and Information Gathering Process\r\n
        2. Breakdown of Primary Respondents\r\n
      5. Forecasting Modality\r\n
      6. Market Size Estimation\r\n
        1. Bottom-Up Approach\r\n
        2. Top-Down Approach\r\n 3.7. Data
      7. Triangulation\r\n 3.8. Validation\r\n
    2. Market Dynamics\r\n 4.1. Overview\r\n
      1. Drivers\r\n 4.3.
      2. Restraints\r\n 4.4. Opportunities\r\n
    3. Market Factor Analysis\r\n 5.1.
      1. Value Chain Analysis\r\n 5.2. Porter’s
      2. Five Forces Analysis\r\n 5.2.1.
      3. Bargaining Power of Suppliers\r\n
      4. COVID-19 Impact Analysis \r\n
    4. Bargaining Power of Buyers\r\n
    5. Threat of New Entrants\r\n
    6. Threat of Substitutes\r\n
    7. Intensity of Rivalry\r\n 5.3.
    8. Market Impact Analysis\r\n
    9. Regional Impact\r\n
    10. Opportunity and Threat Analysis\r\n 6. GLOBAL Automated
    11. cell counters MARKET, BY PRODUCT TYPE\r\n
      1. Overview\r\n 6.2. Fluorescence image-based
      2. cell counter\r\n 6.3. Flow cytometer\r\n
      3. Coulter counter\r\n 7. GLOBAL
    12. Automated cell counters MARKET, BY Application\r\n
      1. Overview\r\n 7.2. Blood Cells\r\n
      2. Cell lines\r\n 7.4.
      3. Microbial cells \r\n 7.5. Others\r\n
    13. GLOBAL Automated cell counters MARKET, BY END-USER\r\n
      1. Overview\r\n 8.2.
      2. Pharmaceutical & biotechnology companies\r\n
      3. Hospitals\r\n 8.4. Diagnostic
      4. laboratories\r\n 8.5. Research institutes\r\n
      5. Others\r\n 9. GLOBAL Automated
    14. cell counters MARKET, by Region\r\n 9.1. Overview\r\n
      1. North America\r\n
        1. U.S.\r\n
        2. Canada\r\n 9.3. Europe\r\n
        3. Germany\r\n
        4. France\r\n
        5. U.K\r\n 9.3.4.
        6. Rest of Europe\r\n
      2. Italy\r\n 9.3.5. Spain\r\n
      3. Asia-Pacific\r\n
        1. China\r\n 9.4.2.
        2. South Korea\r\n
        3. Australia\r\n
        4. Rest of Asia-Pacific\r\n
      4. India\r\n 9.4.3. Japan\r\n
      5. Rest of the World\r\n
        1. Middle East\r\n 9.5.2.
      6. Africa\r\n 9.5.3. Latin America\r\n
    15. Competitive Landscape\r\n 10.1.
      1. Overview\r\n 10.2. Competitive Analysis\r\n
      2. Market Share Analysis\r\n
      3. Major Growth Strategy in the Global Automated cell counters Market,\r\n
      4. Competitive Benchmarking\r\n
      5. Leading Players in Terms of Number of Developments in the Global
        1. New PRODUCT TYPE Launch/Application Deployment\r\n
        2. Merger & Acquisitions\r\n
        3. Joint Ventures\r\n
      6. Automated cell counters Market,\r\n 10.7.
      7. Key developments and Growth Strategies\r\n
      8. Major Players Financial Matrix \r\n
        1. Sales & Operating Income, 2022\r\n
        2. Major Players R&D Expenditure. 2022\r\n
    16. Company ProfileS\r\n 11.1. Eppendorf.\r\n
      1. Inc\r\n 11.3.1. Company Overview\r\n
      2. Hoffmann-La Roche Ltd\r\n 11.5.1.
      3. Company Overview\r\n 11.5.2.
      4. Financial Overview\r\n 11.5.3.
      5. PRODUCT TYPEs Offered\r\n 11.5.4.
      6. Key Developments\r\n 11.5.5.
      7. SWOT Analysis\r\n 11.5.6. Key
      8. Strategies\r\n 11.6. CHEMOMETEC A/S.\r\n
      9. Key Strategies\r\n 11.8. Beckman Coulter,
      10. Inc. (Danaher)\r\n 11.8.1. Company
      11. Overview\r\n 11.8.2. Financial
      12. Overview\r\n 11.8.3. PRODUCT
      13. TYPEs Offered\r\n 11.8.4. Key
      14. Developments\r\n 11.8.5. SWOT
      15. Analysis\r\n 11.8.6. Key Strategies\r\n
      16. Corporation\r\n 11.10.1. Company
      17. Overview\r\n 11.10.2. Financial
      18. Overview\r\n 11.10.3. PRODUCT
      19. TYPEs Offered\r\n 11.10.4. Key
      20. Developments\r\n 11.10.5. SWOT
      21. Analysis\r\n 11.10.6. Key Strategies\r\n
      22. Technologies, Inc\r\n 11.13.1.
      23. Company Overview\r\n 11.13.2.
      24. Financial Overview\r\n 11.13.3.
      25. PRODUCT TYPEs Offered\r\n 11.13.4.
      26. Key Developments\r\n 11.13.5.
      27. SWOT Analysis\r\n 11.13.6. Key
      28. Strategies\r\n 11.14. Abbott\r\n
    17. Company Overview\r\n
    18. Financial Overview\r\n
    19. PRODUCT TYPEs Offered\r\n
    20. Key Developments\r\n
    21. SWOT Analysis\r\n
    22. Key Strategies\r\n
      1. Thermo Fischer Scientific\r\n
        1. Company Overview\r\n
        2. Financial Overview\r\n
        3. PRODUCT TYPEs Offered\r\n
        4. Key Developments\r\n
        5. SWOT Analysis\r\n
        6. Key Strategies\r\n 11.3. Countstar,
        7. Financial Overview\r\n
        8. PRODUCT TYPEs Offered\r\n
        9. Key Developments\r\n
        10. SWOT Analysis\r\n
        11. Key Strategies\r\n
      2. Bio-Rad Laboratories, Inc\r\n
        1. Company Overview\r\n
        2. Financial Overview\r\n
        3. PRODUCT TYPEs Offered\r\n
        4. Key Developments\r\n
        5. SWOT Analysis\r\n
        6. Key Strategies\r\n 11.5. F.
        7. Company Overview\r\n
        8. Financial Overview\r\n
        9. PRODUCT TYPEs Offered\r\n
        10. Key Developments\r\n
        11. SWOT Analysis\r\n
        12. Key Strategies\r\n
      3. ALIGNEDGENETICS\r\n
        1. Company Overview\r\n
        2. Financial Overview\r\n
        3. PRODUCT TYPEs Offered\r\n
        4. Key Developments\r\n
        5. SWOT Analysis\r\n 11.7.6.
      4. Nanoentek.\r\n
        1. Company Overview\r\n
        2. Financial Overview\r\n
        3. PRODUCT TYPEs Offered\r\n
        4. Key Developments\r\n
        5. SWOT Analysis\r\n
        6. Key Strategies\r\n 11.10. Olympus
      5. MERCK KGaA\r\n
        1. Company Overview\r\n
        2. Financial Overview\r\n
        3. PRODUCT TYPEs Offered\r\n
        4. Key Developments\r\n
        5. SWOT Analysis\r\n
        6. Key Strategies\r\n
      6. Sysmex Corporation\r\n
        1. Company Overview\r\n
        2. Financial Overview\r\n
        3. PRODUCT TYPEs Offered\r\n
        4. Key Developments\r\n
        5. SWOT Analysis\r\n
        6. Key Strategies\r\n 11.13. Agilent
        7. Company Overview\r\n
        8. Financial Overview\r\n
        9. PRODUCT TYPEs Offered\r\n
        10. Key Developments\r\n
        11. SWOT Analysis\r\n
        12. Key Strategies\r\n
      7. Nexcelom Bioscience LLC\r\n
        1. Company Overview\r\n
        2. Financial Overview\r\n
        3. PRODUCT TYPEs Offered\r\n
        4. Key Developments\r\n
        5. SWOT Analysis\r\n
        6. Key Strategies\r\n 12. Appendix\r\n
      8. References\r\n
      9. Related Reports\r\n \r\nLIST OF TABLES\r\n
    23. Global Automated cell counters Market, Synopsis, 2018-2032\r\n
    24. Global Automated cell counters Market, Estimates & Forecast,
    25. counters MARKET, BY PRODUCT TYPE, 2018-2032 (USD BILLION)\r\n
    26. GLOBAL Automated cell counters MARKET, BY APPLICATION, 2018-2032 (USD BILLION)\r\n
    27. GLOBAL Automated cell counters MARKET, BY END-USER, 2018-2032 (USD
      1. BILLION)\r\n TABLE 6 North America Automated cell counters
    28. MARKET, BY PRODUCT TYPE, 2018-2032 (USD BILLION)\r\n TABLE
    29. North America Automated cell counters MARKET, BY APPLICATION, 2018-2032 (USD BILLION)\r\n
    30. North America Automated cell counters MARKET, BY END-USER, 2018-2032
      1. (USD BILLION)\r\n TABLE 9 North America Automated cell counters
    31. MARKET, BY Country, 2018-2032 (USD BILLION)\r\n TABLE 10
    32. U.S. Automated cell counters MARKET, BY PRODUCT TYPE, 2018-2032 (USD BILLION)\r\n
    33. U.S. Automated cell counters MARKET, BY APPLICATION, 2018-2032 (USD
      1. BILLION)\r\n TABLE 12 U.S. Automated cell counters MARKET,
      2. BY END-USER, 2018-2032 (USD BILLION)\r\n TABLE 13 Canada
    34. Automated cell counters MARKET, BY PRODUCT TYPE, 2018-2032 (USD BILLION)\r\n
    35. Canada Automated cell counters MARKET, BY APPLICATION, 2018-2032
      1. (USD BILLION)\r\n TABLE 15 Canada Automated cell counters
    36. MARKET, BY END-USER, 2018-2032 (USD BILLION)\r\n TABLE 16
    37. Europe Automated cell counters MARKET, BY PRODUCT TYPE, 2018-2032 (USD BILLION)\r\n
    38. Europe Automated cell counters MARKET, BY APPLICATION, 2018-2032
      1. (USD BILLION)\r\n TABLE 18 Europe Automated cell counters
    39. MARKET, BY END-USER, 2018-2032 (USD BILLION)\r\n TABLE 19
    40. Europe Automated cell counters MARKET, BY Country, 2018-2032 (USD BILLION)\r\n
    41. Germany Automated cell counters MARKET, BY PRODUCT TYPE, 2018-2032
      1. (USD BILLION)\r\n TABLE 21 Germany Automated cell counters
    42. MARKET, BY APPLICATION, 2018-2032 (USD BILLION)\r\n TABLE
    43. Germany Automated cell counters MARKET, BY END-USER, 2018-2032 (USD BILLION)\r\n
    44. France Automated cell counters MARKET, BY PRODUCT TYPE, 2018-2032
      1. (USD BILLION)\r\n TABLE 24 France Automated cell counters
    45. MARKET, BY APPLICATION, 2018-2032 (USD BILLION)\r\n TABLE
    46. France Automated cell counters MARKET, BY END-USER, 2018-2032 (USD BILLION)\r\n
    47. Italy Automated cell counters MARKET, BY PRODUCT TYPE, 2018-2032
      1. (USD BILLION)\r\n TABLE 27 Italy Automated cell counters
    48. MARKET, BY APPLICATION, 2018-2032 (USD BILLION)\r\n TABLE
    49. Italy Automated cell counters MARKET, BY END-USER, 2018-2032 (USD BILLION)\r\n
    50. Spain Automated cell counters MARKET, BY PRODUCT TYPE, 2018-2032
      1. (USD BILLION)\r\n TABLE 30 Spain Automated cell counters
    51. MARKET, BY APPLICATION, 2018-2032 (USD BILLION)\r\n TABLE
    52. Spain Automated cell counters MARKET, BY END-USER, 2018-2032 (USD BILLION)\r\n
    53. U.K Automated cell counters MARKET, BY PRODUCT TYPE, 2018-2032 (USD
      1. BILLION)\r\n TABLE 33 U.K Automated cell counters MARKET,
      2. BY APPLICATION, 2018-2032 (USD BILLION)\r\n TABLE 34 U.K
    54. Automated cell counters MARKET, BY END-USER, 2018-2032 (USD BILLION)\r\n
    55. Rest of Europe Automated cell counters MARKET, BY PRODUCT TYPE,
    56. cell counters MARKET, BY APPLICATION, 2018-2032 (USD BILLION)\r\n
    57. Rest of Europe Automated cell counters MARKET, BY END-USER, 2018-2032
      1. (USD BILLION)\r\n TABLE 38 Asia Pacific Automated cell counters
    58. MARKET, BY PRODUCT TYPE, 2018-2032 (USD BILLION)\r\n TABLE
    59. Asia Pacific Automated cell counters MARKET, BY APPLICATION, 2018-2032 (USD BILLION)\r\n
    60. Asia Pacific Automated cell counters MARKET, BY END-USER, 2018-2032
      1. (USD BILLION)\r\n TABLE 41 Asia Pacific Automated cell counters
    61. MARKET, BY Country, 2018-2032 (USD BILLION)\r\n TABLE 42
    62. Japan Automated cell counters MARKET, BY PRODUCT TYPE, 2018-2032 (USD BILLION)\r\n
    63. Japan Automated cell counters MARKET, BY APPLICATION, 2018-2032
      1. (USD BILLION)\r\n TABLE 44 Japan Automated cell counters
    64. MARKET, BY END-USER, 2018-2032 (USD BILLION)\r\n TABLE 45
    65. China Automated cell counters MARKET, BY PRODUCT TYPE, 2018-2032 (USD BILLION)\r\n
    66. China Automated cell counters MARKET, BY APPLICATION, 2018-2032
      1. (USD BILLION)\r\n TABLE 47 China Automated cell counters
    67. MARKET, BY END-USER, 2018-2032 (USD BILLION)\r\n TABLE 48
    68. India Automated cell counters MARKET, BY PRODUCT TYPE, 2018-2032 (USD BILLION)\r\n
    69. India Automated cell counters MARKET, BY APPLICATION, 2018-2032
      1. (USD BILLION)\r\n TABLE 50 India Automated cell counters
    70. MARKET, BY END-USER, 2018-2032 (USD BILLION)\r\n TABLE 51
    71. Australia Automated cell counters MARKET, BY PRODUCT TYPE, 2018-2032 (USD BILLION)\r\n
    72. Australia Automated cell counters MARKET, BY APPLICATION, 2018-2032
      1. (USD BILLION)\r\n TABLE 53 Australia Automated cell counters
    73. MARKET, BY END-USER, 2018-2032 (USD BILLION)\r\n TABLE 54
    74. south korea Automated cell counters MARKET, BY PRODUCT TYPE, 2018-2032 (USD BILLION)\r\n
    75. south korea Automated cell counters MARKET, BY APPLICATION, 2018-2032
      1. (USD BILLION)\r\n TABLE 56 south korea Automated cell counters
    76. MARKET, BY END-USER, 2018-2032 (USD BILLION)\r\n TABLE 57
    77. Rest of asia-pacific Automated cell counters MARKET, BY PRODUCT TYPE, 2018-2032
      1. (USD BILLION)\r\n TABLE 58 Rest of asia-pacific Automated
    78. cell counters MARKET, BY APPLICATION, 2018-2032 (USD BILLION)\r\n
    79. Rest of asia-pacific Automated cell counters MARKET, BY END-USER,
    80. cell counters MARKET, BY PRODUCT TYPE, 2018-2032 (USD BILLION)\r\n
    81. Rest of WOrld Automated cell counters MARKET, BY APPLICATION, 2018-2032
      1. (USD BILLION)\r\n TABLE 62 Rest of WOrld Automated cell
    82. counters MARKET, BY END-USER, 2018-2032 (USD BILLION)\r\n
    83. Rest of WOrld Automated cell counters MARKET, BY Country, 2018-2032 (USD
      1. BILLION)\r\n TABLE 64 Middle east Automated cell counters
    84. MARKET, BY PRODUCT TYPE, 2018-2032 (USD BILLION)\r\n TABLE
    85. Middle east Automated cell counters MARKET, BY APPLICATION, 2018-2032 (USD BILLION)\r\n
    86. Middle east Automated cell counters MARKET, BY END-USER, 2018-2032
      1. (USD BILLION)\r\n TABLE 67 Africa Automated cell counters
    87. MARKET, BY PRODUCT TYPE, 2018-2032 (USD BILLION)\r\n TABLE
    88. Africa Automated cell counters MARKET, BY APPLICATION, 2018-2032 (USD BILLION)\r\n
    89. Africa Automated cell counters MARKET, BY END-USER, 2018-2032 (USD
      1. BILLION)\r\n TABLE 70 Latin america Automated cell counters
    90. MARKET, BY PRODUCT TYPE, 2018-2032 (USD BILLION)\r\n TABLE
    91. Latin america Automated cell counters MARKET, BY APPLICATION, 2018-2032 (USD
      1. BILLION)\r\n TABLE 72 Latin america Automated cell counters
    92. MARKET, BY END-USER, 2018-2032 (USD BILLION)\r\nLIST OF FIGURES\r\n
    93. Research Process\r\n FIGURE 2 Market Structure
      1. for the Global Automated cell counters Market\r\n FIGURE
    94. Market Dynamics for the Global Automated cell counters Market\r\n
    95. Global Automated cell counters Market, Share (%), BY PRODUCT TYPE,
      1. Share (%), BY APPLICATION, 2022\r\n FIGURE 6 Global Automated
    96. cell counters Market, Share (%), BY END-USER, 2022\r\n FIGURE
    97. Global Automated cell counters Market, Share (%), by Region, 2022\r\n
    98. north AMERICA: Automated cell counters MARKET, SHARE (%), BY REGION,
      1. SHARE (%), BY REGION, 2022\r\n FIGURE 10 Asia-Pacific: Automated
    99. cell counters MARKET, SHARE (%), BY REGION, 2022\r\n
    100. Rest of the world: Automated cell counters MARKET, SHARE (%), BY REGION,
      1. Market: Company Share Analysis, 2022 (%)\r\n FIGURE 13 Eppendorf.:
      2. FINANCIAL OVERVIEW SNAPSHOT\r\n FIGURE 14 Eppendorf.: SWOT
      3. ANALYSIS \r\n FIGURE 15 Thermo Fischer Scientific:
      4. FINANCIAL OVERVIEW SNAPSHOT\r\n FIGURE 16 Thermo Fischer
      5. Scientific: SWOT ANALYSIS\r\n FIGURE 17 Countstar, Inc:
      6. FINANCIAL OVERVIEW SNAPSHOT\r\n FIGURE 18 Countstar, Inc:
      7. SWOT ANALYSIS\r\n FIGURE 19 Bio-Rad Laboratories, Inc: FINANCIAL
      8. OVERVIEW SNAPSHOT\r\n FIGURE 20 Bio-Rad Laboratories, Inc:
      9. SWOT ANALYSIS\r\n FIGURE 21 F. Hoffmann-La Roche Ltd.: FINANCIAL
      10. OVERVIEW SNAPSHOT\r\n FIGURE 22 F. Hoffmann-La Roche Ltd.:
      11. SWOT ANALYSIS \r\n FIGURE 23 CHEMOMETEC A/S.: FINANCIAL
      12. OVERVIEW SNAPSHOT\r\n FIGURE 24 CHEMOMETEC A/S.: SWOT ANALYSIS \r\n
    101. ALIGNEDGENETICS: FINANCIAL OVERVIEW SNAPSHOT \r\n
    102. ALIGNEDGENETICS: SWOT ANALYSIS\r\n FIGURE
    103. Beckman Coulter, Inc. (Danaher): FINANCIAL OVERVIEW SNAPSHOT\r\n
    104. Beckman Coulter, Inc. (Danaher): SWOT ANALYSIS \r\n
    105. Nanoentek.: FINANCIAL OVERVIEW SNAPSHOT\r\n
    106. Nanoentek.: SWOT ANALYSIS\r\n FIGURE 31 Olympus
      1. Corporation: FINANCIAL OVERVIEW SNAPSHOT\r\n FIGURE 32 Olympus
      2. Corporation: SWOT ANALYSIS \r\n FIGURE 33 MERCK KGaA.:
      3. FINANCIAL OVERVIEW SNAPSHOT\r\n FIGURE 34 MERCK KGaA.: SWOT
      4. ANALYSIS \r\n FIGURE 35 Sysmex Corporation.: FINANCIAL
      5. OVERVIEW SNAPSHOT\r\n FIGURE 36 Sysmex Corporation.: SWOT
      6. ANALYSIS \r\n FIGURE 37 Agilent Technologies, Inc.:
      7. FINANCIAL OVERVIEW SNAPSHOT\r\n FIGURE 38 Agilent Technologies,
      8. Inc.: SWOT ANALYSIS \r\n FIGURE 39 Abbott.: FINANCIAL
      9. OVERVIEW SNAPSHOT\r\n FIGURE 40 Abbott.: SWOT ANALYSIS \r\n
    107. Nexcelom Bioscience LLC.: FINANCIAL OVERVIEW SNAPSHOT\r\n
    108. Nexcelom Bioscience LLC.: SWOT ANALYSIS

    Automated Cell Counters Market Segmentation

    Market Segmentation Overview

    • Detailed segmentation data will be available in the full report
    • Comprehensive analysis by multiple parameters
    • Regional and country-level breakdowns
    • Market size forecasts by segment
    Infographic

    Free Sample Request

    Kindly complete the form below to receive a free sample of this Report

    Get Free Sample

    Customer Strories

    “I am very pleased with how market segments have been defined in a relevant way for my purposes (such as "Portable Freezers & refrigerators" and "last-mile"). In general the report is well structured. Thanks very much for your efforts.”

    Victoria Milne

    Founder
    Case Study
    Chemicals and Materials