• Cat-intel
  • MedIntelliX
  • Resources
  • About Us
  • Request Free Sample ×

    Kindly complete the form below to receive a free sample of this Report

    Leading companies partner with us for data-driven Insights

    clients tt-cursor

    Aquaculture Product Market

    ID: MRFR/F-B & N/23006-HCR
    128 Pages
    Snehal Singh
    September 2025

    Aquaculture Product Market Research Report By Type (Fin Fish, Crustaceans, Mollusks, Other), By Farming Method (Tank Based, Pond Based, Cage-Based, Recirculating Aquaculture System (RAS)), By Application (Food and Beverage, Pharmaceuticals, Nutraceuticals, Cosmetics), By Channel (Retail, Foodservice, Industrial, Online) and By Regional (North America, Europe, South America, Asia Pacific, Middle East and Africa) - Forecast to 2034

    Share:
    Download PDF ×

    We do not share your information with anyone. However, we may send you emails based on your report interest from time to time. You may contact us at any time to opt-out.

    Aquaculture Product Market Research Report — Global Forecast till 2034 Infographic
    Purchase Options
    $ 4,950.0
    $ 5,950.0
    $ 7,250.0
    Table of Contents

    Aquaculture Product Market Summary

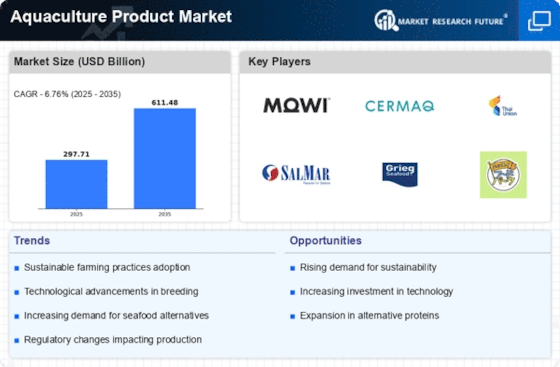
    The Global Aquaculture Product Market is projected to grow significantly from 297.7 USD Billion in 2024 to 611.7 USD Billion by 2035.

    Key Market Trends & Highlights

    Aquaculture Product Key Trends and Highlights

    • The market is expected to experience a compound annual growth rate (CAGR) of 6.77 percent from 2025 to 2035.
    • By 2035, the market valuation is anticipated to reach 611.7 USD Billion, indicating robust growth potential.
    • In 2024, the market is valued at 297.7 USD Billion, reflecting a strong foundation for future expansion.
    • Growing adoption of sustainable aquaculture practices due to increasing environmental concerns is a major market driver.

    Market Size & Forecast

    2024 Market Size 297.7 (USD Billion)
    2035 Market Size 611.7 (USD Billion)
    CAGR (2025-2035) 6.77%

    Major Players

    Cargill, Charoen Pokphand Foods, Cooke Aquaculture, Mowi, Thai Union Group

    Aquaculture Product Market Trends

    The continuous rise in the consumption of seafood and the worries regarding the depletion of natural fish populations are fuelling the growth of aquaculture. The use of technologies like recirculating aquaculture systems (RAS) makes it possible to grow aquaculture products in a safe and effective way. In addition, the introduction of new feed and the application of novel strategies are also aiding in the growth of the overall assessment.

    Key market drivers include the increase in population and urbanization since these are associated with a need for more food. Aquaculture products are a viable and healthy solution to conventional seafood scourges. Government policies promoting the aquaculture sector and sustainable activities have also helped in market expansion.

    Possible avenues for development in the aquaculture market include diversification into additional species and markets, creation of new value-added products and use of modern technology. By taking these chances, companies will position themselves highly amongst their peers, thus increasing the growth of the sector in the days to come.

    The Global Aquaculture Product Market is poised for robust growth, driven by increasing consumer demand for sustainable seafood and advancements in aquaculture technology.

    Food and Agriculture Organization of the United Nations (FAO)

    Aquaculture Product Market Drivers

    Rising Global Demand for Seafood

    The Global Aquaculture Product Market Industry experiences a notable surge in demand for seafood, driven by increasing consumer awareness regarding health benefits associated with fish consumption. In 2024, the market is valued at approximately 297.7 USD Billion, reflecting a growing preference for protein-rich diets. This trend is particularly pronounced in regions such as Asia-Pacific, where seafood is a dietary staple. Furthermore, the global population is projected to reach 9.7 billion by 2050, intensifying the need for sustainable food sources. As a result, aquaculture is positioned as a viable solution to meet this escalating demand.

    Technological Advancements in Aquaculture

    Innovations in aquaculture technology significantly enhance production efficiency and sustainability within the Global Aquaculture Product Market Industry. Techniques such as recirculating aquaculture systems (RAS) and integrated multi-trophic aquaculture (IMTA) are gaining traction, allowing for improved resource management and reduced environmental impact. These advancements not only optimize fish growth rates but also contribute to higher yields. As the industry adapts to these technologies, it is likely to attract investments, further propelling market growth. The integration of smart farming solutions, including IoT and AI, is expected to revolutionize operations, ensuring the sector remains competitive and sustainable.

    Government Support and Regulatory Frameworks

    Supportive government policies and regulatory frameworks play a crucial role in shaping the Global Aquaculture Product Market Industry. Many countries are implementing initiatives aimed at promoting sustainable aquaculture practices, providing financial incentives, and facilitating research and development. For instance, various governments have established funding programs to support aquaculture innovation and sustainability projects. This proactive approach not only fosters industry growth but also addresses environmental concerns associated with traditional fishing practices. As a result, the market is likely to witness increased investment and development, contributing to its projected growth to 611.7 USD Billion by 2035.

    Market Diversification and Product Innovation

    The Global Aquaculture Product Market Industry is characterized by a trend towards diversification and product innovation. Producers are exploring new species and value-added products to cater to evolving consumer preferences. This includes the introduction of alternative proteins, such as plant-based seafood and lab-grown fish, which are gaining traction among health-conscious consumers. Additionally, the development of ready-to-eat seafood products is expanding market reach and appealing to convenience-driven consumers. As the industry embraces innovation, it is expected to enhance its competitive edge, potentially leading to a compound annual growth rate (CAGR) of 6.77% from 2025 to 2035.

    Sustainability and Environmental Considerations

    Sustainability remains a pivotal driver within the Global Aquaculture Product Market Industry, as consumers increasingly prioritize environmentally friendly practices. The industry is witnessing a shift towards sustainable aquaculture methods that minimize ecological footprints and promote biodiversity. Practices such as organic aquaculture and responsible sourcing are gaining popularity, aligning with consumer preferences for ethically produced seafood. This trend is further supported by certifications and labeling initiatives that enhance transparency in the supply chain. As sustainability becomes a key differentiator, aquaculture producers are likely to invest in practices that not only meet regulatory standards but also resonate with environmentally conscious consumers.

    Market Segment Insights

    Get more detailed insights about Aquaculture Product Market Research Report — Global Forecast till 2034

    Regional Insights

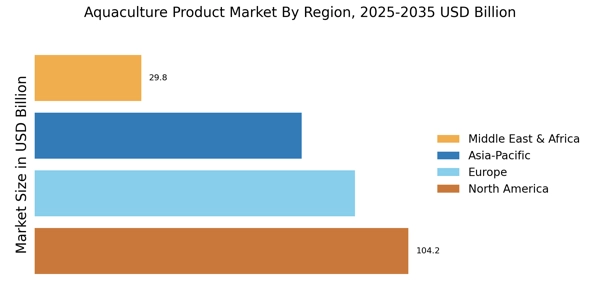
    The Aquaculture Product Market is segmented into regions comprising North America, Europe, Asia-Pacific, South America, and the Middle East and Africa. North America holds a prominent share of the market due to factors such as high seafood consumption, increasing aquaculture production, and technological advancements in the region. Europe represents a significant market for aquaculture products, driven by consumer preference for high-quality seafood and government initiatives promoting sustainable aquaculture practices.

    The Asia-Pacific region is projected to exhibit substantial growth in the coming years, attributed to rising demand from emerging economies such as China and India, along with favorable climatic conditions for aquaculture.South America, the Middle East, and Africa present opportunities for market expansion as aquaculture industries in these regions continue to develop and meet the growing demand for seafood.

    Aquaculture Product Market Regional

    Source Primary Research, Secondary Research, Market Research Future Database and Analyst Review

    Key Players and Competitive Insights

    Major players in the Aquaculture Product Market are constantly engaged in research and development to introduce innovative products and expand their product portfolios. Strategic collaborations and partnerships with other companies in the industry are common to strengthen market position and gain access to new technologies and markets. Leading Aquaculture Product Market players focus on expanding their presence through acquisitions and joint ventures, increasing their production capacity to meet growing demand. The Aquaculture Product Market industry is characterized by intense competition, with companies vying for market share through aggressive marketing strategies and product differentiation.

    Continuous technological advancements and sustainability initiatives are shaping the Aquaculture Product Market development, driving the industry towards more efficient and environmentally friendly practices.Cargill is a leading player in the Aquaculture Product Market industry, renowned for its extensive product portfolio and presence. With a strong focus on innovation, Cargill invests heavily in research and development to enhance its product offerings and meet the evolving needs of customers. The company operates in multiple segments of the Aquaculture Product Market, including fish feed, feed additives, and value-added products.

    Cargill's commitment to sustainability and responsible aquaculture practices has solidified its position as a trusted supplier in the industry.Mowi, a Norway-based company, is a major competitor in the Aquaculture Product Market, specializing in the production and distribution of Atlantic salmon. With a presence and vertically integrated operations, Mowi controls various aspects of the supply chain, from fish farming to processing and distribution. The company is known for its commitment to quality and sustainability, with a focus on reducing environmental impact and ensuring the welfare of its fish.

    Mowi's strong brand recognition and extensive distribution network contribute to its competitive position in the industry.

    Key Companies in the Aquaculture Product Market market include

    Industry Developments

    • Q3 2024: MSD Animal Health Completes Acquisition of Elanco's Aqua Business MSD Animal Health completed its acquisition of Elanco's aqua business, expanding its portfolio with fish health products including vaccines and anti-parasitic treatments for the aquaculture sector.[3]
    • Q1 2025: Seafood M&A stories that will define 2025's consolidation landscape: European bass, bream giant to be sold in Q1 Aqua Bridge Group, based in the UAE, is in advanced negotiations to acquire Avramar's Greek aquaculture assets, including fish farms and processing plants, marking a major consolidation in the European seabass and seabream sector.[2]
    • Q1 2025: Seafood M&A stories that will define 2025's consolidation landscape: Turkey's Kilic Holding acquires Agromey Turkey's Kilic Holding formally announced the acquisition of Agromey, one of the country's largest producers of bass and bream, expanding Kilic's market presence.[2]
    • Q1 2024: Captain Fresh aims for 2025 IPO after CenSea, Koral buyouts Captain Fresh closed its acquisition of Polish salmon smoker Koral and US-based frozen shrimp importer CenSea in early 2024, and is planning an IPO in 2025 with a targeted valuation of up to $1.5 billion.[1]
    • Q2 2025: Andfjord Salmon sells Kvalnes harbour area for NOK 400 million Andfjord Salmon sold its Kvalnes harbour area for NOK 400 million, representing a significant asset divestment in the Norwegian aquaculture sector.[4]
    • Q2 2025: Canadian High Liner Foods acquires two U.S. frozen seafood brands from Conagra Canadian High Liner Foods acquired two U.S. frozen seafood brands from Conagra, expanding its product portfolio in the North American aquaculture and seafood market.[4]
    • Q2 2025: Maruha Nichiro expands in Europe by acquiring Dutch processor Japanese seafood giant Maruha Nichiro acquired a Dutch seafood processor, strengthening its position in the European aquaculture product market.[4]
    • Q2 2025: Mowi sells non-integrated Dawnfresh Farming's trout farming assets Mowi sold the trout farming assets of Dawnfresh Farming, marking a strategic divestment in the aquaculture sector.[4]
    • Q2 2025: Espersen announces sale of processing plant to be closed in Lithuania Espersen announced the sale and planned closure of its processing plant in Lithuania, impacting its aquaculture product processing operations.[4]
    • Q3 2025: Bluefront-owned Seaqloud acquires sensor and service company Sematek Seaqloud, owned by Bluefront, acquired Sematek, a sensor and service company, to enhance its aquaculture technology offerings.[4]
    • Q3 2025: Aquaculture tech firm boosts data optimization with AI acquisition Norwegian aquaculture technology company OptoScale announced the acquisition of Optimeering Aqua, a provider of AI-powered production planning software, to strengthen its data optimization capabilities.[5]
    • Q3 2025: OptoScale to acquire AI production planning software provider Optimeering Aqua OptoScale will acquire Optimeering Aqua, an AI production planning software provider, to expand its technological capabilities in aquaculture operations.[4]

    Future Outlook

    Aquaculture Product Market Future Outlook

    The Global Aquaculture Product Market is poised for growth at a 6.77% CAGR from 2024 to 2035, driven by rising seafood demand, technological advancements, and sustainable practices.

    New opportunities lie in:

    • Invest in R&D for sustainable feed alternatives to enhance profitability.
    • Leverage digital aquaculture technologies for improved farm management efficiency.
    • Expand into emerging markets with tailored aquaculture solutions to capture new customer segments.

    By 2035, the market is expected to achieve substantial growth, reflecting evolving consumer preferences and sustainable practices.

    Market Segmentation

    Aquaculture Product Market Type Outlook

    • Fin Fish
    • Crustaceans
    • Mollusks
    • Other
    • Aquaculture Product Market Farming Method Outlook

    Aquaculture Product Market Channel Outlook

    • North America
    • Europe
    • South America
    • Asia Pacific
    • Middle East and Africa

    Aquaculture Product Market Regional Outlook

    • North America
    • Europe
    • South America
    • Asia Pacific
    • Middle East and Africa

    Aquaculture Product Market Application Outlook

    • Retail
    • Foodservice
    • Industrial
    • Online

    Aquaculture Product Market Farming Method Outlook

    • Food and Beverage
    • Pharmaceuticals
    • Nutraceuticals
    • Cosmetics

    Report Scope

    Report Attribute/Metric Details
    Market Size 2024  297.71 (USD Billion)
    Market Size 2025  317.84 (USD Billion)
    Market Size 2034  572.75 (USD Billion)
    Compound Annual Growth Rate (CAGR) 6.8% (2025 - 2034)
    Report Coverage Revenue Forecast, Competitive Landscape, Growth Factors, and Trends
    Base Year 2024
    Market Forecast Period 2025 - 2034
    Historical Data 2019 - 2023
    Market Forecast Units USD Billion
    Key Companies Profiled Mowi, Cargill, Cooke Aquaculture, Tassal Group, Bakkafrost, Blue Harvest Fisheries, SalMar, Nissui, Grieg Seafood, Cermaq, Thai Union Group, Highline Mushrooms, Australis Aquaculture
    Segments Covered Type, Farming Method, Application, Channel, Regional
    Key Market Opportunities 1 Increasing demand for sustainable seafood2 Growing popularity of aquaculture in developing countries3 Advancements in aquaculture technology4 Government support for aquaculture development5 Rising consumer awareness of health benefits
    Key Market Dynamics Increasing consumer demand Technological advancements Sustainable seafood trend Government initiatives Expanding aquaculture infrastructure
    Countries Covered North America, Europe, APAC, South America, MEA

    Market Highlights

    Author
    Snehal Singh
    Assistant Manager - Research

    High acumen in analyzing complex macro & micro markets with more than 6 years of work experience in the field of market research. By implementing her analytical skills in forecasting and estimation into market research reports, she has expertise in Packaging, Construction, and Equipment domains. She handles a team size of 20-25 resources and ensures smooth running of the projects, associated marketing activities, and client servicing.

    Leave a Comment

    FAQs

    What is the market size of the Aquaculture Product Market?

    The Aquaculture Product Market is expected to reach USD 572.75 billion by 2034, exhibiting a CAGR of 6.8% during the forecast period (2025-2034).

    Which region is expected to dominate the Aquaculture Product Market?

    North America is anticipated to dominate the Aquaculture Product Market over the forecast period due to the increasing demand for seafood, coupled with favorable government regulations and technological advancements in the region.

    What are the key growth drivers of the Aquaculture Product Market?

    Rising population, increasing disposable income, growing health consciousness, and the expansion of the food service industry are some of the primary growth drivers of the Aquaculture Product Market.

    Which species segment is expected to hold the largest market share?

    The finfish segment is projected to account for the largest market share during the forecast period due to the high consumption of species such as salmon, tilapia, and catfish.

    Who are the key competitors in the Aquaculture Product Market?

    Some of the prominent players in the Aquaculture Product Market include Mowi, Cermaq, Cargill, Thai Union, and Cooke Aquaculture.

    What is the expected CAGR of the Aquaculture Product Market in the Asia-Pacific region?

    The Aquaculture Product Market in the Asia-Pacific region is anticipated to witness a CAGR of 7.2% during the forecast period.

    Which application segment is expected to grow at the fastest rate?

    The fresh segment is projected to exhibit the highest growth rate during the forecast period due to the increasing preference for fresh seafood among consumers.

    What are the challenges faced by the Aquaculture Product Market?

    Some of the challenges faced by the Aquaculture Product Market include environmental concerns, disease outbreaks, and fluctuating prices of raw materials.

    What is the projected market size of the Aquaculture Product Market in North America?

    The Aquaculture Product Market in North America is expected to reach USD 120.5 billion by 2034.

    Which distribution channel is expected to gain popularity in the Aquaculture Product Market?

    The online distribution channel is anticipated to gain traction in the Aquaculture Product Market due to the growing popularity of e-commerce and the convenience offered to consumers.

    1. 'TABLE
    2. OF CONTENTS
    3. EXECUTIVE SUMMARY
      1. Market Overview
      2. Key Findings
      3. Market Segmentation
      4. Competitive Landscape
      5. Challenges
    4. and Opportunities
      1. Future Outlook
    5. MARKET INTRODUCTION
      1. Definition
      2. Scope of the study
        1. Research Objective
        2. Assumption
        3. Limitations
    6. RESEARCH METHODOLOGY
      1. Overview
      2. Data Mining
      3. Secondary
    7. Research
    8. Primary Research
    9. Primary Interviews and Information Gathering Process
      1. Breakdown of Primary Respondents
      2. Forecasting
    10. Model
    11. Market Size Estimation
      1. Bottom-Up Approach
        1. Top-Down Approach
      2. Data Triangulation
      3. Validation
    12. MARKET DYNAMICS
      1. Overview
      2. Drivers
      3. Restraints
      4. Opportunities
    13. MARKET FACTOR ANALYSIS
    14. Value chain Analysis
      1. Porter''s Five Forces Analysis
        1. Bargaining Power of Suppliers
        2. Bargaining Power
    15. of Buyers
    16. Threat of New Entrants
      1. Threat of Substitutes
        1. Intensity of Rivalry
      2. COVID-19 Impact Analysis
        1. Market Impact
    17. Analysis
    18. Regional Impact
    19. Opportunity and Threat Analysis
    20. AQUACULTURE PRODUCT MARKET, BY TYPE (USD BILLION)
      1. Fin Fish
      2. Crustaceans
      3. Mollusks
      4. Other
    21. AQUACULTURE
    22. PRODUCT MARKET, BY FARMING METHOD (USD BILLION)
      1. Tank Based
      2. Pond Based
      3. Cage-Based
      4. Recirculating Aquaculture System (RAS)
    23. AQUACULTURE
    24. PRODUCT MARKET, BY APPLICATION (USD BILLION)
      1. Food and Beverage
      2. Pharmaceuticals
      3. Nutraceuticals
      4. Cosmetics
    25. AQUACULTURE PRODUCT MARKET, BY CHANNEL (USD BILLION)
      1. Retail
      2. Foodservice
      3. Industrial
      4. Online
    26. AQUACULTURE
    27. PRODUCT MARKET, BY REGIONAL (USD BILLION)
      1. North America
        1. US
        2. Canada
      2. Europe
        1. Germany
        2. UK
        3. France
        4. Russia
        5. Italy
        6. Spain
        7. Rest of Europe
      3. APAC
        1. China
        2. India
        3. Japan
        4. South Korea
        5. Malaysia
        6. Thailand
        7. Indonesia
        8. Rest of APAC
      4. South America
        1. Brazil
        2. Mexico
        3. Argentina
        4. Rest of South America
      5. MEA
        1. GCC Countries
        2. South Africa
        3. Rest of
    28. MEA
    29. COMPETITIVE LANDSCAPE
      1. Overview
      2. Competitive Analysis
      3. Market share Analysis
      4. Major Growth Strategy in
    30. the Aquaculture Product Market
      1. Competitive Benchmarking
      2. Leading Players in Terms of Number of Developments
    31. in the Aquaculture Product Market
      1. Key developments and growth strategies
        1. New Product Launch/Service
    32. Deployment
    33. Merger & Acquisitions
      1. Joint Ventures
      2. Major Players Financial Matrix
        1. Sales and Operating
    34. Income
    35. Major Players R&D Expenditure. 2023
    36. COMPANY PROFILES
      1. Mowi
        1. Financial Overview
        2. Products Offered
        3. Key Developments
        4. SWOT Analysis
        5. Key Strategies
      2. Cargill
        1. Financial
    37. Overview
    38. Products Offered
    39. Key Developments
    40. SWOT Analysis
    41. Key Strategies
    42. Cooke Aquaculture
      1. Financial Overview
        1. Products Offered
        2. Key Developments
        3. SWOT Analysis
        4. Key Strategies
      2. Tassal Group
        1. Financial
    43. Overview
    44. Products Offered
    45. Key Developments
    46. SWOT Analysis
    47. Key Strategies
    48. Bakkafrost
    49. Financial Overview
      1. Products Offered
        1. Key Developments
        2. SWOT Analysis
        3. Key Strategies
      2. Blue Harvest
    50. Fisheries
    51. Financial Overview
      1. Products Offered
        1. Key Developments
        2. SWOT Analysis
        3. Key Strategies
      2. SalMar
        1. Financial
    52. Overview
    53. Products Offered
    54. Key Developments
    55. SWOT Analysis
    56. Key Strategies
    57. Nissui
    58. Financial Overview
      1. Products Offered
        1. Key Developments
        2. SWOT Analysis
        3. Key Strategies
      2. Grieg Seafood
        1. Financial
    59. Overview
    60. Products Offered
    61. Key Developments
    62. SWOT Analysis
    63. Key Strategies
    64. Cermaq
    65. Financial Overview
      1. Products Offered
        1. Key Developments
        2. SWOT Analysis
        3. Key Strategies
      2. Thai Union
    66. Group
    67. Financial Overview
      1. Products Offered
        1. Key Developments
        2. SWOT Analysis
        3. Key Strategies
      2. Highline
    68. Mushrooms
    69. Financial Overview
      1. Products Offered
        1. Key Developments
        2. SWOT Analysis
        3. Key Strategies
      2. Australis
    70. Aquaculture
    71. Financial Overview
      1. Products Offered
        1. Key Developments
        2. SWOT Analysis
        3. Key Strategies
    72. APPENDIX
      1. References
      2. Related Reports
    73. ASSUMPTIONS
    74. NORTH AMERICA AQUACULTURE PRODUCT MARKET SIZE ESTIMATES & FORECAST, BY TYPE,
    75. 2032 (USD BILLIONS)
    76. FORECAST, BY FARMING METHOD, 2019-2032 (USD BILLIONS)
    77. SIZE ESTIMATES & FORECAST, BY APPLICATION, 2019-2032 (USD BILLIONS)
    78. AMERICA AQUACULTURE PRODUCT MARKET SIZE ESTIMATES & FORECAST, BY CHANNEL, 2019-2032
    79. (USD BILLIONS)
    80. NORTH AMERICA AQUACULTURE PRODUCT MARKET SIZE ESTIMATES & FORECAST, BY REGIONAL,
    81. 2032 (USD BILLIONS)
    82. BY TYPE, 2019-2032 (USD BILLIONS)
    83. FORECAST, BY FARMING METHOD, 2019-2032 (USD BILLIONS)
    84. & FORECAST, BY APPLICATION, 2019-2032 (USD BILLIONS)
    85. MARKET SIZE ESTIMATES & FORECAST, BY CHANNEL, 2019-2032 (USD BILLIONS)
    86. PRODUCT MARKET SIZE ESTIMATES & FORECAST, BY REGIONAL, 2019-2032 (USD BILLIONS)
    87. AQUACULTURE PRODUCT MARKET SIZE ESTIMATES & FORECAST, BY TYPE, 2019-2032 (USD
    88. BILLIONS)
    89. CANADA AQUACULTURE PRODUCT MARKET SIZE ESTIMATES & FORECAST, BY FARMING
    90. METHOD, 2019-2032 (USD BILLIONS)
    91. & FORECAST, BY APPLICATION, 2019-2032 (USD BILLIONS)
    92. PRODUCT MARKET SIZE ESTIMATES & FORECAST, BY CHANNEL, 2019-2032 (USD BILLIONS)
    93. AQUACULTURE PRODUCT MARKET SIZE ESTIMATES & FORECAST, BY REGIONAL, 2019-2032
    94. (USD BILLIONS)
    95. EUROPE AQUACULTURE PRODUCT MARKET SIZE ESTIMATES & FORECAST, BY TYPE, 2019-2032
    96. (USD BILLIONS)
    97. EUROPE AQUACULTURE PRODUCT MARKET SIZE ESTIMATES & FORECAST, BY FARMING
    98. METHOD, 2019-2032 (USD BILLIONS)
    99. & FORECAST, BY APPLICATION, 2019-2032 (USD BILLIONS)
    100. PRODUCT MARKET SIZE ESTIMATES & FORECAST, BY CHANNEL, 2019-2032 (USD BILLIONS)
    101. AQUACULTURE PRODUCT MARKET SIZE ESTIMATES & FORECAST, BY REGIONAL, 2019-2032
    102. (USD BILLIONS)
    103. GERMANY AQUACULTURE PRODUCT MARKET SIZE ESTIMATES & FORECAST, BY TYPE, 2019-2032
    104. (USD BILLIONS)
    105. GERMANY AQUACULTURE PRODUCT MARKET SIZE ESTIMATES & FORECAST, BY FARMING
    106. METHOD, 2019-2032 (USD BILLIONS)
    107. & FORECAST, BY APPLICATION, 2019-2032 (USD BILLIONS)
    108. PRODUCT MARKET SIZE ESTIMATES & FORECAST, BY CHANNEL, 2019-2032 (USD BILLIONS)
    109. AQUACULTURE PRODUCT MARKET SIZE ESTIMATES & FORECAST, BY REGIONAL, 2019-2032
    110. (USD BILLIONS)
    111. UK AQUACULTURE PRODUCT MARKET SIZE ESTIMATES & FORECAST, BY TYPE, 2019-2032
    112. (USD BILLIONS)
    113. UK AQUACULTURE PRODUCT MARKET SIZE ESTIMATES & FORECAST, BY FARMING METHOD,
    114. 2032 (USD BILLIONS)
    115. BY APPLICATION, 2019-2032 (USD BILLIONS)
    116. & FORECAST, BY CHANNEL, 2019-2032 (USD BILLIONS)
    117. & FORECAST, BY REGIONAL, 2019-2032 (USD BILLIONS)
    118. ESTIMATES & FORECAST, BY TYPE, 2019-2032 (USD BILLIONS)
    119. PRODUCT MARKET SIZE ESTIMATES & FORECAST, BY FARMING METHOD, 2019-2032 (USD
    120. BILLIONS)
    121. FRANCE AQUACULTURE PRODUCT MARKET SIZE ESTIMATES & FORECAST, BY APPLICATION,
    122. 2032 (USD BILLIONS)
    123. BY CHANNEL, 2019-2032 (USD BILLIONS)
    124. ESTIMATES & FORECAST, BY REGIONAL, 2019-2032 (USD BILLIONS)
    125. PRODUCT MARKET SIZE ESTIMATES & FORECAST, BY TYPE, 2019-2032 (USD BILLIONS)
    126. AQUACULTURE PRODUCT MARKET SIZE ESTIMATES & FORECAST, BY FARMING METHOD, 2019-2032
    127. (USD BILLIONS)
    128. RUSSIA AQUACULTURE PRODUCT MARKET SIZE ESTIMATES & FORECAST, BY APPLICATION,
    129. 2032 (USD BILLIONS)
    130. BY CHANNEL, 2019-2032 (USD BILLIONS)
    131. ESTIMATES & FORECAST, BY REGIONAL, 2019-2032 (USD BILLIONS)
    132. PRODUCT MARKET SIZE ESTIMATES & FORECAST, BY TYPE, 2019-2032 (USD BILLIONS)
    133. AQUACULTURE PRODUCT MARKET SIZE ESTIMATES & FORECAST, BY FARMING METHOD, 2019-2032
    134. (USD BILLIONS)
    135. ITALY AQUACULTURE PRODUCT MARKET SIZE ESTIMATES & FORECAST, BY APPLICATION,
    136. 2032 (USD BILLIONS)
    137. BY CHANNEL, 2019-2032 (USD BILLIONS)
    138. & FORECAST, BY REGIONAL, 2019-2032 (USD BILLIONS)
    139. & FORECAST, BY TYPE, 2019-2032 (USD BILLIONS)
    140. & FORECAST, BY FARMING METHOD, 2019-2032 (USD BILLIONS)
    141. MARKET SIZE ESTIMATES & FORECAST, BY APPLICATION, 2019-2032 (USD BILLIONS)
    142. AQUACULTURE PRODUCT MARKET SIZE ESTIMATES & FORECAST, BY CHANNEL, 2019-2032
    143. (USD BILLIONS)
    144. SPAIN AQUACULTURE PRODUCT MARKET SIZE ESTIMATES & FORECAST, BY REGIONAL,
    145. 2032 (USD BILLIONS)
    146. & FORECAST, BY TYPE, 2019-2032 (USD BILLIONS)
    147. SIZE ESTIMATES & FORECAST, BY FARMING METHOD, 2019-2032 (USD BILLIONS)
    148. OF EUROPE AQUACULTURE PRODUCT MARKET SIZE ESTIMATES & FORECAST, BY APPLICATION,
    149. 2032 (USD BILLIONS)
    150. & FORECAST, BY CHANNEL, 2019-2032 (USD BILLIONS)
    151. SIZE ESTIMATES & FORECAST, BY REGIONAL, 2019-2032 (USD BILLIONS)
    152. PRODUCT MARKET SIZE ESTIMATES & FORECAST, BY TYPE, 2019-2032 (USD BILLIONS)
    153. AQUACULTURE PRODUCT MARKET SIZE ESTIMATES & FORECAST, BY FARMING METHOD, 2019-2032
    154. (USD BILLIONS)
    155. APAC AQUACULTURE PRODUCT MARKET SIZE ESTIMATES & FORECAST, BY APPLICATION,
    156. 2032 (USD BILLIONS)
    157. BY CHANNEL, 2019-2032 (USD BILLIONS)
    158. & FORECAST, BY REGIONAL, 2019-2032 (USD BILLIONS)
    159. & FORECAST, BY TYPE, 2019-2032 (USD BILLIONS)
    160. & FORECAST, BY FARMING METHOD, 2019-2032 (USD BILLIONS)
    161. MARKET SIZE ESTIMATES & FORECAST, BY APPLICATION, 2019-2032 (USD BILLIONS)
    162. AQUACULTURE PRODUCT MARKET SIZE ESTIMATES & FORECAST, BY CHANNEL, 2019-2032
    163. (USD BILLIONS)
    164. CHINA AQUACULTURE PRODUCT MARKET SIZE ESTIMATES & FORECAST, BY REGIONAL,
    165. 2032 (USD BILLIONS)
    166. BY TYPE, 2019-2032 (USD BILLIONS)
    167. & FORECAST, BY FARMING METHOD, 2019-2032 (USD BILLIONS)
    168. MARKET SIZE ESTIMATES & FORECAST, BY APPLICATION, 2019-2032 (USD BILLIONS)
    169. AQUACULTURE PRODUCT MARKET SIZE ESTIMATES & FORECAST, BY CHANNEL, 2019-2032
    170. (USD BILLIONS)
    171. INDIA AQUACULTURE PRODUCT MARKET SIZE ESTIMATES & FORECAST, BY REGIONAL,
    172. 2032 (USD BILLIONS)
    173. BY TYPE, 2019-2032 (USD BILLIONS)
    174. & FORECAST, BY FARMING METHOD, 2019-2032 (USD BILLIONS)
    175. MARKET SIZE ESTIMATES & FORECAST, BY APPLICATION, 2019-2032 (USD BILLIONS)
    176. AQUACULTURE PRODUCT MARKET SIZE ESTIMATES & FORECAST, BY CHANNEL, 2019-2032
    177. (USD BILLIONS)
    178. JAPAN AQUACULTURE PRODUCT MARKET SIZE ESTIMATES & FORECAST, BY REGIONAL,
    179. 2032 (USD BILLIONS)
    180. FORECAST, BY TYPE, 2019-2032 (USD BILLIONS)
    181. SIZE ESTIMATES & FORECAST, BY FARMING METHOD, 2019-2032 (USD BILLIONS)
    182. KOREA AQUACULTURE PRODUCT MARKET SIZE ESTIMATES & FORECAST, BY APPLICATION,
    183. 2032 (USD BILLIONS)
    184. FORECAST, BY CHANNEL, 2019-2032 (USD BILLIONS)
    185. SIZE ESTIMATES & FORECAST, BY REGIONAL, 2019-2032 (USD BILLIONS)
    186. PRODUCT MARKET SIZE ESTIMATES & FORECAST, BY TYPE, 2019-2032 (USD BILLIONS)
    187. AQUACULTURE PRODUCT MARKET SIZE ESTIMATES & FORECAST, BY FARMING METHOD, 2019-2032
    188. (USD BILLIONS)
    189. MALAYSIA AQUACULTURE PRODUCT MARKET SIZE ESTIMATES & FORECAST, BY APPLICATION,
    190. 2032 (USD BILLIONS)
    191. FORECAST, BY CHANNEL, 2019-2032 (USD BILLIONS)
    192. ESTIMATES & FORECAST, BY REGIONAL, 2019-2032 (USD BILLIONS)
    193. PRODUCT MARKET SIZE ESTIMATES & FORECAST, BY TYPE, 2019-2032 (USD BILLIONS)
    194. AQUACULTURE PRODUCT MARKET SIZE ESTIMATES & FORECAST, BY FARMING METHOD, 2019-2032
    195. (USD BILLIONS)
    196. THAILAND AQUACULTURE PRODUCT MARKET SIZE ESTIMATES & FORECAST, BY APPLICATION,
    197. 2032 (USD BILLIONS)
    198. FORECAST, BY CHANNEL, 2019-2032 (USD BILLIONS)
    199. ESTIMATES & FORECAST, BY REGIONAL, 2019-2032 (USD BILLIONS)
    200. PRODUCT MARKET SIZE ESTIMATES & FORECAST, BY TYPE, 2019-2032 (USD BILLIONS)
    201. AQUACULTURE PRODUCT MARKET SIZE ESTIMATES & FORECAST, BY FARMING METHOD, 2019-2032
    202. (USD BILLIONS)
    203. INDONESIA AQUACULTURE PRODUCT MARKET SIZE ESTIMATES & FORECAST, BY APPLICATION,
    204. 2032 (USD BILLIONS)
    205. FORECAST, BY CHANNEL, 2019-2032 (USD BILLIONS)
    206. ESTIMATES & FORECAST, BY REGIONAL, 2019-2032 (USD BILLIONS)
    207. AQUACULTURE PRODUCT MARKET SIZE ESTIMATES & FORECAST, BY TYPE, 2019-2032 (USD
    208. BILLIONS)
    209. REST OF APAC AQUACULTURE PRODUCT MARKET SIZE ESTIMATES & FORECAST, BY FARMING
    210. METHOD, 2019-2032 (USD BILLIONS)
    211. & FORECAST, BY APPLICATION, 2019-2032 (USD BILLIONS)
    212. PRODUCT MARKET SIZE ESTIMATES & FORECAST, BY CHANNEL, 2019-2032 (USD BILLIONS)
    213. OF APAC AQUACULTURE PRODUCT MARKET SIZE ESTIMATES & FORECAST, BY REGIONAL, 2019-2032
    214. (USD BILLIONS)
    215. SOUTH AMERICA AQUACULTURE PRODUCT MARKET SIZE ESTIMATES & FORECAST, BY
    216. TYPE, 2019-2032 (USD BILLIONS)
    217. ESTIMATES & FORECAST, BY FARMING METHOD, 2019-2032 (USD BILLIONS)
    218. AMERICA AQUACULTURE PRODUCT MARKET SIZE ESTIMATES & FORECAST, BY APPLICATION,
    219. 2032 (USD BILLIONS)
    220. & FORECAST, BY CHANNEL, 2019-2032 (USD BILLIONS)
    221. SIZE ESTIMATES & FORECAST, BY REGIONAL, 2019-2032 (USD BILLIONS)
    222. PRODUCT MARKET SIZE ESTIMATES & FORECAST, BY TYPE, 2019-2032 (USD BILLIONS)
    223. AQUACULTURE PRODUCT MARKET SIZE ESTIMATES & FORECAST, BY FARMING METHOD, 2019-2032
    224. (USD BILLIONS)
    225. BRAZIL AQUACULTURE PRODUCT MARKET SIZE ESTIMATES & FORECAST, BY APPLICATION,
    226. 2032 (USD BILLIONS)
    227. BY CHANNEL, 2019-2032 (USD BILLIONS)
    228. ESTIMATES & FORECAST, BY REGIONAL, 2019-2032 (USD BILLIONS)
    229. PRODUCT MARKET SIZE ESTIMATES & FORECAST, BY TYPE, 2019-2032 (USD BILLIONS)
    230. AQUACULTURE PRODUCT MARKET SIZE ESTIMATES & FORECAST, BY FARMING METHOD, 2019-2032
    231. (USD BILLIONS)
    232. MEXICO AQUACULTURE PRODUCT MARKET SIZE ESTIMATES & FORECAST, BY APPLICATION,
    233. 2032 (USD BILLIONS)
    234. BY CHANNEL, 2019-2032 (USD BILLIONS)
    235. ESTIMATES & FORECAST, BY REGIONAL, 2019-2032 (USD BILLIONS)
    236. AQUACULTURE PRODUCT MARKET SIZE ESTIMATES & FORECAST, BY TYPE, 2019-2032 (USD
    237. BILLIONS)
    238. ARGENTINA AQUACULTURE PRODUCT MARKET SIZE ESTIMATES & FORECAST, BY FARMING
    239. METHOD, 2019-2032 (USD BILLIONS)
    240. & FORECAST, BY APPLICATION, 2019-2032 (USD BILLIONS)
    241. PRODUCT MARKET SIZE ESTIMATES & FORECAST, BY CHANNEL, 2019-2032 (USD BILLIONS)
    242. AQUACULTURE PRODUCT MARKET SIZE ESTIMATES & FORECAST, BY REGIONAL, 2019-2032
    243. (USD BILLIONS)
    244. REST OF SOUTH AMERICA AQUACULTURE PRODUCT MARKET SIZE ESTIMATES & FORECAST,
    245. BY TYPE, 2019-2032 (USD BILLIONS)
    246. SIZE ESTIMATES & FORECAST, BY FARMING METHOD, 2019-2032 (USD BILLIONS)
    247. OF SOUTH AMERICA AQUACULTURE PRODUCT MARKET SIZE ESTIMATES & FORECAST, BY APPLICATION,
    248. 2032 (USD BILLIONS)
    249. & FORECAST, BY CHANNEL, 2019-2032 (USD BILLIONS)
    250. MARKET SIZE ESTIMATES & FORECAST, BY REGIONAL, 2019-2032 (USD BILLIONS)
    251. AQUACULTURE PRODUCT MARKET SIZE ESTIMATES & FORECAST, BY TYPE, 2019-2032 (USD
    252. BILLIONS)
    253. MEA AQUACULTURE PRODUCT MARKET SIZE ESTIMATES & FORECAST, BY FARMING METHOD,
    254. 2032 (USD BILLIONS)
    255. BY APPLICATION, 2019-2032 (USD BILLIONS)
    256. & FORECAST, BY CHANNEL, 2019-2032 (USD BILLIONS)
    257. & FORECAST, BY REGIONAL, 2019-2032 (USD BILLIONS)
    258. SIZE ESTIMATES & FORECAST, BY TYPE, 2019-2032 (USD BILLIONS)
    259. AQUACULTURE PRODUCT MARKET SIZE ESTIMATES & FORECAST, BY FARMING METHOD, 2019-2032
    260. (USD BILLIONS)
    261. GCC COUNTRIES AQUACULTURE PRODUCT MARKET SIZE ESTIMATES & FORECAST, BY
    262. APPLICATION, 2019-2032 (USD BILLIONS)
    263. SIZE ESTIMATES & FORECAST, BY CHANNEL, 2019-2032 (USD BILLIONS)
    264. AQUACULTURE PRODUCT MARKET SIZE ESTIMATES & FORECAST, BY REGIONAL, 2019-2032
    265. (USD BILLIONS)
    266. SOUTH AFRICA AQUACULTURE PRODUCT MARKET SIZE ESTIMATES & FORECAST, BY TYPE,
    267. 2032 (USD BILLIONS)
    268. FORECAST, BY FARMING METHOD, 2019-2032 (USD BILLIONS)
    269. SIZE ESTIMATES & FORECAST, BY APPLICATION, 2019-2032 (USD BILLIONS)
    270. AFRICA AQUACULTURE PRODUCT MARKET SIZE ESTIMATES & FORECAST, BY CHANNEL, 2019-2032
    271. (USD BILLIONS)
    272. SOUTH AFRICA AQUACULTURE PRODUCT MARKET SIZE ESTIMATES & FORECAST, BY REGIONAL,
    273. 2032 (USD BILLIONS)
    274. FORECAST, BY TYPE, 2019-2032 (USD BILLIONS)
    275. SIZE ESTIMATES & FORECAST, BY FARMING METHOD, 2019-2032 (USD BILLIONS)
    276. OF MEA AQUACULTURE PRODUCT MARKET SIZE ESTIMATES & FORECAST, BY APPLICATION,
    277. 2032 (USD BILLIONS)
    278. FORECAST, BY CHANNEL, 2019-2032 (USD BILLIONS)
    279. SIZE ESTIMATES & FORECAST, BY REGIONAL, 2019-2032 (USD BILLIONS)
    280. DEVELOPMENT/APPROVAL
    281. PRODUCT MARKET ANALYSIS
    282. PRODUCT MARKET ANALYSIS BY FARMING METHOD
    283. BY APPLICATION
    284. US AQUACULTURE PRODUCT MARKET ANALYSIS BY CHANNEL
    285. BY REGIONAL
    286. CANADA AQUACULTURE PRODUCT MARKET ANALYSIS BY TYPE
    287. BY FARMING METHOD
    288. AQUACULTURE PRODUCT MARKET ANALYSIS BY CHANNEL
    289. BY REGIONAL
    290. EUROPE AQUACULTURE PRODUCT MARKET ANALYSIS
    291. BY TYPE
    292. GERMANY AQUACULTURE PRODUCT MARKET ANALYSIS BY FARMING METHOD
    293. PRODUCT MARKET ANALYSIS BY APPLICATION
    294. BY CHANNEL
    295. GERMANY AQUACULTURE PRODUCT MARKET ANALYSIS BY REGIONAL
    296. MARKET ANALYSIS BY TYPE
    297. PRODUCT MARKET ANALYSIS BY APPLICATION
    298. BY CHANNEL
    299. UK AQUACULTURE PRODUCT MARKET ANALYSIS BY REGIONAL
    300. BY TYPE
    301. FRANCE AQUACULTURE PRODUCT MARKET ANALYSIS BY FARMING METHOD
    302. PRODUCT MARKET ANALYSIS BY APPLICATION
    303. BY CHANNEL
    304. FRANCE AQUACULTURE PRODUCT MARKET ANALYSIS BY REGIONAL
    305. PRODUCT MARKET ANALYSIS BY TYPE
    306. FARMING METHOD
    307. RUSSIA AQUACULTURE PRODUCT MARKET ANALYSIS BY APPLICATION
    308. PRODUCT MARKET ANALYSIS BY CHANNEL
    309. REGIONAL
    310. ITALY AQUACULTURE PRODUCT MARKET ANALYSIS BY TYPE
    311. BY FARMING METHOD
    312. AQUACULTURE PRODUCT MARKET ANALYSIS BY CHANNEL
    313. BY REGIONAL
    314. SPAIN AQUACULTURE PRODUCT MARKET ANALYSIS BY TYPE
    315. BY FARMING METHOD
    316. AQUACULTURE PRODUCT MARKET ANALYSIS BY CHANNEL
    317. BY REGIONAL
    318. REST OF EUROPE AQUACULTURE PRODUCT MARKET ANALYSIS BY TYPE
    319. PRODUCT MARKET ANALYSIS BY FARMING METHOD
    320. ANALYSIS BY APPLICATION
    321. OF EUROPE AQUACULTURE PRODUCT MARKET ANALYSIS BY REGIONAL
    322. MARKET ANALYSIS
    323. CHINA AQUACULTURE PRODUCT MARKET ANALYSIS BY TYPE
    324. BY FARMING METHOD
    325. AQUACULTURE PRODUCT MARKET ANALYSIS BY CHANNEL
    326. BY REGIONAL
    327. INDIA AQUACULTURE PRODUCT MARKET ANALYSIS BY TYPE
    328. BY FARMING METHOD
    329. AQUACULTURE PRODUCT MARKET ANALYSIS BY CHANNEL
    330. BY REGIONAL
    331. JAPAN AQUACULTURE PRODUCT MARKET ANALYSIS BY TYPE
    332. BY FARMING METHOD
    333. AQUACULTURE PRODUCT MARKET ANALYSIS BY CHANNEL
    334. BY REGIONAL
    335. SOUTH KOREA AQUACULTURE PRODUCT MARKET ANALYSIS BY TYPE
    336. PRODUCT MARKET ANALYSIS BY FARMING METHOD
    337. ANALYSIS BY APPLICATION
    338. KOREA AQUACULTURE PRODUCT MARKET ANALYSIS BY REGIONAL
    339. BY TYPE
    340. MALAYSIA AQUACULTURE PRODUCT MARKET ANALYSIS BY FARMING METHOD
    341. PRODUCT MARKET ANALYSIS BY APPLICATION
    342. BY CHANNEL
    343. MALAYSIA AQUACULTURE PRODUCT MARKET ANALYSIS BY REGIONAL
    344. PRODUCT MARKET ANALYSIS BY TYPE
    345. BY FARMING METHOD
    346. AQUACULTURE PRODUCT MARKET ANALYSIS BY CHANNEL
    347. BY REGIONAL
    348. INDONESIA AQUACULTURE PRODUCT MARKET ANALYSIS BY TYPE
    349. PRODUCT MARKET ANALYSIS BY FARMING METHOD
    350. BY APPLICATION
    351. INDONESIA AQUACULTURE PRODUCT MARKET ANALYSIS BY CHANNEL
    352. PRODUCT MARKET ANALYSIS BY REGIONAL
    353. ANALYSIS BY TYPE
    354. REST OF APAC AQUACULTURE PRODUCT MARKET ANALYSIS BY FARMING METHOD
    355. OF APAC AQUACULTURE PRODUCT MARKET ANALYSIS BY APPLICATION
    356. PRODUCT MARKET ANALYSIS BY CHANNEL
    357. BY REGIONAL
    358. SOUTH AMERICA AQUACULTURE PRODUCT MARKET ANALYSIS
    359. BY TYPE
    360. BRAZIL AQUACULTURE PRODUCT MARKET ANALYSIS BY FARMING METHOD
    361. PRODUCT MARKET ANALYSIS BY APPLICATION
    362. BY CHANNEL
    363. BRAZIL AQUACULTURE PRODUCT MARKET ANALYSIS BY REGIONAL
    364. PRODUCT MARKET ANALYSIS BY TYPE
    365. FARMING METHOD
    366. MEXICO AQUACULTURE PRODUCT MARKET ANALYSIS BY APPLICATION
    367. PRODUCT MARKET ANALYSIS BY CHANNEL
    368. REGIONAL
    369. ARGENTINA AQUACULTURE PRODUCT MARKET ANALYSIS BY TYPE
    370. PRODUCT MARKET ANALYSIS BY FARMING METHOD
    371. ANALYSIS BY APPLICATION
    372. AQUACULTURE PRODUCT MARKET ANALYSIS BY REGIONAL
    373. MARKET ANALYSIS BY TYPE
    374. BY FARMING METHOD
    375. BY APPLICATION
    376. REST OF SOUTH AMERICA AQUACULTURE PRODUCT MARKET ANALYSIS BY CHANNEL
    377. OF SOUTH AMERICA AQUACULTURE PRODUCT MARKET ANALYSIS BY REGIONAL
    378. PRODUCT MARKET ANALYSIS
    379. COUNTRIES AQUACULTURE PRODUCT MARKET ANALYSIS BY FARMING METHOD
    380. AQUACULTURE PRODUCT MARKET ANALYSIS BY APPLICATION
    381. ANALYSIS BY CHANNEL
    382. AFRICA AQUACULTURE PRODUCT MARKET ANALYSIS BY TYPE
    383. ANALYSIS BY FARMING METHOD
    384. AFRICA AQUACULTURE PRODUCT MARKET ANALYSIS BY CHANNEL
    385. ANALYSIS BY REGIONAL
    386. OF MEA AQUACULTURE PRODUCT MARKET ANALYSIS BY FARMING METHOD
    387. PRODUCT MARKET ANALYSIS BY APPLICATION
    388. ANALYSIS BY CHANNEL
    389. BUYING CRITERIA OF AQUACULTURE PRODUCT MARKET
    390. OF AQUACULTURE PRODUCT MARKET
    391. MARKET
    392. RESTRAINTS IMPACT ANALYSIS: AQUACULTURE PRODUCT MARKET
    393. AQUACULTURE PRODUCT MARKET
    394. PRODUCT MARKET, BY TYPE, 2025–2034 (USD Billions)
    395. MARKET, BY FARMING METHOD, 2024 (% SHARE)
    396. METHOD, 2025–2034 (USD Billions)
    397. (% SHARE)
    398. AQUACULTURE PRODUCT MARKET, BY APPLICATION, 2025–2034 (USD Billions)
    399. PRODUCT MARKET, BY CHANNEL, 2024 (% SHARE)
    400. –2034 (USD Billions)
    401. (% SHARE)
    402. AQUACULTURE PRODUCT MARKET, BY REGIONAL, 2025–2034 (USD Billions)
    403. OF MAJOR COMPETITORS'

    Aquaculture Product Market Segmentation

    Market Segmentation Overview

    • Detailed segmentation data will be available in the full report
    • Comprehensive analysis by multiple parameters
    • Regional and country-level breakdowns
    • Market size forecasts by segment
    Report Infographic
    Free Sample Request

    Kindly complete the form below to receive a free sample of this Report

    Customer Strories

    “I am very pleased with how market segments have been defined in a relevant way for my purposes (such as "Portable Freezers & refrigerators" and "last-mile"). In general the report is well structured. Thanks very much for your efforts.”

    Victoria Milne Founder
    Case Study

    Chemicals and Materials