• Cat-intel
  • MedIntelliX
  • Resources
  • About Us
  • Request Free Sample ×

    Kindly complete the form below to receive a free sample of this Report

    Leading companies partner with us for data-driven Insights

    clients tt-cursor

    Aqua Ammonia Market

    ID: MRFR/CnM/31545-HCR
    111 Pages
    Chitranshi Jaiswal
    September 2025

    Aqua Ammonia Market Research Report By Application (Fertilizers, Industrial Refrigeration, Water Treatment, Chemical Manufacturing), By End Use (Agriculture, Chemical Industry, Food Beverage, Pharmaceuticals), By Concentration (Low Concentration, Medium Concentration, High Concentration), By Form (Liquid, Solid, Gas) and By Regional (North America, Europe, South America, Asia Pacific, Middle East and Africa) - Forecast to 2034.

    Share:
    Download PDF ×

    We do not share your information with anyone. However, we may send you emails based on your report interest from time to time. You may contact us at any time to opt-out.

    Aqua Ammonia Market Research Report - Global Forecast till 2034 Infographic
    Purchase Options
    $ 4,950.0
    $ 5,950
    $ 7,250.0
    Table of Contents

    Aqua Ammonia Market Summary

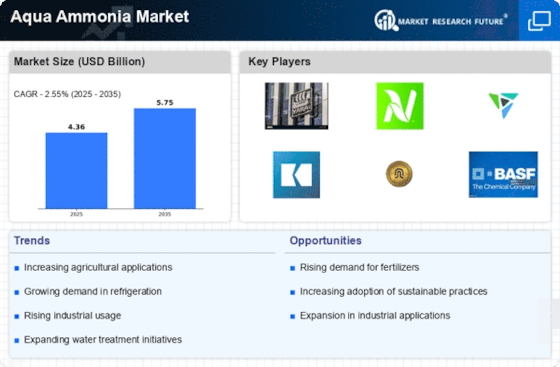
    The global aqua ammonia market is projected to grow steadily from 4.36 USD billion in 2024 to 5.76 USD billion by 2035.

    Key Market Trends & Highlights

    Aqua Ammonia Key Trends and Highlights

    • The market is expected to experience a compound annual growth rate (CAGR) of 2.56 percent from 2025 to 2035.
    • By 2035, the market valuation is anticipated to reach 5.76 USD billion, reflecting a robust growth trajectory.
    • In 2024, the market is valued at 4.36 USD billion, indicating a solid foundation for future expansion.
    • Growing adoption of aqua ammonia in agricultural applications due to its effectiveness as a nitrogen source is a major market driver.

    Market Size & Forecast

    2024 Market Size 4.36 (USD Billion)
    2035 Market Size 5.76 (USD Billion)
    CAGR (2025-2035) 2.56%

    Major Players

    Agrium, BASF, Koch Industries, Indian Farmers Fertiliser Cooperative, Nutrien, OCI N.V., Karnalyte Resources, Helena AgriEnterprises, CF Industries, Yara International, OCP Group, Tata Chemicals, Arab Potash Company, Land O'Lakes

    Aqua Ammonia Market Trends

    The  aqua ammonia market is driven by a strong demand in various industries, particularly agriculture and water treatment. As a key component of fertilizers, aqua ammonia plays a vital role in enhancing crop yields and ensuring food security. The increasing  population and urbanization are raising the need for sustainable agricultural practices, further boosting the demand for this compound. Additionally, the growing focus on environmental regulations encourages the use of aqua ammonia as a cleaner alternative in industrial processes, promoting its adoption in different applications.

    The global aqua ammonia market appears to be experiencing a steady demand, driven by its applications in agriculture and industrial processes, suggesting a potential for growth in various sectors.

    U.S. Geological Survey

    Aqua Ammonia Market Drivers

    Industrial Applications

    The Global Aqua Ammonia Market Industry benefits from diverse industrial applications, particularly in the production of chemicals and as a refrigerant. Industries such as textiles, pharmaceuticals, and food processing utilize aqua ammonia for its effective properties. Its role in the synthesis of various chemicals, including ammonium sulfate and ammonium nitrate, underscores its importance in industrial processes. The growing industrialization across developing nations further propels the demand for aqua ammonia, as it is integral to numerous manufacturing processes. This broad applicability suggests a sustained growth trajectory for the market, aligning with the overall expansion of industrial sectors globally.

    Market Growth Projections

    The Global Aqua Ammonia Market Industry is poised for growth, with projections indicating a market value of 4.36 USD Billion in 2024 and an anticipated increase to 5.76 USD Billion by 2035. This growth trajectory suggests a steady demand for aqua ammonia, driven by its applications in agriculture, industry, and environmental sustainability. The compound annual growth rate (CAGR) of 2.56% from 2025 to 2035 further underscores the market's potential. These figures illustrate the increasing recognition of aqua ammonia's versatility and its role in addressing global challenges related to food security and environmental sustainability.

    Rising Demand in Agriculture

    The Global Aqua Ammonia Market Industry experiences a notable surge in demand from the agricultural sector, primarily due to its application as a nitrogen source in fertilizers. As the global population continues to grow, the need for efficient agricultural practices intensifies. Aqua ammonia serves as a cost-effective solution for enhancing crop yields, thus driving its adoption. In 2024, the market is projected to reach 4.36 USD Billion, reflecting the increasing reliance on nitrogenous fertilizers. This trend is expected to persist, with the market anticipated to grow at a CAGR of 2.56% from 2025 to 2035, reaching 5.76 USD Billion by 2035.

    Technological Advancements in Production

    Technological innovations in the production of aqua ammonia are driving efficiency and reducing costs within the Global Aqua Ammonia Market Industry. Advances in synthesis methods and process optimization have led to improved yield rates and lower energy consumption. These developments not only enhance the economic viability of aqua ammonia but also contribute to its competitive positioning against alternative nitrogen sources. As technology continues to evolve, it is expected that production capacities will expand, further supporting market growth. The integration of cutting-edge technologies may also lead to the development of more sustainable production practices, aligning with global sustainability goals.

    Growing Awareness of Sustainable Practices

    The Global Aqua Ammonia Market Industry is witnessing a shift towards sustainable agricultural and industrial practices. Stakeholders are increasingly recognizing the benefits of using aqua ammonia as a sustainable nitrogen source, which contributes to soil health and reduces environmental impact. This growing awareness is prompting farmers and manufacturers to adopt aqua ammonia in their operations, thereby driving market demand. As sustainability becomes a focal point in global policies and consumer preferences, the market for aqua ammonia is likely to expand. This trend reflects a broader movement towards environmentally responsible practices across various sectors.

    Environmental Regulations Favoring Ammonia Solutions

    The Global Aqua Ammonia Market Industry is influenced by stringent environmental regulations aimed at reducing greenhouse gas emissions. Aqua ammonia is recognized for its lower environmental impact compared to other nitrogen sources, making it a preferred choice for industries seeking to comply with sustainability standards. Governments worldwide are implementing policies that encourage the use of eco-friendly alternatives, thus bolstering the demand for aqua ammonia. This regulatory landscape not only supports market growth but also aligns with global efforts to mitigate climate change. As industries adapt to these regulations, aqua ammonia's role is likely to become increasingly prominent.

    Market Segment Insights

    Aqua Ammonia Market Application Insights

    The  Aqua Ammonia Market revenue, projected at 4.15 USD Billion in 2023, is significantly influenced by its applications across various sectors, including Fertilizers, Industrial Refrigeration, Water Treatment, and Chemical Manufacturing. The Fertilizers segment holds a substantial position in the market, with a valuation of 1.55 USD Billion in 2023. This segment is crucial as Aqua Ammonia is a key nitrogen source in agricultural practices, enhancing crop yields and nutritional soil content.

    Following this, the Industrial Refrigeration application is valued at 1.1 USD Billion in 2023, indicating its role in providing efficient cooling solutions across various industries, particularly food preservation and storage.The Water Treatment segment is another significant area, valued at 1.25 USD Billion in 2023, where Aqua Ammonia acts as an essential reagent in treating wastewater and ensuring safe drinking water. Finally, the Chemical Manufacturing segment, valued at 0.25 USD Billion in 2023, although relatively smaller, plays a vital role in the production of various chemicals and is essential for maintaining the quality of chemical processes.

    Together, these applications shape the  Aqua Ammonia Market statistics, revealing trends towards environmentally friendly practices and efficient resource management, emphasizing the growing demand for Aqua Ammonia in various sectors, driven by increasing population and industrialization.Each application area presents opportunities for growth, with the Fertilizers segment projecting significant future expansion as  agricultural demands rise while Industrial Refrigeration continues to adapt to stricter environmental regulations. However, the market also faces challenges, including fluctuating raw material prices and regulatory constraints, requiring continuous innovation and adaptation in the Aqua Ammonia Market industry to meet evolving needs.

    The overall market growth is expected to reflect these dynamics, with further developments anticipated in technology and sustainability practices, thereby presenting a comprehensive view of the Aqua Ammonia landscape through its diverse applications and their implications on market performance.

    Source: Primary Research, Secondary Research, Market Research Future Database and Analyst Review

    Aqua Ammonia Market End Use Insights

    The Aqua Ammonia Market serves various end-use industries, highlighting its diverse applications and importance in different sectors. In 2023, the overall market was valued at 4.15 USD Billion, reflecting the significance of aqua ammonia in enhancing agricultural productivity through its use as a fertilizer, which supports crop growth by providing essential nitrogen. Similarly, the chemical industry relies heavily on aqua ammonia for manufacturing various chemicals, showcasing its critical role in chemical production processes.

    In the Food Beverage sector, aqua ammonia is utilized for various applications, indicating its essential role in maintaining product quality and processing efficiency.Furthermore, the pharmaceuticals industry benefits from aqua ammonia during the production of certain medications, emphasizing its importance in healthcare. Each sector demonstrates robust demand for aqua ammonia, contributing to the overall  Aqua Ammonia Market revenue and driving market growth by leveraging the chemical's versatility and effectiveness in applications.

    As these industries evolve, trends indicate that innovative uses of aqua ammonia will continue to emerge, enhancing its positioning in the  Aqua Ammonia Market statistics and supporting sustainable practices across sectors.

    Aqua Ammonia Market Concentration Insights

    The  Aqua Ammonia Market is projected to reach a value of 4.15 USD Billion by 2023, reflecting steady growth in the concentration segment. This segment is crucial as it encompasses various levels of concentration low, medium, and high, which cater to diverse industrial applications. Low concentration aqua ammonia is integral in agriculture as a nutrient source, while medium concentration finds applications in refrigeration and water treatment.

    High concentration is often favored in manufacturing processes, reflecting significant demand among end-users.The  Aqua Ammonia Market segmentation reveals that the high concentration segment dominates due to its extensive use in chemical synthesis and industrial applications. Moreover, as industries focus on efficient ammonia utilization and environmental sustainability, the increasing trend toward medium concentration formulations becomes evident in market growth dynamics.

    The growing demand for aqua ammonia in agriculture and other industries drives the  Aqua Ammonia Market revenue, adding to the complexity and opportunity within this varied concentration landscape.Robust  Aqua Ammonia Market data underlines the significance of each concentration category, contributing to a broader understanding of market trends and competitive positioning.

    Aqua Ammonia Market Form Insights

    The  Aqua Ammonia Market, valued at 4.15 USD Billion in 2023, is a crucial area of focus, particularly within the Form segment, which encompasses Liquid, Solid, and Gas forms of aqua ammonia. Each of these forms plays a significant role in various industrial applications, contributing to the overall market dynamics. Liquid aqua ammonia dominates the market due to its versatile usage in agriculture as a fertilizer, which is a primary driver of demand.

    Solid and Gas forms, while comparatively smaller, are important for specific applications, including refrigeration and metal treatment processes.The consistent growth in sectors utilizing these forms indicates a robust demand for aqua ammonia across multiple industries. Furthermore, the  Aqua Ammonia Market data reveals a steady market growth, driven by rising agriculture needs and industrial applications, despite facing challenges such as environmental regulations.

    As the market continues to evolve, opportunities for innovation in production and handling methods for each form of aqua ammonia are emerging, enhancing their usability and efficiency in various applications, thus cementing their importance in the  Aqua Ammonia Market industry.

    Get more detailed insights about Aqua Ammonia Market Research Report - Global Forecast till 2034

    Regional Insights

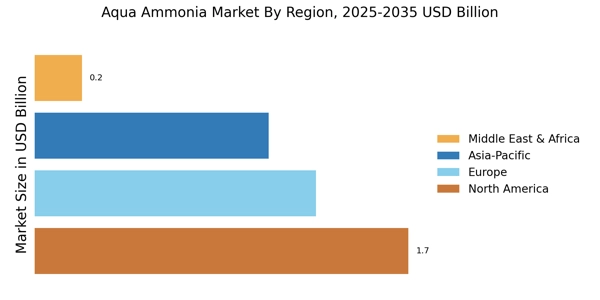
    The  Aqua Ammonia Market shows a diversified regional presence, with North America, Europe, APAC, South America, and MEA being integral contributors to its growth. In 2023, North America accounted for a valuation of 0.846 USD Billion, with a projected increase to 1.073 USD Billion by 2032, underlining its significance within the market. Europe closely follows with a valuation of 0.967 USD Billion in 2023, expected to rise to 1.238 USD Billion in 2032, highlighting its robust industrial applications.

    The APAC region dominates the market, valued at 1.209 USD Billion in 2023 and anticipated to grow to 1.527 USD Billion by 2032, driven by increasing agricultural demands and industrial uses.Meanwhile, South America and MEA, both valued at 0.564 USD Billion in 2023, are projected to grow to 0.702 USD Billion and 0.66 USD Billion, respectively, by 2032, suggesting emerging opportunities in these regions. Overall, the  Aqua Ammonia Market revenue is underpinned by strong demand trends and applications across these regions, with APAC holding the majority share due to rapid industrialization and agricultural expansion.

    Aqua Ammonia Market Regional

    Source: Primary Research, Secondary Research, Market Research Future Database and Analyst Review

    Key Players and Competitive Insights

    The  aqua ammonia market is characterized by its diverse applications and robust demand across various sectors, notably agriculture, industrial processes, and water treatment. As a compound that combines ammonia and water, aqua ammonia presents a versatile solution for nitrogen supply, enhancing crop yield and acting as a critical component in various chemical processes. The competitive landscape of this market is shaped by the presence of both established and emerging players who strive to innovate and optimize their product offerings. Market dynamics are influenced by factors such as pricing strategies, technological advancements, regulatory frameworks, and sustainability practices.

    The market's competitiveness is further manifested through strategic partnerships, mergers and acquisitions, and an increasing focus on research and development to meet rising  demands.Agrium has established a significant presence in the  aqua ammonia market, leveraging its extensive experience in the agricultural sector and a deep understanding of nutrient needs. It capitalizes on its strong supply chain and distribution networks, ensuring the efficient delivery of aqua ammonia to various agricultural producers. The company’s strengths lie in its commitment to innovation in fertilizer production and the promotion of environmentally friendly practices, aligning with the  shift towards sustainable agriculture.

    Agrium's strategic investments in enhancing production capabilities and expanding its technological expertise have contributed to its competitive advantage, enabling it to meet the diverse needs of farmers and industrial customers alike.BASF stands out in the  aqua ammonia market by emphasizing its commitment to product quality and consistent supply. The company's robust research and development initiatives underpin its strength in creating innovative solutions that meet stringent regulatory standards and customer requirements. BASF’s extensive market reach and established brand reputation enable it to cater to a wide range of applications, from agricultural to industrial uses.

    The company’s investments in cutting-edge technologies and sustainable production methods position it well within the market, enhancing its ability to adapt to changing consumer demands and environmental regulations. BASF’s focus on sustainability also plays a crucial role in fostering long-term relationships with customers and stakeholders, further solidifying its competitive stance in the aqua ammonia sector.

    Key Companies in the Aqua Ammonia Market market include

    Industry Developments

    The  Aqua Ammonia Market has recently experienced significant developments, particularly with companies like Nutrien and CF Industries pushing forward with expansion strategies to bolster their market presence. Nutrien has announced plans to increase production capacity, anticipating a rise in demand for nitrogen-based fertilizers, while CF Industries has been investing in technology to enhance efficiency in aqua ammonia production. Meanwhile, Yara International has made strides in diversifying its product offerings, which is expected to affect market dynamics positively. Agrium and OCI N.V. are also exploring collaborations to leverage synergies in mineral processing and sustainable agricultural practices.

    In terms of mergers and acquisitions, reports indicate that Koch Industries is in discussions to acquire a stake in a promising aqua ammonia venture, which could reshape competitive standings in the market. The overall market valuation of companies like Helena AgriEnterprises and Arab Potash Company is witnessing growth, driven by escalating agricultural demand and innovative marketing strategies. The ongoing developments indicate a trend towards consolidation, efficiency, and enhanced product offerings among the major players in the  Aqua Ammonia Market.

    Future Outlook

    Aqua Ammonia Market Future Outlook

    The Aqua Ammonia Market is projected to grow at a 2.56% CAGR from 2024 to 2035, driven by increasing agricultural demand and industrial applications.

    New opportunities lie in:

    • Develop eco-friendly aqua ammonia production methods to attract sustainability-focused clients.
    • Expand distribution networks in emerging markets to capitalize on rising agricultural needs.
    • Invest in research for innovative applications in refrigeration and wastewater treatment sectors.

    By 2035, the Aqua Ammonia Market is expected to solidify its position as a key player in global agriculture and industrial sectors.

    Market Segmentation

    Aqua Ammonia Market Form Outlook

    • Liquid
    • Solid
    • Gas

    Aqua Ammonia Market End Use Outlook

    • Agriculture
    • Chemical Industry
    • Food Beverage
    • Pharmaceuticals

    Aqua Ammonia Market Regional Outlook

    • North America
    • Europe
    • South America
    • Asia Pacific
    • Middle East and Africa

    Aqua Ammonia Market Application Outlook

    • Fertilizers
    • Industrial Refrigeration
    • Water Treatment
    • Chemical Manufacturing

    Aqua Ammonia Market Concentration Outlook

    • Low Concentration
    • Medium Concentration
    • High Concentration

    Report Scope

    Report Attribute/Metric Details
    Market Size 2024  4.36 (USD Billion)
    Market Size 2025 4.47 (USD Billion)
    Market Size 2034 5.61 (USD Billion)
    Compound Annual Growth Rate (CAGR) 2.6% (2025 - 2034)
    Report Coverage Revenue Forecast, Competitive Landscape, Growth Factors, and Trends
    Base Year 2024
    Market Forecast Period 2025 - 2034
    Historical Data 2020 - 2024
    Market Forecast Units USD Billion
    Key Companies Profiled Agrium, BASF, Koch Industries, Indian Farmers Fertiliser Cooperative, Nutrien, OCI N.V., Karnalyte Resources, Helena AgriEnterprises, CF Industries, Yara International, OCP Group, Tata Chemicals, Arab Potash Company, Land O'Lakes
    Segments Covered Application, End Use, Concentration, Form, Regional
    Key Market Opportunities Growing demand in agriculture, Sustainable fertilizer production, Expansion in industrial applications, Development of renewable energy sources, Increased adoption of refrigeration systems
    Key Market Dynamics Rising agricultural demand, Environmental regulations impact, Growth in chemical manufacturing, Increasing industrial applications, Competitive pricing pressures
    Countries Covered North America, Europe, APAC, South America, MEA

    Market Highlights

    Author
    Chitranshi Jaiswal
    Research Analyst Level I

    In her 3 years of experience in the market research field, she has handled critical cross-domain projects. She has an in-depth knowledge of market estimation & analysis, problem-solving, primary as well as secondary research, and team management.She holds an engineering degree and is an MBA professional from a well-known university, capable of evaluating the market and competitive conditions. An exceptional strategist with excellent communication skills and a passion for delivering cutting-edge & practical insights for the market. Proficient in multi-tasking, and can successfully deal with competing demands, while maintaining complete confidentiality. Generated business through active client and project development, networking, and high-quality responses. Her knowledge and skills have helped in making solid business decisions, securing funding from investors, and avoiding business failures.

    Leave a Comment

    FAQs

    What is the expected market size of the Aqua Ammonia Market by 2034?

    The Aqua Ammonia Market is expected to be valued at 5.61 billion USD by the year 2034.

    What is the projected CAGR for the Aqua Ammonia Market from 2025 to 2034?

    The Aqua Ammonia Market is anticipated to grow at a CAGR of 2.6% from 2025 to 2034.

    Which application segment is expected to have the largest market size by 2032?

    The Fertilizers application segment is projected to be valued at 1.9 billion USD by 2032.

    What market size is anticipated for the Industrial Refrigeration application by 2032?

    The Industrial Refrigeration application is expected to reach a market size of 1.35 billion USD by 2032.

    Which region is expected to dominate the Aqua Ammonia Market by 2032?

    The APAC region is predicted to dominate with a market size of 1.527 billion USD by 2032.

    What is the expected market value of North America for the Aqua Ammonia Market by 2032?

    North America is anticipated to have a market value of 1.073 billion USD by the year 2032.

    Who are some of the key players in the Aqua Ammonia Market?

    Major players include Agrium, BASF, Koch Industries, and Nutrien among others.

    What is the expected market value of the Water Treatment application segment by 2032?

    The Water Treatment application segment is expected to be valued at 1.55 billion USD by the year 2032.

    What market size is projected for South America in the Aqua Ammonia Market by 2032?

    South America is expected to reach a market size of 0.702 billion USD by the year 2032.

    What is the anticipated market size for the Chemical Manufacturing application by 2032?

    The Chemical Manufacturing application is estimated to reach a market size of 0.4 billion USD by the year 2032.

    1. EXECUTIVE SUMMARY
      1. Market Overview
      2. Key Findings
      3. Market Segmentation
      4. Competitive Landscape
      5. Challenges and Opportunities
      6. Future Outlook
    2. MARKET INTRODUCTION
      1. Definition
      2. Scope of the study
        1. Research
    3. Objective
      1. Assumption
        1. Limitations
    4. RESEARCH
    5. METHODOLOGY
      1. Overview
      2. Data Mining
      3. Secondary Research
      4. Primary Research
        1. Primary Interviews and Information Gathering
    6. Process
      1. Breakdown of Primary Respondents
      2. Forecasting Model
      3. Market Size Estimation
        1. Bottom-Up Approach
        2. Top-Down
    7. Approach
      1. Data Triangulation
      2. Validation
    8. MARKET
    9. DYNAMICS
      1. Overview
      2. Drivers
      3. Restraints
      4. Opportunities
    10. MARKET FACTOR ANALYSIS
      1. Value chain Analysis
      2. Porter's
    11. Five Forces Analysis
      1. Bargaining Power of Suppliers
        1. Bargaining
    12. Power of Buyers
      1. Threat of New Entrants
        1. Threat of Substitutes
        2. Intensity of Rivalry
      2. COVID-19 Impact Analysis
        1. Market
    13. Impact Analysis
      1. Regional Impact
        1. Opportunity and Threat Analysis
    14. AQUA AMMONIA MARKET, BY APPLICATION (USD BILLION)
      1. Fertilizers
      2. Industrial Refrigeration
      3. Water Treatment
      4. Chemical Manufacturing
    15. AQUA AMMONIA MARKET, BY END USE (USD BILLION)
      1. Agriculture
    16. Chemical Industry
      1. Food Beverage
      2. Pharmaceuticals
    17. AQUA
    18. AMMONIA MARKET, BY CONCENTRATION (USD BILLION)
      1. Low Concentration
    19. Medium Concentration
      1. High Concentration
    20. AQUA AMMONIA MARKET, BY
    21. FORM (USD BILLION)
      1. Liquid
      2. Solid
      3. Gas
    22. AQUA
    23. AMMONIA MARKET, BY REGIONAL (USD BILLION)
      1. North America
    24. US
      1. Canada
      2. Europe
        1. Germany
        2. UK
        3. France
        4. Russia
        5. Italy
        6. Spain
    25. Rest of Europe
      1. APAC
        1. China
        2. India
    26. Japan
      1. South Korea
        1. Malaysia
        2. Thailand
    27. Indonesia
      1. Rest of APAC
      2. South America
        1. Brazil
        2. Mexico
        3. Argentina
        4. Rest of South America
    28. MEA
      1. GCC Countries
        1. South Africa
        2. Rest of MEA
    29. COMPETITIVE LANDSCAPE
      1. Overview
      2. Competitive
    30. Analysis
      1. Market share Analysis
      2. Major Growth Strategy in the
    31. Aqua Ammonia Market
      1. Competitive Benchmarking
      2. Leading Players
    32. in Terms of Number of Developments in the Aqua Ammonia Market
      1. Key developments
    33. and growth strategies
      1. New Product Launch/Service Deployment
    34. Merger Acquisitions
      1. Joint Ventures
      2. Major Players Financial
    35. Matrix
      1. Sales and Operating Income
        1. Major Players RD Expenditure.
    36. COMPANY PROFILES
      1. Agrium
        1. Financial Overview
        2. Products Offered
        3. Key Developments
        4. SWOT Analysis
        5. Key Strategies
      2. BASF
        1. Financial Overview
    37. Products Offered
      1. Key Developments
        1. SWOT Analysis
    38. Key Strategies
      1. Koch Industries
        1. Financial Overview
    39. Products Offered
      1. Key Developments
        1. SWOT Analysis
    40. Key Strategies
      1. Indian Farmers Fertiliser Cooperative
        1. Financial
    41. Overview
      1. Products Offered
        1. Key Developments
    42. SWOT Analysis
      1. Key Strategies
      2. Nutrien
        1. Financial
    43. Overview
      1. Products Offered
        1. Key Developments
    44. SWOT Analysis
      1. Key Strategies
      2. OCI N.V.
        1. Financial
    45. Overview
      1. Products Offered
        1. Key Developments
    46. SWOT Analysis
      1. Key Strategies
      2. Karnalyte Resources
    47. Financial Overview
      1. Products Offered
        1. Key Developments
        2. SWOT Analysis
        3. Key Strategies
      2. Helena AgriEnterprises
        1. Financial Overview
        2. Products Offered
        3. Key Developments
        4. SWOT Analysis
        5. Key Strategies
      3. CF Industries
        1. Financial Overview
        2. Products Offered
        3. Key Developments
        4. SWOT Analysis
        5. Key Strategies
      4. Yara International
        1. Financial Overview
        2. Products Offered
        3. Key Developments
        4. SWOT Analysis
        5. Key Strategies
      5. OCP Group
    48. Financial Overview
      1. Products Offered
        1. Key Developments
        2. SWOT Analysis
        3. Key Strategies
      2. Tata Chemicals
        1. Financial Overview
        2. Products Offered
        3. Key Developments
        4. SWOT Analysis
        5. Key Strategies
      3. Arab Potash Company
        1. Financial Overview
        2. Products Offered
        3. Key Developments
        4. SWOT Analysis
        5. Key Strategies
      4. Land O'Lakes
        1. Financial Overview
        2. Products Offered
        3. Key Developments
        4. SWOT Analysis
        5. Key Strategies
    49. APPENDIX
    50. References
      1. Related Reports
    51. OF ASSUMPTIONS
    52. FORECAST, BY APPLICATION, 2025-2034 (USD BILLIONS)
    53. AMMONIA MARKET SIZE ESTIMATES & FORECAST, BY END USE, 2025-2034 (USD BILLIONS)
    54. 2034 (USD BILLIONS)
    55. & FORECAST, BY FORM, 2025-2034 (USD BILLIONS)
    56. AMMONIA MARKET SIZE ESTIMATES & FORECAST, BY REGIONAL, 2025-2034 (USD BILLIONS)
    57. 2034 (USD BILLIONS)
    58. FORECAST, BY END USE, 2025-2034 (USD BILLIONS)
    59. SIZE ESTIMATES & FORECAST, BY CONCENTRATION, 2025-2034 (USD BILLIONS)
    60. US AQUA AMMONIA MARKET SIZE ESTIMATES & FORECAST, BY FORM, 2025-2034 (USD
    61. BILLIONS)
    62. REGIONAL, 2025-2034 (USD BILLIONS)
    63. ESTIMATES & FORECAST, BY APPLICATION, 2025-2034 (USD BILLIONS)
    64. CANADA AQUA AMMONIA MARKET SIZE ESTIMATES & FORECAST, BY END USE, 2025-2034
    65. (USD BILLIONS)
    66. BY CONCENTRATION, 2025-2034 (USD BILLIONS)
    67. SIZE ESTIMATES & FORECAST, BY FORM, 2025-2034 (USD BILLIONS)
    68. CANADA AQUA AMMONIA MARKET SIZE ESTIMATES & FORECAST, BY REGIONAL, 2025-2034
    69. (USD BILLIONS)
    70. BY APPLICATION, 2025-2034 (USD BILLIONS)
    71. SIZE ESTIMATES & FORECAST, BY END USE, 2025-2034 (USD BILLIONS)
    72. EUROPE AQUA AMMONIA MARKET SIZE ESTIMATES & FORECAST, BY CONCENTRATION, 2025-2034
    73. (USD BILLIONS)
    74. BY FORM, 2025-2034 (USD BILLIONS)
    75. ESTIMATES & FORECAST, BY REGIONAL, 2025-2034 (USD BILLIONS)
    76. AQUA AMMONIA MARKET SIZE ESTIMATES & FORECAST, BY APPLICATION, 2025-2034 (USD
    77. BILLIONS)
    78. BY END USE, 2025-2034 (USD BILLIONS)
    79. SIZE ESTIMATES & FORECAST, BY CONCENTRATION, 2025-2034 (USD BILLIONS)
    80. GERMANY AQUA AMMONIA MARKET SIZE ESTIMATES & FORECAST, BY FORM, 2025-2034
    81. (USD BILLIONS)
    82. BY REGIONAL, 2025-2034 (USD BILLIONS)
    83. ESTIMATES & FORECAST, BY APPLICATION, 2025-2034 (USD BILLIONS)
    84. UK AQUA AMMONIA MARKET SIZE ESTIMATES & FORECAST, BY END USE, 2025-2034 (USD
    85. BILLIONS)
    86. CONCENTRATION, 2025-2034 (USD BILLIONS)
    87. ESTIMATES & FORECAST, BY FORM, 2025-2034 (USD BILLIONS)
    88. AMMONIA MARKET SIZE ESTIMATES & FORECAST, BY REGIONAL, 2025-2034 (USD BILLIONS)
    89. 2034 (USD BILLIONS)
    90. & FORECAST, BY END USE, 2025-2034 (USD BILLIONS)
    91. AMMONIA MARKET SIZE ESTIMATES & FORECAST, BY CONCENTRATION, 2025-2034 (USD BILLIONS)
    92. (USD BILLIONS)
    93. BY REGIONAL, 2025-2034 (USD BILLIONS)
    94. SIZE ESTIMATES & FORECAST, BY APPLICATION, 2025-2034 (USD BILLIONS)
    95. RUSSIA AQUA AMMONIA MARKET SIZE ESTIMATES & FORECAST, BY END USE, 2025-2034
    96. (USD BILLIONS)
    97. BY CONCENTRATION, 2025-2034 (USD BILLIONS)
    98. SIZE ESTIMATES & FORECAST, BY FORM, 2025-2034 (USD BILLIONS)
    99. RUSSIA AQUA AMMONIA MARKET SIZE ESTIMATES & FORECAST, BY REGIONAL, 2025-2034
    100. (USD BILLIONS)
    101. BY APPLICATION, 2025-2034 (USD BILLIONS)
    102. SIZE ESTIMATES & FORECAST, BY END USE, 2025-2034 (USD BILLIONS)
    103. ITALY AQUA AMMONIA MARKET SIZE ESTIMATES & FORECAST, BY CONCENTRATION, 2025-2034
    104. (USD BILLIONS)
    105. BY FORM, 2025-2034 (USD BILLIONS)
    106. ESTIMATES & FORECAST, BY REGIONAL, 2025-2034 (USD BILLIONS)
    107. AQUA AMMONIA MARKET SIZE ESTIMATES & FORECAST, BY APPLICATION, 2025-2034 (USD
    108. BILLIONS)
    109. BY END USE, 2025-2034 (USD BILLIONS)
    110. ESTIMATES & FORECAST, BY CONCENTRATION, 2025-2034 (USD BILLIONS)
    111. SPAIN AQUA AMMONIA MARKET SIZE ESTIMATES & FORECAST, BY FORM, 2025-2034
    112. (USD BILLIONS)
    113. BY REGIONAL, 2025-2034 (USD BILLIONS)
    114. MARKET SIZE ESTIMATES & FORECAST, BY APPLICATION, 2025-2034 (USD BILLIONS)
    115. END USE, 2025-2034 (USD BILLIONS)
    116. SIZE ESTIMATES & FORECAST, BY CONCENTRATION, 2025-2034 (USD BILLIONS)
    117. REST OF EUROPE AQUA AMMONIA MARKET SIZE ESTIMATES & FORECAST, BY FORM, 2025-2034
    118. (USD BILLIONS)
    119. & FORECAST, BY REGIONAL, 2025-2034 (USD BILLIONS)
    120. MARKET SIZE ESTIMATES & FORECAST, BY APPLICATION, 2025-2034 (USD BILLIONS)
    121. 2034 (USD BILLIONS)
    122. & FORECAST, BY CONCENTRATION, 2025-2034 (USD BILLIONS)
    123. AMMONIA MARKET SIZE ESTIMATES & FORECAST, BY FORM, 2025-2034 (USD BILLIONS)
    124. 2034 (USD BILLIONS)
    125. & FORECAST, BY APPLICATION, 2025-2034 (USD BILLIONS)
    126. AMMONIA MARKET SIZE ESTIMATES & FORECAST, BY END USE, 2025-2034 (USD BILLIONS)
    127. 2034 (USD BILLIONS)
    128. & FORECAST, BY FORM, 2025-2034 (USD BILLIONS)
    129. MARKET SIZE ESTIMATES & FORECAST, BY REGIONAL, 2025-2034 (USD BILLIONS)
    130. INDIA AQUA AMMONIA MARKET SIZE ESTIMATES & FORECAST, BY APPLICATION, 2025-2034
    131. (USD BILLIONS)
    132. BY END USE, 2025-2034 (USD BILLIONS)
    133. ESTIMATES & FORECAST, BY CONCENTRATION, 2025-2034 (USD BILLIONS)
    134. INDIA AQUA AMMONIA MARKET SIZE ESTIMATES & FORECAST, BY FORM, 2025-2034
    135. (USD BILLIONS)
    136. BY REGIONAL, 2025-2034 (USD BILLIONS)
    137. ESTIMATES & FORECAST, BY APPLICATION, 2025-2034 (USD BILLIONS)
    138. JAPAN AQUA AMMONIA MARKET SIZE ESTIMATES & FORECAST, BY END USE, 2025-2034 (USD
    139. BILLIONS)
    140. BY CONCENTRATION, 2025-2034 (USD BILLIONS)
    141. SIZE ESTIMATES & FORECAST, BY FORM, 2025-2034 (USD BILLIONS)
    142. JAPAN AQUA AMMONIA MARKET SIZE ESTIMATES & FORECAST, BY REGIONAL, 2025-2034
    143. (USD BILLIONS)
    144. FORECAST, BY APPLICATION, 2025-2034 (USD BILLIONS)
    145. AMMONIA MARKET SIZE ESTIMATES & FORECAST, BY END USE, 2025-2034 (USD BILLIONS)
    146. 2034 (USD BILLIONS)
    147. & FORECAST, BY FORM, 2025-2034 (USD BILLIONS)
    148. AMMONIA MARKET SIZE ESTIMATES & FORECAST, BY REGIONAL, 2025-2034 (USD BILLIONS)
    149. 2034 (USD BILLIONS)
    150. & FORECAST, BY END USE, 2025-2034 (USD BILLIONS)
    151. AMMONIA MARKET SIZE ESTIMATES & FORECAST, BY CONCENTRATION, 2025-2034 (USD BILLIONS)
    152. 2034 (USD BILLIONS)
    153. & FORECAST, BY REGIONAL, 2025-2034 (USD BILLIONS)
    154. AMMONIA MARKET SIZE ESTIMATES & FORECAST, BY APPLICATION, 2025-2034 (USD BILLIONS)
    155. 2034 (USD BILLIONS)
    156. & FORECAST, BY CONCENTRATION, 2025-2034 (USD BILLIONS)
    157. AQUA AMMONIA MARKET SIZE ESTIMATES & FORECAST, BY FORM, 2025-2034 (USD BILLIONS)
    158. 2034 (USD BILLIONS)
    159. & FORECAST, BY APPLICATION, 2025-2034 (USD BILLIONS)
    160. AQUA AMMONIA MARKET SIZE ESTIMATES & FORECAST, BY END USE, 2025-2034 (USD BILLIONS)
    161. 2034 (USD BILLIONS)
    162. & FORECAST, BY FORM, 2025-2034 (USD BILLIONS)
    163. AMMONIA MARKET SIZE ESTIMATES & FORECAST, BY REGIONAL, 2025-2034 (USD BILLIONS)
    164. 2034 (USD BILLIONS)
    165. & FORECAST, BY END USE, 2025-2034 (USD BILLIONS)
    166. AQUA AMMONIA MARKET SIZE ESTIMATES & FORECAST, BY CONCENTRATION, 2025-2034 (USD
    167. BILLIONS)
    168. FORECAST, BY FORM, 2025-2034 (USD BILLIONS)
    169. MARKET SIZE ESTIMATES & FORECAST, BY REGIONAL, 2025-2034 (USD BILLIONS)
    170. SOUTH AMERICA AQUA AMMONIA MARKET SIZE ESTIMATES & FORECAST, BY APPLICATION,
    171. 2034 (USD BILLIONS)
    172. ESTIMATES & FORECAST, BY END USE, 2025-2034 (USD BILLIONS)
    173. AMERICA AQUA AMMONIA MARKET SIZE ESTIMATES & FORECAST, BY CONCENTRATION, 2025-2034
    174. (USD BILLIONS)
    175. & FORECAST, BY FORM, 2025-2034 (USD BILLIONS)
    176. AQUA AMMONIA MARKET SIZE ESTIMATES & FORECAST, BY REGIONAL, 2025-2034 (USD BILLIONS)
    177. 2034 (USD BILLIONS)
    178. & FORECAST, BY END USE, 2025-2034 (USD BILLIONS)
    179. AMMONIA MARKET SIZE ESTIMATES & FORECAST, BY CONCENTRATION, 2025-2034 (USD BILLIONS)
    180. 2034 (USD BILLIONS)
    181. & FORECAST, BY REGIONAL, 2025-2034 (USD BILLIONS)
    182. AMMONIA MARKET SIZE ESTIMATES & FORECAST, BY APPLICATION, 2025-2034 (USD BILLIONS)
    183. 2034 (USD BILLIONS)
    184. & FORECAST, BY CONCENTRATION, 2025-2034 (USD BILLIONS)
    185. AQUA AMMONIA MARKET SIZE ESTIMATES & FORECAST, BY FORM, 2025-2034 (USD BILLIONS)
    186. 2034 (USD BILLIONS)
    187. & FORECAST, BY APPLICATION, 2025-2034 (USD BILLIONS)
    188. AQUA AMMONIA MARKET SIZE ESTIMATES & FORECAST, BY END USE, 2025-2034 (USD BILLIONS)
    189. 2034 (USD BILLIONS)
    190. & FORECAST, BY FORM, 2025-2034 (USD BILLIONS)
    191. AMMONIA MARKET SIZE ESTIMATES & FORECAST, BY REGIONAL, 2025-2034 (USD BILLIONS)
    192. BY APPLICATION, 2025-2034 (USD BILLIONS)
    193. AMMONIA MARKET SIZE ESTIMATES & FORECAST, BY END USE, 2025-2034 (USD BILLIONS)
    194. BY CONCENTRATION, 2025-2034 (USD BILLIONS)
    195. AQUA AMMONIA MARKET SIZE ESTIMATES & FORECAST, BY FORM, 2025-2034 (USD BILLIONS)
    196. BY REGIONAL, 2025-2034 (USD BILLIONS)
    197. ESTIMATES & FORECAST, BY APPLICATION, 2025-2034 (USD BILLIONS)
    198. MEA AQUA AMMONIA MARKET SIZE ESTIMATES & FORECAST, BY END USE, 2025-2034 (USD
    199. BILLIONS)
    200. BY CONCENTRATION, 2025-2034 (USD BILLIONS)
    201. SIZE ESTIMATES & FORECAST, BY FORM, 2025-2034 (USD BILLIONS)
    202. MEA AQUA AMMONIA MARKET SIZE ESTIMATES & FORECAST, BY REGIONAL, 2025-2034 (USD
    203. BILLIONS)
    204. FORECAST, BY APPLICATION, 2025-2034 (USD BILLIONS)
    205. AQUA AMMONIA MARKET SIZE ESTIMATES & FORECAST, BY END USE, 2025-2034 (USD BILLIONS)
    206. CONCENTRATION, 2025-2034 (USD BILLIONS)
    207. MARKET SIZE ESTIMATES & FORECAST, BY FORM, 2025-2034 (USD BILLIONS)
    208. GCC COUNTRIES AQUA AMMONIA MARKET SIZE ESTIMATES & FORECAST, BY REGIONAL,
    209. 2034 (USD BILLIONS)
    210. & FORECAST, BY APPLICATION, 2025-2034 (USD BILLIONS)
    211. AQUA AMMONIA MARKET SIZE ESTIMATES & FORECAST, BY END USE, 2025-2034 (USD BILLIONS)
    212. CONCENTRATION, 2025-2034 (USD BILLIONS)
    213. MARKET SIZE ESTIMATES & FORECAST, BY FORM, 2025-2034 (USD BILLIONS)
    214. SOUTH AFRICA AQUA AMMONIA MARKET SIZE ESTIMATES & FORECAST, BY REGIONAL,
    215. 2034 (USD BILLIONS)
    216. & FORECAST, BY APPLICATION, 2025-2034 (USD BILLIONS)
    217. MEA AQUA AMMONIA MARKET SIZE ESTIMATES & FORECAST, BY END USE, 2025-2034 (USD
    218. BILLIONS)
    219. BY CONCENTRATION, 2025-2034 (USD BILLIONS)
    220. MARKET SIZE ESTIMATES & FORECAST, BY FORM, 2025-2034 (USD BILLIONS)
    221. REST OF MEA AQUA AMMONIA MARKET SIZE ESTIMATES & FORECAST, BY REGIONAL,
    222. 2034 (USD BILLIONS)
    223. MARKET SYNOPSIS
    224. AMMONIA MARKET ANALYSIS BY END USE
    225. BY CONCENTRATION
    226. US AQUA AMMONIA MARKET ANALYSIS BY REGIONAL
    227. MARKET ANALYSIS BY APPLICATION
    228. BY END USE
    229. AQUA AMMONIA MARKET ANALYSIS BY REGIONAL
    230. ANALYSIS
    231. AQUA AMMONIA MARKET ANALYSIS BY CONCENTRATION
    232. MARKET ANALYSIS BY FORM
    233. REGIONAL
    234. UK AQUA AMMONIA MARKET ANALYSIS BY END USE
    235. ANALYSIS BY CONCENTRATION
    236. AQUA AMMONIA MARKET ANALYSIS BY APPLICATION
    237. MARKET ANALYSIS BY END USE
    238. CONCENTRATION
    239. FRANCE AQUA AMMONIA MARKET ANALYSIS BY REGIONAL
    240. AMMONIA MARKET ANALYSIS BY APPLICATION
    241. ANALYSIS BY END USE
    242. AQUA AMMONIA MARKET ANALYSIS BY REGIONAL
    243. ANALYSIS BY APPLICATION
    244. USE
    245. ITALY AQUA AMMONIA MARKET ANALYSIS BY FORM
    246. MARKET ANALYSIS BY REGIONAL
    247. APPLICATION
    248. SPAIN AQUA AMMONIA MARKET ANALYSIS BY CONCENTRATION
    249. AMMONIA MARKET ANALYSIS BY FORM
    250. BY REGIONAL
    251. REST OF EUROPE AQUA AMMONIA MARKET ANALYSIS BY CONCENTRATION
    252. REST OF EUROPE AQUA AMMONIA MARKET ANALYSIS BY FORM
    253. AQUA AMMONIA MARKET ANALYSIS BY REGIONAL
    254. ANALYSIS
    255. CHINA AQUA AMMONIA MARKET ANALYSIS BY END USE
    256. MARKET ANALYSIS BY CONCENTRATION
    257. BY FORM
    258. INDIA AQUA AMMONIA MARKET ANALYSIS BY APPLICATION
    259. AMMONIA MARKET ANALYSIS BY END USE
    260. BY CONCENTRATION
    261. INDIA AQUA AMMONIA MARKET ANALYSIS BY REGIONAL
    262. MARKET ANALYSIS BY APPLICATION
    263. BY END USE
    264. AMMONIA MARKET ANALYSIS BY REGIONAL
    265. ANALYSIS BY APPLICATION
    266. BY END USE
    267. KOREA AQUA AMMONIA MARKET ANALYSIS BY REGIONAL
    268. MARKET ANALYSIS BY APPLICATION
    269. BY END USE
    270. AQUA AMMONIA MARKET ANALYSIS BY REGIONAL
    271. ANALYSIS BY APPLICATION
    272. END USE
    273. AQUA AMMONIA MARKET ANALYSIS BY REGIONAL
    274. MARKET ANALYSIS BY APPLICATION
    275. BY END USE
    276. AQUA AMMONIA MARKET ANALYSIS BY REGIONAL
    277. MARKET ANALYSIS BY APPLICATION
    278. ANALYSIS BY END USE
    279. CONCENTRATION
    280. SOUTH AMERICA AQUA AMMONIA MARKET ANALYSIS
    281. ANALYSIS BY APPLICATION
    282. USE
    283. BRAZIL AQUA AMMONIA MARKET ANALYSIS BY FORM
    284. MARKET ANALYSIS BY REGIONAL
    285. BY APPLICATION
    286. MEXICO AQUA AMMONIA MARKET ANALYSIS BY FORM
    287. MARKET ANALYSIS BY REGIONAL
    288. BY APPLICATION
    289. ARGENTINA AQUA AMMONIA MARKET ANALYSIS BY FORM
    290. AMMONIA MARKET ANALYSIS BY REGIONAL
    291. AMMONIA MARKET ANALYSIS BY APPLICATION
    292. AMMONIA MARKET ANALYSIS BY END USE
    293. MARKET ANALYSIS BY CONCENTRATION
    294. MARKET ANALYSIS BY FORM
    295. ANALYSIS BY REGIONAL
    296. GCC COUNTRIES AQUA AMMONIA MARKET ANALYSIS BY APPLICATION
    297. GCC COUNTRIES AQUA AMMONIA MARKET ANALYSIS BY END USE
    298. AQUA AMMONIA MARKET ANALYSIS BY CONCENTRATION
    299. AMMONIA MARKET ANALYSIS BY FORM
    300. ANALYSIS BY REGIONAL
    301. BY APPLICATION
    302. USE
    303. SOUTH AFRICA AQUA AMMONIA MARKET ANALYSIS BY REGIONAL
    304. AQUA AMMONIA MARKET ANALYSIS BY APPLICATION
    305. MARKET ANALYSIS BY END USE
    306. BY CONCENTRATION
    307. KEY BUYING CRITERIA OF AQUA AMMONIA MARKET
    308. MRFR
    309. IMPACT ANALYSIS: AQUA AMMONIA MARKET
    310. AQUA AMMONIA MARKET
    311. AQUA AMMONIA MARKET, BY APPLICATION, 2025-2034 (USD Billions)
    312. AMMONIA MARKET, BY END USE, 2024 (% SHARE)
    313. BY END USE, 2025-2034 (USD Billions)
    314. (% SHARE)
    315. (USD Billions)
    316. AQUA AMMONIA MARKET, BY REGIONAL, 2024 (% SHARE)
    317. MARKET, BY REGIONAL, 2025-2034 (USD Billions)
    318. COMPETITORS

    Aqua Ammonia Market Segmentation

    • Aqua Ammonia Market By Application (USD Billion, 2019-2032)

      • Fertilizers
      • Industrial Refrigeration
      • Water Treatment
      • Chemical Manufacturing
    • Aqua Ammonia Market By End Use (USD Billion, 2019-2032)

      • Agriculture
      • Chemical Industry
      • Food Beverage
      • Pharmaceuticals
    • Aqua Ammonia Market By Concentration (USD Billion, 2019-2032)

      • Low Concentration
      • Medium Concentration
      • High Concentration
    • Aqua Ammonia Market By Form (USD Billion, 2019-2032)

      • Liquid
      • Solid
      • Gas
    • Aqua Ammonia Market By Regional (USD Billion, 2019-2032)

      • North America
      • Europe
      • South America
      • Asia Pacific
      • Middle East and Africa

    Aqua Ammonia Market Regional Outlook (USD Billion, 2019-2032)

    • North America Outlook (USD Billion, 2019-2032)

      • North America Aqua Ammonia Market by Application Type

        • Fertilizers
        • Industrial Refrigeration
        • Water Treatment
        • Chemical Manufacturing
      • North America Aqua Ammonia Market by End Use Type

        • Agriculture
        • Chemical Industry
        • Food Beverage
        • Pharmaceuticals
      • North America Aqua Ammonia Market by Concentration Type

        • Low Concentration
        • Medium Concentration
        • High Concentration
      • North America Aqua Ammonia Market by Form Type

        • Liquid
        • Solid
        • Gas
      • North America Aqua Ammonia Market by Regional Type

        • US
        • Canada
      • US Outlook (USD Billion, 2019-2032)
      • US Aqua Ammonia Market by Application Type

        • Fertilizers
        • Industrial Refrigeration
        • Water Treatment
        • Chemical Manufacturing
      • US Aqua Ammonia Market by End Use Type

        • Agriculture
        • Chemical Industry
        • Food Beverage
        • Pharmaceuticals
      • US Aqua Ammonia Market by Concentration Type

        • Low Concentration
        • Medium Concentration
        • High Concentration
      • US Aqua Ammonia Market by Form Type

        • Liquid
        • Solid
        • Gas
      • CANADA Outlook (USD Billion, 2019-2032)
      • CANADA Aqua Ammonia Market by Application Type

        • Fertilizers
        • Industrial Refrigeration
        • Water Treatment
        • Chemical Manufacturing
      • CANADA Aqua Ammonia Market by End Use Type

        • Agriculture
        • Chemical Industry
        • Food Beverage
        • Pharmaceuticals
      • CANADA Aqua Ammonia Market by Concentration Type

        • Low Concentration
        • Medium Concentration
        • High Concentration
      • CANADA Aqua Ammonia Market by Form Type

        • Liquid
        • Solid
        • Gas
    • Europe Outlook (USD Billion, 2019-2032)

      • Europe Aqua Ammonia Market by Application Type

        • Fertilizers
        • Industrial Refrigeration
        • Water Treatment
        • Chemical Manufacturing
      • Europe Aqua Ammonia Market by End Use Type

        • Agriculture
        • Chemical Industry
        • Food Beverage
        • Pharmaceuticals
      • Europe Aqua Ammonia Market by Concentration Type

        • Low Concentration
        • Medium Concentration
        • High Concentration
      • Europe Aqua Ammonia Market by Form Type

        • Liquid
        • Solid
        • Gas
      • Europe Aqua Ammonia Market by Regional Type

        • Germany
        • UK
        • France
        • Russia
        • Italy
        • Spain
        • Rest of Europe
      • GERMANY Outlook (USD Billion, 2019-2032)
      • GERMANY Aqua Ammonia Market by Application Type

        • Fertilizers
        • Industrial Refrigeration
        • Water Treatment
        • Chemical Manufacturing
      • GERMANY Aqua Ammonia Market by End Use Type

        • Agriculture
        • Chemical Industry
        • Food Beverage
        • Pharmaceuticals
      • GERMANY Aqua Ammonia Market by Concentration Type

        • Low Concentration
        • Medium Concentration
        • High Concentration
      • GERMANY Aqua Ammonia Market by Form Type

        • Liquid
        • Solid
        • Gas
      • UK Outlook (USD Billion, 2019-2032)
      • UK Aqua Ammonia Market by Application Type

        • Fertilizers
        • Industrial Refrigeration
        • Water Treatment
        • Chemical Manufacturing
      • UK Aqua Ammonia Market by End Use Type

        • Agriculture
        • Chemical Industry
        • Food Beverage
        • Pharmaceuticals
      • UK Aqua Ammonia Market by Concentration Type

        • Low Concentration
        • Medium Concentration
        • High Concentration
      • UK Aqua Ammonia Market by Form Type

        • Liquid
        • Solid
        • Gas
      • FRANCE Outlook (USD Billion, 2019-2032)
      • FRANCE Aqua Ammonia Market by Application Type

        • Fertilizers
        • Industrial Refrigeration
        • Water Treatment
        • Chemical Manufacturing
      • FRANCE Aqua Ammonia Market by End Use Type

        • Agriculture
        • Chemical Industry
        • Food Beverage
        • Pharmaceuticals
      • FRANCE Aqua Ammonia Market by Concentration Type

        • Low Concentration
        • Medium Concentration
        • High Concentration
      • FRANCE Aqua Ammonia Market by Form Type

        • Liquid
        • Solid
        • Gas
      • RUSSIA Outlook (USD Billion, 2019-2032)
      • RUSSIA Aqua Ammonia Market by Application Type

        • Fertilizers
        • Industrial Refrigeration
        • Water Treatment
        • Chemical Manufacturing
      • RUSSIA Aqua Ammonia Market by End Use Type

        • Agriculture
        • Chemical Industry
        • Food Beverage
        • Pharmaceuticals
      • RUSSIA Aqua Ammonia Market by Concentration Type

        • Low Concentration
        • Medium Concentration
        • High Concentration
      • RUSSIA Aqua Ammonia Market by Form Type

        • Liquid
        • Solid
        • Gas
      • ITALY Outlook (USD Billion, 2019-2032)
      • ITALY Aqua Ammonia Market by Application Type

        • Fertilizers
        • Industrial Refrigeration
        • Water Treatment
        • Chemical Manufacturing
      • ITALY Aqua Ammonia Market by End Use Type

        • Agriculture
        • Chemical Industry
        • Food Beverage
        • Pharmaceuticals
      • ITALY Aqua Ammonia Market by Concentration Type

        • Low Concentration
        • Medium Concentration
        • High Concentration
      • ITALY Aqua Ammonia Market by Form Type

        • Liquid
        • Solid
        • Gas
      • SPAIN Outlook (USD Billion, 2019-2032)
      • SPAIN Aqua Ammonia Market by Application Type

        • Fertilizers
        • Industrial Refrigeration
        • Water Treatment
        • Chemical Manufacturing
      • SPAIN Aqua Ammonia Market by End Use Type

        • Agriculture
        • Chemical Industry
        • Food Beverage
        • Pharmaceuticals
      • SPAIN Aqua Ammonia Market by Concentration Type

        • Low Concentration
        • Medium Concentration
        • High Concentration
      • SPAIN Aqua Ammonia Market by Form Type

        • Liquid
        • Solid
        • Gas
      • REST OF EUROPE Outlook (USD Billion, 2019-2032)
      • REST OF EUROPE Aqua Ammonia Market by Application Type

        • Fertilizers
        • Industrial Refrigeration
        • Water Treatment
        • Chemical Manufacturing
      • REST OF EUROPE Aqua Ammonia Market by End Use Type

        • Agriculture
        • Chemical Industry
        • Food Beverage
        • Pharmaceuticals
      • REST OF EUROPE Aqua Ammonia Market by Concentration Type

        • Low Concentration
        • Medium Concentration
        • High Concentration
      • REST OF EUROPE Aqua Ammonia Market by Form Type

        • Liquid
        • Solid
        • Gas
    • APAC Outlook (USD Billion, 2019-2032)

      • APAC Aqua Ammonia Market by Application Type

        • Fertilizers
        • Industrial Refrigeration
        • Water Treatment
        • Chemical Manufacturing
      • APAC Aqua Ammonia Market by End Use Type

        • Agriculture
        • Chemical Industry
        • Food Beverage
        • Pharmaceuticals
      • APAC Aqua Ammonia Market by Concentration Type

        • Low Concentration
        • Medium Concentration
        • High Concentration
      • APAC Aqua Ammonia Market by Form Type

        • Liquid
        • Solid
        • Gas
      • APAC Aqua Ammonia Market by Regional Type

        • China
        • India
        • Japan
        • South Korea
        • Malaysia
        • Thailand
        • Indonesia
        • Rest of APAC
      • CHINA Outlook (USD Billion, 2019-2032)
      • CHINA Aqua Ammonia Market by Application Type

        • Fertilizers
        • Industrial Refrigeration
        • Water Treatment
        • Chemical Manufacturing
      • CHINA Aqua Ammonia Market by End Use Type

        • Agriculture
        • Chemical Industry
        • Food Beverage
        • Pharmaceuticals
      • CHINA Aqua Ammonia Market by Concentration Type

        • Low Concentration
        • Medium Concentration
        • High Concentration
      • CHINA Aqua Ammonia Market by Form Type

        • Liquid
        • Solid
        • Gas
      • INDIA Outlook (USD Billion, 2019-2032)
      • INDIA Aqua Ammonia Market by Application Type

        • Fertilizers
        • Industrial Refrigeration
        • Water Treatment
        • Chemical Manufacturing
      • INDIA Aqua Ammonia Market by End Use Type

        • Agriculture
        • Chemical Industry
        • Food Beverage
        • Pharmaceuticals
      • INDIA Aqua Ammonia Market by Concentration Type

        • Low Concentration
        • Medium Concentration
        • High Concentration
      • INDIA Aqua Ammonia Market by Form Type

        • Liquid
        • Solid
        • Gas
      • JAPAN Outlook (USD Billion, 2019-2032)
      • JAPAN Aqua Ammonia Market by Application Type

        • Fertilizers
        • Industrial Refrigeration
        • Water Treatment
        • Chemical Manufacturing
      • JAPAN Aqua Ammonia Market by End Use Type

        • Agriculture
        • Chemical Industry
        • Food Beverage
        • Pharmaceuticals
      • JAPAN Aqua Ammonia Market by Concentration Type

        • Low Concentration
        • Medium Concentration
        • High Concentration
      • JAPAN Aqua Ammonia Market by Form Type

        • Liquid
        • Solid
        • Gas
      • SOUTH KOREA Outlook (USD Billion, 2019-2032)
      • SOUTH KOREA Aqua Ammonia Market by Application Type

        • Fertilizers
        • Industrial Refrigeration
        • Water Treatment
        • Chemical Manufacturing
      • SOUTH KOREA Aqua Ammonia Market by End Use Type

        • Agriculture
        • Chemical Industry
        • Food Beverage
        • Pharmaceuticals
      • SOUTH KOREA Aqua Ammonia Market by Concentration Type

        • Low Concentration
        • Medium Concentration
        • High Concentration
      • SOUTH KOREA Aqua Ammonia Market by Form Type

        • Liquid
        • Solid
        • Gas
      • MALAYSIA Outlook (USD Billion, 2019-2032)
      • MALAYSIA Aqua Ammonia Market by Application Type

        • Fertilizers
        • Industrial Refrigeration
        • Water Treatment
        • Chemical Manufacturing
      • MALAYSIA Aqua Ammonia Market by End Use Type

        • Agriculture
        • Chemical Industry
        • Food Beverage
        • Pharmaceuticals
      • MALAYSIA Aqua Ammonia Market by Concentration Type

        • Low Concentration
        • Medium Concentration
        • High Concentration
      • MALAYSIA Aqua Ammonia Market by Form Type

        • Liquid
        • Solid
        • Gas
      • THAILAND Outlook (USD Billion, 2019-2032)
      • THAILAND Aqua Ammonia Market by Application Type

        • Fertilizers
        • Industrial Refrigeration
        • Water Treatment
        • Chemical Manufacturing
      • THAILAND Aqua Ammonia Market by End Use Type

        • Agriculture
        • Chemical Industry
        • Food Beverage
        • Pharmaceuticals
      • THAILAND Aqua Ammonia Market by Concentration Type

        • Low Concentration
        • Medium Concentration
        • High Concentration
      • THAILAND Aqua Ammonia Market by Form Type

        • Liquid
        • Solid
        • Gas
      • INDONESIA Outlook (USD Billion, 2019-2032)
      • INDONESIA Aqua Ammonia Market by Application Type

        • Fertilizers
        • Industrial Refrigeration
        • Water Treatment
        • Chemical Manufacturing
      • INDONESIA Aqua Ammonia Market by End Use Type

        • Agriculture
        • Chemical Industry
        • Food Beverage
        • Pharmaceuticals
      • INDONESIA Aqua Ammonia Market by Concentration Type

        • Low Concentration
        • Medium Concentration
        • High Concentration
      • INDONESIA Aqua Ammonia Market by Form Type

        • Liquid
        • Solid
        • Gas
      • REST OF APAC Outlook (USD Billion, 2019-2032)
      • REST OF APAC Aqua Ammonia Market by Application Type

        • Fertilizers
        • Industrial Refrigeration
        • Water Treatment
        • Chemical Manufacturing
      • REST OF APAC Aqua Ammonia Market by End Use Type

        • Agriculture
        • Chemical Industry
        • Food Beverage
        • Pharmaceuticals
      • REST OF APAC Aqua Ammonia Market by Concentration Type

        • Low Concentration
        • Medium Concentration
        • High Concentration
      • REST OF APAC Aqua Ammonia Market by Form Type

        • Liquid
        • Solid
        • Gas
    • South America Outlook (USD Billion, 2019-2032)

      • South America Aqua Ammonia Market by Application Type

        • Fertilizers
        • Industrial Refrigeration
        • Water Treatment
        • Chemical Manufacturing
      • South America Aqua Ammonia Market by End Use Type

        • Agriculture
        • Chemical Industry
        • Food Beverage
        • Pharmaceuticals
      • South America Aqua Ammonia Market by Concentration Type

        • Low Concentration
        • Medium Concentration
        • High Concentration
      • South America Aqua Ammonia Market by Form Type

        • Liquid
        • Solid
        • Gas
      • South America Aqua Ammonia Market by Regional Type

        • Brazil
        • Mexico
        • Argentina
        • Rest of South America
      • BRAZIL Outlook (USD Billion, 2019-2032)
      • BRAZIL Aqua Ammonia Market by Application Type

        • Fertilizers
        • Industrial Refrigeration
        • Water Treatment
        • Chemical Manufacturing
      • BRAZIL Aqua Ammonia Market by End Use Type

        • Agriculture
        • Chemical Industry
        • Food Beverage
        • Pharmaceuticals
      • BRAZIL Aqua Ammonia Market by Concentration Type

        • Low Concentration
        • Medium Concentration
        • High Concentration
      • BRAZIL Aqua Ammonia Market by Form Type

        • Liquid
        • Solid
        • Gas
      • MEXICO Outlook (USD Billion, 2019-2032)
      • MEXICO Aqua Ammonia Market by Application Type

        • Fertilizers
        • Industrial Refrigeration
        • Water Treatment
        • Chemical Manufacturing
      • MEXICO Aqua Ammonia Market by End Use Type

        • Agriculture
        • Chemical Industry
        • Food Beverage
        • Pharmaceuticals
      • MEXICO Aqua Ammonia Market by Concentration Type

        • Low Concentration
        • Medium Concentration
        • High Concentration
      • MEXICO Aqua Ammonia Market by Form Type

        • Liquid
        • Solid
        • Gas
      • ARGENTINA Outlook (USD Billion, 2019-2032)
      • ARGENTINA Aqua Ammonia Market by Application Type

        • Fertilizers
        • Industrial Refrigeration
        • Water Treatment
        • Chemical Manufacturing
      • ARGENTINA Aqua Ammonia Market by End Use Type

        • Agriculture
        • Chemical Industry
        • Food Beverage
        • Pharmaceuticals
      • ARGENTINA Aqua Ammonia Market by Concentration Type

        • Low Concentration
        • Medium Concentration
        • High Concentration
      • ARGENTINA Aqua Ammonia Market by Form Type

        • Liquid
        • Solid
        • Gas
      • REST OF SOUTH AMERICA Outlook (USD Billion, 2019-2032)
      • REST OF SOUTH AMERICA Aqua Ammonia Market by Application Type

        • Fertilizers
        • Industrial Refrigeration
        • Water Treatment
        • Chemical Manufacturing
      • REST OF SOUTH AMERICA Aqua Ammonia Market by End Use Type

        • Agriculture
        • Chemical Industry
        • Food Beverage
        • Pharmaceuticals
      • REST OF SOUTH AMERICA Aqua Ammonia Market by Concentration Type

        • Low Concentration
        • Medium Concentration
        • High Concentration
      • REST OF SOUTH AMERICA Aqua Ammonia Market by Form Type

        • Liquid
        • Solid
        • Gas
    • MEA Outlook (USD Billion, 2019-2032)

      • MEA Aqua Ammonia Market by Application Type

        • Fertilizers
        • Industrial Refrigeration
        • Water Treatment
        • Chemical Manufacturing
      • MEA Aqua Ammonia Market by End Use Type

        • Agriculture
        • Chemical Industry
        • Food Beverage
        • Pharmaceuticals
      • MEA Aqua Ammonia Market by Concentration Type

        • Low Concentration
        • Medium Concentration
        • High Concentration
      • MEA Aqua Ammonia Market by Form Type

        • Liquid
        • Solid
        • Gas
      • MEA Aqua Ammonia Market by Regional Type

        • GCC Countries
        • South Africa
        • Rest of MEA
      • GCC COUNTRIES Outlook (USD Billion, 2019-2032)
      • GCC COUNTRIES Aqua Ammonia Market by Application Type

        • Fertilizers
        • Industrial Refrigeration
        • Water Treatment
        • Chemical Manufacturing
      • GCC COUNTRIES Aqua Ammonia Market by End Use Type

        • Agriculture
        • Chemical Industry
        • Food Beverage
        • Pharmaceuticals
      • GCC COUNTRIES Aqua Ammonia Market by Concentration Type

        • Low Concentration
        • Medium Concentration
        • High Concentration
      • GCC COUNTRIES Aqua Ammonia Market by Form Type

        • Liquid
        • Solid
        • Gas
      • SOUTH AFRICA Outlook (USD Billion, 2019-2032)
      • SOUTH AFRICA Aqua Ammonia Market by Application Type

        • Fertilizers
        • Industrial Refrigeration
        • Water Treatment
        • Chemical Manufacturing
      • SOUTH AFRICA Aqua Ammonia Market by End Use Type

        • Agriculture
        • Chemical Industry
        • Food Beverage
        • Pharmaceuticals
      • SOUTH AFRICA Aqua Ammonia Market by Concentration Type

        • Low Concentration
        • Medium Concentration
        • High Concentration
      • SOUTH AFRICA Aqua Ammonia Market by Form Type

        • Liquid
        • Solid
        • Gas
      • REST OF MEA Outlook (USD Billion, 2019-2032)
      • REST OF MEA Aqua Ammonia Market by Application Type

        • Fertilizers
        • Industrial Refrigeration
        • Water Treatment
        • Chemical Manufacturing
      • REST OF MEA Aqua Ammonia Market by End Use Type

        • Agriculture
        • Chemical Industry
        • Food Beverage
        • Pharmaceuticals
      • REST OF MEA Aqua Ammonia Market by Concentration Type

        • Low Concentration
        • Medium Concentration
        • High Concentration
      • REST OF MEA Aqua Ammonia Market by Form Type

        • Liquid
        • Solid
        • Gas
    Report Infographic
    Free Sample Request

    Kindly complete the form below to receive a free sample of this Report

    Customer Strories

    “I am very pleased with how market segments have been defined in a relevant way for my purposes (such as "Portable Freezers & refrigerators" and "last-mile"). In general the report is well structured. Thanks very much for your efforts.”

    Victoria Milne Founder
    Case Study

    Chemicals and Materials