• Cat-intel
  • MedIntelliX
  • Resources
  • About Us
  • Hero Background
    English
    Chinese
    French
    Japanese
    Korean
    German
    Spanish

    Alternative Sweeteners Market Size

    ID: MRFR/F-B & N/3423-CR
    128 Pages
    Snehal Singh
    July 2019

    Alternative Sweeteners Market Research Report By Type (Natural Sweeteners, Artificial Sweeteners, Sugar Alcohols, High-Intensity Sweeteners, Traditional Sweeteners), By Application (Food and Beverages, Pharmaceuticals, Cosmetics, Dietary Supplements), By Form (Liquid, Powder, Granulated, Tablet), By End Use (Household, Commercial, Food Processing, Beverage Manufacturing) and By Regional (North ...

    Share:
    Download PDF ×

    We do not share your information with anyone. However, we may send you emails based on your report interest from time to time. You may contact us at any time to opt-out.

    Alternative Sweeteners Market Infographic
    Purchase Options

    Alternative Sweeteners Size

    Alternative Sweeteners Market Growth Projections and Opportunities

    The Alternative Sweeteners Market is shaped by a variety of factors that collectively contribute to its growth and dynamics. One primary driver is the increasing consumer demand for healthier and lower-calorie sweetening options. As awareness of the negative health impacts of excessive sugar consumption rises, consumers are actively seeking alternatives that offer sweetness without the associated drawbacks. Alternative sweeteners, such as stevia, monk fruit, erythritol, and aspartame, respond to this demand, providing a range of choices for individuals looking to reduce their sugar intake. The role of ongoing research and development in the food and beverage industry is crucial in shaping the alternative sweeteners market. Scientific advancements contribute to the discovery of new sweetening compounds and the improvement of existing formulations, enhancing the taste profiles of alternative sweeteners. This innovation not only expands the range of available options but also addresses the challenges associated with aftertastes, enabling manufacturers to create products with improved palatability. The alternative sweeteners market is anticipated to witness a substantial growth rate of 4.8% between 2022 and 2030, culminating in a market value of USD 6,689.6 Million by the conclusion of 2030. This projection reflects the persistent expansion of the alternative sweeteners sector over the next decade. Changing consumer dietary preferences and the rise of health-consciousness contribute significantly to the market dynamics. With an increasing focus on wellness and nutrition, consumers are actively seeking products that align with their dietary goals. Alternative sweeteners find application in a variety of food and beverage products, including sodas, yogurts, and baked goods, as they offer a way to reduce sugar content while maintaining sweetness. Economic factors, such as disposable income and pricing strategies, play a role in influencing the alternative sweeteners market. While premium and natural sweeteners may attract a higher-income demographic, there is also a demand for more affordable options that cater to a broader consumer base. Companies often adjust their pricing strategies to make alternative sweeteners accessible, influencing market penetration and consumption. The competitive landscape of the alternative sweeteners market is characterized by the activities of key players striving to offer a diverse range of high-quality products. Companies engage in research partnerships, acquisitions, and collaborations to enhance their product portfolios and stay competitive in the dynamic market. Marketing efforts focus on promoting the natural origins and lower-calorie benefits of alternative sweeteners to appeal to health-conscious consumers. Globalization and cultural factors contribute to the market dynamics by influencing the popularity of specific alternative sweeteners in different regions. Cultural dietary preferences and acceptance of particular sweetening options can impact regional market trends. Additionally, awareness of traditional sweeteners and their use in specific cuisines can influence consumer choices in diverse markets. Government regulations and health recommendations play a role in shaping the alternative sweeteners market. Regulatory bodies may establish guidelines for the use and labeling of alternative sweeteners to ensure consumer safety and accurate information. Compliance with these regulations is crucial for market players to build trust with consumers and maintain the credibility of their products. Environmental sustainability is an emerging factor influencing the alternative sweeteners market. With a growing emphasis on sustainable and responsible sourcing, consumers are becoming more conscious of the environmental impact of sweetener production. Companies that prioritize sustainable practices, such as using eco-friendly cultivation methods and packaging, can differentiate themselves in the market and appeal to eco-conscious consumers.

    Alternative Sweeteners Market Size Graph
    Author
    Snehal Singh
    Assistant Manager - Research

    High acumen in analyzing complex macro & micro markets with more than 6 years of work experience in the field of market research. By implementing her analytical skills in forecasting and estimation into market research reports, she has expertise in Packaging, Construction, and Equipment domains. She handles a team size of 20-25 resources and ensures smooth running of the projects, associated marketing activities, and client servicing.

    Leave a Comment

    FAQs

    What is the expected market size of the Alternative Sweeteners Market in 2024?

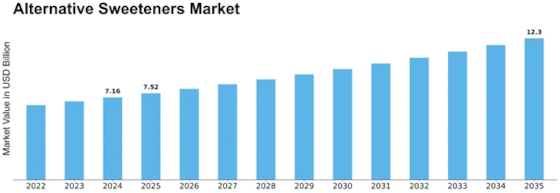
    The Alternative Sweeteners Market is expected to be valued at 7.16 USD Billion in 2024.

    What is the projected market size for the Alternative Sweeteners Market by 2035?

    The market size is anticipated to reach 12.3 USD Billion by the year 2035.

    What is the expected compound annual growth rate (CAGR) for the Alternative Sweeteners Market from 2025 to 2035?

    The expected CAGR for the Alternative Sweeteners Market is 5.04% during the forecast period from 2025 to 2035.

    Which region holds the largest market share for the Alternative Sweeteners Market in 2024?

    North America holds the largest market share, valued at 2.45 USD Billion in 2024.

    What will be the market size of the Alternative Sweeteners Market in Europe by 2035?

    The market size in Europe is expected to grow to 3.25 USD Billion by 2035.

    Can you name some key players in the Alternative Sweeteners Market?

    Major players in the market include Cargill, Dupont, and Tate & Lyle among others.

    What are the expected market values for Natural Sweeteners by 2035?

    Natural Sweeteners are projected to have a market value of 4.0 USD Billion by 2035.

    What market growth rate is anticipated specifically for the Asia Pacific region from 2025 to 2035?

    The Asia Pacific region is expected to experience a growth rate that raises its market value to 3.0 USD Billion by 2035.

    What will be the market value for Sugar Alcohols in 2024?

    The market value for Sugar Alcohols is estimated to be 1.5 USD Billion in 2024.

    What are some key trends expected to drive growth in the Alternative Sweeteners Market?

    Trends such as increasing health consciousness and demand for low-calorie food products are expected to drive market growth.

    Market Summary

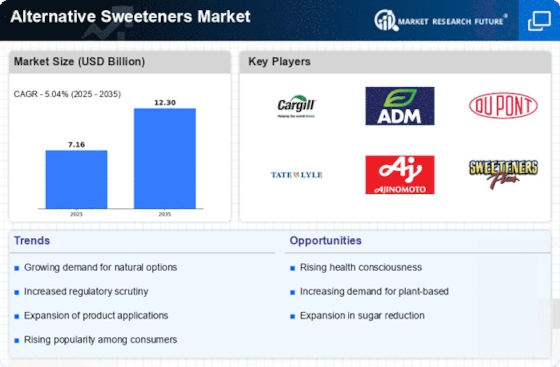
    As per MRFR analysis, the Alternative Sweeteners Market Size was estimated at 7.16 USD Billion in 2024. The Alternative Sweeteners industry is projected to grow from 7.521 USD Billion in 2025 to 12.3 USD Billion by 2035, exhibiting a compound annual growth rate (CAGR) of 5.04 during the forecast period 2025 - 2035.

    Key Market Trends & Highlights

    The Alternative Sweeteners Market is experiencing a robust shift towards health-conscious and natural options.

    • The market is increasingly driven by health-conscious choices, with consumers seeking alternatives to traditional sugars.
    • Natural sweeteners dominate the market, while high-intensity sweeteners are emerging as the fastest-growing segment.
    • North America remains the largest market, whereas the Asia-Pacific region is recognized as the fastest-growing area for alternative sweeteners.
    • Rising demand for low-calorie products and increased awareness of health risks associated with sugar are key drivers propelling market growth.

    Market Size & Forecast

    2024 Market Size 7.16 (USD Billion)
    2035 Market Size 12.3 (USD Billion)
    CAGR (2025 - 2035) 5.04%
    Largest Regional Market Share in 2024 North America

    Major Players

    <p>Cargill (US), Archer Daniels Midland (US), DuPont (US), Tate & Lyle (GB), Ajinomoto (JP), Sweeteners Plus (US), Mitsubishi Corporation (JP), Ingredion (US), NutraSweet (US)</p>

    Market Trends

    The Alternative Sweeteners Market is currently experiencing a notable transformation, driven by evolving consumer preferences and increasing health consciousness. As individuals become more aware of the implications of sugar consumption on health, there is a growing inclination towards products that offer sweetness without the associated calories. This shift is prompting manufacturers to innovate and diversify their offerings, leading to a broader range of alternative sweeteners that cater to various dietary needs. The market appears to be expanding as more consumers seek options that align with their health goals, such as weight management and reduced sugar intake. Moreover, the rise of plant-based diets and clean label trends is influencing the Alternative Sweeteners Market. Consumers are increasingly favoring natural sweeteners derived from plants, which are perceived as healthier alternatives to synthetic options. This trend suggests a potential shift in production practices, as companies may prioritize sourcing and developing sweeteners that are not only effective but also resonate with the values of sustainability and transparency. As the market evolves, it is likely that innovation will continue to play a crucial role in shaping the future landscape of sweetening agents, with a focus on quality, taste, and health benefits.

    Health-Conscious Choices

    The Alternative Sweeteners Market is witnessing a surge in demand for products that cater to health-conscious consumers. As awareness of the negative effects of excessive sugar intake grows, individuals are increasingly opting for sweeteners that provide lower calorie options without compromising on taste. This trend indicates a shift towards healthier lifestyles, prompting manufacturers to develop innovative solutions that meet these changing preferences.

    Natural and Plant-Based Options

    There is a discernible movement towards natural and plant-based sweeteners within the Alternative Sweeteners Market. Consumers are gravitating towards products that are derived from natural sources, as these are often perceived as healthier and more sustainable. This trend suggests that companies may need to adapt their product lines to include more plant-derived sweeteners to align with consumer expectations.

    Clean Label Movement

    The clean label movement is significantly impacting the Alternative Sweeteners Market, as consumers increasingly demand transparency in ingredient sourcing and production processes. This trend indicates a preference for products that are free from artificial additives and preservatives. As a result, manufacturers are likely to focus on creating sweeteners that not only meet taste requirements but also adhere to clean label standards.

    The increasing consumer demand for healthier food options is driving a notable shift towards alternative sweeteners, which are perceived as a means to reduce sugar intake and manage health conditions.

    U.S. Food and Drug Administration (FDA)

    Alternative Sweeteners Market Market Drivers

    Rising Demand for Low-Calorie Products

    The Alternative Sweeteners Market is experiencing a notable increase in demand for low-calorie products. As consumers become more health-conscious, they actively seek alternatives to traditional sugars that contribute to weight gain and health issues. This shift is reflected in the growing popularity of products labeled as low-calorie or sugar-free. According to recent data, the market for low-calorie sweeteners is projected to grow at a compound annual growth rate of approximately 5.5% over the next five years. This trend indicates a significant opportunity for manufacturers to innovate and expand their product lines to cater to this evolving consumer preference.

    Growing Popularity of Plant-Based Diets

    The Alternative Sweeteners Market is witnessing a surge in interest surrounding plant-based diets. As more individuals adopt vegetarian and vegan lifestyles, the demand for natural and plant-derived sweeteners is on the rise. Products such as stevia and monk fruit are gaining traction due to their natural origins and perceived health benefits. Market analysis indicates that the plant-based sweetener segment is expected to grow significantly, with projections suggesting a market share increase of over 20% in the coming years. This trend not only reflects changing dietary preferences but also highlights the potential for innovation in the development of new plant-based sweetening solutions.

    Regulatory Support for Healthier Food Options

    The Alternative Sweeteners Market is benefiting from increasing regulatory support aimed at promoting healthier food options. Governments and health organizations are actively encouraging the reduction of sugar consumption through various initiatives and guidelines. This regulatory environment is fostering innovation within the sweetener industry, as companies seek to develop products that align with these health-focused policies. For instance, some regions have implemented sugar taxes, which further incentivizes consumers to opt for alternative sweeteners. This supportive regulatory landscape is likely to drive growth in the market, as manufacturers respond to both consumer demand and governmental directives.

    Technological Advancements in Sweetener Production

    The Alternative Sweeteners Market is being propelled by technological advancements in sweetener production. Innovations in extraction and processing techniques have led to the development of more efficient and cost-effective methods for producing alternative sweeteners. These advancements not only enhance the quality and taste of sweeteners but also improve their availability in the market. For example, new fermentation processes are being explored to create sweeteners with enhanced flavor profiles. As technology continues to evolve, it is expected that the market will see an influx of novel sweetening agents, further diversifying the options available to consumers and manufacturers alike.

    Increased Awareness of Health Risks Associated with Sugar

    The Alternative Sweeteners Market is significantly influenced by the rising awareness of health risks linked to excessive sugar consumption. Research has consistently shown that high sugar intake is associated with various health issues, including obesity, diabetes, and cardiovascular diseases. As a result, consumers are increasingly turning to alternative sweeteners as a means to reduce their sugar intake while still enjoying sweet flavors. This shift is not merely anecdotal; data suggests that the demand for sugar substitutes has surged, with a marked increase in product offerings across various food and beverage categories. This trend presents a compelling opportunity for companies to position their products as healthier options.

    Market Segment Insights

    By Type: Natural Sweeteners (Largest) vs. High-Intensity Sweeteners (Fastest-Growing)

    <p>In the Alternative Sweeteners Market, the segment distribution reveals that Natural Sweeteners hold a significant portion, attributed to their perceived health benefits and the increasing consumer inclination towards natural products. This category includes sweeteners derived from sources like stevia and monk fruit, making them preferable to many sectors seeking healthier options over traditional sugars. In contrast, High-Intensity Sweeteners have emerged rapidly, carving out a substantial share, particularly among health-conscious consumers looking for lower-calorie alternatives without sacrificing sweetness. Their appeal lies in their powerful sweetness profiles, leading to a growing presence in various food and beverage formulations.</p>

    <p>Natural Sweeteners: Dominant vs. High-Intensity Sweeteners: Emerging</p>

    <p>Natural Sweeteners, derived from plant-based sources, dominate the Alternative Sweeteners Market due to their clean labels and consumer demand for healthier alternatives to sugar. Their popularity is driven by rising health concerns associated with conventional sweeteners and sugar consumption. On the other hand, High-Intensity Sweeteners are gaining traction as emerging options due to their ability to provide intense sweetness with minimal caloric intake. This segment includes products like aspartame and sucralose, which are widely used in diet products and low-calorie beverages. As consumers become more experimental with their dietary choices, High-Intensity Sweeteners are expected to see increased adoption, particularly in the health-conscious demographic.</p>

    By Application: Food and Beverages (Largest) vs. Pharmaceuticals (Fastest-Growing)

    <p>The Alternative Sweeteners Market showcases a varied distribution of applications across four prominent sectors: Food and Beverages, Pharmaceuticals, Cosmetics, and Dietary Supplements. Among these, the Food and Beverages sector holds the largest share, driven by consumer demand for healthier sweetening options. In contrast, the Pharmaceuticals segment is rapidly gaining traction, appealing to both manufacturers and consumers looking for sugar substitutes in medications and supplements.</p>

    <p>Food and Beverages (Dominant) vs. Pharmaceuticals (Emerging)</p>

    <p>The Food and Beverages sector stands out as the dominant player in the Alternative Sweeteners Market, characterized by a broad range of application, including soft drinks, baked goods, and dairy products. Driven by an increasing health-conscious consumer base, products featuring alternative sweeteners are becoming mainstream. The Pharmaceuticals segment, while emerging, is the fastest-growing area, as pharmaceutical companies innovate by incorporating alternative sweeteners into formulations. This trend is propelled by the rising awareness of sugar-related health issues and regulatory support for healthier ingredients.</p>

    By Form: Liquid (Largest) vs. Powder (Fastest-Growing)

    <p>The 'Form' segment of the Alternative Sweeteners Market showcases a dynamic distribution among various forms including liquid, powder, granulated, and tablet. Liquid alternative sweeteners hold the largest share in this segment, appealing to consumers for their ease of use and versatility in beverages. Meanwhile, powder sweeteners are gaining traction, capitalizing on the increasing health consciousness among consumers that prefer less processed forms and convenience in their sweetening options. As the market continues to evolve, these forms are shaping the landscape significantly.</p>

    <p>Liquid (Dominant) vs. Powder (Emerging)</p>

    <p>Liquid alternative sweeteners dominate the Form segment due to their widespread use in beverages and culinary applications. They offer an appealing solution for both manufacturers and consumers seeking to enhance flavor profiles without the calories associated with traditional sweeteners. Powder sweeteners, on the other hand, are emerging as a preferred choice among health-conscious consumers looking for convenient options that integrate easily into meals and snacks. Their growth is driven by increasing demand for low-calorie and natural products, positioning them as a strong competitor in the market.</p>

    By End Use: Household (Largest) vs. Beverage Manufacturing (Fastest-Growing)

    <p>The Alternative Sweeteners Market is diversifying across various end-use segments, with Household accounting for the largest share. This segment is primarily driven by the increasing health consciousness among consumers who are opting for low-calorie and low-sugar alternatives. In contrast, Beverage Manufacturing, while smaller in share, is the fastest-growing segment due to the rapid innovation in beverage products that cater to the demand for healthier options. This growth is fueled by rising consumer preferences for natural and organic ingredients, further bolstered by regulatory support for reduced sugar intake. As the market evolves, the Household segment is witnessing steady demand, reinforced by a growing trend towards home cooking and baking with alternative sweeteners. Meanwhile, the Beverage Manufacturing segment is tapping into trends such as functional beverages, which are designed to enhance health benefits. Emerging brands are increasingly adopting sweeteners derived from natural sources in their formulations, leading to innovative product launches and strategic partnerships with suppliers, fostering a dynamic market landscape.</p>

    <p>Household (Dominant) vs. Beverage Manufacturing (Emerging)</p>

    <p>In the Alternative Sweeteners Market, the Household segment stands out as the dominant force, characterized by a strong consumer base focused on health, wellness, and flavor enhancement in everyday cooking and baking. This segment continually adapts to culinary trends and preferences, making it a staple for families seeking nutritious yet delicious choices. On the other hand, the Beverage Manufacturing segment is emerging as a significant player, driven by innovative product developments that aim to create healthier drink options without compromising on taste. This segment is rapidly evolving, with beverage manufacturers seeking alternative sweetening solutions that align with health trends and sustainability, thereby attracting health-conscious consumers and positioning itself as an integral component of the industry's future.</p>

    Get more detailed insights about Alternative Sweeteners Market Research Report - Global Forecast till 2035

    Regional Insights

    The Alternative Sweeteners Market displays significant regional diversification, with North America leading in market value; it reached 2.45 USD Billion in 2024 and is projected to grow to 4.15 USD Billion by 2035, indicating its majority holding in the industry. Europe follows closely, valued at 2.0 USD Billion in 2024 and projected to rise to 3.25 USD Billion in 2035, influenced by increasing health-conscious consumers advocating for low-calorie sweeteners.

    The Asia Pacific region, valued at 1.8 USD Billion in 2024 and expected to be 3.0 USD Billion by 2035, is gaining traction due to rapid urbanization and dietary changes enhancing market growth.Meanwhile, South America, although smaller at 0.7 USD Billion in 2024 with an increase to 1.25 USD Billion by 2035, shows potential due to growing demand for natural sweeteners. The Middle East and Africa segment remains the least dominant, valued at 0.21 USD Billion in 2024, growing to 0.35 USD Billion by 2035, yet its emerging markets may present future opportunities as consumer preferences evolve.

    Overall, the regional insights illustrate a dynamic landscape with varying demand patterns and preferences, shaping the Alternative Sweeteners Market revenue.

    Alternative Sweeteners Market By Regional

    Source Primary Research, Secondary Research, Market Research Future Database and Analyst Review

    Key Players and Competitive Insights

    The competitive landscape of the Alternative Sweeteners Market is characterized by a multitude of players engaged in the production and distribution of various sweetening agents that serve as substitutes for traditional sugars. With growing health consciousness among consumers, coupled with increasing incidences of lifestyle-related diseases such as diabetes and obesity, the demand for low-calorie and natural sweeteners is on the rise. Companies operating in this sector continuously strive to innovate and expand their product portfolios to meet shifting consumer preferences, while also focusing on sustainability and quality.

    Factors such as distribution networks, competitive pricing, and strong marketing strategies play a pivotal role in determining market positioning among companies.Cargill operates as a formidable player within the Alternative Sweeteners Market, leveraging its extensive resources and global reach to offer a diverse range of products designed to meet varying consumer demands. The company is known for its innovative sweetening solutions, which include a variety of natural and artificial sweeteners that cater to different dietary preferences and regional tastes. Cargill's strengths lie not only in its product portfolio but also in its ability to efficiently scale operations and distribute products worldwide.

    The company has engaged in several mergers and acquisitions to enhance its market position and broaden its capabilities, enabling it to capture significant market shares across different geographies. With a strong commitment to research and development, Cargill is adept at staying ahead of industry trends, thus reinforcing its leading status in the Alternative Sweeteners Market.

    Key Companies in the Alternative Sweeteners Market market include

    Industry Developments

    The Alternative Sweeteners Market has recently experienced significant developments. Notably, major players such as Cargill and Tate and Lyle have been expanding their product lines to meet rising consumer demand for healthier, low-calorie alternatives. Additionally, in September 2023, Dupont declared plans to expand its production capacity for stevia-based sweeteners, reinforcing its commitment to sustainability and innovation. The overall valuation of the Alternative Sweeteners Market has also surged due to heightened awareness of health issues related to sugar consumption, with various studies from credible institutes underscoring the importance of alternative sweeteners in the food industry.

    Meanwhile, Mitsubishi Corporation has introduced new technologies to streamline the manufacturing processes, highlighting the technological advancements shaping the market landscape. These developments collectively emphasize the dynamic nature of the Alternative Sweeteners Market.

    Future Outlook

    Alternative Sweeteners Market Future Outlook

    <p>The Alternative Sweeteners Market is projected to grow at a 5.04% CAGR from 2024 to 2035, driven by rising health consciousness, demand for low-calorie products, and regulatory support.</p>

    New opportunities lie in:

    • <p>Development of innovative plant-based sweeteners for health-focused consumers.</p>
    • <p>Expansion into emerging markets with tailored product offerings.</p>
    • <p>Investment in R&D for sustainable production methods and packaging solutions.</p>

    <p>By 2035, the market is expected to be robust, reflecting evolving consumer preferences and increased product availability.</p>

    Market Segmentation

    Alternative Sweeteners Market Form Outlook

    • Liquid
    • Powder
    • Granulated
    • Tablet

    Alternative Sweeteners Market Type Outlook

    • Natural Sweeteners
    • Artificial Sweeteners
    • Sugar Alcohols
    • High-Intensity Sweeteners
    • Traditional Sweeteners

    Alternative Sweeteners Market End Use Outlook

    • Household
    • Commercial
    • Food Processing
    • Beverage Manufacturing

    Alternative Sweeteners Market Application Outlook

    • Food and Beverages
    • Pharmaceuticals
    • Cosmetics
    • Dietary Supplements

    Report Scope

    MARKET SIZE 20247.16(USD Billion)
    MARKET SIZE 20257.521(USD Billion)
    MARKET SIZE 203512.3(USD Billion)
    COMPOUND ANNUAL GROWTH RATE (CAGR)5.04% (2024 - 2035)
    REPORT COVERAGERevenue Forecast, Competitive Landscape, Growth Factors, and Trends
    BASE YEAR2024
    Market Forecast Period2025 - 2035
    Historical Data2019 - 2024
    Market Forecast UnitsUSD Billion
    Key Companies ProfiledMarket analysis in progress
    Segments CoveredMarket segmentation analysis in progress
    Key Market OpportunitiesGrowing consumer demand for healthier, low-calorie options drives innovation in the Alternative Sweeteners Market.
    Key Market DynamicsRising consumer demand for healthier options drives innovation and competition in the alternative sweeteners market.
    Countries CoveredNorth America, Europe, APAC, South America, MEA

    FAQs

    What is the expected market size of the Alternative Sweeteners Market in 2024?

    The Alternative Sweeteners Market is expected to be valued at 7.16 USD Billion in 2024.

    What is the projected market size for the Alternative Sweeteners Market by 2035?

    The market size is anticipated to reach 12.3 USD Billion by the year 2035.

    What is the expected compound annual growth rate (CAGR) for the Alternative Sweeteners Market from 2025 to 2035?

    The expected CAGR for the Alternative Sweeteners Market is 5.04% during the forecast period from 2025 to 2035.

    Which region holds the largest market share for the Alternative Sweeteners Market in 2024?

    North America holds the largest market share, valued at 2.45 USD Billion in 2024.

    What will be the market size of the Alternative Sweeteners Market in Europe by 2035?

    The market size in Europe is expected to grow to 3.25 USD Billion by 2035.

    Can you name some key players in the Alternative Sweeteners Market?

    Major players in the market include Cargill, Dupont, and Tate &amp; Lyle among others.

    What are the expected market values for Natural Sweeteners by 2035?

    Natural Sweeteners are projected to have a market value of 4.0 USD Billion by 2035.

    What market growth rate is anticipated specifically for the Asia Pacific region from 2025 to 2035?

    The Asia Pacific region is expected to experience a growth rate that raises its market value to 3.0 USD Billion by 2035.

    What will be the market value for Sugar Alcohols in 2024?

    The market value for Sugar Alcohols is estimated to be 1.5 USD Billion in 2024.

    What are some key trends expected to drive growth in the Alternative Sweeteners Market?

    Trends such as increasing health consciousness and demand for low-calorie food products are expected to drive market growth.

    1. EXECUTIVE SUMMARY
      1. Market
      2. Overview
      3. Key Findings
      4. Market Segmentation
      5. Competitive
      6. Landscape
      7. Challenges and Opportunities
      8. Future Outlook
      9. \r\n
    2. MARKET INTRODUCTION
      1. Definition
      2. Scope of the study
        1. Research Objective
        2. Assumption
        3. Limitations
    3. RESEARCH METHODOLOGY
      1. Overview
      2. Data Mining
      3. 3.3.
      4. Secondary Research
      5. Primary Research
        1. Primary Interviews and
        2. Breakdown of Primary Respondents
      6. Information Gathering Process
      7. Forecasting Model
      8. Market Size Estimation
        1. Bottom-Up
        2. Top-Down Approach
      9. Approach
      10. Data Triangulation
      11. 3.8.
      12. Validation
      13. \r\n
    4. MARKET DYNAMICS
      1. Overview
      2. 4.2.
      3. Drivers
      4. Restraints
      5. Opportunities
    5. MARKET FACTOR ANALYSIS
      1. Value chain Analysis
      2. Porter's Five Forces Analysis
        1. Bargaining Power of Buyers
        2. Threat of Substitutes
        3. Intensity
      3. 5.2.1.
      4. Bargaining Power of Suppliers
      5. 5.2.3.
      6. Threat of New Entrants
      7. of Rivalry
      8. COVID-19 Impact Analysis
        1. Market Impact Analysis
        2. Regional Impact
        3. Opportunity and Threat Analysis
      9. \r\n
    6. ALTERNATIVE SWEETENERS MARKET, BY TYPE (USD BILLION)
      1. Natural
      2. Sweeteners
      3. Artificial Sweeteners
      4. Sugar Alcohols
      5. 6.4.
      6. High-Intensity Sweeteners
      7. Traditional Sweeteners
    7. ALTERNATIVE
    8. SWEETENERS MARKET, BY APPLICATION (USD BILLION)
      1. Food and Beverages
      2. Pharmaceuticals
      3. Cosmetics
      4. Dietary Supplements
      5. 8.
    9. ALTERNATIVE SWEETENERS MARKET, BY FORM (USD BILLION)
      1. Liquid
      2. 8.2.
      3. Powder
      4. Granulated
      5. Tablet
    10. ALTERNATIVE SWEETENERS MARKET,
      1. BY END USE (USD BILLION)
      2. Household
      3. Commercial
      4. Food
      5. Processing
      6. Beverage Manufacturing
    11. ALTERNATIVE SWEETENERS MARKET,
      1. BY REGIONAL (USD BILLION)
      2. North America
        1. US
      3. 10.1.2.
      4. Canada
      5. Europe
        1. Germany
        2. UK
        3. France
        4. Russia
        5. Italy
        6. Spain
        7. Rest
      6. of Europe
      7. APAC
        1. China
        2. India
        3. South Korea
        4. Malaysia
        5. Thailand
        6. Indonesia
        7. Rest of APAC
      8. 10.3.3.
      9. Japan
      10. South America
        1. Mexico
        2. Argentina
        3. Rest of South
      11. 10.4.1.
      12. Brazil
      13. America
      14. MEA
        1. GCC Countries
        2. South Africa
        3. Rest of MEA
      15. \r\n
    12. COMPETITIVE LANDSCAPE
      1. 11.1.
      2. Overview
      3. Competitive Analysis
      4. Market share Analysis
      5. Major Growth Strategy in the Alternative Sweeteners Market
      6. Competitive
      7. Benchmarking
      8. Leading Players in Terms of Number of Developments in the
      9. Alternative Sweeteners Market
      10. Key developments and growth strategies
        1. New Product Launch/Service Deployment
        2. Merger & Acquisitions
        3. Joint Ventures
      11. Major Players Financial Matrix
        1. Major Players R&D Expenditure. 2023
      12. 11.8.1.
      13. Sales and Operating Income
    13. COMPANY PROFILES
      1. Hawkins Watts
        1. Financial Overview
        2. Products Offered
        3. Key Developments
        4. SWOT
        5. Key Strategies
      2. Analysis
      3. Cargill
        1. Financial
        2. Products Offered
        3. Key Developments
        4. Key Strategies
      4. Overview
      5. 12.2.4.
      6. SWOT Analysis
      7. Marmon Group
        1. Products Offered
        2. Key Developments
        3. SWOT Analysis
        4. Key Strategies
      8. 12.3.1.
      9. Financial Overview
      10. Dupont
        1. Financial Overview
        2. Products Offered
        3. Key Developments
        4. SWOT Analysis
        5. Key Strategies
      11. Hershey
        1. Financial Overview
        2. Products Offered
        3. Key Developments
        4. SWOT Analysis
        5. Key Strategies
      12. Tate &
        1. Financial Overview
        2. Products Offered
        3. SWOT Analysis
        4. Key Strategies
        5. Financial Overview
        6. Products Offered
        7. SWOT Analysis
        8. Key Strategies
        9. Financial Overview
        10. Products Offered
        11. Key Developments
        12. SWOT Analysis
        13. Key Strategies
      13. Lyle
      14. 12.6.3.
      15. Key Developments
      16. 12.7.
      17. Frutarom
      18. 12.7.3.
      19. Key Developments
      20. 12.8.
      21. Sweeteners Plus
      22. Mitsubishi Corporation
        1. Financial Overview
        2. Key Developments
        3. SWOT Analysis
        4. Key Strategies
      23. 12.9.2.
      24. Products Offered
      25. NutraSweet
        1. Financial Overview
        2. Products Offered
        3. Key Developments
        4. SWOT
        5. Key Strategies
      26. Analysis
      27. Ajinomoto
        1. Financial
        2. Products Offered
        3. Key Developments
        4. Key Strategies
      28. Overview
      29. 12.11.4.
      30. SWOT Analysis
      31. Sensient Technologies
        1. Financial Overview
        2. Products Offered
        3. Key
        4. SWOT Analysis
        5. Key Strategies
        6. Financial Overview
        7. Products Offered
        8. Key Developments
        9. SWOT Analysis
        10. Key Strategies
      32. Developments
      33. 12.13.
      34. PureCircle
    14. APPENDIX
      1. References
      2. Related Reports
      3. LIST
    15. OF TABLES
      1. \r\nTABLE 1. LIST OF ASSUMPTIONS
    16. NORTH AMERICA ALTERNATIVE
    17. SWEETENERS MARKET SIZE ESTIMATES & FORECAST, BY TYPE, 2019-2035 (USD BILLIONS)
    18. NORTH AMERICA ALTERNATIVE SWEETENERS MARKET SIZE ESTIMATES &
      1. FORECAST, BY APPLICATION, 2019-2035 (USD BILLIONS)
    19. NORTH AMERICA
    20. ALTERNATIVE SWEETENERS MARKET SIZE ESTIMATES & FORECAST, BY FORM, 2019-2035
      1. (USD BILLIONS)
    21. NORTH AMERICA ALTERNATIVE SWEETENERS MARKET SIZE ESTIMATES
      1. & FORECAST, BY END USE, 2019-2035 (USD BILLIONS)
    22. NORTH AMERICA
    23. ALTERNATIVE SWEETENERS MARKET SIZE ESTIMATES & FORECAST, BY REGIONAL, 2019-2035
      1. (USD BILLIONS)
    24. US ALTERNATIVE SWEETENERS MARKET SIZE ESTIMATES &
      1. FORECAST, BY TYPE, 2019-2035 (USD BILLIONS)
    25. US ALTERNATIVE SWEETENERS
    26. MARKET SIZE ESTIMATES & FORECAST, BY APPLICATION, 2019-2035 (USD BILLIONS)
    27. US ALTERNATIVE SWEETENERS MARKET SIZE ESTIMATES & FORECAST, BY FORM,
    28. US ALTERNATIVE SWEETENERS MARKET SIZE ESTIMATES
      1. & FORECAST, BY END USE, 2019-2035 (USD BILLIONS)
    29. US ALTERNATIVE
    30. SWEETENERS MARKET SIZE ESTIMATES & FORECAST, BY REGIONAL, 2019-2035 (USD BILLIONS)
    31. CANADA ALTERNATIVE SWEETENERS MARKET SIZE ESTIMATES & FORECAST,
      1. BY TYPE, 2019-2035 (USD BILLIONS)
    32. CANADA ALTERNATIVE SWEETENERS
    33. MARKET SIZE ESTIMATES & FORECAST, BY APPLICATION, 2019-2035 (USD BILLIONS)
    34. CANADA ALTERNATIVE SWEETENERS MARKET SIZE ESTIMATES & FORECAST,
      1. BY FORM, 2019-2035 (USD BILLIONS)
    35. CANADA ALTERNATIVE SWEETENERS
    36. MARKET SIZE ESTIMATES & FORECAST, BY END USE, 2019-2035 (USD BILLIONS)
      1. TABLE
    37. CANADA ALTERNATIVE SWEETENERS MARKET SIZE ESTIMATES & FORECAST, BY REGIONAL,
    38. EUROPE ALTERNATIVE SWEETENERS MARKET SIZE
      1. ESTIMATES & FORECAST, BY TYPE, 2019-2035 (USD BILLIONS)
    39. EUROPE
    40. ALTERNATIVE SWEETENERS MARKET SIZE ESTIMATES & FORECAST, BY APPLICATION, 2019-2035
      1. (USD BILLIONS)
    41. EUROPE ALTERNATIVE SWEETENERS MARKET SIZE ESTIMATES
      1. & FORECAST, BY FORM, 2019-2035 (USD BILLIONS)
    42. EUROPE ALTERNATIVE
    43. SWEETENERS MARKET SIZE ESTIMATES & FORECAST, BY END USE, 2019-2035 (USD BILLIONS)
    44. EUROPE ALTERNATIVE SWEETENERS MARKET SIZE ESTIMATES & FORECAST,
      1. BY REGIONAL, 2019-2035 (USD BILLIONS)
    45. GERMANY ALTERNATIVE SWEETENERS
    46. MARKET SIZE ESTIMATES & FORECAST, BY TYPE, 2019-2035 (USD BILLIONS)
      1. TABLE
    47. GERMANY ALTERNATIVE SWEETENERS MARKET SIZE ESTIMATES & FORECAST, BY APPLICATION,
    48. GERMANY ALTERNATIVE SWEETENERS MARKET SIZE
      1. ESTIMATES & FORECAST, BY FORM, 2019-2035 (USD BILLIONS)
    49. GERMANY
    50. ALTERNATIVE SWEETENERS MARKET SIZE ESTIMATES & FORECAST, BY END USE, 2019-2035
      1. (USD BILLIONS)
    51. GERMANY ALTERNATIVE SWEETENERS MARKET SIZE ESTIMATES
      1. & FORECAST, BY REGIONAL, 2019-2035 (USD BILLIONS)
    52. UK ALTERNATIVE
    53. SWEETENERS MARKET SIZE ESTIMATES & FORECAST, BY TYPE, 2019-2035 (USD BILLIONS)
    54. UK ALTERNATIVE SWEETENERS MARKET SIZE ESTIMATES & FORECAST,
      1. BY APPLICATION, 2019-2035 (USD BILLIONS)
    55. UK ALTERNATIVE SWEETENERS
    56. MARKET SIZE ESTIMATES & FORECAST, BY FORM, 2019-2035 (USD BILLIONS)
      1. TABLE
    57. UK ALTERNATIVE SWEETENERS MARKET SIZE ESTIMATES & FORECAST, BY END USE,
    58. UK ALTERNATIVE SWEETENERS MARKET SIZE ESTIMATES
      1. & FORECAST, BY REGIONAL, 2019-2035 (USD BILLIONS)
    59. FRANCE ALTERNATIVE
    60. SWEETENERS MARKET SIZE ESTIMATES & FORECAST, BY TYPE, 2019-2035 (USD BILLIONS)
    61. FRANCE ALTERNATIVE SWEETENERS MARKET SIZE ESTIMATES & FORECAST,
      1. BY APPLICATION, 2019-2035 (USD BILLIONS)
    62. FRANCE ALTERNATIVE SWEETENERS
    63. MARKET SIZE ESTIMATES & FORECAST, BY FORM, 2019-2035 (USD BILLIONS)
      1. TABLE
    64. FRANCE ALTERNATIVE SWEETENERS MARKET SIZE ESTIMATES & FORECAST, BY END USE,
    65. FRANCE ALTERNATIVE SWEETENERS MARKET SIZE
      1. ESTIMATES & FORECAST, BY REGIONAL, 2019-2035 (USD BILLIONS)
      2. TABLE 37.
    66. RUSSIA ALTERNATIVE SWEETENERS MARKET SIZE ESTIMATES & FORECAST, BY TYPE, 2019-2035
      1. (USD BILLIONS)
    67. RUSSIA ALTERNATIVE SWEETENERS MARKET SIZE ESTIMATES
      1. & FORECAST, BY APPLICATION, 2019-2035 (USD BILLIONS)
    68. RUSSIA
    69. ALTERNATIVE SWEETENERS MARKET SIZE ESTIMATES & FORECAST, BY FORM, 2019-2035
      1. (USD BILLIONS)
    70. RUSSIA ALTERNATIVE SWEETENERS MARKET SIZE ESTIMATES
      1. & FORECAST, BY END USE, 2019-2035 (USD BILLIONS)
    71. RUSSIA ALTERNATIVE
    72. SWEETENERS MARKET SIZE ESTIMATES & FORECAST, BY REGIONAL, 2019-2035 (USD BILLIONS)
    73. ITALY ALTERNATIVE SWEETENERS MARKET SIZE ESTIMATES & FORECAST,
      1. BY TYPE, 2019-2035 (USD BILLIONS)
    74. ITALY ALTERNATIVE SWEETENERS MARKET
      1. SIZE ESTIMATES & FORECAST, BY APPLICATION, 2019-2035 (USD BILLIONS)
      2. TABLE
    75. ITALY ALTERNATIVE SWEETENERS MARKET SIZE ESTIMATES & FORECAST, BY FORM,
    76. ITALY ALTERNATIVE SWEETENERS MARKET SIZE
      1. ESTIMATES & FORECAST, BY END USE, 2019-2035 (USD BILLIONS)
    77. ITALY
    78. ALTERNATIVE SWEETENERS MARKET SIZE ESTIMATES & FORECAST, BY REGIONAL, 2019-2035
      1. (USD BILLIONS)
    79. SPAIN ALTERNATIVE SWEETENERS MARKET SIZE ESTIMATES
      1. & FORECAST, BY TYPE, 2019-2035 (USD BILLIONS)
    80. SPAIN ALTERNATIVE
    81. SWEETENERS MARKET SIZE ESTIMATES & FORECAST, BY APPLICATION, 2019-2035 (USD
      1. BILLIONS)
    82. SPAIN ALTERNATIVE SWEETENERS MARKET SIZE ESTIMATES &
      1. FORECAST, BY FORM, 2019-2035 (USD BILLIONS)
    83. SPAIN ALTERNATIVE SWEETENERS
    84. MARKET SIZE ESTIMATES & FORECAST, BY END USE, 2019-2035 (USD BILLIONS)
      1. TABLE
    85. SPAIN ALTERNATIVE SWEETENERS MARKET SIZE ESTIMATES & FORECAST, BY REGIONAL,
    86. REST OF EUROPE ALTERNATIVE SWEETENERS MARKET
      1. SIZE ESTIMATES & FORECAST, BY TYPE, 2019-2035 (USD BILLIONS)
      2. TABLE 53.
    87. REST OF EUROPE ALTERNATIVE SWEETENERS MARKET SIZE ESTIMATES & FORECAST, BY APPLICATION,
    88. REST OF EUROPE ALTERNATIVE SWEETENERS MARKET
      1. SIZE ESTIMATES & FORECAST, BY FORM, 2019-2035 (USD BILLIONS)
      2. TABLE 55.
    89. REST OF EUROPE ALTERNATIVE SWEETENERS MARKET SIZE ESTIMATES & FORECAST, BY END
      1. USE, 2019-2035 (USD BILLIONS)
    90. REST OF EUROPE ALTERNATIVE SWEETENERS
    91. MARKET SIZE ESTIMATES & FORECAST, BY REGIONAL, 2019-2035 (USD BILLIONS)
    92. APAC ALTERNATIVE SWEETENERS MARKET SIZE ESTIMATES & FORECAST, BY
      1. TYPE, 2019-2035 (USD BILLIONS)
    93. APAC ALTERNATIVE SWEETENERS MARKET
      1. SIZE ESTIMATES & FORECAST, BY APPLICATION, 2019-2035 (USD BILLIONS)
      2. TABLE
    94. APAC ALTERNATIVE SWEETENERS MARKET SIZE ESTIMATES & FORECAST, BY FORM, 2019-2035
      1. (USD BILLIONS)
    95. APAC ALTERNATIVE SWEETENERS MARKET SIZE ESTIMATES
      1. & FORECAST, BY END USE, 2019-2035 (USD BILLIONS)
    96. APAC ALTERNATIVE
    97. SWEETENERS MARKET SIZE ESTIMATES & FORECAST, BY REGIONAL, 2019-2035 (USD BILLIONS)
    98. CHINA ALTERNATIVE SWEETENERS MARKET SIZE ESTIMATES & FORECAST,
      1. BY TYPE, 2019-2035 (USD BILLIONS)
    99. CHINA ALTERNATIVE SWEETENERS MARKET
      1. SIZE ESTIMATES & FORECAST, BY APPLICATION, 2019-2035 (USD BILLIONS)
      2. TABLE
    100. CHINA ALTERNATIVE SWEETENERS MARKET SIZE ESTIMATES & FORECAST, BY FORM,
    101. CHINA ALTERNATIVE SWEETENERS MARKET SIZE
      1. ESTIMATES & FORECAST, BY END USE, 2019-2035 (USD BILLIONS)
    102. CHINA
    103. ALTERNATIVE SWEETENERS MARKET SIZE ESTIMATES & FORECAST, BY REGIONAL, 2019-2035
      1. (USD BILLIONS)
    104. INDIA ALTERNATIVE SWEETENERS MARKET SIZE ESTIMATES
      1. & FORECAST, BY TYPE, 2019-2035 (USD BILLIONS)
    105. INDIA ALTERNATIVE
    106. SWEETENERS MARKET SIZE ESTIMATES & FORECAST, BY APPLICATION, 2019-2035 (USD
      1. BILLIONS)
    107. INDIA ALTERNATIVE SWEETENERS MARKET SIZE ESTIMATES &
      1. FORECAST, BY FORM, 2019-2035 (USD BILLIONS)
    108. INDIA ALTERNATIVE SWEETENERS
    109. MARKET SIZE ESTIMATES & FORECAST, BY END USE, 2019-2035 (USD BILLIONS)
      1. TABLE
    110. INDIA ALTERNATIVE SWEETENERS MARKET SIZE ESTIMATES & FORECAST, BY REGIONAL,
    111. JAPAN ALTERNATIVE SWEETENERS MARKET SIZE
      1. ESTIMATES & FORECAST, BY TYPE, 2019-2035 (USD BILLIONS)
    112. JAPAN
    113. ALTERNATIVE SWEETENERS MARKET SIZE ESTIMATES & FORECAST, BY APPLICATION, 2019-2035
      1. (USD BILLIONS)
    114. JAPAN ALTERNATIVE SWEETENERS MARKET SIZE ESTIMATES
      1. & FORECAST, BY FORM, 2019-2035 (USD BILLIONS)
    115. JAPAN ALTERNATIVE
    116. SWEETENERS MARKET SIZE ESTIMATES & FORECAST, BY END USE, 2019-2035 (USD BILLIONS)
    117. JAPAN ALTERNATIVE SWEETENERS MARKET SIZE ESTIMATES & FORECAST,
      1. BY REGIONAL, 2019-2035 (USD BILLIONS)
    118. SOUTH KOREA ALTERNATIVE SWEETENERS
    119. MARKET SIZE ESTIMATES & FORECAST, BY TYPE, 2019-2035 (USD BILLIONS)
      1. TABLE
    120. SOUTH KOREA ALTERNATIVE SWEETENERS MARKET SIZE ESTIMATES & FORECAST, BY
      1. APPLICATION, 2019-2035 (USD BILLIONS)
    121. SOUTH KOREA ALTERNATIVE SWEETENERS
    122. MARKET SIZE ESTIMATES & FORECAST, BY FORM, 2019-2035 (USD BILLIONS)
      1. TABLE
    123. SOUTH KOREA ALTERNATIVE SWEETENERS MARKET SIZE ESTIMATES & FORECAST, BY
      1. END USE, 2019-2035 (USD BILLIONS)
    124. SOUTH KOREA ALTERNATIVE SWEETENERS
    125. MARKET SIZE ESTIMATES & FORECAST, BY REGIONAL, 2019-2035 (USD BILLIONS)
    126. MALAYSIA ALTERNATIVE SWEETENERS MARKET SIZE ESTIMATES & FORECAST,
      1. BY TYPE, 2019-2035 (USD BILLIONS)
    127. MALAYSIA ALTERNATIVE SWEETENERS
    128. MARKET SIZE ESTIMATES & FORECAST, BY APPLICATION, 2019-2035 (USD BILLIONS)
    129. MALAYSIA ALTERNATIVE SWEETENERS MARKET SIZE ESTIMATES & FORECAST,
      1. BY FORM, 2019-2035 (USD BILLIONS)
    130. MALAYSIA ALTERNATIVE SWEETENERS
    131. MARKET SIZE ESTIMATES & FORECAST, BY END USE, 2019-2035 (USD BILLIONS)
      1. TABLE
    132. MALAYSIA ALTERNATIVE SWEETENERS MARKET SIZE ESTIMATES & FORECAST, BY REGIONAL,
    133. THAILAND ALTERNATIVE SWEETENERS MARKET
      1. SIZE ESTIMATES & FORECAST, BY TYPE, 2019-2035 (USD BILLIONS)
      2. TABLE 88.
    134. THAILAND ALTERNATIVE SWEETENERS MARKET SIZE ESTIMATES & FORECAST, BY APPLICATION,
    135. THAILAND ALTERNATIVE SWEETENERS MARKET
      1. SIZE ESTIMATES & FORECAST, BY FORM, 2019-2035 (USD BILLIONS)
      2. TABLE 90.
    136. THAILAND ALTERNATIVE SWEETENERS MARKET SIZE ESTIMATES & FORECAST, BY END USE,
    137. THAILAND ALTERNATIVE SWEETENERS MARKET
      1. SIZE ESTIMATES & FORECAST, BY REGIONAL, 2019-2035 (USD BILLIONS)
      2. TABLE
    138. INDONESIA ALTERNATIVE SWEETENERS MARKET SIZE ESTIMATES & FORECAST, BY TYPE,
    139. INDONESIA ALTERNATIVE SWEETENERS MARKET
      1. SIZE ESTIMATES & FORECAST, BY APPLICATION, 2019-2035 (USD BILLIONS)
      2. TABLE
    140. INDONESIA ALTERNATIVE SWEETENERS MARKET SIZE ESTIMATES & FORECAST, BY FORM,
    141. INDONESIA ALTERNATIVE SWEETENERS MARKET
      1. SIZE ESTIMATES & FORECAST, BY END USE, 2019-2035 (USD BILLIONS)
      2. TABLE
    142. INDONESIA ALTERNATIVE SWEETENERS MARKET SIZE ESTIMATES & FORECAST, BY REGIONAL,
    143. REST OF APAC ALTERNATIVE SWEETENERS MARKET
      1. SIZE ESTIMATES & FORECAST, BY TYPE, 2019-2035 (USD BILLIONS)
      2. TABLE 98.
    144. REST OF APAC ALTERNATIVE SWEETENERS MARKET SIZE ESTIMATES & FORECAST, BY APPLICATION,
    145. REST OF APAC ALTERNATIVE SWEETENERS MARKET
      1. SIZE ESTIMATES & FORECAST, BY FORM, 2019-2035 (USD BILLIONS)
      2. TABLE 100.
    146. REST OF APAC ALTERNATIVE SWEETENERS MARKET SIZE ESTIMATES & FORECAST, BY END
      1. USE, 2019-2035 (USD BILLIONS)
    147. REST OF APAC ALTERNATIVE SWEETENERS
    148. MARKET SIZE ESTIMATES & FORECAST, BY REGIONAL, 2019-2035 (USD BILLIONS)
    149. SOUTH AMERICA ALTERNATIVE SWEETENERS MARKET SIZE ESTIMATES & FORECAST,
      1. BY TYPE, 2019-2035 (USD BILLIONS)
    150. SOUTH AMERICA ALTERNATIVE SWEETENERS
    151. MARKET SIZE ESTIMATES & FORECAST, BY APPLICATION, 2019-2035 (USD BILLIONS)
    152. SOUTH AMERICA ALTERNATIVE SWEETENERS MARKET SIZE ESTIMATES & FORECAST,
      1. BY FORM, 2019-2035 (USD BILLIONS)
    153. SOUTH AMERICA ALTERNATIVE SWEETENERS
    154. MARKET SIZE ESTIMATES & FORECAST, BY END USE, 2019-2035 (USD BILLIONS)
      1. TABLE
    155. SOUTH AMERICA ALTERNATIVE SWEETENERS MARKET SIZE ESTIMATES & FORECAST,
      1. BY REGIONAL, 2019-2035 (USD BILLIONS)
    156. BRAZIL ALTERNATIVE SWEETENERS
    157. MARKET SIZE ESTIMATES & FORECAST, BY TYPE, 2019-2035 (USD BILLIONS)
      1. TABLE
    158. BRAZIL ALTERNATIVE SWEETENERS MARKET SIZE ESTIMATES & FORECAST, BY APPLICATION,
    159. BRAZIL ALTERNATIVE SWEETENERS MARKET SIZE
      1. ESTIMATES & FORECAST, BY FORM, 2019-2035 (USD BILLIONS)
    160. BRAZIL
    161. ALTERNATIVE SWEETENERS MARKET SIZE ESTIMATES & FORECAST, BY END USE, 2019-2035
      1. (USD BILLIONS)
    162. BRAZIL ALTERNATIVE SWEETENERS MARKET SIZE ESTIMATES
      1. & FORECAST, BY REGIONAL, 2019-2035 (USD BILLIONS)
    163. MEXICO ALTERNATIVE
    164. SWEETENERS MARKET SIZE ESTIMATES & FORECAST, BY TYPE, 2019-2035 (USD BILLIONS)
    165. MEXICO ALTERNATIVE SWEETENERS MARKET SIZE ESTIMATES & FORECAST,
      1. BY APPLICATION, 2019-2035 (USD BILLIONS)
    166. MEXICO ALTERNATIVE SWEETENERS
    167. MARKET SIZE ESTIMATES & FORECAST, BY FORM, 2019-2035 (USD BILLIONS)
      1. TABLE
    168. MEXICO ALTERNATIVE SWEETENERS MARKET SIZE ESTIMATES & FORECAST, BY END
      1. USE, 2019-2035 (USD BILLIONS)
    169. MEXICO ALTERNATIVE SWEETENERS MARKET
      1. SIZE ESTIMATES & FORECAST, BY REGIONAL, 2019-2035 (USD BILLIONS)
      2. TABLE
    170. ARGENTINA ALTERNATIVE SWEETENERS MARKET SIZE ESTIMATES & FORECAST, BY TYPE,
    171. ARGENTINA ALTERNATIVE SWEETENERS MARKET
      1. SIZE ESTIMATES & FORECAST, BY APPLICATION, 2019-2035 (USD BILLIONS)
      2. TABLE
    172. ARGENTINA ALTERNATIVE SWEETENERS MARKET SIZE ESTIMATES & FORECAST, BY FORM,
    173. ARGENTINA ALTERNATIVE SWEETENERS MARKET
      1. SIZE ESTIMATES & FORECAST, BY END USE, 2019-2035 (USD BILLIONS)
      2. TABLE
    174. ARGENTINA ALTERNATIVE SWEETENERS MARKET SIZE ESTIMATES & FORECAST, BY REGIONAL,
    175. REST OF SOUTH AMERICA ALTERNATIVE SWEETENERS
    176. MARKET SIZE ESTIMATES & FORECAST, BY TYPE, 2019-2035 (USD BILLIONS)
      1. TABLE
    177. REST OF SOUTH AMERICA ALTERNATIVE SWEETENERS MARKET SIZE ESTIMATES & FORECAST,
      1. BY APPLICATION, 2019-2035 (USD BILLIONS)
    178. REST OF SOUTH AMERICA
    179. ALTERNATIVE SWEETENERS MARKET SIZE ESTIMATES & FORECAST, BY FORM, 2019-2035
      1. (USD BILLIONS)
    180. REST OF SOUTH AMERICA ALTERNATIVE SWEETENERS MARKET
      1. SIZE ESTIMATES & FORECAST, BY END USE, 2019-2035 (USD BILLIONS)
      2. TABLE
    181. REST OF SOUTH AMERICA ALTERNATIVE SWEETENERS MARKET SIZE ESTIMATES & FORECAST,
      1. BY REGIONAL, 2019-2035 (USD BILLIONS)
    182. MEA ALTERNATIVE SWEETENERS
    183. MARKET SIZE ESTIMATES & FORECAST, BY TYPE, 2019-2035 (USD BILLIONS)
      1. TABLE
    184. MEA ALTERNATIVE SWEETENERS MARKET SIZE ESTIMATES & FORECAST, BY APPLICATION,
    185. MEA ALTERNATIVE SWEETENERS MARKET SIZE
      1. ESTIMATES & FORECAST, BY FORM, 2019-2035 (USD BILLIONS)
    186. MEA
    187. ALTERNATIVE SWEETENERS MARKET SIZE ESTIMATES & FORECAST, BY END USE, 2019-2035
      1. (USD BILLIONS)
    188. MEA ALTERNATIVE SWEETENERS MARKET SIZE ESTIMATES
      1. & FORECAST, BY REGIONAL, 2019-2035 (USD BILLIONS)
    189. GCC COUNTRIES
    190. ALTERNATIVE SWEETENERS MARKET SIZE ESTIMATES & FORECAST, BY TYPE, 2019-2035
      1. (USD BILLIONS)
    191. GCC COUNTRIES ALTERNATIVE SWEETENERS MARKET SIZE
      1. ESTIMATES & FORECAST, BY APPLICATION, 2019-2035 (USD BILLIONS)
      2. TABLE 134.
    192. GCC COUNTRIES ALTERNATIVE SWEETENERS MARKET SIZE ESTIMATES & FORECAST, BY FORM,
    193. GCC COUNTRIES ALTERNATIVE SWEETENERS MARKET
      1. SIZE ESTIMATES & FORECAST, BY END USE, 2019-2035 (USD BILLIONS)
      2. TABLE
    194. GCC COUNTRIES ALTERNATIVE SWEETENERS MARKET SIZE ESTIMATES & FORECAST,
      1. BY REGIONAL, 2019-2035 (USD BILLIONS)
    195. SOUTH AFRICA ALTERNATIVE
    196. SWEETENERS MARKET SIZE ESTIMATES & FORECAST, BY TYPE, 2019-2035 (USD BILLIONS)
    197. SOUTH AFRICA ALTERNATIVE SWEETENERS MARKET SIZE ESTIMATES &
      1. FORECAST, BY APPLICATION, 2019-2035 (USD BILLIONS)
    198. SOUTH AFRICA
    199. ALTERNATIVE SWEETENERS MARKET SIZE ESTIMATES & FORECAST, BY FORM, 2019-2035
      1. (USD BILLIONS)
    200. SOUTH AFRICA ALTERNATIVE SWEETENERS MARKET SIZE
      1. ESTIMATES & FORECAST, BY END USE, 2019-2035 (USD BILLIONS)
      2. TABLE 141.
    201. SOUTH AFRICA ALTERNATIVE SWEETENERS MARKET SIZE ESTIMATES & FORECAST, BY REGIONAL,
    202. REST OF MEA ALTERNATIVE SWEETENERS MARKET
      1. SIZE ESTIMATES & FORECAST, BY TYPE, 2019-2035 (USD BILLIONS)
      2. TABLE 143.
    203. REST OF MEA ALTERNATIVE SWEETENERS MARKET SIZE ESTIMATES & FORECAST, BY APPLICATION,
    204. REST OF MEA ALTERNATIVE SWEETENERS MARKET
      1. SIZE ESTIMATES & FORECAST, BY FORM, 2019-2035 (USD BILLIONS)
      2. TABLE 145.
    205. REST OF MEA ALTERNATIVE SWEETENERS MARKET SIZE ESTIMATES & FORECAST, BY END
      1. USE, 2019-2035 (USD BILLIONS)
    206. REST OF MEA ALTERNATIVE SWEETENERS
    207. MARKET SIZE ESTIMATES & FORECAST, BY REGIONAL, 2019-2035 (USD BILLIONS)
    208. PRODUCT LAUNCH/PRODUCT DEVELOPMENT/APPROVAL
    209. ACQUISITION/PARTNERSHIP
      1. \r\nLIST
    210. OF FIGURES
      1. \r\nFIGURE 1. MARKET SYNOPSIS
    211. NORTH AMERICA ALTERNATIVE
    212. SWEETENERS MARKET ANALYSIS
    213. US ALTERNATIVE SWEETENERS MARKET ANALYSIS
      1. BY TYPE
    214. US ALTERNATIVE SWEETENERS MARKET ANALYSIS BY APPLICATION
    215. US ALTERNATIVE SWEETENERS MARKET ANALYSIS BY FORM
      1. FIGURE 6.
      2. US ALTERNATIVE SWEETENERS MARKET ANALYSIS BY END USE
    216. US ALTERNATIVE
      1. SWEETENERS MARKET ANALYSIS BY REGIONAL
    217. CANADA ALTERNATIVE SWEETENERS
      1. MARKET ANALYSIS BY TYPE
    218. CANADA ALTERNATIVE SWEETENERS MARKET ANALYSIS
      1. BY APPLICATION
    219. CANADA ALTERNATIVE SWEETENERS MARKET ANALYSIS BY
      1. FORM
    220. CANADA ALTERNATIVE SWEETENERS MARKET ANALYSIS BY END USE
    221. CANADA ALTERNATIVE SWEETENERS MARKET ANALYSIS BY REGIONAL
      1. FIGURE
    222. EUROPE ALTERNATIVE SWEETENERS MARKET ANALYSIS
    223. GERMANY ALTERNATIVE
      1. SWEETENERS MARKET ANALYSIS BY TYPE
    224. GERMANY ALTERNATIVE SWEETENERS
      1. MARKET ANALYSIS BY APPLICATION
    225. GERMANY ALTERNATIVE SWEETENERS MARKET
      1. ANALYSIS BY FORM
    226. GERMANY ALTERNATIVE SWEETENERS MARKET ANALYSIS
      1. BY END USE
    227. GERMANY ALTERNATIVE SWEETENERS MARKET ANALYSIS BY REGIONAL
    228. UK ALTERNATIVE SWEETENERS MARKET ANALYSIS BY TYPE
      1. FIGURE
    229. UK ALTERNATIVE SWEETENERS MARKET ANALYSIS BY APPLICATION
    230. UK
      1. ALTERNATIVE SWEETENERS MARKET ANALYSIS BY FORM
    231. UK ALTERNATIVE SWEETENERS
      1. MARKET ANALYSIS BY END USE
    232. UK ALTERNATIVE SWEETENERS MARKET ANALYSIS
      1. BY REGIONAL
    233. FRANCE ALTERNATIVE SWEETENERS MARKET ANALYSIS BY TYPE
    234. FRANCE ALTERNATIVE SWEETENERS MARKET ANALYSIS BY APPLICATION
    235. FRANCE ALTERNATIVE SWEETENERS MARKET ANALYSIS BY FORM
      1. FIGURE
    236. FRANCE ALTERNATIVE SWEETENERS MARKET ANALYSIS BY END USE
    237. FRANCE
      1. ALTERNATIVE SWEETENERS MARKET ANALYSIS BY REGIONAL
    238. RUSSIA ALTERNATIVE
      1. SWEETENERS MARKET ANALYSIS BY TYPE
    239. RUSSIA ALTERNATIVE SWEETENERS
      1. MARKET ANALYSIS BY APPLICATION
    240. RUSSIA ALTERNATIVE SWEETENERS MARKET
      1. ANALYSIS BY FORM
    241. RUSSIA ALTERNATIVE SWEETENERS MARKET ANALYSIS
      1. BY END USE
    242. RUSSIA ALTERNATIVE SWEETENERS MARKET ANALYSIS BY REGIONAL
    243. ITALY ALTERNATIVE SWEETENERS MARKET ANALYSIS BY TYPE
      1. FIGURE
    244. ITALY ALTERNATIVE SWEETENERS MARKET ANALYSIS BY APPLICATION
      1. FIGURE 36.
      2. ITALY ALTERNATIVE SWEETENERS MARKET ANALYSIS BY FORM
    245. ITALY ALTERNATIVE
      1. SWEETENERS MARKET ANALYSIS BY END USE
    246. ITALY ALTERNATIVE SWEETENERS
      1. MARKET ANALYSIS BY REGIONAL
    247. SPAIN ALTERNATIVE SWEETENERS MARKET
      1. ANALYSIS BY TYPE
    248. SPAIN ALTERNATIVE SWEETENERS MARKET ANALYSIS BY
      1. APPLICATION
    249. SPAIN ALTERNATIVE SWEETENERS MARKET ANALYSIS BY FORM
    250. SPAIN ALTERNATIVE SWEETENERS MARKET ANALYSIS BY END USE
      1. FIGURE
    251. SPAIN ALTERNATIVE SWEETENERS MARKET ANALYSIS BY REGIONAL
    252. REST
      1. OF EUROPE ALTERNATIVE SWEETENERS MARKET ANALYSIS BY TYPE
    253. REST OF
      1. EUROPE ALTERNATIVE SWEETENERS MARKET ANALYSIS BY APPLICATION
    254. REST
      1. OF EUROPE ALTERNATIVE SWEETENERS MARKET ANALYSIS BY FORM
    255. REST OF
      1. EUROPE ALTERNATIVE SWEETENERS MARKET ANALYSIS BY END USE
    256. REST OF
      1. EUROPE ALTERNATIVE SWEETENERS MARKET ANALYSIS BY REGIONAL
    257. APAC
    258. ALTERNATIVE SWEETENERS MARKET ANALYSIS
    259. CHINA ALTERNATIVE SWEETENERS
      1. MARKET ANALYSIS BY TYPE
    260. CHINA ALTERNATIVE SWEETENERS MARKET ANALYSIS
      1. BY APPLICATION
    261. CHINA ALTERNATIVE SWEETENERS MARKET ANALYSIS BY
      1. FORM
    262. CHINA ALTERNATIVE SWEETENERS MARKET ANALYSIS BY END USE
    263. CHINA ALTERNATIVE SWEETENERS MARKET ANALYSIS BY REGIONAL
      1. FIGURE
    264. INDIA ALTERNATIVE SWEETENERS MARKET ANALYSIS BY TYPE
    265. INDIA
      1. ALTERNATIVE SWEETENERS MARKET ANALYSIS BY APPLICATION
    266. INDIA ALTERNATIVE
      1. SWEETENERS MARKET ANALYSIS BY FORM
    267. INDIA ALTERNATIVE SWEETENERS
      1. MARKET ANALYSIS BY END USE
    268. INDIA ALTERNATIVE SWEETENERS MARKET
      1. ANALYSIS BY REGIONAL
    269. JAPAN ALTERNATIVE SWEETENERS MARKET ANALYSIS
      1. BY TYPE
    270. JAPAN ALTERNATIVE SWEETENERS MARKET ANALYSIS BY APPLICATION
    271. JAPAN ALTERNATIVE SWEETENERS MARKET ANALYSIS BY FORM
      1. FIGURE
    272. JAPAN ALTERNATIVE SWEETENERS MARKET ANALYSIS BY END USE
    273. JAPAN
      1. ALTERNATIVE SWEETENERS MARKET ANALYSIS BY REGIONAL
    274. SOUTH KOREA
      1. ALTERNATIVE SWEETENERS MARKET ANALYSIS BY TYPE
    275. SOUTH KOREA ALTERNATIVE
      1. SWEETENERS MARKET ANALYSIS BY APPLICATION
    276. SOUTH KOREA ALTERNATIVE
      1. SWEETENERS MARKET ANALYSIS BY FORM
    277. SOUTH KOREA ALTERNATIVE SWEETENERS
      1. MARKET ANALYSIS BY END USE
    278. SOUTH KOREA ALTERNATIVE SWEETENERS MARKET
      1. ANALYSIS BY REGIONAL
    279. MALAYSIA ALTERNATIVE SWEETENERS MARKET ANALYSIS
      1. BY TYPE
    280. MALAYSIA ALTERNATIVE SWEETENERS MARKET ANALYSIS BY APPLICATION
    281. MALAYSIA ALTERNATIVE SWEETENERS MARKET ANALYSIS BY FORM
      1. FIGURE
    282. MALAYSIA ALTERNATIVE SWEETENERS MARKET ANALYSIS BY END USE
      1. FIGURE 74.
      2. MALAYSIA ALTERNATIVE SWEETENERS MARKET ANALYSIS BY REGIONAL
    283. THAILAND
      1. ALTERNATIVE SWEETENERS MARKET ANALYSIS BY TYPE
    284. THAILAND ALTERNATIVE
      1. SWEETENERS MARKET ANALYSIS BY APPLICATION
    285. THAILAND ALTERNATIVE
      1. SWEETENERS MARKET ANALYSIS BY FORM
    286. THAILAND ALTERNATIVE SWEETENERS
      1. MARKET ANALYSIS BY END USE
    287. THAILAND ALTERNATIVE SWEETENERS MARKET
      1. ANALYSIS BY REGIONAL
    288. INDONESIA ALTERNATIVE SWEETENERS MARKET ANALYSIS
      1. BY TYPE
    289. INDONESIA ALTERNATIVE SWEETENERS MARKET ANALYSIS BY APPLICATION
    290. INDONESIA ALTERNATIVE SWEETENERS MARKET ANALYSIS BY FORM
      1. FIGURE
    291. INDONESIA ALTERNATIVE SWEETENERS MARKET ANALYSIS BY END USE
      1. FIGURE 84.
      2. INDONESIA ALTERNATIVE SWEETENERS MARKET ANALYSIS BY REGIONAL
    292. REST
      1. OF APAC ALTERNATIVE SWEETENERS MARKET ANALYSIS BY TYPE
    293. REST OF
      1. APAC ALTERNATIVE SWEETENERS MARKET ANALYSIS BY APPLICATION
    294. REST
      1. OF APAC ALTERNATIVE SWEETENERS MARKET ANALYSIS BY FORM
    295. REST OF
      1. APAC ALTERNATIVE SWEETENERS MARKET ANALYSIS BY END USE
    296. REST OF
      1. APAC ALTERNATIVE SWEETENERS MARKET ANALYSIS BY REGIONAL
    297. SOUTH AMERICA
    298. ALTERNATIVE SWEETENERS MARKET ANALYSIS
    299. BRAZIL ALTERNATIVE SWEETENERS
      1. MARKET ANALYSIS BY TYPE
    300. BRAZIL ALTERNATIVE SWEETENERS MARKET ANALYSIS
      1. BY APPLICATION
    301. BRAZIL ALTERNATIVE SWEETENERS MARKET ANALYSIS BY
      1. FORM
    302. BRAZIL ALTERNATIVE SWEETENERS MARKET ANALYSIS BY END USE
    303. BRAZIL ALTERNATIVE SWEETENERS MARKET ANALYSIS BY REGIONAL
      1. FIGURE
    304. MEXICO ALTERNATIVE SWEETENERS MARKET ANALYSIS BY TYPE
    305. MEXICO
      1. ALTERNATIVE SWEETENERS MARKET ANALYSIS BY APPLICATION
    306. MEXICO ALTERNATIVE
      1. SWEETENERS MARKET ANALYSIS BY FORM
    307. MEXICO ALTERNATIVE SWEETENERS
      1. MARKET ANALYSIS BY END USE
    308. MEXICO ALTERNATIVE SWEETENERS MARKET
      1. ANALYSIS BY REGIONAL
    309. ARGENTINA ALTERNATIVE SWEETENERS MARKET ANALYSIS
      1. BY TYPE
    310. ARGENTINA ALTERNATIVE SWEETENERS MARKET ANALYSIS BY APPLICATION
    311. ARGENTINA ALTERNATIVE SWEETENERS MARKET ANALYSIS BY FORM
      1. FIGURE
    312. ARGENTINA ALTERNATIVE SWEETENERS MARKET ANALYSIS BY END USE
      1. FIGURE 105.
      2. ARGENTINA ALTERNATIVE SWEETENERS MARKET ANALYSIS BY REGIONAL
    313. REST
      1. OF SOUTH AMERICA ALTERNATIVE SWEETENERS MARKET ANALYSIS BY TYPE
      2. FIGURE 107.
      3. REST OF SOUTH AMERICA ALTERNATIVE SWEETENERS MARKET ANALYSIS BY APPLICATION
    314. REST OF SOUTH AMERICA ALTERNATIVE SWEETENERS MARKET ANALYSIS BY FORM
    315. REST OF SOUTH AMERICA ALTERNATIVE SWEETENERS MARKET ANALYSIS BY
      1. END USE
    316. REST OF SOUTH AMERICA ALTERNATIVE SWEETENERS MARKET ANALYSIS
      1. BY REGIONAL
    317. MEA ALTERNATIVE SWEETENERS MARKET ANALYSIS
      1. FIGURE
    318. GCC COUNTRIES ALTERNATIVE SWEETENERS MARKET ANALYSIS BY TYPE
      1. FIGURE 113.
      2. GCC COUNTRIES ALTERNATIVE SWEETENERS MARKET ANALYSIS BY APPLICATION
      3. FIGURE
    319. GCC COUNTRIES ALTERNATIVE SWEETENERS MARKET ANALYSIS BY FORM
      1. FIGURE 115.
      2. GCC COUNTRIES ALTERNATIVE SWEETENERS MARKET ANALYSIS BY END USE
      3. FIGURE 116.
      4. GCC COUNTRIES ALTERNATIVE SWEETENERS MARKET ANALYSIS BY REGIONAL
      5. FIGURE 117.
      6. SOUTH AFRICA ALTERNATIVE SWEETENERS MARKET ANALYSIS BY TYPE
    320. SOUTH
      1. AFRICA ALTERNATIVE SWEETENERS MARKET ANALYSIS BY APPLICATION
    321. SOUTH
      1. AFRICA ALTERNATIVE SWEETENERS MARKET ANALYSIS BY FORM
    322. SOUTH AFRICA
      1. ALTERNATIVE SWEETENERS MARKET ANALYSIS BY END USE
    323. SOUTH AFRICA
      1. ALTERNATIVE SWEETENERS MARKET ANALYSIS BY REGIONAL
    324. REST OF MEA
      1. ALTERNATIVE SWEETENERS MARKET ANALYSIS BY TYPE
    325. REST OF MEA ALTERNATIVE
      1. SWEETENERS MARKET ANALYSIS BY APPLICATION
    326. REST OF MEA ALTERNATIVE
      1. SWEETENERS MARKET ANALYSIS BY FORM
    327. REST OF MEA ALTERNATIVE SWEETENERS
      1. MARKET ANALYSIS BY END USE
    328. REST OF MEA ALTERNATIVE SWEETENERS
      1. MARKET ANALYSIS BY REGIONAL
    329. KEY BUYING CRITERIA OF ALTERNATIVE
    330. SWEETENERS MARKET
    331. RESEARCH PROCESS OF MRFR
    332. DRO
    333. ANALYSIS OF ALTERNATIVE SWEETENERS MARKET
    334. DRIVERS IMPACT ANALYSIS:
    335. ALTERNATIVE SWEETENERS MARKET
    336. RESTRAINTS IMPACT ANALYSIS: ALTERNATIVE
    337. SWEETENERS MARKET
    338. SUPPLY / VALUE CHAIN: ALTERNATIVE SWEETENERS
      1. MARKET
    339. ALTERNATIVE SWEETENERS MARKET, BY TYPE, 2025 (% SHARE)
    340. ALTERNATIVE SWEETENERS MARKET, BY TYPE, 2019 TO 2035 (USD Billions)
    341. ALTERNATIVE SWEETENERS MARKET, BY APPLICATION, 2025 (% SHARE)
    342. ALTERNATIVE SWEETENERS MARKET, BY APPLICATION, 2019 TO 2035 (USD
      1. Billions)
    343. ALTERNATIVE SWEETENERS MARKET, BY FORM, 2025 (% SHARE)
    344. ALTERNATIVE SWEETENERS MARKET, BY FORM, 2019 TO 2035 (USD Billions)
    345. ALTERNATIVE SWEETENERS MARKET, BY END USE, 2025 (% SHARE)
    346. ALTERNATIVE SWEETENERS MARKET, BY END USE, 2019 TO 2035 (USD Billions)
    347. ALTERNATIVE SWEETENERS MARKET, BY REGIONAL, 2025 (% SHARE)
    348. ALTERNATIVE SWEETENERS MARKET, BY REGIONAL, 2019 TO 2035 (USD Billions)
    349. BENCHMARKING OF MAJOR COMPETITORS
      1. \r\n

    Alternative Sweeteners Market Segmentation

    • Alternative Sweeteners Market By Type (USD Billion, 2019-2035)

      • Natural Sweeteners
      • Artificial Sweeteners
      • Sugar Alcohols
      • High-Intensity Sweeteners
      • Traditional Sweeteners


    • Alternative Sweeteners Market By Application (USD Billion, 2019-2035)

      • Food and Beverages
      • Pharmaceuticals
      • Cosmetics
      • Dietary Supplements


    • Alternative Sweeteners Market By Form (USD Billion, 2019-2035)

      • Liquid
      • Powder
      • Granulated
      • Tablet


    • Alternative Sweeteners Market By End Use (USD Billion, 2019-2035)

      • Household
      • Commercial
      • Food Processing
      • Beverage Manufacturing


    • Alternative Sweeteners Market By Regional (USD Billion, 2019-2035)

      • North America
      • Europe
      • South America
      • Asia Pacific
      • Middle East and Africa


    Alternative Sweeteners Market Regional Outlook (USD Billion, 2019-2035)


    • North America Outlook (USD Billion, 2019-2035)

      • North America Alternative Sweeteners Market by Type

        • Natural Sweeteners
        • Artificial Sweeteners
        • Sugar Alcohols
        • High-Intensity Sweeteners
        • Traditional Sweeteners
      • North America Alternative Sweeteners Market by Application Type

        • Food and Beverages
        • Pharmaceuticals
        • Cosmetics
        • Dietary Supplements
      • North America Alternative Sweeteners Market by Form Type

        • Liquid
        • Powder
        • Granulated
        • Tablet
      • North America Alternative Sweeteners Market by End Use Type

        • Household
        • Commercial
        • Food Processing
        • Beverage Manufacturing
      • North America Alternative Sweeteners Market by Regional Type

        • US
        • Canada
      • US Outlook (USD Billion, 2019-2035)
      • US Alternative Sweeteners Market by Type

        • Natural Sweeteners
        • Artificial Sweeteners
        • Sugar Alcohols
        • High-Intensity Sweeteners
        • Traditional Sweeteners
      • US Alternative Sweeteners Market by Application Type

        • Food and Beverages
        • Pharmaceuticals
        • Cosmetics
        • Dietary Supplements
      • US Alternative Sweeteners Market by Form Type

        • Liquid
        • Powder
        • Granulated
        • Tablet
      • US Alternative Sweeteners Market by End Use Type

        • Household
        • Commercial
        • Food Processing
        • Beverage Manufacturing
      • CANADA Outlook (USD Billion, 2019-2035)
      • CANADA Alternative Sweeteners Market by Type

        • Natural Sweeteners
        • Artificial Sweeteners
        • Sugar Alcohols
        • High-Intensity Sweeteners
        • Traditional Sweeteners
      • CANADA Alternative Sweeteners Market by Application Type

        • Food and Beverages
        • Pharmaceuticals
        • Cosmetics
        • Dietary Supplements
      • CANADA Alternative Sweeteners Market by Form Type

        • Liquid
        • Powder
        • Granulated
        • Tablet
      • CANADA Alternative Sweeteners Market by End Use Type

        • Household
        • Commercial
        • Food Processing
        • Beverage Manufacturing
    • Europe Outlook (USD Billion, 2019-2035)

      • Europe Alternative Sweeteners Market by Type

        • Natural Sweeteners
        • Artificial Sweeteners
        • Sugar Alcohols
        • High-Intensity Sweeteners
        • Traditional Sweeteners
      • Europe Alternative Sweeteners Market by Application Type

        • Food and Beverages
        • Pharmaceuticals
        • Cosmetics
        • Dietary Supplements
      • Europe Alternative Sweeteners Market by Form Type

        • Liquid
        • Powder
        • Granulated
        • Tablet
      • Europe Alternative Sweeteners Market by End Use Type

        • Household
        • Commercial
        • Food Processing
        • Beverage Manufacturing
      • Europe Alternative Sweeteners Market by Regional Type

        • Germany
        • UK
        • France
        • Russia
        • Italy
        • Spain
        • Rest of Europe
      • GERMANY Outlook (USD Billion, 2019-2035)
      • GERMANY Alternative Sweeteners Market by Type

        • Natural Sweeteners
        • Artificial Sweeteners
        • Sugar Alcohols
        • High-Intensity Sweeteners
        • Traditional Sweeteners
      • GERMANY Alternative Sweeteners Market by Application Type

        • Food and Beverages
        • Pharmaceuticals
        • Cosmetics
        • Dietary Supplements
      • GERMANY Alternative Sweeteners Market by Form Type

        • Liquid
        • Powder
        • Granulated
        • Tablet
      • GERMANY Alternative Sweeteners Market by End Use Type

        • Household
        • Commercial
        • Food Processing
        • Beverage Manufacturing
      • UK Outlook (USD Billion, 2019-2035)
      • UK Alternative Sweeteners Market by Type

        • Natural Sweeteners
        • Artificial Sweeteners
        • Sugar Alcohols
        • High-Intensity Sweeteners
        • Traditional Sweeteners
      • UK Alternative Sweeteners Market by Application Type

        • Food and Beverages
        • Pharmaceuticals
        • Cosmetics
        • Dietary Supplements
      • UK Alternative Sweeteners Market by Form Type

        • Liquid
        • Powder
        • Granulated
        • Tablet
      • UK Alternative Sweeteners Market by End Use Type

        • Household
        • Commercial
        • Food Processing
        • Beverage Manufacturing
      • FRANCE Outlook (USD Billion, 2019-2035)
      • FRANCE Alternative Sweeteners Market by Type

        • Natural Sweeteners
        • Artificial Sweeteners
        • Sugar Alcohols
        • High-Intensity Sweeteners
        • Traditional Sweeteners
      • FRANCE Alternative Sweeteners Market by Application Type

        • Food and Beverages
        • Pharmaceuticals
        • Cosmetics
        • Dietary Supplements
      • FRANCE Alternative Sweeteners Market by Form Type

        • Liquid
        • Powder
        • Granulated
        • Tablet
      • FRANCE Alternative Sweeteners Market by End Use Type

        • Household
        • Commercial
        • Food Processing
        • Beverage Manufacturing
      • RUSSIA Outlook (USD Billion, 2019-2035)
      • RUSSIA Alternative Sweeteners Market by Type

        • Natural Sweeteners
        • Artificial Sweeteners
        • Sugar Alcohols
        • High-Intensity Sweeteners
        • Traditional Sweeteners
      • RUSSIA Alternative Sweeteners Market by Application Type

        • Food and Beverages
        • Pharmaceuticals
        • Cosmetics
        • Dietary Supplements
      • RUSSIA Alternative Sweeteners Market by Form Type

        • Liquid
        • Powder
        • Granulated
        • Tablet
      • RUSSIA Alternative Sweeteners Market by End Use Type

        • Household
        • Commercial
        • Food Processing
        • Beverage Manufacturing
      • ITALY Outlook (USD Billion, 2019-2035)
      • ITALY Alternative Sweeteners Market by Type

        • Natural Sweeteners
        • Artificial Sweeteners
        • Sugar Alcohols
        • High-Intensity Sweeteners
        • Traditional Sweeteners
      • ITALY Alternative Sweeteners Market by Application Type

        • Food and Beverages
        • Pharmaceuticals
        • Cosmetics
        • Dietary Supplements
      • ITALY Alternative Sweeteners Market by Form Type

        • Liquid
        • Powder
        • Granulated
        • Tablet
      • ITALY Alternative Sweeteners Market by End Use Type

        • Household
        • Commercial
        • Food Processing
        • Beverage Manufacturing
      • SPAIN Outlook (USD Billion, 2019-2035)
      • SPAIN Alternative Sweeteners Market by Type

        • Natural Sweeteners
        • Artificial Sweeteners
        • Sugar Alcohols
        • High-Intensity Sweeteners
        • Traditional Sweeteners
      • SPAIN Alternative Sweeteners Market by Application Type

        • Food and Beverages
        • Pharmaceuticals
        • Cosmetics
        • Dietary Supplements
      • SPAIN Alternative Sweeteners Market by Form Type

        • Liquid
        • Powder
        • Granulated
        • Tablet
      • SPAIN Alternative Sweeteners Market by End Use Type

        • Household
        • Commercial
        • Food Processing
        • Beverage Manufacturing
      • REST OF EUROPE Outlook (USD Billion, 2019-2035)
      • REST OF EUROPE Alternative Sweeteners Market by Type

        • Natural Sweeteners
        • Artificial Sweeteners
        • Sugar Alcohols
        • High-Intensity Sweeteners
        • Traditional Sweeteners
      • REST OF EUROPE Alternative Sweeteners Market by Application Type

        • Food and Beverages
        • Pharmaceuticals
        • Cosmetics
        • Dietary Supplements
      • REST OF EUROPE Alternative Sweeteners Market by Form Type

        • Liquid
        • Powder
        • Granulated
        • Tablet
      • REST OF EUROPE Alternative Sweeteners Market by End Use Type

        • Household
        • Commercial
        • Food Processing
        • Beverage Manufacturing
    • APAC Outlook (USD Billion, 2019-2035)

      • APAC Alternative Sweeteners Market by Type

        • Natural Sweeteners
        • Artificial Sweeteners
        • Sugar Alcohols
        • High-Intensity Sweeteners
        • Traditional Sweeteners
      • APAC Alternative Sweeteners Market by Application Type

        • Food and Beverages
        • Pharmaceuticals
        • Cosmetics
        • Dietary Supplements
      • APAC Alternative Sweeteners Market by Form Type

        • Liquid
        • Powder
        • Granulated
        • Tablet
      • APAC Alternative Sweeteners Market by End Use Type

        • Household
        • Commercial
        • Food Processing
        • Beverage Manufacturing
      • APAC Alternative Sweeteners Market by Regional Type

        • China
        • India
        • Japan
        • South Korea
        • Malaysia
        • Thailand
        • Indonesia
        • Rest of APAC
      • CHINA Outlook (USD Billion, 2019-2035)
      • CHINA Alternative Sweeteners Market by Type

        • Natural Sweeteners
        • Artificial Sweeteners
        • Sugar Alcohols
        • High-Intensity Sweeteners
        • Traditional Sweeteners
      • CHINA Alternative Sweeteners Market by Application Type

        • Food and Beverages
        • Pharmaceuticals
        • Cosmetics
        • Dietary Supplements
      • CHINA Alternative Sweeteners Market by Form Type

        • Liquid
        • Powder
        • Granulated
        • Tablet
      • CHINA Alternative Sweeteners Market by End Use Type

        • Household
        • Commercial
        • Food Processing
        • Beverage Manufacturing
      • INDIA Outlook (USD Billion, 2019-2035)
      • INDIA Alternative Sweeteners Market by Type

        • Natural Sweeteners
        • Artificial Sweeteners
        • Sugar Alcohols
        • High-Intensity Sweeteners
        • Traditional Sweeteners
      • INDIA Alternative Sweeteners Market by Application Type

        • Food and Beverages
        • Pharmaceuticals
        • Cosmetics
        • Dietary Supplements
      • INDIA Alternative Sweeteners Market by Form Type

        • Liquid
        • Powder
        • Granulated
        • Tablet
      • INDIA Alternative Sweeteners Market by End Use Type

        • Household
        • Commercial
        • Food Processing
        • Beverage Manufacturing
      • JAPAN Outlook (USD Billion, 2019-2035)
      • JAPAN Alternative Sweeteners Market by Type

        • Natural Sweeteners
        • Artificial Sweeteners
        • Sugar Alcohols
        • High-Intensity Sweeteners
        • Traditional Sweeteners
      • JAPAN Alternative Sweeteners Market by Application Type

        • Food and Beverages
        • Pharmaceuticals
        • Cosmetics
        • Dietary Supplements
      • JAPAN Alternative Sweeteners Market by Form Type

        • Liquid
        • Powder
        • Granulated
        • Tablet
      • JAPAN Alternative Sweeteners Market by End Use Type

        • Household
        • Commercial
        • Food Processing
        • Beverage Manufacturing
      • SOUTH KOREA Outlook (USD Billion, 2019-2035)
      • SOUTH KOREA Alternative Sweeteners Market by Type

        • Natural Sweeteners
        • Artificial Sweeteners
        • Sugar Alcohols
        • High-Intensity Sweeteners
        • Traditional Sweeteners
      • SOUTH KOREA Alternative Sweeteners Market by Application Type

        • Food and Beverages
        • Pharmaceuticals
        • Cosmetics
        • Dietary Supplements
      • SOUTH KOREA Alternative Sweeteners Market by Form Type

        • Liquid
        • Powder
        • Granulated
        • Tablet
      • SOUTH KOREA Alternative Sweeteners Market by End Use Type

        • Household
        • Commercial
        • Food Processing
        • Beverage Manufacturing
      • MALAYSIA Outlook (USD Billion, 2019-2035)
      • MALAYSIA Alternative Sweeteners Market by Type

        • Natural Sweeteners
        • Artificial Sweeteners
        • Sugar Alcohols
        • High-Intensity Sweeteners
        • Traditional Sweeteners
      • MALAYSIA Alternative Sweeteners Market by Application Type

        • Food and Beverages
        • Pharmaceuticals
        • Cosmetics
        • Dietary Supplements
      • MALAYSIA Alternative Sweeteners Market by Form Type

        • Liquid
        • Powder
        • Granulated
        • Tablet
      • MALAYSIA Alternative Sweeteners Market by End Use Type

        • Household
        • Commercial
        • Food Processing
        • Beverage Manufacturing
      • THAILAND Outlook (USD Billion, 2019-2035)
      • THAILAND Alternative Sweeteners Market by Type

        • Natural Sweeteners
        • Artificial Sweeteners
        • Sugar Alcohols
        • High-Intensity Sweeteners
        • Traditional Sweeteners
      • THAILAND Alternative Sweeteners Market by Application Type

        • Food and Beverages
        • Pharmaceuticals
        • Cosmetics
        • Dietary Supplements
      • THAILAND Alternative Sweeteners Market by Form Type

        • Liquid
        • Powder
        • Granulated
        • Tablet
      • THAILAND Alternative Sweeteners Market by End Use Type

        • Household
        • Commercial
        • Food Processing
        • Beverage Manufacturing
      • INDONESIA Outlook (USD Billion, 2019-2035)
      • INDONESIA Alternative Sweeteners Market by Type

        • Natural Sweeteners
        • Artificial Sweeteners
        • Sugar Alcohols
        • High-Intensity Sweeteners
        • Traditional Sweeteners
      • INDONESIA Alternative Sweeteners Market by Application Type

        • Food and Beverages
        • Pharmaceuticals
        • Cosmetics
        • Dietary Supplements
      • INDONESIA Alternative Sweeteners Market by Form Type

        • Liquid
        • Powder
        • Granulated
        • Tablet
      • INDONESIA Alternative Sweeteners Market by End Use Type

        • Household
        • Commercial
        • Food Processing
        • Beverage Manufacturing
      • REST OF APAC Outlook (USD Billion, 2019-2035)
      • REST OF APAC Alternative Sweeteners Market by Type

        • Natural Sweeteners
        • Artificial Sweeteners
        • Sugar Alcohols
        • High-Intensity Sweeteners
        • Traditional Sweeteners
      • REST OF APAC Alternative Sweeteners Market by Application Type

        • Food and Beverages
        • Pharmaceuticals
        • Cosmetics
        • Dietary Supplements
      • REST OF APAC Alternative Sweeteners Market by Form Type

        • Liquid
        • Powder
        • Granulated
        • Tablet
      • REST OF APAC Alternative Sweeteners Market by End Use Type

        • Household
        • Commercial
        • Food Processing
        • Beverage Manufacturing
    • South America Outlook (USD Billion, 2019-2035)

      • South America Alternative Sweeteners Market by Type

        • Natural Sweeteners
        • Artificial Sweeteners
        • Sugar Alcohols
        • High-Intensity Sweeteners
        • Traditional Sweeteners
      • South America Alternative Sweeteners Market by Application Type

        • Food and Beverages
        • Pharmaceuticals
        • Cosmetics
        • Dietary Supplements
      • South America Alternative Sweeteners Market by Form Type

        • Liquid
        • Powder
        • Granulated
        • Tablet
      • South America Alternative Sweeteners Market by End Use Type

        • Household
        • Commercial
        • Food Processing
        • Beverage Manufacturing
      • South America Alternative Sweeteners Market by Regional Type

        • Brazil
        • Mexico
        • Argentina
        • Rest of South America
      • BRAZIL Outlook (USD Billion, 2019-2035)
      • BRAZIL Alternative Sweeteners Market by Type

        • Natural Sweeteners
        • Artificial Sweeteners
        • Sugar Alcohols
        • High-Intensity Sweeteners
        • Traditional Sweeteners
      • BRAZIL Alternative Sweeteners Market by Application Type

        • Food and Beverages
        • Pharmaceuticals
        • Cosmetics
        • Dietary Supplements
      • BRAZIL Alternative Sweeteners Market by Form Type

        • Liquid
        • Powder
        • Granulated
        • Tablet
      • BRAZIL Alternative Sweeteners Market by End Use Type

        • Household
        • Commercial
        • Food Processing
        • Beverage Manufacturing
      • MEXICO Outlook (USD Billion, 2019-2035)
      • MEXICO Alternative Sweeteners Market by Type

        • Natural Sweeteners
        • Artificial Sweeteners
        • Sugar Alcohols
        • High-Intensity Sweeteners
        • Traditional Sweeteners
      • MEXICO Alternative Sweeteners Market by Application Type

        • Food and Beverages
        • Pharmaceuticals
        • Cosmetics
        • Dietary Supplements
      • MEXICO Alternative Sweeteners Market by Form Type

        • Liquid
        • Powder
        • Granulated
        • Tablet
      • MEXICO Alternative Sweeteners Market by End Use Type

        • Household
        • Commercial
        • Food Processing
        • Beverage Manufacturing
      • ARGENTINA Outlook (USD Billion, 2019-2035)
      • ARGENTINA Alternative Sweeteners Market by Type

        • Natural Sweeteners
        • Artificial Sweeteners
        • Sugar Alcohols
        • High-Intensity Sweeteners
        • Traditional Sweeteners
      • ARGENTINA Alternative Sweeteners Market by Application Type

        • Food and Beverages
        • Pharmaceuticals
        • Cosmetics
        • Dietary Supplements
      • ARGENTINA Alternative Sweeteners Market by Form Type

        • Liquid
        • Powder
        • Granulated
        • Tablet
      • ARGENTINA Alternative Sweeteners Market by End Use Type

        • Household
        • Commercial
        • Food Processing
        • Beverage Manufacturing
      • REST OF SOUTH AMERICA Outlook (USD Billion, 2019-2035)
      • REST OF SOUTH AMERICA Alternative Sweeteners Market by Type

        • Natural Sweeteners
        • Artificial Sweeteners
        • Sugar Alcohols
        • High-Intensity Sweeteners
        • Traditional Sweeteners
      • REST OF SOUTH AMERICA Alternative Sweeteners Market by Application Type

        • Food and Beverages
        • Pharmaceuticals
        • Cosmetics
        • Dietary Supplements
      • REST OF SOUTH AMERICA Alternative Sweeteners Market by Form Type

        • Liquid
        • Powder
        • Granulated
        • Tablet
      • REST OF SOUTH AMERICA Alternative Sweeteners Market by End Use Type

        • Household
        • Commercial
        • Food Processing
        • Beverage Manufacturing
    • MEA Outlook (USD Billion, 2019-2035)

      • MEA Alternative Sweeteners Market by Type

        • Natural Sweeteners
        • Artificial Sweeteners
        • Sugar Alcohols
        • High-Intensity Sweeteners
        • Traditional Sweeteners
      • MEA Alternative Sweeteners Market by Application Type

        • Food and Beverages
        • Pharmaceuticals
        • Cosmetics
        • Dietary Supplements
      • MEA Alternative Sweeteners Market by Form Type

        • Liquid
        • Powder
        • Granulated
        • Tablet
      • MEA Alternative Sweeteners Market by End Use Type

        • Household
        • Commercial
        • Food Processing
        • Beverage Manufacturing
      • MEA Alternative Sweeteners Market by Regional Type

        • GCC Countries
        • South Africa
        • Rest of MEA
      • GCC COUNTRIES Outlook (USD Billion, 2019-2035)
      • GCC COUNTRIES Alternative Sweeteners Market by Type

        • Natural Sweeteners
        • Artificial Sweeteners
        • Sugar Alcohols
        • High-Intensity Sweeteners
        • Traditional Sweeteners
      • GCC COUNTRIES Alternative Sweeteners Market by Application Type

        • Food and Beverages
        • Pharmaceuticals
        • Cosmetics
        • Dietary Supplements
      • GCC COUNTRIES Alternative Sweeteners Market by Form Type

        • Liquid
        • Powder
        • Granulated
        • Tablet
      • GCC COUNTRIES Alternative Sweeteners Market by End Use Type

        • Household
        • Commercial
        • Food Processing
        • Beverage Manufacturing
      • SOUTH AFRICA Outlook (USD Billion, 2019-2035)
      • SOUTH AFRICA Alternative Sweeteners Market by Type

        • Natural Sweeteners
        • Artificial Sweeteners
        • Sugar Alcohols
        • High-Intensity Sweeteners
        • Traditional Sweeteners
      • SOUTH AFRICA Alternative Sweeteners Market by Application Type

        • Food and Beverages
        • Pharmaceuticals
        • Cosmetics
        • Dietary Supplements
      • SOUTH AFRICA Alternative Sweeteners Market by Form Type

        • Liquid
        • Powder
        • Granulated
        • Tablet
      • SOUTH AFRICA Alternative Sweeteners Market by End Use Type

        • Household
        • Commercial
        • Food Processing
        • Beverage Manufacturing
      • REST OF MEA Outlook (USD Billion, 2019-2035)
      • REST OF MEA Alternative Sweeteners Market by Type

        • Natural Sweeteners
        • Artificial Sweeteners
        • Sugar Alcohols
        • High-Intensity Sweeteners
        • Traditional Sweeteners
      • REST OF MEA Alternative Sweeteners Market by Application Type

        • Food and Beverages
        • Pharmaceuticals
        • Cosmetics
        • Dietary Supplements
      • REST OF MEA Alternative Sweeteners Market by Form Type

        • Liquid
        • Powder
        • Granulated
        • Tablet
      • REST OF MEA Alternative Sweeteners Market by End Use Type

        • Household
        • Commercial
        • Food Processing
        • Beverage Manufacturing


    Infographic

    Free Sample Request

    Kindly complete the form below to receive a free sample of this Report

    Get Free Sample

    Customer Strories

    “I am very pleased with how market segments have been defined in a relevant way for my purposes (such as "Portable Freezers & refrigerators" and "last-mile"). In general the report is well structured. Thanks very much for your efforts.”

    Victoria Milne

    Founder
    Case Study
    Chemicals and Materials

    Compare Licence

    ×
    Features License Type
    Single User Multiuser License Enterprise User
    Price $4,950 $5,950 $7,250
    Maximum User Access Limit 1 User Upto 10 Users Unrestricted Access Throughout the Organization
    Free Customization
    Direct Access to Analyst
    Deliverable Format
    Platform Access
    Discount on Next Purchase 10% 15% 15%
    Printable Versions