• Cat-intel
  • MedIntelliX
  • Resources
  • About Us
  • Request Free Sample ×

    Kindly complete the form below to receive a free sample of this Report

    Leading companies partner with us for data-driven Insights

    clients tt-cursor

    Active Passive Electronic Components Market

    ID: MRFR/SEM/41046-HCR
    200 Pages
    Garvit Vyas
    September 2025

    Active and Passive Electronic Components Market Research Report By Component Type (Active Components, Passive Components), By Application (Consumer Electronics, Telecommunications, Automotive, Industrial, Healthcare), By Technology (Semiconductors, Capacitors, Resistors, Inductors, Diodes), By End Use (Residential, Commercial, Industrial) and By Regional (North America, Europe, South America, Asia Pacific, Middle East and Africa) - Industry Size, Share and Forecast to 2035

    Share:
    Download PDF ×

    We do not share your information with anyone. However, we may send you emails based on your report interest from time to time. You may contact us at any time to opt-out.

    Active And Passive Electronic Components Market Research Report - Forecast Till 2032 Infographic
    Purchase Options
    $ 4,950.0
    $ 5,950.0
    $ 7,250.0
    Table of Contents

    Active Passive Electronic Components Market Summary

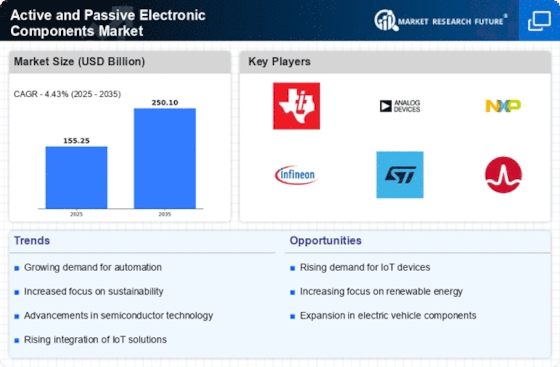
    The Global Active and Passive Electronic Components Market is projected to grow from 155.2 USD Billion in 2024 to 250 USD Billion by 2035.

    Key Market Trends & Highlights

    Active and Passive Electronic Components Key Trends and Highlights

    • The market is expected to experience a compound annual growth rate (CAGR) of 4.43% from 2025 to 2035.
    • By 2035, the market valuation is anticipated to reach 250 USD Billion, indicating robust growth potential.
    • In 2024, the market is valued at 155.2 USD Billion, reflecting a strong foundation for future expansion.
    • Growing adoption of advanced electronic devices due to increasing consumer demand is a major market driver.

    Market Size & Forecast

    2024 Market Size 155.2 (USD Billion)
    2035 Market Size 250 (USD Billion)
    CAGR (2025-2035) 4.43%

    Major Players

    Murata Manufacturing, Samsung Electronics, AVX Corporation, Yageo Corporation, KEMET, NXP Semiconductors, Analog Devices, Broadcom, Infineon Technologies, ON Semiconductor, Taiwan Semiconductor Manufacturing Company, TDK Corporation, Texas Instruments, Intel Corporation, Vishay Intertechnology

    Active Passive Electronic Components Market Trends

    The Active and Passive Electronic Components Market has been influenced by several significant drivers. The rapid growth of the consumer electronics sector, particularly smartphones and wearables, has increased the demand for electronic components. Additionally, the rise of the Internet of Things (IoT) has fueled the need for more sophisticated electronic solutions, creating opportunities for innovation and development. Moreover, advancements in technology have led to improved manufacturing processes, enabling companies to produce components more efficiently and cost-effectively. The shift towards sustainable and energy-efficient products is also reshaping the landscape, encouraging manufacturers to focus on low-power components that meet stringent environmental standards.

    In recent times, the market various opportunities to be explored. The increasing adoption of automation in industries, along with smart grid technology, presents a chance for electronic component manufacturers to expand their offerings. Emerging markets are showing significant growth potential, driven by rising disposable incomes, urbanization, and technological advancements. Furthermore, the trend toward miniaturization allows for new designs and applications, especially in sectors like healthcare, automotive, and telecommunications, enhancing the overall market attractiveness. Continuously changing consumer preferences are prompting manufacturers to innovate and diversify their product lines.

    The trend towards wireless technologies is propelling the demand for high-frequency components. The ongoing development of 5G infrastructure is also expected to impact the market positively, necessitating advanced electronic components that can support high-speed communications. As industries increasingly seek to integrate artificial intelligence and machine learning into their processes, the need for advanced electronic components that cater to these technologies is on the rise. This dynamic environment will encourage companies to adapt quickly and capture emerging opportunities in the evolving landscape of electronic components.

    The ongoing evolution of technology continues to drive demand for both active and passive electronic components, reflecting a broader trend towards increased miniaturization and enhanced functionality across various industries.

    U.S. Department of Commerce

    Active Passive Electronic Components Market Drivers

    Market Growth Projections

    The Global Active and Passive Electronic Components Market Industry is poised for substantial growth, with projections indicating a market size of 155.2 USD Billion in 2024 and an anticipated increase to 250 USD Billion by 2035. This growth trajectory reflects a compound annual growth rate (CAGR) of 4.43% from 2025 to 2035, underscoring the industry's resilience and adaptability in a rapidly evolving technological landscape. As various sectors continue to integrate advanced electronic solutions, the market is likely to witness sustained demand, driven by innovations and the increasing complexity of electronic systems.

    Increasing Adoption of IoT Devices

    The rise of the Internet of Things (IoT) significantly impacts the Global Active and Passive Electronic Components Market Industry. As more devices become interconnected, the demand for electronic components that facilitate communication and data processing is on the rise. IoT applications span various sectors, including smart cities, healthcare, and industrial automation, necessitating a diverse range of active and passive components. This trend not only enhances operational efficiencies but also drives market growth, as the need for reliable and efficient electronic solutions becomes paramount in an increasingly connected world.

    Growth of Renewable Energy Solutions

    The Global Active and Passive Electronic Components Market Industry is also propelled by the expansion of renewable energy technologies. Solar panels, wind turbines, and energy storage systems require a variety of electronic components to optimize performance and efficiency. As governments and organizations worldwide prioritize sustainability, the demand for these components is likely to increase. This shift towards renewable energy not only supports environmental goals but also stimulates economic growth within the electronic components sector. The integration of advanced electronics in energy solutions could further enhance market dynamics, aligning with the projected growth figures.

    Advancements in Automotive Electronics

    The automotive sector significantly influences the Global Active and Passive Electronic Components Market Industry, particularly with the rise of electric and autonomous vehicles. These vehicles rely heavily on advanced electronic components for functionalities such as battery management systems, infotainment, and safety features. As automotive manufacturers increasingly adopt electronic solutions, the demand for both active and passive components is expected to grow. This trend is indicative of a broader shift towards smart transportation solutions, which could drive the market's growth trajectory, contributing to the anticipated CAGR of 4.43% from 2025 to 2035.

    Rising Demand for Consumer Electronics

    The Global Active and Passive Electronic Components Market Industry experiences a surge in demand driven by the proliferation of consumer electronics. Devices such as smartphones, tablets, and smart home appliances require a multitude of electronic components, both active and passive, to function effectively. In 2024, the market is projected to reach 155.2 USD Billion, reflecting the increasing integration of technology into daily life. As consumer preferences evolve towards more sophisticated gadgets, manufacturers are compelled to innovate, thereby expanding the market further. This trend is expected to continue, with the market potentially reaching 250 USD Billion by 2035.

    Technological Innovations in Electronics

    Technological advancements play a crucial role in shaping the Global Active and Passive Electronic Components Market Industry. Innovations such as miniaturization, improved energy efficiency, and enhanced performance characteristics of electronic components are driving manufacturers to adopt new technologies. This evolution allows for the development of more compact and efficient devices, catering to the needs of various industries, including telecommunications and healthcare. As these innovations continue to emerge, they are likely to create new opportunities within the market, fostering a competitive landscape that encourages further investment and growth.

    Market Segment Insights

    Active and Passive Electronic Components Market Component Type Insights

    The Active and Passive Electronic Components Market showcases a diverse landscape segmented into Active Components and Passive Components, both of which play crucial roles in the electronics industry. Active Components, valued at 78.0 USD Billion in 2024 and expected to rise to 130.0 USD Billion by 2035, dominate the market, highlighting a significant demand for devices capable of controlling electric currents, such as transistors, diodes, and integrated circuits. Their importance can be attributed to their essential function in amplifying signals and processing data, which are vital in the ever-evolving technologies of communication, computing, and consumer electronics.

    The Active Components segment is not only a majority holding in terms of revenue but also drives advancements in smart technologies and the Internet of Things, catering to the growing need for efficient electronic devices.

    In contrast, Passive Components, recorded at 77.25 USD Billion in 2024 and projected to reach 120.0 USD Billion by 2035, are equally significant in the market landscape. These components, which include resistors, capacitors, and inductors, support the functioning of Active Components by enabling energy storage, filtering and voltage regulation. The rationale behind the consistent growth in this segment lies in the increasing integration of passive components in various applications, including automotive, telecommunications and industrial sectors. Together, the Active and Passive Electronic Components Market data suggests a balanced yet dynamic relationship between these segments, driven by innovations and technological advances.

    The ongoing demand for miniaturization and higher performance in electronic devices creates substantial opportunities for both segments, fostering competitive market growth.

    Moreover, as industries lean more towards automation and smart solutions, the integration of both Active and Passive Components will be critical, ensuring that the overall Active and Passive Electronic Components Market industry progresses steadily towards its projected valuation of 250.0 USD Billion by 2035. The market statistics reveal that both components are essential for the advancement of modern electronic systems, highlighting their respective roles in achieving optimized performance across various applications.

    The growing trend towards sustainability and energy efficiency further enhances the relevance of both segments, as manufacturers focus on developing eco-friendly and efficient components that reduce waste and energy consumption, positioning them favorably for future growth opportunities in this thriving market.

    Active And Passive Electronic Components Market Type Insights

    Source: Primary Research, Secondary Research, MRFR Database and Analyst Review

    Active and Passive Electronic Components Market Application Insights

    The Active and Passive Electronic Components Market is projected to see steady growth Applications across various sectors like Consumer Electronics, Telecommunications, Automotive, Industrial and Healthcare drive this expansion. The Consumer Electronics segment remains a major contributor due to the widespread demand for smart devices. Telecommunications demand continues to increase, propelled by advanced communication technologies and 5G rollouts. The Automotive sector is elevating its significance as electric vehicles and advanced driver-assistance systems (ADAS) become more prevalent, driving the need for sophisticated components.

    In the Industrial sector, automation and smart factory innovations are key growth factors, fostering demand for reliable electronic components. The Healthcare segment is becoming increasingly prominent, driven by technological advancements in medical devices and telehealth. These segments collectively represent significant opportunities and challenges for players in the market, leading to a comprehensive landscape of the Active and Passive Electronic Components Market industry. As trends evolve, market participants must adapt to maintain competitiveness in this dynamic environment, as reflected in the  Active and Passive Electronic Components Market revenue and statistics.

    Active and Passive Electronic Components Market Technology Insights

    The Active and Passive Electronic Components Market is projected to reach Within this expanding market, semiconductors play a crucial role, being integral to various electronic devices and systems, underlining their dominance due to the demand for enhanced performance and miniaturization. Capacitors and resistors together are essential for energy management and signal processing, catering to the rising applications in consumer electronics and automotive sectors.

    Inductors contribute significantly to power supply and are vital in maintaining signal integrity in communication devices. Diodes, on the other hand, serve fundamental functions in controlling the direction of current flow. The overall market dynamics reflect a robust demand driven by technological advancements and increased consumption across various industries, while the interplay between active and passive components highlights opportunities for innovative product developments and cost-effective manufacturing techniques.

    Active and Passive Electronic Components Market End Use Insights

    The Active and Passive Electronic Components Market encompasses a diverse range of applications across different End Use sectors, including Residential, Commercial and Industrial. The Residential segment holds significant importance as the demand for smart home devices and consumer electronics continues to rise, driving the need for innovative electronic solutions. Similarly, the Commercial segment plays a crucial role, with a strong emphasis on automation and efficient energy management systems in office spaces and retail settings.

    Moreover, the Industrial sector significantly dominates the use of electronic components, particularly in manufacturing automation, robotics, and communication systems. The synergy between these sectors contributes to the overall market growth, as advancements in technology and increasing investments boost the demand for high-quality components. As the Active and Passive Electronic Components Market data suggests, the trends and growth drivers within these segments show promising opportunities for companies looking to innovate and cater to the expanding needs of end-users across various applications.

    In this competitive landscape, challenges such as supply chain disruptions and the need for sustainable practices remain crucial considerations for market participants.

    Regional Insights

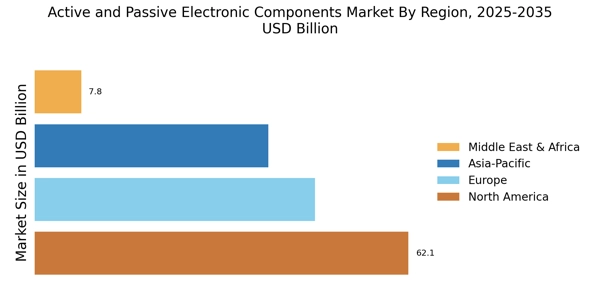
    The Active and Passive Electronic Components Market is experiencing notable growth across various regions, contributing to a comprehensive revenue landscape. In 2024, North America holds a significant market share valued at 45.0 USD Billion, reflecting its dominance in technology innovation and industrial applications. Europe follows closely with a valuation of 35.0 USD Billion, driven by increasing demand for smart devices. Meanwhile, the APAC region emerges as a major contributor, valued at 60.0 USD Billion in 2024, benefitting from rapid industrialization and rising electronics consumption.

    South America and MEA, with valuations of 8.0 USD Billion and 7.25 USD Billion respectively, depict smaller but growing markets, indicating potential opportunities amidst challenges. The APAC region not only maintains a majority holding but is also projected for significant growth due to its robust manufacturing capabilities. Collectively, the dynamics across these regions reflect various growth drivers such as technological advancements, increasing consumer electronics demand, and strategic developments in the Active and Passive Electronic Components Market industry, while also facing obstacles such as supply chain disruptions and fluctuating raw material costs.

    Active And Passive Electronic Components Market Regional Insights

    Source: Primary Research, Secondary Research, MRFR Database and Analyst Review

    Key Players and Competitive Insights

    The Active and Passive Electronic Components Market is characterized by a diverse range of players who are continuously striving to enhance their product offerings and technological advancements. As markets evolve, competition intensifies, leading to a dynamic environment where companies must adapt to emerging trends and consumer demands. The competitive landscape is shaped by various factors, including innovation, research and development capabilities, pricing strategies, and the ability to forge strategic partnerships. This industry encompasses a variety of components, such as capacitors, resistors, inductors, and semiconductors, which are fundamental in the functioning of electronic devices across multiple sectors.

    Understanding the strengths and strategies of key players in this market is crucial for identifying opportunities and potential challenges.

    Murata Manufacturing holds a prominent position in the Active and Passive Electronic Components Market, celebrated for its innovation and extensive product portfolio. The company boasts a strong reputation for producing high-quality capacitors, filters, and inductors, making it a preferred choice for various industries including automotive, telecommunications and consumer electronics. Murata's commitment to research and development has enabled it to stay at the forefront of technological advancements, ensuring that its products meet the latest standards in performance and efficiency.

    The company’s extensive manufacturing capabilities, combined with a global distribution network, allow it to serve a wide range of customers while maintaining a flexible and responsive supply chain. Furthermore, Murata's strategic focus on sustainability and eco-friendly practices enhances its market appeal, catering to the increasing demand for environmentally conscious solutions.

    Samsung Electronics is another significant player in the Active and Passive Electronic Components Market, recognized for its extensive range of semiconductors and embedded components that power a multitude of devices. The company has leveraged its advanced technological capabilities to develop high-performance components that cater to various applications, including mobile devices, home appliances, and industrial equipment. Samsung Electronics is particularly known for its leadership in memory chips, which are essential for modern computing and mobile technology. The company focuses on continuous innovation, investing heavily in research and development to stay ahead in the competitive landscape.

    Its strong brand presence and robust supply chain management further solidify its position in the market, as Samsung Electronics provides reliable and cutting-edge solutions tailored to the ever-evolving needs of manufacturers and consumers alike.

    Key Companies in the Active Passive Electronic Components Market market include

    Industry Developments

    Recent developments in the Active and Passive Electronic Components Market are showing significant activity. Murata Manufacturing and Samsung Electronics have increased their production capacities to meet the rising demand for electronic components, particularly in automotive and consumer electronics sectors. Meanwhile, AVX Corporation and Yageo Corporation have been involved in advancements related to capacitors and resistors, driving innovation in this space. KEMET is focusing on expanding its product lines to incorporate more sustainable materials as environmental considerations become increasingly crucial. NXP Semiconductors and Analog Devices are collaborating on advanced semiconductor solutions aimed at the Internet of Things (IoT) markets.

    Additionally, Broadcom and Infineon Technologies are actively pursuing technological integrations to enhance their product offerings. In terms of mergers and acquisitions, ON Semiconductor's acquisition of certain assets from a competitor has been highlighted, which is expected to bolster its market position. The market valuation for active and passive components continues to grow, with projections showing that increased investments in technology and rising consumer electronics demand are significantly impacting valuations across companies like Taiwan Semiconductor Manufacturing Company, TDK Corporation, Texas Instruments, and Vishay Intertechnology, creating a dynamic and competitive landscape.

    Future Outlook

    Active Passive Electronic Components Market Future Outlook

    The Global Active and Passive Electronic Components Market is projected to grow at a 4.43% CAGR from 2024 to 2035, driven by technological advancements and increasing demand for consumer electronics.

    New opportunities lie in:

    • Invest in R&D for next-gen semiconductor materials to enhance performance.
    • Expand product lines to include eco-friendly electronic components.
    • Leverage AI for predictive maintenance in manufacturing processes.

    By 2035, the market is expected to achieve robust growth, reflecting evolving technological landscapes and consumer demands.

    Market Segmentation

    Active and Passive Electronic Components Market End Use Outlook

    • North America
    • Europe
    • South America
    • Asia Pacific
    • Middle East and Africa

    Active and Passive Electronic Components Market Regional Outlook

    • North America
    • Europe
    • South America
    • Asia Pacific
    • Middle East and Africa

    Active and Passive Electronic Components Market Technology Outlook

    • Residential
    • Commercial
    • Industrial

    Active and Passive Electronic Components Market Application Outlook

    • Semiconductors
    • Capacitors
    • Resistors
    • Inductors
    • Diodes

    Active and Passive Electronic Components Market Component Type Outlook

    • Consumer Electronics
    • Telecommunications
    • Automotive
    • Industrial
    • Healthcare

    Report Scope

    Attribute/Metric Source: Details
    MARKET SIZE 2023 148.67 (USD Billion)
    MARKET SIZE 2024 155.25 (USD Billion)
    MARKET SIZE 2035 250.0 (USD Billion)
    COMPOUND ANNUAL GROWTH RATE (CAGR) 4.43% (2025 - 2035)
    REPORT COVERAGE Revenue Forecast, Competitive Landscape, Growth Factors, and Trends
    BASE YEAR 2024
    MARKET FORECAST PERIOD 2025 - 2035
    HISTORICAL DATA 2019 - 2024
    MARKET FORECAST UNITS USD Billion
    KEY COMPANIES PROFILED Murata Manufacturing, Samsung Electronics, AVX Corporation, Yageo Corporation, KEMET, NXP Semiconductors, Analog Devices, Broadcom, Infineon Technologies, ON Semiconductor, Taiwan Semiconductor Manufacturing Company, Tdk Corporation, Texas Instruments, Intel Corporation, Vishay Intertechnology
    SEGMENTS COVERED Component Type, Application, Technology, End Use, Regional
    KEY MARKET OPPORTUNITIES Growing demand for consumer electronics, Expansion of renewable energy systems, Rise of electric vehicles market, Increased automation in industries, Advancements in IoT applications
    KEY MARKET DYNAMICS Growing demand for consumer electronics, Rapid technological advancements, Increasing automation across industries, Surge in electric vehicle production, Sustainable development initiatives by manufacturers
    COUNTRIES COVERED North America, Europe, APAC, South America, MEA

    Market Highlights

    Author
    Garvit Vyas
    Analyst

    Explore the profile of Garvit Vyas, one of our esteemed authors at Market Research Future, and access their expert research contributions in the field of market research and industry analysis

    Leave a Comment

    FAQs

    What is the expected market size of the Global Active and Passive Electronic Components Market in 2024?

    The expected market size of the Global Active and Passive Electronic Components Market in 2024 is valued at 155.25 USD Billion.

    What is the forecasted compound annual growth rate (CAGR) for the Global Active and Passive Electronic Components Market from 2025 to 2035?

    The forecasted CAGR for the Global Active and Passive Electronic Components Market from 2025 to 2035 is 4.43%.

    Which region has the largest market share in the Global Active and Passive Electronic Components Market in 2024?

    The APAC region has the largest market share in the Global Active and Passive Electronic Components Market in 2024, valued at 60.0 USD Billion.

    How will the market size of the Passive Components segment change from 2024 to 2035?

    The market size of the Passive Components segment is expected to grow from 77.25 USD Billion in 2024 to 120.0 USD Billion in 2035.

    What is the anticipated market value for North America in the Global Active and Passive Electronic Components Market by 2035?

    The anticipated market value for North America in the Global Active and Passive Electronic Components Market by 2035 is 73.5 USD Billion.

    Who are the key players in the Global Active and Passive Electronic Components Market?

    Key players in the Global Active and Passive Electronic Components Market include companies such as Murata Manufacturing, Samsung Electronics, and Texas Instruments.

    What is the expected market size for the Active Components segment in 2035?

    The expected market size for the Active Components segment is projected to reach 130.0 USD Billion in 2035.

    How does the market growth rate of Europe compare to that of APAC in 2035?

    By 2035, Europe's market value is expected to be 57.5 USD Billion compared to APAC's expected market value of 100.0 USD Billion, indicating greater growth in APAC.

    What opportunities are present in the Global Active and Passive Electronic Components Market?

    Opportunities in the Active and Passive Electronic Components Market include increasing demand in consumer electronics and automotive sectors.

    What challenges are facing the Global Active and Passive Electronic Components Market?

    Challenges facing the Active and Passive Electronic Components Market include supply chain disruptions and fluctuating raw material prices.

    1. EXECUTIVE SUMMARY
    2. Market Overview
      1. Key Findings
      2. Market Segmentation
    3. Competitive Landscape
      1. Challenges and Opportunities
      2. Future Outlook
    4. MARKET INTRODUCTION
      1. Definition
      2. Scope of the study
        1. Research Objective
        2. Assumption
        3. Limitations
    5. RESEARCH METHODOLOGY
      1. Overview
      2. Data Mining
    6. Secondary Research
      1. Primary Research
        1. Primary Interviews and
    7. Information Gathering Process
      1. Breakdown of Primary Respondents
      2. Forecasting Model
      3. Market Size Estimation
        1. Bottom-Up
    8. Approach
      1. Top-Down Approach
      2. Data Triangulation
    9. Validation
    10. MARKET DYNAMICS
      1. Overview
      2. Drivers
    11. Restraints
      1. Opportunities
    12. MARKET FACTOR ANALYSIS
      1. Value
    13. chain Analysis
      1. Porter's Five Forces Analysis
        1. Bargaining
    14. Power of Suppliers
      1. Bargaining Power of Buyers
        1. Threat of
    15. New Entrants
      1. Threat of Substitutes
        1. Intensity of Rivalry
      2. COVID-19 Impact Analysis
        1. Market Impact Analysis
    16. Regional Impact
      1. Opportunity and Threat Analysis
    17. Active and
    18. Passive Electronic Components Market, BY Component Type (USD Billion)
    19. Active Components
      1. Passive Components
    20. Active and Passive Electronic
    21. Components Market, BY Application (USD Billion)
      1. Consumer Electronics
      2. Telecommunications
      3. Automotive
      4. Industrial
    22. Healthcare
    23. Active and Passive Electronic Components Market, BY Technology
    24. (USD Billion)
      1. Semiconductors
      2. Capacitors
      3. Resistors
      4. Inductors
      5. Diodes
    25. Active and Passive Electronic Components
    26. Market, BY End Use (USD Billion)
      1. Residential
      2. Commercial
      3. Industrial
    27. Active and Passive Electronic Components Market, BY
    28. Regional (USD Billion)
      1. North America
        1. US
    29. Canada
      1. Europe
        1. Germany
        2. UK
        3. France
        4. Russia
        5. Italy
        6. Spain
        7. Rest
    30. of Europe
      1. APAC
        1. China
        2. India
    31. Japan
      1. South Korea
        1. Malaysia
        2. Thailand
        3. Indonesia
        4. Rest of APAC
      2. South America
    32. Brazil
      1. Mexico
        1. Argentina
        2. Rest of South
    33. America
      1. MEA
        1. GCC Countries
        2. South Africa
        3. Rest of MEA
    34. Competitive Landscape
      1. Overview
    35. Competitive Analysis
      1. Market share Analysis
      2. Major Growth
    36. Strategy in the Active and Passive Electronic Components Market
      1. Competitive
    37. Benchmarking
      1. Leading Players in Terms of Number of Developments in the
    38. Active and Passive Electronic Components Market
      1. Key developments and
    39. growth strategies
      1. New Product Launch/Service Deployment
    40. Merger & Acquisitions
      1. Joint Ventures
      2. Major Players
    41. Financial Matrix
      1. Sales and Operating Income
        1. Major Players
    42. R&D Expenditure. 2023
    43. Company Profiles
      1. Murata Manufacturing
        1. Financial Overview
        2. Products Offered
        3. Key
    44. Developments
      1. SWOT Analysis
        1. Key Strategies
    45. Samsung Electronics
      1. Financial Overview
        1. Products Offered
        2. Key Developments
        3. SWOT Analysis
        4. Key Strategies
      2. AVX Corporation
        1. Financial Overview
        2. Products
    46. Offered
      1. Key Developments
        1. SWOT Analysis
    47. Key Strategies
      1. Yageo Corporation
        1. Financial Overview
        2. Products Offered
        3. Key Developments
        4. SWOT Analysis
        5. Key Strategies
      2. KEMET
        1. Financial Overview
        2. Products Offered
        3. Key Developments
        4. SWOT
    48. Analysis
      1. Key Strategies
      2. NXP Semiconductors
    49. Financial Overview
      1. Products Offered
        1. Key Developments
        2. SWOT Analysis
        3. Key Strategies
      2. Analog Devices
        1. Financial Overview
        2. Products Offered
        3. Key
    50. Developments
      1. SWOT Analysis
        1. Key Strategies
    51. Broadcom
      1. Financial Overview
        1. Products Offered
    52. Key Developments
      1. SWOT Analysis
        1. Key Strategies
    53. Infineon Technologies
      1. Financial Overview
        1. Products Offered
        2. Key Developments
        3. SWOT Analysis
        4. Key Strategies
      2. ON Semiconductor
        1. Financial Overview
        2. Products
    54. Offered
      1. Key Developments
        1. SWOT Analysis
    55. Key Strategies
      1. Taiwan Semiconductor Manufacturing Company
    56. Financial Overview
      1. Products Offered
        1. Key Developments
        2. SWOT Analysis
        3. Key Strategies
      2. Tdk Corporation
        1. Financial Overview
        2. Products Offered
    57. Key Developments
      1. SWOT Analysis
        1. Key Strategies
      2. Texas Instruments
        1. Financial Overview
        2. Products
    58. Offered
      1. Key Developments
        1. SWOT Analysis
    59. Key Strategies
      1. Intel Corporation
        1. Financial Overview
        2. Products Offered
        3. Key Developments
        4. SWOT
    60. Analysis
      1. Key Strategies
      2. Vishay Intertechnology
    61. Financial Overview
      1. Products Offered
        1. Key Developments
        2. SWOT Analysis
        3. Key Strategies
    62. Appendix
      1. References
      2. Related Reports
    63. Electronic Components Market SIZE ESTIMATES & FORECAST, BY COMPONENT TYPE, 2019-2035
    64. (USD Billions)
    65. Market SIZE ESTIMATES & FORECAST, BY APPLICATION, 2019-2035 (USD Billions)
    66. & FORECAST, BY TECHNOLOGY, 2019-2035 (USD Billions)
    67. Active and Passive Electronic Components Market SIZE ESTIMATES & FORECAST, BY
    68. END USE, 2019-2035 (USD Billions)
    69. Electronic Components Market SIZE ESTIMATES & FORECAST, BY REGIONAL, 2019-2035
    70. (USD Billions)
    71. SIZE ESTIMATES & FORECAST, BY COMPONENT TYPE, 2019-2035 (USD Billions)
    72. US Active and Passive Electronic Components Market SIZE ESTIMATES & FORECAST,
    73. BY APPLICATION, 2019-2035 (USD Billions)
    74. Components Market SIZE ESTIMATES & FORECAST, BY TECHNOLOGY, 2019-2035 (USD Billions)
    75. & FORECAST, BY END USE, 2019-2035 (USD Billions)
    76. Passive Electronic Components Market SIZE ESTIMATES & FORECAST, BY REGIONAL,
    77. 2035 (USD Billions)
    78. Market SIZE ESTIMATES & FORECAST, BY COMPONENT TYPE, 2019-2035 (USD Billions)
    79. & FORECAST, BY APPLICATION, 2019-2035 (USD Billions)
    80. Active and Passive Electronic Components Market SIZE ESTIMATES & FORECAST, BY
    81. TECHNOLOGY, 2019-2035 (USD Billions)
    82. Components Market SIZE ESTIMATES & FORECAST, BY END USE, 2019-2035 (USD Billions)
    83. & FORECAST, BY REGIONAL, 2019-2035 (USD Billions)
    84. and Passive Electronic Components Market SIZE ESTIMATES & FORECAST, BY COMPONENT
    85. TYPE, 2019-2035 (USD Billions)
    86. Components Market SIZE ESTIMATES & FORECAST, BY APPLICATION, 2019-2035 (USD
    87. Billions)
    88. SIZE ESTIMATES & FORECAST, BY TECHNOLOGY, 2019-2035 (USD Billions)
    89. Europe Active and Passive Electronic Components Market SIZE ESTIMATES &
    90. FORECAST, BY END USE, 2019-2035 (USD Billions)
    91. Passive Electronic Components Market SIZE ESTIMATES & FORECAST, BY REGIONAL,
    92. 2035 (USD Billions)
    93. Market SIZE ESTIMATES & FORECAST, BY COMPONENT TYPE, 2019-2035 (USD Billions)
    94. & FORECAST, BY APPLICATION, 2019-2035 (USD Billions)
    95. Active and Passive Electronic Components Market SIZE ESTIMATES & FORECAST, BY
    96. TECHNOLOGY, 2019-2035 (USD Billions)
    97. Electronic Components Market SIZE ESTIMATES & FORECAST, BY END USE, 2019-2035
    98. (USD Billions)
    99. Market SIZE ESTIMATES & FORECAST, BY REGIONAL, 2019-2035 (USD Billions)
    100. FORECAST, BY COMPONENT TYPE, 2019-2035 (USD Billions)
    101. and Passive Electronic Components Market SIZE ESTIMATES & FORECAST, BY APPLICATION,
    102. 2035 (USD Billions)
    103. Market SIZE ESTIMATES & FORECAST, BY TECHNOLOGY, 2019-2035 (USD Billions)
    104. FORECAST, BY END USE, 2019-2035 (USD Billions)
    105. Electronic Components Market SIZE ESTIMATES & FORECAST, BY REGIONAL, 2019-2035
    106. (USD Billions)
    107. SIZE ESTIMATES & FORECAST, BY COMPONENT TYPE, 2019-2035 (USD Billions)
    108. France Active and Passive Electronic Components Market SIZE ESTIMATES &
    109. FORECAST, BY APPLICATION, 2019-2035 (USD Billions)
    110. and Passive Electronic Components Market SIZE ESTIMATES & FORECAST, BY TECHNOLOGY,
    111. 2035 (USD Billions)
    112. Market SIZE ESTIMATES & FORECAST, BY END USE, 2019-2035 (USD Billions)
    113. France Active and Passive Electronic Components Market SIZE ESTIMATES &
    114. FORECAST, BY REGIONAL, 2019-2035 (USD Billions)
    115. Passive Electronic Components Market SIZE ESTIMATES & FORECAST, BY COMPONENT
    116. TYPE, 2019-2035 (USD Billions)
    117. Components Market SIZE ESTIMATES & FORECAST, BY APPLICATION, 2019-2035 (USD
    118. Billions)
    119. SIZE ESTIMATES & FORECAST, BY TECHNOLOGY, 2019-2035 (USD Billions)
    120. Russia Active and Passive Electronic Components Market SIZE ESTIMATES &
    121. FORECAST, BY END USE, 2019-2035 (USD Billions)
    122. Passive Electronic Components Market SIZE ESTIMATES & FORECAST, BY REGIONAL,
    123. 2035 (USD Billions)
    124. Market SIZE ESTIMATES & FORECAST, BY COMPONENT TYPE, 2019-2035 (USD Billions)
    125. & FORECAST, BY APPLICATION, 2019-2035 (USD Billions)
    126. and Passive Electronic Components Market SIZE ESTIMATES & FORECAST, BY TECHNOLOGY,
    127. 2035 (USD Billions)
    128. Market SIZE ESTIMATES & FORECAST, BY END USE, 2019-2035 (USD Billions)
    129. Italy Active and Passive Electronic Components Market SIZE ESTIMATES & FORECAST,
    130. BY REGIONAL, 2019-2035 (USD Billions)
    131. Components Market SIZE ESTIMATES & FORECAST, BY COMPONENT TYPE, 2019-2035 (USD
    132. Billions)
    133. SIZE ESTIMATES & FORECAST, BY APPLICATION, 2019-2035 (USD Billions)
    134. Spain Active and Passive Electronic Components Market SIZE ESTIMATES & FORECAST,
    135. BY TECHNOLOGY, 2019-2035 (USD Billions)
    136. Electronic Components Market SIZE ESTIMATES & FORECAST, BY END USE, 2019-2035
    137. (USD Billions)
    138. SIZE ESTIMATES & FORECAST, BY REGIONAL, 2019-2035 (USD Billions)
    139. Rest of Europe Active and Passive Electronic Components Market SIZE ESTIMATES
    140. & FORECAST, BY COMPONENT TYPE, 2019-2035 (USD Billions)
    141. of Europe Active and Passive Electronic Components Market SIZE ESTIMATES & FORECAST,
    142. BY APPLICATION, 2019-2035 (USD Billions)
    143. Passive Electronic Components Market SIZE ESTIMATES & FORECAST, BY TECHNOLOGY,
    144. 2035 (USD Billions)
    145. Components Market SIZE ESTIMATES & FORECAST, BY END USE, 2019-2035 (USD Billions)
    146. ESTIMATES & FORECAST, BY REGIONAL, 2019-2035 (USD Billions)
    147. APAC Active and Passive Electronic Components Market SIZE ESTIMATES & FORECAST,
    148. BY COMPONENT TYPE, 2019-2035 (USD Billions)
    149. Electronic Components Market SIZE ESTIMATES & FORECAST, BY APPLICATION, 2019-2035
    150. (USD Billions)
    151. SIZE ESTIMATES & FORECAST, BY TECHNOLOGY, 2019-2035 (USD Billions)
    152. APAC Active and Passive Electronic Components Market SIZE ESTIMATES & FORECAST,
    153. BY END USE, 2019-2035 (USD Billions)
    154. Components Market SIZE ESTIMATES & FORECAST, BY REGIONAL, 2019-2035 (USD Billions)
    155. & FORECAST, BY COMPONENT TYPE, 2019-2035 (USD Billions)
    156. Active and Passive Electronic Components Market SIZE ESTIMATES & FORECAST, BY
    157. APPLICATION, 2019-2035 (USD Billions)
    158. Components Market SIZE ESTIMATES & FORECAST, BY TECHNOLOGY, 2019-2035 (USD Billions)
    159. & FORECAST, BY END USE, 2019-2035 (USD Billions)
    160. and Passive Electronic Components Market SIZE ESTIMATES & FORECAST, BY REGIONAL,
    161. 2035 (USD Billions)
    162. Market SIZE ESTIMATES & FORECAST, BY COMPONENT TYPE, 2019-2035 (USD Billions)
    163. & FORECAST, BY APPLICATION, 2019-2035 (USD Billions)
    164. and Passive Electronic Components Market SIZE ESTIMATES & FORECAST, BY TECHNOLOGY,
    165. 2035 (USD Billions)
    166. Market SIZE ESTIMATES & FORECAST, BY END USE, 2019-2035 (USD Billions)
    167. India Active and Passive Electronic Components Market SIZE ESTIMATES & FORECAST,
    168. BY REGIONAL, 2019-2035 (USD Billions)
    169. Components Market SIZE ESTIMATES & FORECAST, BY COMPONENT TYPE, 2019-2035 (USD
    170. Billions)
    171. SIZE ESTIMATES & FORECAST, BY APPLICATION, 2019-2035 (USD Billions)
    172. Japan Active and Passive Electronic Components Market SIZE ESTIMATES & FORECAST,
    173. BY TECHNOLOGY, 2019-2035 (USD Billions)
    174. Electronic Components Market SIZE ESTIMATES & FORECAST, BY END USE, 2019-2035
    175. (USD Billions)
    176. SIZE ESTIMATES & FORECAST, BY REGIONAL, 2019-2035 (USD Billions)
    177. South Korea Active and Passive Electronic Components Market SIZE ESTIMATES &
    178. FORECAST, BY COMPONENT TYPE, 2019-2035 (USD Billions)
    179. Active and Passive Electronic Components Market SIZE ESTIMATES & FORECAST, BY
    180. APPLICATION, 2019-2035 (USD Billions)
    181. Electronic Components Market SIZE ESTIMATES & FORECAST, BY TECHNOLOGY, 2019-2035
    182. (USD Billions)
    183. Market SIZE ESTIMATES & FORECAST, BY END USE, 2019-2035 (USD Billions)
    184. South Korea Active and Passive Electronic Components Market SIZE ESTIMATES &
    185. FORECAST, BY REGIONAL, 2019-2035 (USD Billions)
    186. and Passive Electronic Components Market SIZE ESTIMATES & FORECAST, BY COMPONENT
    187. TYPE, 2019-2035 (USD Billions)
    188. Components Market SIZE ESTIMATES & FORECAST, BY APPLICATION, 2019-2035 (USD
    189. Billions)
    190. SIZE ESTIMATES & FORECAST, BY TECHNOLOGY, 2019-2035 (USD Billions)
    191. Malaysia Active and Passive Electronic Components Market SIZE ESTIMATES &
    192. FORECAST, BY END USE, 2019-2035 (USD Billions)
    193. Passive Electronic Components Market SIZE ESTIMATES & FORECAST, BY REGIONAL,
    194. 2035 (USD Billions)
    195. Components Market SIZE ESTIMATES & FORECAST, BY COMPONENT TYPE, 2019-2035 (USD
    196. Billions)
    197. SIZE ESTIMATES & FORECAST, BY APPLICATION, 2019-2035 (USD Billions)
    198. Thailand Active and Passive Electronic Components Market SIZE ESTIMATES &
    199. FORECAST, BY TECHNOLOGY, 2019-2035 (USD Billions)
    200. and Passive Electronic Components Market SIZE ESTIMATES & FORECAST, BY END USE,
    201. 2035 (USD Billions)
    202. Components Market SIZE ESTIMATES & FORECAST, BY REGIONAL, 2019-2035 (USD Billions)
    203. & FORECAST, BY COMPONENT TYPE, 2019-2035 (USD Billions)
    204. Active and Passive Electronic Components Market SIZE ESTIMATES & FORECAST, BY
    205. APPLICATION, 2019-2035 (USD Billions)
    206. Electronic Components Market SIZE ESTIMATES & FORECAST, BY TECHNOLOGY, 2019-2035
    207. (USD Billions)
    208. Market SIZE ESTIMATES & FORECAST, BY END USE, 2019-2035 (USD Billions)
    209. Indonesia Active and Passive Electronic Components Market SIZE ESTIMATES &
    210. FORECAST, BY REGIONAL, 2019-2035 (USD Billions)
    211. and Passive Electronic Components Market SIZE ESTIMATES & FORECAST, BY COMPONENT
    212. TYPE, 2019-2035 (USD Billions)
    213. Components Market SIZE ESTIMATES & FORECAST, BY APPLICATION, 2019-2035 (USD
    214. Billions)
    215. Market SIZE ESTIMATES & FORECAST, BY TECHNOLOGY, 2019-2035 (USD Billions)
    216. & FORECAST, BY END USE, 2019-2035 (USD Billions)
    217. Active and Passive Electronic Components Market SIZE ESTIMATES & FORECAST, BY
    218. REGIONAL, 2019-2035 (USD Billions)
    219. Electronic Components Market SIZE ESTIMATES & FORECAST, BY COMPONENT TYPE, 2019-2035
    220. (USD Billions)
    221. Market SIZE ESTIMATES & FORECAST, BY APPLICATION, 2019-2035 (USD Billions)
    222. ESTIMATES & FORECAST, BY TECHNOLOGY, 2019-2035 (USD Billions)
    223. South America Active and Passive Electronic Components Market SIZE ESTIMATES &
    224. FORECAST, BY END USE, 2019-2035 (USD Billions)
    225. and Passive Electronic Components Market SIZE ESTIMATES & FORECAST, BY REGIONAL,
    226. 2035 (USD Billions)
    227. Market SIZE ESTIMATES & FORECAST, BY COMPONENT TYPE, 2019-2035 (USD Billions)
    228. & FORECAST, BY APPLICATION, 2019-2035 (USD Billions)
    229. Active and Passive Electronic Components Market SIZE ESTIMATES & FORECAST, BY
    230. TECHNOLOGY, 2019-2035 (USD Billions)
    231. Electronic Components Market SIZE ESTIMATES & FORECAST, BY END USE, 2019-2035
    232. (USD Billions)
    233. Market SIZE ESTIMATES & FORECAST, BY REGIONAL, 2019-2035 (USD Billions)
    234. & FORECAST, BY COMPONENT TYPE, 2019-2035 (USD Billions)
    235. Active and Passive Electronic Components Market SIZE ESTIMATES & FORECAST, BY
    236. APPLICATION, 2019-2035 (USD Billions)
    237. Electronic Components Market SIZE ESTIMATES & FORECAST, BY TECHNOLOGY, 2019-2035
    238. (USD Billions)
    239. Market SIZE ESTIMATES & FORECAST, BY END USE, 2019-2035 (USD Billions)
    240. Mexico Active and Passive Electronic Components Market SIZE ESTIMATES &
    241. FORECAST, BY REGIONAL, 2019-2035 (USD Billions)
    242. and Passive Electronic Components Market SIZE ESTIMATES & FORECAST, BY COMPONENT
    243. TYPE, 2019-2035 (USD Billions)
    244. Components Market SIZE ESTIMATES & FORECAST, BY APPLICATION, 2019-2035 (USD
    245. Billions)
    246. SIZE ESTIMATES & FORECAST, BY TECHNOLOGY, 2019-2035 (USD Billions)
    247. Argentina Active and Passive Electronic Components Market SIZE ESTIMATES &
    248. FORECAST, BY END USE, 2019-2035 (USD Billions)
    249. and Passive Electronic Components Market SIZE ESTIMATES & FORECAST, BY REGIONAL,
    250. 2035 (USD Billions)
    251. Electronic Components Market SIZE ESTIMATES & FORECAST, BY COMPONENT TYPE, 2019-2035
    252. (USD Billions)
    253. Components Market SIZE ESTIMATES & FORECAST, BY APPLICATION, 2019-2035 (USD
    254. Billions)
    255. Market SIZE ESTIMATES & FORECAST, BY TECHNOLOGY, 2019-2035 (USD Billions)
    256. SIZE ESTIMATES & FORECAST, BY END USE, 2019-2035 (USD Billions)
    257. Rest of South America Active and Passive Electronic Components Market SIZE
    258. ESTIMATES & FORECAST, BY REGIONAL, 2019-2035 (USD Billions)
    259. MEA Active and Passive Electronic Components Market SIZE ESTIMATES & FORECAST,
    260. BY COMPONENT TYPE, 2019-2035 (USD Billions)
    261. Electronic Components Market SIZE ESTIMATES & FORECAST, BY APPLICATION, 2019-2035
    262. (USD Billions)
    263. SIZE ESTIMATES & FORECAST, BY TECHNOLOGY, 2019-2035 (USD Billions)
    264. MEA Active and Passive Electronic Components Market SIZE ESTIMATES & FORECAST,
    265. BY END USE, 2019-2035 (USD Billions)
    266. Components Market SIZE ESTIMATES & FORECAST, BY REGIONAL, 2019-2035 (USD Billions)
    267. ESTIMATES & FORECAST, BY COMPONENT TYPE, 2019-2035 (USD Billions)
    268. GCC Countries Active and Passive Electronic Components Market SIZE ESTIMATES
    269. & FORECAST, BY APPLICATION, 2019-2035 (USD Billions)
    270. Active and Passive Electronic Components Market SIZE ESTIMATES & FORECAST, BY
    271. TECHNOLOGY, 2019-2035 (USD Billions)
    272. Electronic Components Market SIZE ESTIMATES & FORECAST, BY END USE, 2019-2035
    273. (USD Billions)
    274. Market SIZE ESTIMATES & FORECAST, BY REGIONAL, 2019-2035 (USD Billions)
    275. & FORECAST, BY COMPONENT TYPE, 2019-2035 (USD Billions)
    276. Africa Active and Passive Electronic Components Market SIZE ESTIMATES & FORECAST,
    277. BY APPLICATION, 2019-2035 (USD Billions)
    278. Passive Electronic Components Market SIZE ESTIMATES & FORECAST, BY TECHNOLOGY,
    279. 2035 (USD Billions)
    280. Components Market SIZE ESTIMATES & FORECAST, BY END USE, 2019-2035 (USD Billions)
    281. ESTIMATES & FORECAST, BY REGIONAL, 2019-2035 (USD Billions)
    282. Rest of MEA Active and Passive Electronic Components Market SIZE ESTIMATES &
    283. FORECAST, BY COMPONENT TYPE, 2019-2035 (USD Billions)
    284. Active and Passive Electronic Components Market SIZE ESTIMATES & FORECAST, BY
    285. APPLICATION, 2019-2035 (USD Billions)
    286. Electronic Components Market SIZE ESTIMATES & FORECAST, BY TECHNOLOGY, 2019-2035
    287. (USD Billions)
    288. Market SIZE ESTIMATES & FORECAST, BY END USE, 2019-2035 (USD Billions)
    289. Rest of MEA Active and Passive Electronic Components Market SIZE ESTIMATES
    290. & FORECAST, BY REGIONAL, 2019-2035 (USD Billions)
    291. DEVELOPMENT/APPROVAL
    292. LIST
    293. Of figures
    294. ACTIVE AND PASSIVE ELECTRONIC COMPONENTS MARKET ANALYSIS
    295. AND PASSIVE ELECTRONIC COMPONENTS MARKET ANALYSIS BY COMPONENT TYPE
    296. US ACTIVE AND PASSIVE ELECTRONIC COMPONENTS MARKET ANALYSIS BY APPLICATION
    297. USE
    298. BY REGIONAL
    299. ANALYSIS BY COMPONENT TYPE
    300. COMPONENTS MARKET ANALYSIS BY APPLICATION
    301. ELECTRONIC COMPONENTS MARKET ANALYSIS BY TECHNOLOGY
    302. AND PASSIVE ELECTRONIC COMPONENTS MARKET ANALYSIS BY END USE
    303. ACTIVE AND PASSIVE ELECTRONIC COMPONENTS MARKET ANALYSIS BY REGIONAL
    304. EUROPE ACTIVE AND PASSIVE ELECTRONIC COMPONENTS MARKET ANALYSIS
    305. GERMANY ACTIVE AND PASSIVE ELECTRONIC COMPONENTS MARKET ANALYSIS BY COMPONENT
    306. TYPE
    307. BY APPLICATION
    308. MARKET ANALYSIS BY TECHNOLOGY
    309. COMPONENTS MARKET ANALYSIS BY END USE
    310. ELECTRONIC COMPONENTS MARKET ANALYSIS BY REGIONAL
    311. PASSIVE ELECTRONIC COMPONENTS MARKET ANALYSIS BY COMPONENT TYPE
    312. UK ACTIVE AND PASSIVE ELECTRONIC COMPONENTS MARKET ANALYSIS BY APPLICATION
    313. UK ACTIVE AND PASSIVE ELECTRONIC COMPONENTS MARKET ANALYSIS BY TECHNOLOGY
    314. USE
    315. BY REGIONAL
    316. ANALYSIS BY COMPONENT TYPE
    317. COMPONENTS MARKET ANALYSIS BY APPLICATION
    318. ELECTRONIC COMPONENTS MARKET ANALYSIS BY TECHNOLOGY
    319. AND PASSIVE ELECTRONIC COMPONENTS MARKET ANALYSIS BY END USE
    320. ACTIVE AND PASSIVE ELECTRONIC COMPONENTS MARKET ANALYSIS BY REGIONAL
    321. RUSSIA ACTIVE AND PASSIVE ELECTRONIC COMPONENTS MARKET ANALYSIS BY COMPONENT
    322. TYPE
    323. BY APPLICATION
    324. MARKET ANALYSIS BY TECHNOLOGY
    325. COMPONENTS MARKET ANALYSIS BY END USE
    326. ELECTRONIC COMPONENTS MARKET ANALYSIS BY REGIONAL
    327. AND PASSIVE ELECTRONIC COMPONENTS MARKET ANALYSIS BY COMPONENT TYPE
    328. ITALY ACTIVE AND PASSIVE ELECTRONIC COMPONENTS MARKET ANALYSIS BY APPLICATION
    329. BY TECHNOLOGY
    330. ANALYSIS BY END USE
    331. MARKET ANALYSIS BY REGIONAL
    332. COMPONENTS MARKET ANALYSIS BY COMPONENT TYPE
    333. ELECTRONIC COMPONENTS MARKET ANALYSIS BY APPLICATION
    334. AND PASSIVE ELECTRONIC COMPONENTS MARKET ANALYSIS BY TECHNOLOGY
    335. SPAIN ACTIVE AND PASSIVE ELECTRONIC COMPONENTS MARKET ANALYSIS BY END USE
    336. SPAIN ACTIVE AND PASSIVE ELECTRONIC COMPONENTS MARKET ANALYSIS BY REGIONAL
    337. BY COMPONENT TYPE
    338. COMPONENTS MARKET ANALYSIS BY APPLICATION
    339. AND PASSIVE ELECTRONIC COMPONENTS MARKET ANALYSIS BY TECHNOLOGY
    340. REST OF EUROPE ACTIVE AND PASSIVE ELECTRONIC COMPONENTS MARKET ANALYSIS BY END USE
    341. ANALYSIS BY REGIONAL
    342. MARKET ANALYSIS
    343. MARKET ANALYSIS BY COMPONENT TYPE
    344. COMPONENTS MARKET ANALYSIS BY APPLICATION
    345. ELECTRONIC COMPONENTS MARKET ANALYSIS BY TECHNOLOGY
    346. AND PASSIVE ELECTRONIC COMPONENTS MARKET ANALYSIS BY END USE
    347. ACTIVE AND PASSIVE ELECTRONIC COMPONENTS MARKET ANALYSIS BY REGIONAL
    348. INDIA ACTIVE AND PASSIVE ELECTRONIC COMPONENTS MARKET ANALYSIS BY COMPONENT
    349. TYPE
    350. BY APPLICATION
    351. ANALYSIS BY TECHNOLOGY
    352. MARKET ANALYSIS BY END USE
    353. COMPONENTS MARKET ANALYSIS BY REGIONAL
    354. ELECTRONIC COMPONENTS MARKET ANALYSIS BY COMPONENT TYPE
    355. AND PASSIVE ELECTRONIC COMPONENTS MARKET ANALYSIS BY APPLICATION
    356. JAPAN ACTIVE AND PASSIVE ELECTRONIC COMPONENTS MARKET ANALYSIS BY TECHNOLOGY
    357. USE
    358. BY REGIONAL
    359. MARKET ANALYSIS BY COMPONENT TYPE
    360. ELECTRONIC COMPONENTS MARKET ANALYSIS BY APPLICATION
    361. ACTIVE AND PASSIVE ELECTRONIC COMPONENTS MARKET ANALYSIS BY TECHNOLOGY
    362. SOUTH KOREA ACTIVE AND PASSIVE ELECTRONIC COMPONENTS MARKET ANALYSIS BY END
    363. USE
    364. ANALYSIS BY REGIONAL
    365. MARKET ANALYSIS BY COMPONENT TYPE
    366. COMPONENTS MARKET ANALYSIS BY APPLICATION
    367. ELECTRONIC COMPONENTS MARKET ANALYSIS BY TECHNOLOGY
    368. AND PASSIVE ELECTRONIC COMPONENTS MARKET ANALYSIS BY END USE
    369. ACTIVE AND PASSIVE ELECTRONIC COMPONENTS MARKET ANALYSIS BY REGIONAL
    370. THAILAND ACTIVE AND PASSIVE ELECTRONIC COMPONENTS MARKET ANALYSIS BY COMPONENT
    371. TYPE
    372. BY APPLICATION
    373. MARKET ANALYSIS BY TECHNOLOGY
    374. COMPONENTS MARKET ANALYSIS BY END USE
    375. ELECTRONIC COMPONENTS MARKET ANALYSIS BY REGIONAL
    376. AND PASSIVE ELECTRONIC COMPONENTS MARKET ANALYSIS BY COMPONENT TYPE
    377. INDONESIA ACTIVE AND PASSIVE ELECTRONIC COMPONENTS MARKET ANALYSIS BY APPLICATION
    378. BY TECHNOLOGY
    379. MARKET ANALYSIS BY END USE
    380. COMPONENTS MARKET ANALYSIS BY REGIONAL
    381. PASSIVE ELECTRONIC COMPONENTS MARKET ANALYSIS BY COMPONENT TYPE
    382. REST OF APAC ACTIVE AND PASSIVE ELECTRONIC COMPONENTS MARKET ANALYSIS BY APPLICATION
    383. BY TECHNOLOGY
    384. MARKET ANALYSIS BY END USE
    385. COMPONENTS MARKET ANALYSIS BY REGIONAL
    386. PASSIVE ELECTRONIC COMPONENTS MARKET ANALYSIS
    387. PASSIVE ELECTRONIC COMPONENTS MARKET ANALYSIS BY COMPONENT TYPE
    388. BRAZIL ACTIVE AND PASSIVE ELECTRONIC COMPONENTS MARKET ANALYSIS BY APPLICATION
    389. TECHNOLOGY
    390. ANALYSIS BY END USE
    391. MARKET ANALYSIS BY REGIONAL
    392. COMPONENTS MARKET ANALYSIS BY COMPONENT TYPE
    393. PASSIVE ELECTRONIC COMPONENTS MARKET ANALYSIS BY APPLICATION
    394. ACTIVE AND PASSIVE ELECTRONIC COMPONENTS MARKET ANALYSIS BY TECHNOLOGY
    395. MEXICO ACTIVE AND PASSIVE ELECTRONIC COMPONENTS MARKET ANALYSIS BY END USE
    396. REGIONAL
    397. ANALYSIS BY COMPONENT TYPE
    398. COMPONENTS MARKET ANALYSIS BY APPLICATION
    399. PASSIVE ELECTRONIC COMPONENTS MARKET ANALYSIS BY TECHNOLOGY
    400. ACTIVE AND PASSIVE ELECTRONIC COMPONENTS MARKET ANALYSIS BY END USE
    401. ARGENTINA ACTIVE AND PASSIVE ELECTRONIC COMPONENTS MARKET ANALYSIS BY REGIONAL
    402. MARKET ANALYSIS BY COMPONENT TYPE
    403. AND PASSIVE ELECTRONIC COMPONENTS MARKET ANALYSIS BY APPLICATION
    404. REST OF SOUTH AMERICA ACTIVE AND PASSIVE ELECTRONIC COMPONENTS MARKET ANALYSIS BY
    405. TECHNOLOGY
    406. COMPONENTS MARKET ANALYSIS BY END USE
    407. AND PASSIVE ELECTRONIC COMPONENTS MARKET ANALYSIS BY REGIONAL
    408. MEA ACTIVE AND PASSIVE ELECTRONIC COMPONENTS MARKET ANALYSIS
    409. COUNTRIES ACTIVE AND PASSIVE ELECTRONIC COMPONENTS MARKET ANALYSIS BY COMPONENT
    410. TYPE
    411. ANALYSIS BY APPLICATION
    412. COMPONENTS MARKET ANALYSIS BY TECHNOLOGY
    413. AND PASSIVE ELECTRONIC COMPONENTS MARKET ANALYSIS BY END USE
    414. COUNTRIES ACTIVE AND PASSIVE ELECTRONIC COMPONENTS MARKET ANALYSIS BY REGIONAL
    415. BY COMPONENT TYPE
    416. MARKET ANALYSIS BY APPLICATION
    417. ELECTRONIC COMPONENTS MARKET ANALYSIS BY TECHNOLOGY
    418. ACTIVE AND PASSIVE ELECTRONIC COMPONENTS MARKET ANALYSIS BY END USE
    419. SOUTH AFRICA ACTIVE AND PASSIVE ELECTRONIC COMPONENTS MARKET ANALYSIS BY REGIONAL
    420. BY COMPONENT TYPE
    421. MARKET ANALYSIS BY APPLICATION
    422. ELECTRONIC COMPONENTS MARKET ANALYSIS BY TECHNOLOGY
    423. ACTIVE AND PASSIVE ELECTRONIC COMPONENTS MARKET ANALYSIS BY END USE
    424. REST OF MEA ACTIVE AND PASSIVE ELECTRONIC COMPONENTS MARKET ANALYSIS BY REGIONAL
    425. MARKET
    426. OF ACTIVE AND PASSIVE ELECTRONIC COMPONENTS MARKET
    427. ANALYSIS: ACTIVE AND PASSIVE ELECTRONIC COMPONENTS MARKET
    428. IMPACT ANALYSIS: ACTIVE AND PASSIVE ELECTRONIC COMPONENTS MARKET
    429. SUPPLY / VALUE CHAIN: ACTIVE AND PASSIVE ELECTRONIC COMPONENTS MARKET
    430. ACTIVE AND PASSIVE ELECTRONIC COMPONENTS MARKET, BY COMPONENT TYPE, 2024 (%
    431. SHARE)
    432. TYPE, 2019 TO 2035 (USD Billions)
    433. COMPONENTS MARKET, BY APPLICATION, 2024 (% SHARE)
    434. ELECTRONIC COMPONENTS MARKET, BY APPLICATION, 2019 TO 2035 (USD Billions)
    435. ACTIVE AND PASSIVE ELECTRONIC COMPONENTS MARKET, BY TECHNOLOGY, 2024 (% SHARE)
    436. TO 2035 (USD Billions)
    437. MARKET, BY END USE, 2024 (% SHARE)
    438. COMPONENTS MARKET, BY END USE, 2019 TO 2035 (USD Billions)
    439. AND PASSIVE ELECTRONIC COMPONENTS MARKET, BY REGIONAL, 2024 (% SHARE)
    440. ACTIVE AND PASSIVE ELECTRONIC COMPONENTS MARKET, BY REGIONAL, 2019 TO 2035
    441. (USD Billions)

    Active and Passive Electronic Components Market Segmentation

    • Active and Passive Electronic Components Market By Component Type (USD Billion, 2019-2035)

      • Active Components
      • Passive Components
    • Active and Passive Electronic Components Market By Application (USD Billion, 2019-2035)

      • Consumer Electronics
      • Telecommunications
      • Automotive
      • Industrial
      • Healthcare
    • Active and Passive Electronic Components Market By Technology (USD Billion, 2019-2035)

      • Semiconductors
      • Capacitors
      • Resistors
      • Inductors
      • Diodes
    • Active and Passive Electronic Components Market By End Use (USD Billion, 2019-2035)

      • Residential
      • Commercial
      • Industrial
    • Active and Passive Electronic Components Market By Regional (USD Billion, 2019-2035)

      • North America
      • Europe
      • South America
      • Asia Pacific
      • Middle East and Africa

    Active and Passive Electronic Components Market Regional Outlook (USD Billion, 2019-2035)

    • North America Outlook (USD Billion, 2019-2035)

      • North America Active and Passive Electronic Components Market by Component Type

        • Active Components
        • Passive Components
      • North America Active and Passive Electronic Components Market by Application Type

        • Consumer Electronics
        • Telecommunications
        • Automotive
        • Industrial
        • Healthcare
      • North America Active and Passive Electronic Components Market by Technology Type

        • Semiconductors
        • Capacitors
        • Resistors
        • Inductors
        • Diodes
      • North America Active and Passive Electronic Components Market by End Use Type

        • Residential
        • Commercial
        • Industrial
      • North America Active and Passive Electronic Components Market by Regional Type

        • US
        • Canada
      • US Outlook (USD Billion, 2019-2035)
      • US Active and Passive Electronic Components Market by Component Type

        • Active Components
        • Passive Components
      • US Active and Passive Electronic Components Market by Application Type

        • Consumer Electronics
        • Telecommunications
        • Automotive
        • Industrial
        • Healthcare
      • US Active and Passive Electronic Components Market by Technology Type

        • Semiconductors
        • Capacitors
        • Resistors
        • Inductors
        • Diodes
      • US Active and Passive Electronic Components Market by End Use Type

        • Residential
        • Commercial
        • Industrial
      • CANADA Outlook (USD Billion, 2019-2035)
      • CANADA Active and Passive Electronic Components Market by Component Type

        • Active Components
        • Passive Components
      • CANADA Active and Passive Electronic Components Market by Application Type

        • Consumer Electronics
        • Telecommunications
        • Automotive
        • Industrial
        • Healthcare
      • CANADA Active and Passive Electronic Components Market by Technology Type

        • Semiconductors
        • Capacitors
        • Resistors
        • Inductors
        • Diodes
      • CANADA Active and Passive Electronic Components Market by End Use Type

        • Residential
        • Commercial
        • Industrial
    • Europe Outlook (USD Billion, 2019-2035)

      • Europe Active and Passive Electronic Components Market by Component Type

        • Active Components
        • Passive Components
      • Europe Active and Passive Electronic Components Market by Application Type

        • Consumer Electronics
        • Telecommunications
        • Automotive
        • Industrial
        • Healthcare
      • Europe Active and Passive Electronic Components Market by Technology Type

        • Semiconductors
        • Capacitors
        • Resistors
        • Inductors
        • Diodes
      • Europe Active and Passive Electronic Components Market by End Use Type

        • Residential
        • Commercial
        • Industrial
      • Europe Active and Passive Electronic Components Market by Regional Type

        • Germany
        • UK
        • France
        • Russia
        • Italy
        • Spain
        • Rest of Europe
      • GERMANY Outlook (USD Billion, 2019-2035)
      • GERMANY Active and Passive Electronic Components Market by Component Type

        • Active Components
        • Passive Components
      • GERMANY Active and Passive Electronic Components Market by Application Type

        • Consumer Electronics
        • Telecommunications
        • Automotive
        • Industrial
        • Healthcare
      • GERMANY Active and Passive Electronic Components Market by Technology Type

        • Semiconductors
        • Capacitors
        • Resistors
        • Inductors
        • Diodes
      • GERMANY Active and Passive Electronic Components Market by End Use Type

        • Residential
        • Commercial
        • Industrial
      • UK Outlook (USD Billion, 2019-2035)
      • UK Active and Passive Electronic Components Market by Component Type

        • Active Components
        • Passive Components
      • UK Active and Passive Electronic Components Market by Application Type

        • Consumer Electronics
        • Telecommunications
        • Automotive
        • Industrial
        • Healthcare
      • UK Active and Passive Electronic Components Market by Technology Type

        • Semiconductors
        • Capacitors
        • Resistors
        • Inductors
        • Diodes
      • UK Active and Passive Electronic Components Market by End Use Type

        • Residential
        • Commercial
        • Industrial
      • FRANCE Outlook (USD Billion, 2019-2035)
      • FRANCE Active and Passive Electronic Components Market by Component Type

        • Active Components
        • Passive Components
      • FRANCE Active and Passive Electronic Components Market by Application Type

        • Consumer Electronics
        • Telecommunications
        • Automotive
        • Industrial
        • Healthcare
      • FRANCE Active and Passive Electronic Components Market by Technology Type

        • Semiconductors
        • Capacitors
        • Resistors
        • Inductors
        • Diodes
      • FRANCE Active and Passive Electronic Components Market by End Use Type

        • Residential
        • Commercial
        • Industrial
      • RUSSIA Outlook (USD Billion, 2019-2035)
      • RUSSIA Active and Passive Electronic Components Market by Component Type

        • Active Components
        • Passive Components
      • RUSSIA Active and Passive Electronic Components Market by Application Type

        • Consumer Electronics
        • Telecommunications
        • Automotive
        • Industrial
        • Healthcare
      • RUSSIA Active and Passive Electronic Components Market by Technology Type

        • Semiconductors
        • Capacitors
        • Resistors
        • Inductors
        • Diodes
      • RUSSIA Active and Passive Electronic Components Market by End Use Type

        • Residential
        • Commercial
        • Industrial
      • ITALY Outlook (USD Billion, 2019-2035)
      • ITALY Active and Passive Electronic Components Market by Component Type

        • Active Components
        • Passive Components
      • ITALY Active and Passive Electronic Components Market by Application Type

        • Consumer Electronics
        • Telecommunications
        • Automotive
        • Industrial
        • Healthcare
      • ITALY Active and Passive Electronic Components Market by Technology Type

        • Semiconductors
        • Capacitors
        • Resistors
        • Inductors
        • Diodes
      • ITALY Active and Passive Electronic Components Market by End Use Type

        • Residential
        • Commercial
        • Industrial
      • SPAIN Outlook (USD Billion, 2019-2035)
      • SPAIN Active and Passive Electronic Components Market by Component Type

        • Active Components
        • Passive Components
      • SPAIN Active and Passive Electronic Components Market by Application Type

        • Consumer Electronics
        • Telecommunications
        • Automotive
        • Industrial
        • Healthcare
      • SPAIN Active and Passive Electronic Components Market by Technology Type

        • Semiconductors
        • Capacitors
        • Resistors
        • Inductors
        • Diodes
      • SPAIN Active and Passive Electronic Components Market by End Use Type

        • Residential
        • Commercial
        • Industrial
      • REST OF EUROPE Outlook (USD Billion, 2019-2035)
      • REST OF EUROPE Active and Passive Electronic Components Market by Component Type

        • Active Components
        • Passive Components
      • REST OF EUROPE Active and Passive Electronic Components Market by Application Type

        • Consumer Electronics
        • Telecommunications
        • Automotive
        • Industrial
        • Healthcare
      • REST OF EUROPE Active and Passive Electronic Components Market by Technology Type

        • Semiconductors
        • Capacitors
        • Resistors
        • Inductors
        • Diodes
      • REST OF EUROPE Active and Passive Electronic Components Market by End Use Type

        • Residential
        • Commercial
        • Industrial
    • APAC Outlook (USD Billion, 2019-2035)

      • APAC Active and Passive Electronic Components Market by Component Type

        • Active Components
        • Passive Components
      • APAC Active and Passive Electronic Components Market by Application Type

        • Consumer Electronics
        • Telecommunications
        • Automotive
        • Industrial
        • Healthcare
      • APAC Active and Passive Electronic Components Market by Technology Type

        • Semiconductors
        • Capacitors
        • Resistors
        • Inductors
        • Diodes
      • APAC Active and Passive Electronic Components Market by End Use Type

        • Residential
        • Commercial
        • Industrial
      • APAC Active and Passive Electronic Components Market by Regional Type

        • China
        • India
        • Japan
        • South Korea
        • Malaysia
        • Thailand
        • Indonesia
        • Rest of APAC
      • CHINA Outlook (USD Billion, 2019-2035)
      • CHINA Active and Passive Electronic Components Market by Component Type

        • Active Components
        • Passive Components
      • CHINA Active and Passive Electronic Components Market by Application Type

        • Consumer Electronics
        • Telecommunications
        • Automotive
        • Industrial
        • Healthcare
      • CHINA Active and Passive Electronic Components Market by Technology Type

        • Semiconductors
        • Capacitors
        • Resistors
        • Inductors
        • Diodes
      • CHINA Active and Passive Electronic Components Market by End Use Type

        • Residential
        • Commercial
        • Industrial
      • INDIA Outlook (USD Billion, 2019-2035)
      • INDIA Active and Passive Electronic Components Market by Component Type

        • Active Components
        • Passive Components
      • INDIA Active and Passive Electronic Components Market by Application Type

        • Consumer Electronics
        • Telecommunications
        • Automotive
        • Industrial
        • Healthcare
      • INDIA Active and Passive Electronic Components Market by Technology Type

        • Semiconductors
        • Capacitors
        • Resistors
        • Inductors
        • Diodes
      • INDIA Active and Passive Electronic Components Market by End Use Type

        • Residential
        • Commercial
        • Industrial
      • JAPAN Outlook (USD Billion, 2019-2035)
      • JAPAN Active and Passive Electronic Components Market by Component Type

        • Active Components
        • Passive Components
      • JAPAN Active and Passive Electronic Components Market by Application Type

        • Consumer Electronics
        • Telecommunications
        • Automotive
        • Industrial
        • Healthcare
      • JAPAN Active and Passive Electronic Components Market by Technology Type

        • Semiconductors
        • Capacitors
        • Resistors
        • Inductors
        • Diodes
      • JAPAN Active and Passive Electronic Components Market by End Use Type

        • Residential
        • Commercial
        • Industrial
      • SOUTH KOREA Outlook (USD Billion, 2019-2035)
      • SOUTH KOREA Active and Passive Electronic Components Market by Component Type

        • Active Components
        • Passive Components
      • SOUTH KOREA Active and Passive Electronic Components Market by Application Type

        • Consumer Electronics
        • Telecommunications
        • Automotive
        • Industrial
        • Healthcare
      • SOUTH KOREA Active and Passive Electronic Components Market by Technology Type

        • Semiconductors
        • Capacitors
        • Resistors
        • Inductors
        • Diodes
      • SOUTH KOREA Active and Passive Electronic Components Market by End Use Type

        • Residential
        • Commercial
        • Industrial
      • MALAYSIA Outlook (USD Billion, 2019-2035)
      • MALAYSIA Active and Passive Electronic Components Market by Component Type

        • Active Components
        • Passive Components
      • MALAYSIA Active and Passive Electronic Components Market by Application Type

        • Consumer Electronics
        • Telecommunications
        • Automotive
        • Industrial
        • Healthcare
      • MALAYSIA Active and Passive Electronic Components Market by Technology Type

        • Semiconductors
        • Capacitors
        • Resistors
        • Inductors
        • Diodes
      • MALAYSIA Active and Passive Electronic Components Market by End Use Type

        • Residential
        • Commercial
        • Industrial
      • THAILAND Outlook (USD Billion, 2019-2035)
      • THAILAND Active and Passive Electronic Components Market by Component Type

        • Active Components
        • Passive Components
      • THAILAND Active and Passive Electronic Components Market by Application Type

        • Consumer Electronics
        • Telecommunications
        • Automotive
        • Industrial
        • Healthcare
      • THAILAND Active and Passive Electronic Components Market by Technology Type

        • Semiconductors
        • Capacitors
        • Resistors
        • Inductors
        • Diodes
      • THAILAND Active and Passive Electronic Components Market by End Use Type

        • Residential
        • Commercial
        • Industrial
      • INDONESIA Outlook (USD Billion, 2019-2035)
      • INDONESIA Active and Passive Electronic Components Market by Component Type

        • Active Components
        • Passive Components
      • INDONESIA Active and Passive Electronic Components Market by Application Type

        • Consumer Electronics
        • Telecommunications
        • Automotive
        • Industrial
        • Healthcare
      • INDONESIA Active and Passive Electronic Components Market by Technology Type

        • Semiconductors
        • Capacitors
        • Resistors
        • Inductors
        • Diodes
      • INDONESIA Active and Passive Electronic Components Market by End Use Type

        • Residential
        • Commercial
        • Industrial
      • REST OF APAC Outlook (USD Billion, 2019-2035)
      • REST OF APAC Active and Passive Electronic Components Market by Component Type

        • Active Components
        • Passive Components
      • REST OF APAC Active and Passive Electronic Components Market by Application Type

        • Consumer Electronics
        • Telecommunications
        • Automotive
        • Industrial
        • Healthcare
      • REST OF APAC Active and Passive Electronic Components Market by Technology Type

        • Semiconductors
        • Capacitors
        • Resistors
        • Inductors
        • Diodes
      • REST OF APAC Active and Passive Electronic Components Market by End Use Type

        • Residential
        • Commercial
        • Industrial
    • South America Outlook (USD Billion, 2019-2035)

      • South America Active and Passive Electronic Components Market by Component Type

        • Active Components
        • Passive Components
      • South America Active and Passive Electronic Components Market by Application Type

        • Consumer Electronics
        • Telecommunications
        • Automotive
        • Industrial
        • Healthcare
      • South America Active and Passive Electronic Components Market by Technology Type

        • Semiconductors
        • Capacitors
        • Resistors
        • Inductors
        • Diodes
      • South America Active and Passive Electronic Components Market by End Use Type

        • Residential
        • Commercial
        • Industrial
      • South America Active and Passive Electronic Components Market by Regional Type

        • Brazil
        • Mexico
        • Argentina
        • Rest of South America
      • BRAZIL Outlook (USD Billion, 2019-2035)
      • BRAZIL Active and Passive Electronic Components Market by Component Type

        • Active Components
        • Passive Components
      • BRAZIL Active and Passive Electronic Components Market by Application Type

        • Consumer Electronics
        • Telecommunications
        • Automotive
        • Industrial
        • Healthcare
      • BRAZIL Active and Passive Electronic Components Market by Technology Type

        • Semiconductors
        • Capacitors
        • Resistors
        • Inductors
        • Diodes
      • BRAZIL Active and Passive Electronic Components Market by End Use Type

        • Residential
        • Commercial
        • Industrial
      • MEXICO Outlook (USD Billion, 2019-2035)
      • MEXICO Active and Passive Electronic Components Market by Component Type

        • Active Components
        • Passive Components
      • MEXICO Active and Passive Electronic Components Market by Application Type

        • Consumer Electronics
        • Telecommunications
        • Automotive
        • Industrial
        • Healthcare
      • MEXICO Active and Passive Electronic Components Market by Technology Type

        • Semiconductors
        • Capacitors
        • Resistors
        • Inductors
        • Diodes
      • MEXICO Active and Passive Electronic Components Market by End Use Type

        • Residential
        • Commercial
        • Industrial
      • ARGENTINA Outlook (USD Billion, 2019-2035)
      • ARGENTINA Active and Passive Electronic Components Market by Component Type

        • Active Components
        • Passive Components
      • ARGENTINA Active and Passive Electronic Components Market by Application Type

        • Consumer Electronics
        • Telecommunications
        • Automotive
        • Industrial
        • Healthcare
      • ARGENTINA Active and Passive Electronic Components Market by Technology Type

        • Semiconductors
        • Capacitors
        • Resistors
        • Inductors
        • Diodes
      • ARGENTINA Active and Passive Electronic Components Market by End Use Type

        • Residential
        • Commercial
        • Industrial
      • REST OF SOUTH AMERICA Outlook (USD Billion, 2019-2035)
      • REST OF SOUTH AMERICA Active and Passive Electronic Components Market by Component Type

        • Active Components
        • Passive Components
      • REST OF SOUTH AMERICA Active and Passive Electronic Components Market by Application Type

        • Consumer Electronics
        • Telecommunications
        • Automotive
        • Industrial
        • Healthcare
      • REST OF SOUTH AMERICA Active and Passive Electronic Components Market by Technology Type

        • Semiconductors
        • Capacitors
        • Resistors
        • Inductors
        • Diodes
      • REST OF SOUTH AMERICA Active and Passive Electronic Components Market by End Use Type

        • Residential
        • Commercial
        • Industrial
    • MEA Outlook (USD Billion, 2019-2035)

      • MEA Active and Passive Electronic Components Market by Component Type

        • Active Components
        • Passive Components
      • MEA Active and Passive Electronic Components Market by Application Type

        • Consumer Electronics
        • Telecommunications
        • Automotive
        • Industrial
        • Healthcare
      • MEA Active and Passive Electronic Components Market by Technology Type

        • Semiconductors
        • Capacitors
        • Resistors
        • Inductors
        • Diodes
      • MEA Active and Passive Electronic Components Market by End Use Type

        • Residential
        • Commercial
        • Industrial
      • MEA Active and Passive Electronic Components Market by Regional Type

        • GCC Countries
        • South Africa
        • Rest of MEA
      • GCC COUNTRIES Outlook (USD Billion, 2019-2035)
      • GCC COUNTRIES Active and Passive Electronic Components Market by Component Type

        • Active Components
        • Passive Components
      • GCC COUNTRIES Active and Passive Electronic Components Market by Application Type

        • Consumer Electronics
        • Telecommunications
        • Automotive
        • Industrial
        • Healthcare
      • GCC COUNTRIES Active and Passive Electronic Components Market by Technology Type

        • Semiconductors
        • Capacitors
        • Resistors
        • Inductors
        • Diodes
      • GCC COUNTRIES Active and Passive Electronic Components Market by End Use Type

        • Residential
        • Commercial
        • Industrial
      • SOUTH AFRICA Outlook (USD Billion, 2019-2035)
      • SOUTH AFRICA Active and Passive Electronic Components Market by Component Type

        • Active Components
        • Passive Components
      • SOUTH AFRICA Active and Passive Electronic Components Market by Application Type

        • Consumer Electronics
        • Telecommunications
        • Automotive
        • Industrial
        • Healthcare
      • SOUTH AFRICA Active and Passive Electronic Components Market by Technology Type

        • Semiconductors
        • Capacitors
        • Resistors
        • Inductors
        • Diodes
      • SOUTH AFRICA Active and Passive Electronic Components Market by End Use Type

        • Residential
        • Commercial
        • Industrial
      • REST OF MEA Outlook (USD Billion, 2019-2035)
      • REST OF MEA Active and Passive Electronic Components Market by Component Type

        • Active Components
        • Passive Components
      • REST OF MEA Active and Passive Electronic Components Market by Application Type

        • Consumer Electronics
        • Telecommunications
        • Automotive
        • Industrial
        • Healthcare
      • REST OF MEA Active and Passive Electronic Components Market by Technology Type

        • Semiconductors
        • Capacitors
        • Resistors
        • Inductors
        • Diodes
      • REST OF MEA Active and Passive Electronic Components Market by End Use Type

        • Residential
        • Commercial
        • Industrial
    Report Infographic
    Free Sample Request

    Kindly complete the form below to receive a free sample of this Report

    Customer Strories

    “I am very pleased with how market segments have been defined in a relevant way for my purposes (such as "Portable Freezers & refrigerators" and "last-mile"). In general the report is well structured. Thanks very much for your efforts.”

    Victoria Milne Founder
    Case Study

    Chemicals and Materials