• Cat-intel
  • MedIntelliX
  • Resources
  • About Us
  • Hero Background
    English
    Chinese
    French
    Japanese
    Korean
    German
    Spanish

    3D Printing Metal Market Analysis

    ID: MRFR/CnM/1302-CR
    299 Pages
    Anshula Mandaokar
    February 2021

    3D Printing Metals Market Research Report Information By Material (Titanium, Aluminum, Stainless Steel, Nickel, Inconel, and others), By Technology (Vat Photopolymerization, Material Extrusion, Sheet Lamination, Binder Jetting, Material Jetting, and others), By Application (Aerospace & Defense, Automotive, Healthcare, Building & Construction, Consumer Electronics, and others), And By Re...

    Share:
    Download PDF ×

    We do not share your information with anyone. However, we may send you emails based on your report interest from time to time. You may contact us at any time to opt-out.

    3D Printing Metal Market Infographic
    Purchase Options

    Market Analysis

    In-depth Analysis of 3D Printing Metal Market Industry Landscape

    The market dynamics of the 3D printing metals market are influenced by various factors that shape its growth, demand, and competitiveness. Firstly, technological advancements play a significant role in driving the market forward. As 3D printing technology continues to evolve, the ability to print with metals becomes more efficient, cost-effective, and accessible. This leads to increased adoption across various industries such as aerospace, automotive, healthcare, and consumer goods.

    The ability to print 3D metals has been greatly enhanced over the last few years and can now be used in a wide range of scientific applications. A key enabler of the growth that is expected for the industry in the coming years could be technology that makes advanced 3D printers affordable.

    Additionally, the growing demand for customized and complex metal parts fuels the expansion of the 3D printing metals market. Traditional manufacturing processes often struggle to produce intricate designs with the same level of precision and efficiency as 3D printing. As a result, industries seeking highly specialized components turn to additive manufacturing using metals to meet their unique requirements.

    Moreover, the market dynamics are also influenced by the increasing awareness of the environmental benefits of 3D printing metals. Compared to traditional manufacturing methods, additive manufacturing typically generates less waste and consumes fewer resources. This sustainability aspect appeals to companies striving to reduce their carbon footprint and comply with stricter environmental regulations, thus driving the demand for 3D printing metals.

    Furthermore, the global economic landscape and geopolitical factors play a crucial role in shaping the market dynamics of 3D printing metals. Fluctuations in raw material prices, trade policies, and geopolitical tensions can impact the availability and cost of metal powders used in additive manufacturing. As a result, market players need to closely monitor these external factors and adapt their strategies accordingly to mitigate risks and capitalize on opportunities.

    Additionally, partnerships, collaborations, and strategic alliances among industry players contribute to the market dynamics of 3D printing metals. Companies often form alliances to leverage each other's strengths in technology, distribution networks, or market reach. These partnerships can accelerate innovation, expand market penetration, and enhance the overall competitiveness of the 3D printing metals market.

    Moreover, regulatory standards and quality certifications also influence market dynamics by ensuring product quality, safety, and compliance. As the 3D printing metals market matures, regulatory bodies are increasingly establishing standards and guidelines to govern the production, testing, and certification of additive manufactured parts. Adherence to these standards not only instills confidence in end-users but also facilitates market growth by addressing concerns related to quality and reliability.

    Furthermore, the emergence of new application areas and industry verticals presents opportunities for market expansion. While aerospace and healthcare have been early adopters of 3D printing metals, other sectors such as construction, energy, and electronics are increasingly exploring the potential of additive manufacturing for metal parts production. This diversification of applications broadens the market base and reduces dependency on specific industries, thereby enhancing the resilience of the 3D printing metals market.

    Author
    Anshula Mandaokar
    Team Lead - Research

    Anshula Mandaokar holds an academic degree in Chemical Engineering and has been contributing to the field for more than 5 years. She has expertise in Market Research and Business Consulting and serves as a Team Lead for a reputed Market Research firm under the Chemicals and Materials domain spectrum. She has worked on multiple projects, generating explicit results in a quick turnaround time. Her understanding of data interpretation justifies her role as a leader.

    Leave a Comment

    FAQs

    How big is the 3D Printing Metals market?

    3D Printing Metal Market crossed a valuation of USD 3.09 Billion in 2024

    What is the growth rate of the 3D Printing Metals market?

    3D Printing Metal Market is projected to register a CAGR of 31% from 2025-2035

    Which region held the largest market share in the 3D Printing Metals market?

    Asia Pacific had the largest share in the 3D Printing Metals Market.

    Who are the key players in the 3D Printing Metals market?

    The key players in the market are Voxeljet AG, Renishaw plc, 3D Systems, Inc, GKN Aerospace, CRS Holdings Inc (Carpenter Technology Corporation), Triditive, Incus, Materialise, Concept Laser GmbH, Optomec, Inc. SLM Solutions.

    Which material led the 3D Printing Metals market?

    The titanium category dominated the market in 2024.

    Which application had the largest market share in the market?

    Aerospace & defense had the largest share in the global market for 3D Printing Metals.

    Market Summary

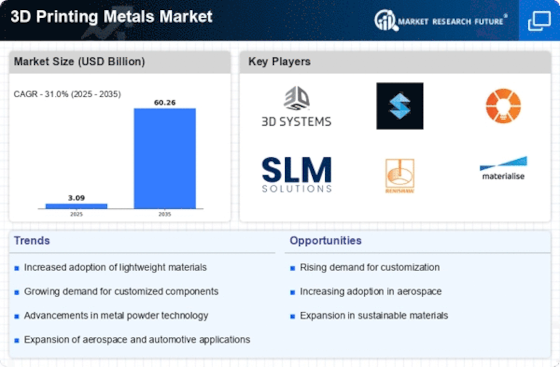
    As per MRFR analysis, the 3D Printing Metals Market was estimated at 3.09 USD Billion in 2024. The 3D Printing Metals industry is projected to grow from 4.048 USD Billion in 2025 to 60.26 USD Billion by 2035, exhibiting a compound annual growth rate (CAGR) of 31.0 during the forecast period 2025 - 2035.

    Key Market Trends & Highlights

    The 3D Printing Metals Market is poised for substantial growth driven by technological advancements and increasing customization demands.

    • The market experiences increased adoption in aerospace and defense sectors, particularly in North America.
    • Sustainability and eco-friendly practices are becoming integral to 3D printing metal processes, especially in the Asia-Pacific region.
    • Titanium remains the largest segment, while aluminum is rapidly gaining traction as the fastest-growing material.
    • Technological advancements and rising demand for customization are key drivers propelling market expansion.

    Market Size & Forecast

    2024 Market Size 3.09 (USD Billion)
    2035 Market Size 60.26 (USD Billion)
    CAGR (2025 - 2035) 31.0%
    Largest Regional Market Share in 2024 Asia Pacific

    Major Players

    <p>3D Systems (US), Stratasys (US), EOS (DE), SLM Solutions (DE), Renishaw (GB), Materialise (BE), Desktop Metal (US), GE Additive (US), HP (US)</p>

    Market Trends

    The 3D Printing Metals Market is currently experiencing a transformative phase, characterized by rapid advancements in technology and increasing adoption across various industries. This market encompasses a diverse range of applications, including aerospace, automotive, and medical sectors, where the demand for lightweight, durable, and complex components is on the rise. As manufacturers seek to enhance production efficiency and reduce material waste, the integration of additive manufacturing processes is becoming more prevalent. Furthermore, the growing emphasis on sustainability and environmental responsibility is driving innovations in metal printing techniques, which may lead to more eco-friendly practices in the future. In addition, the competitive landscape of the 3D Printing Metals Market is evolving, with numerous players striving to establish their presence through strategic partnerships and collaborations. Research and development efforts are intensifying, as companies aim to improve material properties and expand the range of metals suitable for printing. This dynamic environment suggests that the market will continue to grow, potentially leading to new applications and opportunities that have yet to be fully realized. As the technology matures, it appears that the 3D Printing Metals Market will play a crucial role in shaping the future of manufacturing and production processes across various sectors.

    Increased Adoption in Aerospace and Defense

    The aerospace and defense sectors are increasingly embracing 3D printing technologies for metal components. This trend is driven by the need for lightweight materials that can withstand extreme conditions while maintaining structural integrity. The ability to produce complex geometries that traditional manufacturing methods cannot achieve is particularly appealing in these industries.

    Sustainability and Eco-Friendly Practices

    There is a growing focus on sustainability within the 3D Printing Metals Market. Companies are exploring ways to minimize waste and reduce energy consumption during the printing process. Innovations in materials and techniques that promote recycling and the use of biodegradable substances are likely to gain traction as environmental concerns become more prominent.

    Expansion of Material Options

    The range of metals available for 3D printing is expanding, with ongoing research into new alloys and composites. This diversification allows for enhanced performance characteristics tailored to specific applications. As manufacturers continue to experiment with different materials, the potential for novel applications in various industries is likely to increase.

    <p>The ongoing advancements in additive manufacturing technologies are reshaping the landscape of metal production, enhancing design flexibility and reducing material waste, thereby fostering a more sustainable manufacturing ecosystem.</p>

    U.S. Department of Energy

    3D Printing Metal Market Market Drivers

    Rising Demand for Customization

    Customization is becoming a pivotal driver in the 3D Printing Metals Market. Industries are increasingly seeking tailored solutions to meet specific requirements, which traditional manufacturing methods often struggle to provide. The ability to produce bespoke metal parts on demand allows companies to respond swiftly to market changes and customer preferences. This trend is particularly evident in sectors like healthcare, where personalized implants and prosthetics are gaining traction. Market data indicates that the demand for customized metal components is expected to rise significantly, with projections suggesting a potential increase of 30% in the next five years. This shift towards customization not only enhances product offerings but also positions the 3D Printing Metals Market as a key player in the future of manufacturing.

    Cost Efficiency and Waste Reduction

    Cost efficiency and waste reduction are critical factors propelling the 3D Printing Metals Market forward. Traditional manufacturing processes often involve substantial material waste and high operational costs. In contrast, metal 3D printing allows for additive manufacturing, where materials are added layer by layer, significantly minimizing waste. This efficiency is particularly appealing to industries looking to optimize their production processes and reduce costs. Recent studies suggest that companies utilizing metal 3D printing can achieve up to 50% reduction in material waste compared to conventional methods. As businesses increasingly prioritize sustainability and cost-effectiveness, the 3D Printing Metals Market is likely to see a surge in adoption, further driving market growth.

    Technological Advancements in 3D Printing

    The 3D Printing Metals Market is experiencing rapid technological advancements that enhance the capabilities of metal 3D printing. Innovations in printing techniques, such as selective laser melting and electron beam melting, are improving the precision and efficiency of metal parts production. These advancements are likely to reduce production costs and lead times, making metal 3D printing more accessible to various sectors. According to recent data, the market for metal 3D printing is projected to grow at a compound annual growth rate of over 25% in the coming years. This growth is driven by the increasing demand for complex geometries and lightweight components, particularly in industries such as aerospace and automotive. As technology continues to evolve, the 3D Printing Metals Market is expected to witness further expansion and innovation.

    Growing Applications Across Various Industries

    The 3D Printing Metals Market is witnessing a surge in applications across diverse sectors, including aerospace, automotive, healthcare, and energy. Each of these industries is exploring the potential of metal 3D printing to enhance product performance and reduce manufacturing complexities. For instance, in aerospace, the ability to produce lightweight components with intricate designs is revolutionizing aircraft manufacturing. Market analysis shows that the aerospace sector alone is expected to account for a significant share of the metal 3D printing market, with projections indicating a growth rate of over 20% in the coming years. As more industries recognize the advantages of metal 3D printing, the 3D Printing Metals Market is likely to expand its reach and influence.

    Increased Investment in Research and Development

    Investment in research and development is a crucial driver for the 3D Printing Metals Market. Companies and research institutions are allocating significant resources to explore new materials, improve printing technologies, and enhance the overall performance of metal 3D printing. This focus on R&D is expected to yield innovative solutions that address current limitations in the industry, such as material properties and production speed. Data indicates that R&D spending in the metal 3D printing sector has increased by approximately 20% over the past few years, reflecting a strong commitment to advancing the technology. As breakthroughs emerge from these investments, the 3D Printing Metals Market is poised for substantial growth and transformation.

    Market Segment Insights

    By Material: Titanium (Largest) vs. Aluminum (Fastest-Growing)

    <p>In the 3D Printing Metals Market, the material segment displays a diverse distribution, with Titanium leading as the largest share contributor thanks to its exceptional strength-to-weight ratio and corrosion resistance. Aluminum follows closely, supported by its lightweight characteristics and suitability for various applications, positioning it as a compelling choice for rapid manufacturing needs. Stainless Steel, Nickel, and Inconel also hold significant roles, albeit with smaller shares, appealing to specific industrial applications and advanced manufacturing technologies.</p>

    <p>Material: Titanium (Dominant) vs. Aluminum (Emerging)</p>

    <p>Titanium holds a dominant position in the 3D Printing Metals Market due to its remarkable mechanical properties, making it ideal for high-performance applications, particularly in aerospace and biomedical sectors. This material is renowned for its high strength, low density, and superior biocompatibility. On the other hand, Aluminum is emerging rapidly in the market supported by its exceptional machinability and favorable cost-performance ratio. Its growing use in automotive and lightweight component applications signifies an exciting shift, driven by the demand for efficient production techniques and sustainable manufacturing practices, marking its transition from a secondary choice to a competitive option.</p>

    By Technology: Material Extrusion (Largest) vs. Binder Jetting (Fastest-Growing)

    <p>In the 3D Printing Metals Market, Material Extrusion continues to capture the largest share, standing out due to its widespread adoption across various industries. With its ability to efficiently produce complex geometries and the availability of a wide range of materials, this technology demonstrates significant market penetration. Meanwhile, Binder Jetting is recognized for its rapid growth, particularly in sectors where speed and cost-effectiveness are critical. Its adaptable nature allows for the use of various metal powders, making it an attractive choice for manufacturers aiming for faster production cycles.</p>

    <p>Technology: Material Extrusion (Dominant) vs. Binder Jetting (Emerging)</p>

    <p>Material Extrusion reigns supreme in the 3D Printing Metals Market, characterized by its ability to create detailed components with high precision and versatility. Companies across industries favor this technology for its compatibility with numerous materials and straightforward process. Conversely, Binder Jetting is emerging as a notable contender, appreciated for its rapid prototyping capabilities and lower production costs. This technology excels in applications where large volumes of parts are needed in a shorter timeframe, pushing companies to explore its potential despite the challenges related to post-processing and material limitations.</p>

    By Application: Aerospace & Defense (Largest) vs. Healthcare (Fastest-Growing)

    <p>In the 3D Printing Metals Market, the application segment is primarily dominated by Aerospace & Defense, which holds a significant share due to the industry's reliance on advanced manufacturing techniques to produce lightweight yet durable components. This segment has shown stable growth driven by investments in military technology upgrades and the increasing demand for precision parts that 3D printing can offer. Healthcare follows closely with a rapidly increasing presence, as advancements in medical implants and bio-printing technologies present vast opportunities in this sector. Currently, the Healthcare application is witnessing the fastest growth in the 3D Printing Metals Market, owing to the need for customized solutions in medical devices and implants. Factors driving this expansion include the rapid development of personalized medicine and surgical tools that enhance patient outcomes. The push towards industry 4.0, focusing on in-house manufacturing and supply chain efficiencies, is further accelerating adoption across sectors, making Healthcare a significant growth driver within the application segment.</p>

    <p>Aerospace & Defense: Dominant vs. Healthcare: Emerging</p>

    <p>Aerospace & Defense is characterized by its robust demand for high-performance materials that can withstand extreme conditions, making it the dominant application in the 3D Printing Metals Market. The sector leverages advanced 3D printing technology to create components for aircraft, missiles, and other critical defense systems where precision and reliability are paramount. On the other side, the Healthcare application is an emerging segment, revolutionized by innovations in implant technology and customized surgical tools. This segment is rapidly evolving as hospitals and clinics increasingly adopt 3D printing for bespoke solutions, enhancing surgical outcomes with tailored implants. As such, while Aerospace & Defense commands the market today, Healthcare's dynamic growth reflects an exciting shift towards personalized medical solutions.</p>

    Get more detailed insights about 3D Printing Metals Market Research Report - Global Forecast till 2032

    Regional Insights

    By region, the study provides market insights into North America, Europe, Asia-Pacific, and the Rest of the World. The Asia-Pacific region is expected to lead the global market for 3D printing metals in the coming years, driven by factors such as increasing industrialization, rising demand for 3D printing metals from various end-use industries, and supportive government initiatives. Countries such as China, Japan, and South Korea have been at the forefront of adopting 3D printing technology, and they are likely to continue to be major contributors to the growth of the 3D printing metals market in the region.

    These countries have large manufacturing industries and are investing heavily in research and development to advance their capabilities in 3D printing. In addition, the healthcare industry in the Asia-Pacific region is also expected to be a major driver of growth in the 3D printing metals market. The region has a large population, and there is a growing demand for customized medical implants and prosthetics. 3D printing metals offer the ability to produce these products with greater precision and customization, leading to better patient outcomes.

    Further, the major countries studied in the market report are The U.S., Canada, Germany, France, the UK, Italy, Spain, China, Japan, India, Australia, South Korea, and Brazil

    Figure 3:  3D PRINTING METALS MARKET SHARE BY REGION 2023 (%)3D PRINTING METALS MARKET SHARE BY REGION

    Source: Secondary Research, Primary Research, Market Research Future Database and Analyst Review

    Europe’s 3D Printing Metals market accounts for the third-largest market share. The region has a well-established manufacturing industry, with several leading companies in the aerospace, automotive, and healthcare sectors. The aerospace industry, in particular, has been a major driver of growth in the 3D printing metals market in Europe, with several companies using the technology to produce lightweight and complex components for aircraft. In addition, the European Union has been investing heavily in research and development in the 3D printing industry, with several initiatives aimed at advancing the technology and promoting its adoption in various industries.

    The region has also been at the forefront of developing new 3D printing materials and techniques, which has helped to drive innovation in the industry. Further, the Germany 3D Printing Metals market held the largest market share, and the UK 3D Printing Metals market was the fastest-growing market in the European region.

    North America, 3D Printing Metals market, is expected to grow at the fastest CAGR from 2023 to 2030. The region has a strong aerospace and defense industry, which has been a major driver of growth in the 3D printing metals market. In addition, the healthcare and automotive industries in North America have also shown significant potential for growth in the use of 3D printing metals. Moreover, the U.S. 3D Printing Metals market held the largest market share, and the Canada 3D Printing Metals market was the fastest-growing market in the North American region.

    Key Players and Competitive Insights

    Major market players are spending a lot of money on R&D to increase their product lines, which will help the 3D Printing Metals market grow even more. Market participants are also taking a range of strategic initiatives to grow their worldwide footprint, with key market developments such as new product launches, contractual agreements, mergers and acquisitions, increased investments, and collaboration with other organizations. Competitors in the 3D Printing Metals industry must offer cost-effective items to expand and survive in an increasingly competitive and rising market environment.

    The major market players are investing a lot of money in R&D to expand their product lines, which will spur further market growth for 3D Printing Metals. With significant market development like new product releases, contractual agreements, mergers and acquisitions, increased investments, and collaboration with other organizations, market participants are also undertaking various strategic activities to expand their global presence. To grow and thrive in a market climate that is becoming more competitive and growing, competitors in the 3D Printing Metals industry must offer affordable products.

    Manufacturing locally to cut operating costs is one of the main business tactics manufacturers use in the global 3D Printing Metals industry to benefit customers and expand the market sector. Major 3D Printing Metals market players, including Voxeljet AG, Renishaw plc, 3D Systems, Inc, GKN Aerospace,  CRS Holdings Inc (Carpenter Technology Corporation), Triditive, Incus, Materialise, Concept Laser GmbH, Optomec, Inc. SLM Solutions, and others, are attempting to increase market demand by funding R&D initiatives.

    Voxeljet AG is a German company that specializes in the production and sale of 3D printing systems and services. Voxeljet's primary focus is on the development and production of large-scale 3D printing systems for industrial applications, with a particular emphasis on the production of sand-casting molds and cores for automotive, aerospace, and other industries. The company also provides 3D printing services, including prototyping and production of parts for its customers. Voxeljet's 3D printing systems are based on binder jetting technology, which involves selectively depositing a binder material onto a bed of powder, layer by layer, to create a solid object.

    The company's systems are capable of producing parts with a high degree of accuracy and detail, as well as large-scale objects up to several meters in size.

    Renishaw is a UK-based global company that specializes in the production and sale of high-precision metrology and additive manufacturing (3D printing) systems. Renishaw's core business is in metrology, where it develops and produces precision measurement and control equipment used in industries such as aerospace, automotive, medical, and electronics. The company's products include coordinate measuring machines (CMMs), laser measurement systems, encoders, and calibration equipment. Renishaw's metrology products are used to measure and control critical dimensions and geometries in manufacturing processes, ensuring high quality and accuracy.

    In addition to its metrology business, Renishaw has also developed advanced additive manufacturing (3D printing) technology, which it markets under the brand name "RenAM." The company's metal 3D printing systems use a powder bed fusion technique to produce high-quality, complex metal parts for a variety of industries, including aerospace, medical, and industrial automation. Renishaw's 3D printing systems are known for their high precision and reliability, and the company has developed a range of software solutions to support the design and production of parts. Renishaw also offers a range of metal powders for use in its 3D printing systems.

    Key Companies in the 3D Printing Metal Market market include

    Industry Developments

    June 2023: Norsk Titanium, a leading provider of additive manufacturing solutions for the aerospace and defense industries, announced the opening of its new production facility in Norway. The new facility will be used to produce titanium parts for a variety of applications, including aircraft engines, landing gear, and structural components.

    May 2023: GE Additive, a subsidiary of General Electric, announced the launch of its new GE Additive Binder Jetting 3D printing technology. The Binder Jetting technology is a powder bed fusion process that is used to create metal parts with high accuracy and surface finish.

    April 2023: ExOne, a leading provider of industrial 3D printers, announces the launch of its new InnovateAM metal 3D printing system. This system boasts incre 

    September 2023: Nexa3D, famous for its ultrafast polymer 3D printing technology, is attempting into the metal additive manufacturing field by incorporating Headmade Materials' extraordinary technology with its fast-cycle QLS SLS 3D printers, paving the way for better metal part production. The agreement here is how Nexa3D's deliberate collaboration with Headmade Materials will use its 3D printing know-how, allowing the production of high-performance metal components with unprecedented efficiency and precision. The partnership announcement states that Nexa3D joins the metal 3D printing world through ColdMetalFusion, flourishing its SLS capacities.

    Developing on its earlier acquisition of XYZ's SLS technology, Nexa3D has now expanded its capabilities in metal additive production under the new collaboration with Headmade Materials. The deliberate partnership allows Nexa3D customers to harness the ColdMetalFusion ecosystem's merits, with the organization focusing on repeatability, speed, and precision. Nexa3D has a history of continually thrusting the 3D printing envelope; the company's engineering team was impressed with the company's XiP 3D printer. It will be willing to see how the organization displays its commitment to additive production excellence during Formnext in November.

    Future Outlook

    3D Printing Metal Market Future Outlook

    <p>The 3D Printing Metals Market is projected to grow at a 31.0% CAGR from 2024 to 2035, driven by advancements in technology, increased adoption across industries, and rising demand for customized solutions.</p>

    New opportunities lie in:

    • <p>Development of specialized metal powders for niche applications.</p>
    • <p>Integration of AI-driven design software for optimized printing processes.</p>
    • <p>Expansion of service-based models for on-demand metal printing solutions.</p>

    <p>By 2035, the market is expected to be robust, reflecting substantial growth and innovation.</p>

    Market Segmentation

    3D Printing Metal Market Material Outlook

    • Titanium
    • Aluminum
    • Stainless Steel
    • Nickel
    • Inconel
    • Others

    3D Printing Metal Market Technology Outlook

    • Vat Photopolymerization
    • Material Extrusion
    • Sheet Lamination
    • Binder Jetting
    • Material Jetting
    • Others

    3D Printing Metal Market Application Outlook

    • Aerospace & Defense
    • Automotive
    • Healthcare
    • Building & Construction
    • Consumer Electronics
    • Others

    Report Scope

    MARKET SIZE 20243.09(USD Billion)
    MARKET SIZE 20254.048(USD Billion)
    MARKET SIZE 203560.26(USD Billion)
    COMPOUND ANNUAL GROWTH RATE (CAGR)31.0% (2024 - 2035)
    REPORT COVERAGERevenue Forecast, Competitive Landscape, Growth Factors, and Trends
    BASE YEAR2024
    Market Forecast Period2025 - 2035
    Historical Data2019 - 2024
    Market Forecast UnitsUSD Billion
    Key Companies ProfiledMarket analysis in progress
    Segments CoveredMarket segmentation analysis in progress
    Key Market OpportunitiesAdvancements in metal alloys and processes enhance customization in the 3D Printing Metals Market.
    Key Market DynamicsTechnological advancements and regulatory changes drive innovation and competition in the 3D printing metals sector.
    Countries CoveredNorth America, Europe, APAC, South America, MEA

    FAQs

    How big is the 3D Printing Metals market?

    3D Printing Metal Market crossed a valuation of USD 3.09 Billion in 2024

    What is the growth rate of the 3D Printing Metals market?

    3D Printing Metal Market is projected to register a CAGR of 31% from 2025-2035

    Which region held the largest market share in the 3D Printing Metals market?

    Asia Pacific had the largest share in the 3D Printing Metals Market.

    Who are the key players in the 3D Printing Metals market?

    The key players in the market are Voxeljet AG, Renishaw plc, 3D Systems, Inc, GKN Aerospace, CRS Holdings Inc (Carpenter Technology Corporation), Triditive, Incus, Materialise, Concept Laser GmbH, Optomec, Inc. SLM Solutions.

    Which material led the 3D Printing Metals market?

    The titanium category dominated the market in 2024.

    Which application had the largest market share in the market?

    Aerospace &amp; defense had the largest share in the global market for 3D Printing Metals.

    1. Executive Summary
      1. \r\n
      2. Market Attractiveness Analysis 22
        1. Global 3D Printing Metal Market, By Material 22
        2. Global 3D Printing Metal Market, By Form 23
        3. Global 3D Printing Metal Market, By Technology 24
        4. Global 3D Printing Metal Market, By Application 25
      3. \r\n
      4. \r\n
      5. \r\n
      6. \r\n
      7. \r\n
    2. Market Introduction
      1. \r\n
      2. Definition 26
      3. \r\n
      4. Scope of the Study 26
      5. \r\n
      6. List of Assumptions 27
      7. \r\n
      8. Market Structure 27
      9. \r\n
      10. Key Takeaways 28
      11. \r\n
      12. Key Buying Criteria 28
      13. \r\n
    3. Market Insights
      1. \r\n
    4. Research Methodology
      1. \r\n
      2. Research Process 32
      3. \r\n
      4. Primary Research 33
      5. \r\n
      6. Secondary Research 33
      7. \r\n
      8. Market Size Estimation 34
      9. \r\n
      10. Forecast Model 35
      11. \r\n
    5. Market Dynamics
      1. \r\n
      2. Introduction 36
      3. \r\n
      4. Drivers 37
        1. Increasing Demand in the Aerospace and Automotive Industries 37
        2. Increasing Application in the Healthcare Industry 39
        3. Drivers Impact Analysis 40
      5. \r\n
      6. \r\n
      7. \r\n
      8. \r\n
      9. Restraints 40
        1. High Material Cost 40
        2. Restraints Impact Analysis 41
      10. \r\n
      11. \r\n
      12. \r\n
      13. Opportunities 41
        1. Growth Avenues in the Manufacturing Sector 41
      14. \r\n
      15. \r\n
      16. Challenge 41
        1. Quality Assurance in 3D Printing 41
      17. \r\n
      18. \r\n
    6. Market Factor Analysis
      1. \r\n
      2. Supply Chain Analysis 42
        1. Raw Materials Suppliers 42
        2. 3D Printing Metal Producers 43
        3. Distribution Channel 43
        4. End-Use Industries 43
      3. \r\n
      4. \r\n
      5. \r\n
      6. \r\n
      7. \r\n
      8. Porter’s Five Forces Model 43
        1. Threat of New Entrants 44
        2. Intensity of Competitive Rivalry 44
        3. Threat of Substitutes 45
        4. Bargaining Power of Suppliers 45
        5. Bargaining Power of Buyers 45
      9. \r\n
      10. \r\n
      11. \r\n
      12. \r\n
      13. \r\n
      14. \r\n
    7. Global 3D Printing Metal Market, by Material
      1. \r\n
      2. Introduction 46
      3. \r\n
      4. Titanium 48
      5. \r\n
      6. Aluminum 49
      7. \r\n
      8. Stainless Steel 50
      9. \r\n
      10. Nickel 51
      11. \r\n
      12. Inconel 52
      13. \r\n
      14. Others 53
      15. \r\n
    8. Global 3D Printing Metal Market, by Form
      1. \r\n
      2. Introduction 55
      3. \r\n
      4. Powder 56
      5. \r\n
      6. Filament 58
      7. \r\n
    9. Global 3D Printing Metal Market, Form by Technology
      1. \r\n
      2. Introduction 59
      3. \r\n
      4. Vat Photopolymerization 61
      5. \r\n
      6. Material Extrusion 62
      7. \r\n
      8. Sheet Lamination 63
      9. \r\n
      10. Binder Jetting 64
      11. \r\n
      12. Material Jetting 65
      13. \r\n
      14. Others 66
      15. \r\n
    10. Global 3D Printing Metal Market, by Application
      1. \r\n
      2. Introduction 67
      3. \r\n
      4. Aerospace & Defense 69
      5. \r\n
      6. Automotive 70
      7. \r\n
      8. Healthcare 71
      9. \r\n
      10. Building & Construction 72
      11. \r\n
      12. Consumer Electronics 73
      13. \r\n
      14. Others 74
      15. \r\n
    11. Global 3D Printing Metal Market, by Region
      1. \r\n
      2. Introduction 75
      3. \r\n
      4. North America 80
        1. US 85
        2. Canada 88
      5. \r\n
      6. \r\n
      7. \r\n
      8. Europe 92
        1. Germany 97
        2. UK 100
        3. Russia 104
        4. France 108
        5. Spain 111
        6. Italy 115
        7. Poland 118
        8. Belgium 122
        9. The Netherland 126
        10. Rest of Europe 130
      9. \r\n
      10. \r\n
      11. \r\n
      12. \r\n
      13. \r\n
      14. \r\n
      15. \r\n
      16. \r\n
      17. \r\n
      18. \r\n
      19. \r\n
      20. Asia-Pacific 133
        1. China 138
        2. Japan 142
        3. India 145
        4. Australia & New Zealand 149
        5. South Korea 152
        6. Thailand 156
        7. Indonesia 159
        8. Malaysia 163
        9. Rest of Asia Pacific 167
        10. Latin America 170
        11. Brazil 175
        12. Argentina 178
        13. Mexico 182
        14. Rest of Latin America 186
      21. \r\n
      22. \r\n
      23. \r\n
      24. \r\n
      25. \r\n
      26. \r\n
      27. \r\n
      28. \r\n
      29. \r\n
      30. \r\n
      31. \r\n
      32. \r\n
      33. \r\n
      34. \r\n
      35. \r\n
      36. Middle East & Africa 189
        1. Turkey 194
        2. Saudi Arabia 197
        3. UAE 201
        4. Egypt 205
        5. Rest of Middle East & Africa 208
      37. \r\n
      38. \r\n
      39. \r\n
      40. \r\n
      41. \r\n
      42. \r\n
    12. Competitive Landscape
      1. \r\n
      2. Introduction 212
      3. \r\n
      4. Market Strategy Analysis 212
      5. \r\n
    13. Company Profiles
      1. \r\n
      2. Renishaw plc 214
        1. Company Overview 214
        2. Financial Overview 214
        3. PRODUCT OFFERINGS 215
        4. Key Developments 215
        5. SWOT Analysis 216
        6. Key Strategies 216
      3. \r\n
      4. \r\n
      5. \r\n
      6. \r\n
      7. \r\n
      8. \r\n
      9. \r\n
      10. voxeljet AG 217
        1. Company Overview 217
        2. Financial Overview 217
        3. PRODUCT OFFERINGS 218
        4. Key Developments 218
        5. SWOT Analysis 218
        6. Key Strategies 219
      11. \r\n
      12. \r\n
      13. \r\n
      14. \r\n
      15. \r\n
      16. \r\n
      17. \r\n
      18. 3D Systems, Inc 220
        1. Company Overview 220
        2. Financial Overview 220
        3. PRODUCT OFFERINGS 221
        4. Key Developments 221
        5. SWOT Analysis 221
        6. Key Strategies 221
      19. \r\n
      20. \r\n
      21. \r\n
      22. \r\n
      23. \r\n
      24. \r\n
      25. \r\n
      26. CRS Holdings Inc (Carpenter Technology Corporation) 222
        1. Company Overview 222
        2. Financial Overview 222
        3. PRODUCT OFFERINGS 223
        4. Key Developments 223
        5. SWOT Analysis 223
        6. Key Strategies 223
      27. \r\n
      28. \r\n
      29. \r\n
      30. \r\n
      31. \r\n
      32. \r\n
      33. \r\n
      34. GKN Aerospace 224
        1. Company Overview 224
        2. Financial Overview 224
        3. PRODUCT OFFERINGS 225
        4. Key Developments 225
        5. SWOT Analysis 226
        6. Key Strategies 226
      35. \r\n
      36. \r\n
      37. \r\n
      38. \r\n
      39. \r\n
      40. \r\n
      41. \r\n
      42. EOS GmbH 227
        1. Company Overview 227
        2. Financial Overview 227
        3. Product Offerings 227
        4. Key Developments 227
        5. SWOT Analysis 228
        6. Key Strategies 228
      43. \r\n
      44. \r\n
      45. \r\n
      46. \r\n
      47. \r\n
      48. \r\n
      49. \r\n
      50. Sandvik AB 229
        1. Company Overview 229
        2. Financial Overview 229
        3. Product Offerings 230
        4. Key Developments 230
        5. SWOT Analysis 230
        6. Key Strategies 230
      51. \r\n
      52. \r\n
      53. \r\n
      54. \r\n
      55. \r\n
      56. \r\n
      57. \r\n
      58. SLM Solutions 231
        1. Company Overview 231
        2. Financial Overview 231
        3. Product Offerings 232
        4. Key Developments 232
        5. SWOT Analysis 232
        6. Key Strategies 232
      59. \r\n
      60. \r\n
      61. \r\n
      62. \r\n
      63. \r\n
      64. \r\n
      65. \r\n
      66. Materialise 233
        1. Company Overview 233
        2. Financial Overview 233
        3. Products Offered 234
        4. Key Developments 234
        5. SWOT Analysis 234
        6. Key Strategies 234
      67. \r\n
      68. \r\n
      69. \r\n
      70. \r\n
      71. \r\n
      72. \r\n
      73. \r\n
      74. Concept Laser GmbH 235
        1. Company Overview 235
        2. Financial Overview 235
        3. Products Offered 235
        4. Key Developments 235
        5. SWOT Analysis 236
        6. Key Strategies 236
      75. \r\n
      76. \r\n
      77. \r\n
      78. \r\n
      79. \r\n
      80. \r\n
      81. \r\n
      82. Optomec, Inc 237
        1. Company Overview 237
        2. Financial Overview 237
        3. Product Offerings 237
        4. Key Developments 237
        5. SWOT Analysis 237
        6. Key Strategies 238
      83. \r\n
      84. \r\n
      85. \r\n
      86. \r\n
      87. \r\n
      88. \r\n
      89. \r\n
    14. Conclusion
      1. \r\n
      2. Key Findings 239
      3. \r\n
    15. List of Tables
      1. \r\n
    16. MARKET SYNOPSIS 21
      1. \r\n
    17. LIST OF ASSUMPTIONS 27
      1. \r\n
    18. GLOBAL 3D PRINTING METAL MARKET, BY MATERIAL, 2023-2030 (USD MILLION) 47
      1. \r\n
    19. GLOBAL 3D PRINTING METAL MARKET, BY MATERIAL, 2023-2030 (TONS) 48
      1. \r\n
    20. TITANIUM: GLOBAL 3D PRINTING METAL MARKET, BY REGION, 2023-2030 (USD MILLION) 48
      1. \r\n
    21. TITANIUM: GLOBAL 3D PRINTING METAL MARKET, BY REGION, 2023-2030 (TONS) 49
      1. \r\n
    22. ALUMINUM: GLOBAL 3D PRINTING METAL MARKET, BY REGION, 2023-2030 (USD MILLION) 49
      1. \r\n
    23. ALUMINUM: GLOBAL 3D PRINTING METAL MARKET, BY REGION, 2023-2030 (TONS) 50
      1. \r\n
    24. STAINLESS STEEL: GLOBAL 3D PRINTING METAL MARKET, BY REGION, 2023-2030 (USD MILLION) 50
      1. \r\n
    25. STAINLESS STEEL: GLOBAL 3D PRINTING METAL MARKET, BY REGION, 2023-2030 (TONS) 51
      1. \r\n
    26. NICKEL: GLOBAL 3D PRINTING METAL MARKET, BY REGION, 2023-2030 (USD MILLION) 51
      1. \r\n
    27. NICKEL: GLOBAL 3D PRINTING METAL MARKET, BY REGION, 2023-2030 (TONS) 52
      1. \r\n
    28. INCONEL: GLOBAL 3D PRINTING METAL MARKET, BY REGION, 2023-2030 (USD MILLION) 52
      1. \r\n
    29. INCONEL: GLOBAL 3D PRINTING METAL MARKET, BY REGION, 2023-2030 (TONS) 53
      1. \r\n
    30. OTHERS: GLOBAL 3D PRINTING METAL MARKET, BY REGION, 2023-2030 (USD MILLION) 53
      1. \r\n
    31. OTHERS: GLOBAL 3D PRINTING METAL MARKET, BY REGION, 2023-2030 (TONS) 54
      1. \r\n
    32. GLOBAL 3D PRINTING METAL MARKET, BY FORM, 2023-2030 (USD MILLION) 55
      1. \r\n
    33. GLOBAL 3D PRINTING METAL MARKET, BY FORM, 2023-2030 (TONS) 56
      1. \r\n
    34. POWDER: GLOBAL 3D PRINTING METAL MARKET, BY REGION, 2023-2030 (USD MILLION) 57
      1. \r\n
    35. POWDER: GLOBAL 3D PRINTING METAL MARKET, BY REGION, 2023-2030 (TONS) 57
      1. \r\n
    36. FILAMENT: GLOBAL 3D PRINTING METAL MARKET, BY REGION, 2023-2030 (USD MILLION) 58
      1. \r\n
    37. FILAMENT: GLOBAL 3D PRINTING METAL MARKET, BY REGION, 2023-2030 (TONS) 58
      1. \r\n
    38. GLOBAL 3D PRINTING METAL MARKET, BY TECHNOLOGY, 2023-2030 (USD MILLION) 59
      1. \r\n
    39. GLOBAL 3D PRINTING METAL MARKET, BY TECHNOLOGY, 2023-2030 (TONS) 60
      1. \r\n
    40. VAT. PHOTOPOLYMERIZATION: GLOBAL 3D PRINTING METAL MARKET, BY REGION, 2023-2030 (USD MILLION) 61
      1. \r\n
    41. VAT. PHOTOPOLYMERIZATION: GLOBAL 3D PRINTING METAL MARKET, BY REGION, 2023-2030 (TONS) 61
      1. \r\n
    42. MATERIAL EXTRUSION: GLOBAL 3D PRINTING METAL MARKET, BY REGION, 2023-2030 (USD MILLION) 62
      1. \r\n
    43. MATERIAL EXTRUSION: GLOBAL 3D PRINTING METAL MARKET, BY REGION, 2023-2030 (TONS) 62
      1. \r\n
    44. SHEET LAMINATION: GLOBAL 3D PRINTING METAL MARKET, BY REGION, 2023-2030 (USD MILLION) 63
      1. \r\n
    45. SHEET LAMINATION: GLOBAL 3D PRINTING METAL MARKET, BY REGION, 2023-2030 (TONS) 63
      1. \r\n
    46. BINDER JETTING: GLOBAL 3D PRINTING METAL MARKET, BY REGION, 2023-2030 (USD MILLION) 64
      1. \r\n
    47. BINDER JETTING: GLOBAL 3D PRINTING METAL MARKET, BY REGION, 2023-2030 (TONS) 64
      1. \r\n
    48. MATERIAL JETTING: GLOBAL 3D PRINTING METAL MARKET, BY REGION, 2023-2030 (USD MILLION) 65
      1. \r\n
    49. MATERIAL JETTING: GLOBAL 3D PRINTING METAL MARKET, BY REGION, 2023-2030 (TONS) 65
      1. \r\n
    50. OTHERS: GLOBAL 3D PRINTING METAL MARKET, BY REGION, 2023-2030 (USD MILLION) 66
      1. \r\n
    51. OTHERS: GLOBAL 3D PRINTING METAL MARKET, BY REGION, 2023-2030 (TONS) 66
      1. \r\n
    52. GLOBAL 3D PRINTING METAL MARKET, BY APPLICATION, 2023-2030 (USD MILLION) 67
      1. \r\n
    53. GLOBAL 3D PRINTING METAL MARKET, BY APPLICATION, 2023-2030 (TONS) 68
      1. \r\n
    54. AEROSPACE & DEFENSE: GLOBAL 3D PRINTING METAL MARKET, BY REGION, 2023-2030 (USD MILLION) 69
      1. \r\n
    55. AEROSPACE & DEFENSE: GLOBAL 3D PRINTING METAL MARKET, BY REGION, 2023-2030 (TONS) 69
      1. \r\n
    56. AUTOMOTIVE: GLOBAL 3D PRINTING METAL MARKET, BY REGION, 2023-2030 (USD MILLION) 70
      1. \r\n
    57. AUTOMOTIVE: GLOBAL 3D PRINTING METAL MARKET, BY REGION, 2023-2030 (TONS) 70
      1. \r\n
    58. HEALTHCARE: GLOBAL 3D PRINTING METAL MARKET, BY REGION, 2023-2030 (USD MILLION) 71
      1. \r\n
    59. HEALTHCARE: GLOBAL 3D PRINTING METAL MARKET, BY REGION, 2023-2030 (TONS) 71
      1. \r\n
    60. BUILDING & CONSTRUCTION: GLOBAL 3D PRINTING METAL MARKET, BY REGION, 2023-2030 (USD MILLION) 72
      1. \r\n
    61. BUILDING & CONSTRUCTION: GLOBAL 3D PRINTING METAL MARKET, BY REGION, 2023-2030 (TONS) 72
      1. \r\n
    62. CONSUMER ELECTRONICS: GLOBAL 3D PRINTING METAL MARKET, BY REGION, 2023-2030 (USD MILLION) 73
      1. \r\n
    63. CONSUMER ELECTRONICS: GLOBAL 3D PRINTING METAL MARKET, BY REGION, 2023-2030 (TONS) 73
      1. \r\n
    64. OTHERS: GLOBAL 3D PRINTING METAL MARKET, BY REGION, 2023-2030 (USD MILLION) 74
      1. \r\n
    65. OTHERS: GLOBAL 3D PRINTING METAL MARKET, BY REGION, 2023-2030 (TONS) 74
      1. \r\n
    66. GLOBAL 3D PRINTING METAL MARKET, BY REGION, 2023-2030 (USD MILLION) 75
      1. \r\n
    67. GLOBAL 3D PRINTING METAL MARKET, BY REGION, 2023-2030 (TONS) 76
      1. \r\n
    68. GLOBAL 3D PRINTING METAL MARKET, BY MATERIAL, 2023-2030 (USD MILLION) 77
      1. \r\n
    69. GLOBAL 3D PRINTING METAL MARKET, BY MATERIAL, 2023-2030 (TONS) 77
      1. \r\n
    70. GLOBAL 3D PRINTING METAL MARKET, BY FORM, 2023-2030 (USD MILLION) 78
      1. \r\n
    71. GLOBAL 3D PRINTING METAL MARKET, BY FORM, 2023-2030 (TONS) 78
      1. \r\n
    72. GLOBAL 3D PRINTING METAL MARKET, BY APPLICATION, 2023-2030 (USD MILLION) 78
      1. \r\n
    73. GLOBAL 3D PRINTING METAL MARKET, BY APPLICATION, 2023-2030 (TONS) 79
      1. \r\n
    74. GLOBAL 3D PRINTING METAL MARKET, BY APPLICATION, 2023-2030 (USD MILLION) 79
      1. \r\n
    75. GLOBAL 3D PRINTING METAL MARKET, BY APPLICATION, 2023-2030 (TONS) 80
      1. \r\n
    76. NORTH AMERICA: 3D PRINTING METAL MARKET, BY COUNTRY, 2023-2030 (USD MILLION) 80
      1. \r\n
    77. NORTH AMERICA: 3D PRINTING METAL MARKET, BY COUNTRY, 2023-2030 (TONS) 81
      1. \r\n
    78. NORTH AMERICA: 3D PRINTING METAL MARKET, BY MATERIAL, 2023-2030 (USD MILLION) 81
      1. \r\n
    79. NORTH AMERICA: 3D PRINTING METAL MARKET, BY MATERIAL, 2023-2030 (TONS) 82
      1. \r\n
    80. NORTH AMERICA: 3D PRINTING METAL MARKET, BY FORM, 2023-2030 (USD MILLION) 82
      1. \r\n
    81. NORTH AMERICA: 3D PRINTING METAL MARKET, BY FORM, 2023-2030 (TONS) 82
      1. \r\n
    82. NORTH AMERICA: 3D PRINTING METAL MARKET, BY APPLICATION, 2023-2030 (USD MILLION) 83
      1. \r\n
    83. NORTH AMERICA: 3D PRINTING METAL MARKET, BY APPLICATION, 2023-2030 (TONS) 83
      1. \r\n
    84. NORTH AMERICA: 3D PRINTING METAL MARKET, BY APPLICATION, 2023-2030 (USD MILLION) 84
      1. \r\n
    85. NORTH AMERICA: 3D PRINTING METAL MARKET, BY APPLICATION, 2023-2030 (TONS) 84
      1. \r\n
    86. US: 3D PRINTING METAL MARKET, BY MATERIAL, 2023-2030 (USD MILLION) 85
      1. \r\n
    87. US: 3D PRINTING METAL MARKET, BY MATERIAL, 2023-2030 (TONS) 85
      1. \r\n
    88. US: 3D PRINTING METAL MARKET, BY FORM, 2023-2030 (USD MILLION) 86
      1. \r\n
    89. US: 3D PRINTING METAL MARKET, BY FORM, 2023-2030 (TONS) 86
      1. \r\n
    90. US: 3D PRINTING METAL MARKET, BY APPLICATION, 2023-2030 (TONS) 86
      1. \r\n
    91. US: 3D PRINTING METAL MARKET, BY APPLICATION, 2023-2030 (TONS) 87
      1. \r\n
    92. 3D PRINTING METAL MARKET, BY APPLICATION, 2023-2030 (TONS) 87
      1. \r\n
    93. US: 3D PRINTING METAL MARKET, BY APPLICATION, 2023-2030 (TONS) 88
      1. \r\n
    94. CANADA: 3D PRINTING METAL MARKET, BY MATERIAL, 2023-2030 (USD MILLION) 88
      1. \r\n
    95. CANADA: 3D PRINTING METAL MARKET, BY MATERIAL, 2023-2030 (TONS) 89
      1. \r\n
    96. CANADA: 3D PRINTING METAL MARKET, BY FORM, 2023-2030 (USD MILLION) 89
      1. \r\n
    97. CANADA: 3D PRINTING METAL MARKET, BY FORM, 2023-2030 (TONS) 89
      1. \r\n
    98. CANADA: 3D PRINTING METAL MARKET, BY APPLICATION, 2023-2030 (USD MILLION) 90
      1. \r\n
    99. CANADA: 3D PRINTING METAL MARKET, BY APPLICATION, 2023-2030 (TONS) 90
      1. \r\n
    100. CANADA: 3D PRINTING METAL MARKET, BY APPLICATION, 2023-2030 (USD MILLION) 91
      1. \r\n
    101. CANADA: 3D PRINTING METAL MARKET, BY APPLICATION, 2023-2030 (TONS) 91
      1. \r\n
    102. EUROPE: 3D PRINTING METAL MARKET, BY COUNTRY, 2023-2030 (USD MILLION) 92
      1. \r\n
    103. EUROPE: 3D PRINTING METAL MARKET, BY COUNTRY, 2023-2030 (TONS) 93
      1. \r\n
    104. EUROPE: 3D PRINTING METAL MARKET, BY MATERIAL, 2023-2030 (USD MILLION) 93
      1. \r\n
    105. EUROPE: 3D PRINTING METAL MARKET, BY MATERIAL, 2023-2030 (TONS) 94
      1. \r\n
    106. EUROPE: 3D PRINTING METAL MARKET, BY FORM, 2023-2030 (USD MILLION) 94
      1. \r\n
    107. EUROPE: 3D PRINTING METAL MARKET, BY FORM, 2023-2030 (USD MILLION) 94
      1. \r\n
    108. EUROPE: 3D PRINTING METAL MARKET, BY APPLICATION 2023-2030 (TONS) 95
      1. \r\n
    109. EUROPE: 3D PRINTING METAL MARKET, BY APPLICATION, 2023-2030 (TONS) 95
      1. \r\n
    110. EUROPE: 3D PRINTING METAL MARKET, BY APPLICATION 2023-2030 (TONS) 96
      1. \r\n
    111. EUROPE: 3D PRINTING METAL MARKET, BY APPLICATION, 2023-2030 (TONS) 96
      1. \r\n
    112. GERMANY: 3D PRINTING METAL MARKET, BY MATERIAL, 2023-2030 (USD MILLION) 97
      1. \r\n
    113. GERMANY: 3D PRINTING METAL MARKET, BY MATERIAL, 2023-2030 (TONS) 97
      1. \r\n
    114. GERMANY: 3D PRINTING METAL MARKET, BY FORM, 2023-2030 (USD MILLION) 98
      1. \r\n
    115. GERMANY: 3D PRINTING METAL MARKET, BY FORM, 2023-2030 (TONS) 98
      1. \r\n
    116. GERMANY: 3D PRINTING METAL MARKET, BY APPLICATION, 2023-2030 (USD MILLION) 98
      1. \r\n
    117. GERMANY: 3D PRINTING METAL MARKET, BY APPLICATION, 2023-2030 (TONS) 99
      1. \r\n
    118. GERMANY: 3D PRINTING METAL MARKET, BY APPLICATION, 2023-2030 (USD MILLION) 99
      1. \r\n
    119. GERMANY: 3D PRINTING METAL MARKET, BY APPLICATION, 2023-2030 (TONS) 100
      1. \r\n
    120. UK: 3D PRINTING METAL MARKET, BY MATERIAL, 2023-2030 (USD MILLION) 100
      1. \r\n
    121. UK: 3D PRINTING METAL MARKET, BY MATERIAL, 2023-2030 (TONS) 101
      1. \r\n
    122. UK: 3D PRINTING METAL MARKET, BY FORM, 2023-2030 (USD MILLION) 101
      1. \r\n
    123. UK: 3D PRINTING METAL MARKET, BY FORM, 2023-2030 (TONS) 102
      1. \r\n
    124. UK: 3D PRINTING METAL MARKET, BY APPLICATION, 2023-2030 (USD MILLION) 102
      1. \r\n
    125. UK: 3D PRINTING METAL MARKET, BY APPLICATION, 2023-2030 (TONS) 103
      1. \r\n
    126. UK: 3D PRINTING METAL MARKET, BY APPLICATION, 2023-2030 (USD MILLION) 103
      1. \r\n
    127. UK: 3D PRINTING METAL MARKET, BY APPLICATION, 2023-2030 (TONS) 104
      1. \r\n
    128. RUSSIA: 3D PRINTING METAL MARKET, BY MATERIAL, 2023-2030 (USD MILLION) 104
      1. \r\n
    129. RUSSIA: 3D PRINTING METAL MARKET, BY MATERIAL, 2023-2030 (TONS) 105
      1. \r\n
    130. RUSSIA: 3D PRINTING METAL MARKET, BY FORM, 2023-2030 (USD MILLION) 105
      1. \r\n
    131. RUSSIA: 3D PRINTING METAL MARKET, BY APPLICATION, 2023-2030 (USD MILLION) 106
      1. \r\n
    132. 3D PRINTING METAL MARKET, BY APPLICATION, 2023-2030 (TONS) 106
      1. \r\n
    133. 3D PRINTING METAL MARKET, BY APPLICATION, 2023-2030 (USD MILLION) 107
      1. \r\n
    134. 3D PRINTING METAL MARKET, BY APPLICATION, 2023-2030 (TONS) 107
      1. \r\n
    135. FRANCE: 3D PRINTING METAL MARKET, BY MATERIAL, 2023-2030 (USD MILLION) 108
      1. \r\n
    136. FRANCE: 3D PRINTING METAL MARKET, BY MATERIAL, 2023-2030 (TONS) 108
      1. \r\n
    137. FRANCE: 3D PRINTING METAL MARKET, BY FORM, 2023-2030 (USD MILLION) 109
      1. \r\n
    138. FRANCE: 3D PRINTING METAL MARKET, BY FORM, 2023-2030 (TONS) 109
      1. \r\n
    139. FRANCE: 3D PRINTING METAL MARKET, BY APPLICATION, 2023-2030 (USD MILLION) 109
      1. \r\n
    140. FRANCE: 3D PRINTING METAL MARKET, BY APPLICATION, 2023-2030 (TONS) 110
      1. \r\n
    141. 3D PRINTING METAL MARKET, BY APPLICATION, 2023-2030 (USD MILLION) 110
      1. \r\n
    142. FRANCE: 3D PRINTING METAL MARKET, BY APPLICATION, 2023-2030 (TONS) 111
      1. \r\n
    143. SPAIN: 3D PRINTING METAL MARKET, BY MATERIAL, 2023-2030 (USD MILLION) 111
      1. \r\n
    144. SPAIN: 3D PRINTING METAL MARKET, BY MATERIAL, 2023-2030 (TONS) 112
      1. \r\n
    145. SPAIN: 3D PRINTING METAL MARKET, BY FORM, 2023-2030 (USD MILLION) 112
      1. \r\n
    146. SPAIN: 3D PRINTING METAL MARKET, BY FORM, 2023-2030 (TONS) 112
      1. \r\n
    147. SPAIN: 3D PRINTING METAL MARKET, BY APPLICATION, 2023-2030 (USD MILLION) 113
      1. \r\n
    148. SPAIN: 3D PRINTING METAL MARKET, BY APPLICATION, 2023-2030 (TONS) 113
      1. \r\n
    149. 3D PRINTING METAL MARKET, BY APPLICATION, 2023-2030 (USD MILLION) 114
      1. \r\n
    150. SPAIN: 3D PRINTING METAL MARKET, BY APPLICATION, 2023-2030 (TONS) 114
      1. \r\n
    151. ITALY: 3D PRINTING METAL MARKET, BY MATERIAL, 2023-2030 (USD MILLION) 115
      1. \r\n
    152. ITALY: 3D PRINTING METAL MARKET, BY MATERIAL, 2023-2030 (TONS) 115
      1. \r\n
    153. ITALY: 3D PRINTING METAL MARKET, BY FORM, 2023-2030 (USD MILLION) 116
      1. \r\n
    154. ITALY: 3D PRINTING METAL MARKET, BY FORM, 2023-2030 (TONS) 116
      1. \r\n
    155. ITALY: 3D PRINTING METAL MARKET, BY APPLICATION, 2023-2030 (USD MILLION) 116
      1. \r\n
    156. ITALY: 3D PRINTING METAL MARKET, BY APPLICATION, 2023-2030 (TONS) 117
      1. \r\n
    157. : 3D PRINTING METAL MARKET, BY APPLICATION, 2023-2030 (USD MILLION) 117
      1. \r\n
    158. ITALY: 3D PRINTING METAL MARKET, BY APPLICATION, 2023-2030 (TONS) 118
      1. \r\n
    159. POLAND: 3D PRINTING METAL MARKET, BY MATERIAL, 2023-2030 (USD MILLION) 118
      1. \r\n
    160. POLAND: 3D PRINTING METAL MARKET, BY MATERIAL, 2023-2030 (TONS) 119
      1. \r\n
    161. POLAND: 3D PRINTING METAL MARKET, BY FORM, 2023-2030 (USD MILLION) 119
      1. \r\n
    162. POLAND: 3D PRINTING METAL MARKET, BY FORM, 2023-2030 (TONS) 120
      1. \r\n
    163. POLAND: 3D PRINTING METAL MARKET, BY APPLICATION, 2023-2030 (USD MILLION) 120
      1. \r\n
    164. POLAND: 3D PRINTING METAL MARKET, BY A APPLICATION, 2023-2030 (TONS) 121
      1. \r\n
    165. POLAND: 3D PRINTING METAL MARKET, BY APPLICATION, 2023-2030 (USD MILLION) 121
      1. \r\n
    166. POLAND: 3D PRINTING METAL MARKET, BY APPLICATION, 2023-2030 (TONS) 122
      1. \r\n
    167. BELGIUM: 3D PRINTING METAL MARKET, BY MATERIAL, 2023-2030 (USD MILLION) 122
      1. \r\n
    168. BELGIUM: 3D PRINTING METAL MARKET, BY MATERIAL, 2023-2030 (TONS) 123
      1. \r\n
    169. BELGIUM: 3D PRINTING METAL MARKET, BY FORM, 2023-2030 (USD MILLION) 123
      1. \r\n
    170. BELGIUM: 3D PRINTING METAL MARKET, BY FORM, 2023-2030 (TONS) 124
      1. \r\n
    171. BELGIUM: 3D PRINTING METAL MARKET, BY APPLICATION, 2023-2030 (USD MILLION) 124
      1. \r\n
    172. BELGIUM: 3D PRINTING METAL MARKET, BY A APPLICATION, 2023-2030 (TONS) 125
      1. \r\n
    173. BELGIUM: 3D PRINTING METAL MARKET, BY APPLICATION, 2023-2030 (USD MILLION) 125
      1. \r\n
    174. BELGIUM: 3D PRINTING METAL MARKET, BY A APPLICATION, 2023-2030 (TONS) 126
      1. \r\n
    175. THE NETHERLAND: 3D PRINTING METAL MARKET, BY MATERIAL, 2023-2030 (USD MILLION) 126
      1. \r\n
    176. THE NETHERLAND: 3D PRINTING METAL MARKET, BY MATERIAL, 2023-2030 (TONS) 127
      1. \r\n
    177. THE NETHERLAND: 3D PRINTING METAL MARKET, BY FORM, 2023-2030 (USD MILLION) 127
      1. \r\n
    178. THE NETHERLAND: 3D PRINTING METAL MARKET, BY FORM, 2023-2030 (TONS) 127
      1. \r\n
    179. THE NETHERLAND: 3D PRINTING METAL MARKET, BY APPLICATION, 2023-2030 (USD MILLION) 128
      1. \r\n
    180. THE NETHERLAND: 3D PRINTING METAL MARKET, BY A APPLICATION, 2023-2030 (TONS) 128
      1. \r\n
    181. THE NETHERLAND: 3D PRINTING METAL MARKET, BY A APPLICATION, 2023-2030 (TONS) 129
      1. \r\n
    182. THE NETHERLAND: 3D PRINTING METAL MARKET, BY MATERIAL, 2023-2030 (USD MILLION) 130
      1. \r\n
    183. THE NETHERLAND: 3D PRINTING METAL MARKET, BY MATERIAL, 2023-2030 (TONS) 130
      1. \r\n
    184. THE NETHERLAND: 3D PRINTING METAL MARKET, BY FORM, 2023-2030 (USD MILLION) 131
      1. \r\n
    185. THE NETHERLAND: 3D PRINTING METAL MARKET, BY FORM, 2023-2030 (TONS) 131
      1. \r\n
    186. THE NETHERLAND: 3D PRINTING METAL MARKET, BY APPLICATION, 2023-2030 (USD MILLION) 131
      1. \r\n
    187. THE NETHERLAND: 3D PRINTING METAL MARKET, BY A APPLICATION, 2023-2030 (TONS) 132
      1. \r\n
    188. THE NETHERLAND: 3D PRINTING METAL MARKET, BY APPLICATION, 2023-2030 (USD MILLION) 132
      1. \r\n
    189. THE NETHERLAND: 3D PRINTING METAL MARKET, BY A APPLICATION, 2023-2030 (TONS) 133
      1. \r\n
    190. ASIA-PACIFIC: 3D PRINTING METAL MARKET, BY COUNTRY, 2023-2030 (USD MILLION) 134
      1. \r\n
    191. ASIA-PACIFIC: 3D PRINTING METAL MARKET, BY COUNTRY, 2023-2030 (TONS) 134
      1. \r\n
    192. ASIA-PACIFIC: 3D PRINTING METAL MARKET, BY MATERIAL, 2023-2030 (USD MILLION) 135
      1. \r\n
    193. ASIA-PACIFIC:: 3D PRINTING METAL MARKET, BY MATERIAL, 2023-2030 (TONS) 135
      1. \r\n
    194. ASIA-PACIFIC: 3D PRINTING METAL MARKET, BY MATERIAL, 2023-2030 (USD MILLION) 136
      1. \r\n
    195. ASIA-PACIFIC: 3D PRINTING METAL MARKET, BY MATERIAL, 2023-2030 (TONS) 136
      1. \r\n
    196. ASIA-PACIFIC: 3D PRINTING METAL MARKET, BY FORM, 2023-2030 (USD MILLION) 136
      1. \r\n
    197. ASIA-PACIFIC: 3D PRINTING METAL MARKET, BY FORM, 2023-2030 (TONS) 137
      1. \r\n
    198. ASIA-PACIFIC: 3D PRINTING METAL MARKET, BY APPLICATION, 2023-2030 (USD MILLION) 137
      1. \r\n
    199. ASIA-PACIFIC: 3D PRINTING METAL MARKET, BY APPLICATION, 2023-2030 (TONS) 138
      1. \r\n
    200. CHINA: PRINTING METALS MARKET, BY MATERIAL, 2023-2030 (USD MILLION) 138
      1. \r\n
    201. CHINA: 3D PRINTING METAL MARKET, BY MATERIAL, 2023-2030 (TONS) 139
      1. \r\n
    202. CHINA: 3D PRINTING METAL MARKET, BY MATERIAL, 2023-2030 (USD MILLION) 139
      1. \r\n
    203. CHINA: 3D PRINTING METAL MARKET, BY MATERIAL, 2023-2030 (TONS) 139
      1. \r\n
    204. CHINA: 3D PRINTING METAL MARKET, BY FORM, 2023-2030 (USD MILLION) 140
      1. \r\n
    205. CHINA: 3D PRINTING METAL MARKET, BY FORM, 2023-2030 (TONS) 140
      1. \r\n
    206. CHINA: 3D PRINTING METAL MARKET, BY APPLICATION 2023-2030 (USD MILLION) 141
      1. \r\n
    207. CHINA: 3D PRINTING METAL MARKET, BY APPLICATION, 2023-2030 (TONS) 141
      1. \r\n
    208. JAPAN: PRINTING METALS MARKET, BY MATERIAL, 2023-2030 (USD MILLION) 142
      1. \r\n
    209. JAPAN: 3D PRINTING METAL MARKET, BY MATERIAL, 2023-2030 (TONS) 142
      1. \r\n
    210. JAPAN: 3D PRINTING METAL MARKET, BY MATERIAL, 2023-2030 (USD MILLION) 143
      1. \r\n
    211. JAPAN: 3D PRINTING METAL MARKET, BY MATERIAL, 2023-2030 (TONS) 143
      1. \r\n
    212. JAPAN: 3D PRINTING METAL MARKET, BY FORM, 2023-2030 (USD MILLION) 143
      1. \r\n
    213. JAPAN: 3D PRINTING METAL MARKET, BY FORM, 2023-2030 (TONS) 144
      1. \r\n
    214. JAPAN: 3D PRINTING METAL MARKET, BY APPLICATION, 2023-2030 (USD MILLION) 144
      1. \r\n
    215. JAPAN: 3D PRINTING METAL MARKET, BY APPLICATION, 2023-2030 (TONS) 145
      1. \r\n
    216. INDIA: PRINTING METALS MARKET, BY MATERIAL, 2023-2030 (USD MILLION) 145
      1. \r\n
    217. INDIA: 3D PRINTING METAL MARKET, BY MATERIAL, 2023-2030 (TONS) 146
      1. \r\n
    218. INDIA: 3D PRINTING METAL MARKET, BY MATERIAL, 2023-2030 (USD MILLION) 146
      1. \r\n
    219. INDIA: 3D PRINTING METAL MARKET, BY MATERIAL, 2023-2030 (TONS) 146
      1. \r\n
    220. INDIA: 3D PRINTING METAL MARKET, BY FORM, 2023-2030 (USD MILLION) 147
      1. \r\n
    221. INDIA: 3D PRINTING METAL MARKET, BY FORM, 2023-2030 (TONS) 147
      1. \r\n
    222. INDIA: 3D PRINTING METAL MARKET, BY APPLICATION, 2023-2030 (USD MILLION) 148
      1. \r\n
    223. INDIA: 3D PRINTING METAL MARKET, BY APPLICATION, 2023-2030 (TONS) 148
      1. \r\n
    224. AUSTRALIA & NEW ZEALAND: PRINTING METALS MARKET, BY MATERIAL, 2023-2030 (USD MILLION) 149
      1. \r\n
    225. AUSTRALIA & NEW ZEALAND: 3D PRINTING METAL MARKET, BY MATERIAL, 2023-2030 (TONS) 149
      1. \r\n
    226. AUSTRALIA & NEW ZEALAND: 3D PRINTING METAL MARKET, BY MATERIAL, 2023-2030 (USD MILLION) 150
      1. \r\n
    227. AUSTRALIA: 3D PRINTING METAL MARKET, BY MATERIAL, 2023-2030 (TONS) 150
      1. \r\n
    228. AUSTRALIA & NEW ZEALAND: 3D PRINTING METAL MARKET, BY FORM, 2023-2030 (USD MILLION) 150
      1. \r\n
    229. AUSTRALIA & NEW ZEALAND: 3D PRINTING METAL MARKET, BY FORM, 2023-2030 (TONS) 151
      1. \r\n
    230. AUSTRALIA & NEW ZEALAND: 3D PRINTING METAL MARKET, BY APPLICATION, 2023-2030 (USD MILLION) 151
      1. \r\n
    231. AUSTRALIA & NEW ZEALAND: 3D PRINTING METAL MARKET, BY APPLICATION, 2023-2030 (TONS) 152
      1. \r\n
    232. SOUTH KOREA: PRINTING METALS MARKET, BY MATERIAL, 2023-2030 (USD MILLION) 152
      1. \r\n
    233. SOUTH KOREA: 3D PRINTING METAL MARKET, BY MATERIAL, 2023-2030 (TONS) 153
      1. \r\n
    234. SOUTH KOREA: 3D PRINTING METAL MARKET, BY MATERIAL, 2023-2030 (USD MILLION) 153
      1. \r\n
    235. SOUTH KOREA: 3D PRINTING METAL MARKET, BY MATERIAL, 2023-2030 (TONS) 153
      1. \r\n
    236. SOUTH KOREA: 3D PRINTING METAL MARKET, BY FORM, 2023-2030 (USD MILLION) 154
      1. \r\n
    237. SOUTH KOREA: 3D PRINTING METAL MARKET, BY FORM, 2023-2030 (TONS) 154
      1. \r\n
    238. SOUTH KOREA: 3D PRINTING METAL MARKET, BY APPLICATION, 2023-2030 (USD MILLION) 155
      1. \r\n
    239. SOUTH KOREA: 3D PRINTING METAL MARKET, BY APPLICATION, 2023-2030 (TONS) 155
      1. \r\n
    240. THAILAND: 3DPRINTING METALS MARKET, BY MATERIAL, 2023-2030 (USD MILLION) 156
      1. \r\n
    241. THAILAND: 3D PRINTING METAL MARKET, BY MATERIAL, 2023-2030 (TONS) 156
      1. \r\n
    242. THAILAND: 3D PRINTING METAL MARKET, BY MATERIAL, 2023-2030 (USD MILLION) 157
      1. \r\n
    243. THAILAND: 3D PRINTING METAL MARKET, BY MATERIAL, 2023-2030 (TONS) 157
      1. \r\n
    244. THAILAND: 3D PRINTING METAL MARKET, BY FORM, 2023-2030 (USD MILLION) 157
      1. \r\n
    245. THAILAND: 3D PRINTING METAL MARKET, BY FORM, 2023-2030 (TONS) 158
      1. \r\n
    246. THAILAND: 3D PRINTING METAL MARKET, BY APPLICATION, 2023-2030 (USD MILLION) 158
      1. \r\n
    247. THAILAND: 3D PRINTING METAL MARKET, BY APPLICATION, 2023-2030 (TONS) 159
      1. \r\n
    248. INDONESIA: PRINTING METALS MARKET, BY MATERIAL, 2023-2030 (USD MILLION) 159
      1. \r\n
    249. INDONESIA: 3D PRINTING METAL MARKET, BY MATERIAL, 2023-2030 (TONS) 160
      1. \r\n
    250. INDONESIA: 3D PRINTING METAL MARKET, BY MATERIAL, 2023-2030 (USD MILLION) 160
      1. \r\n
    251. INDONESIA: 3D PRINTING METAL MARKET, BY MATERIAL, 2023-2030 (TONS) 161
      1. \r\n
    252. INDONESIA: 3D PRINTING METAL MARKET, BY FORM, 2023-2030 (USD MILLION) 161
      1. \r\n
    253. INDONESIA: 3D PRINTING METAL MARKET, BY FORM, 2023-2030 (TONS) 162
      1. \r\n
    254. INDONESIA: 3D PRINTING METAL MARKET, BY APPLICATION, 2023-2030 (USD MILLION) 162
      1. \r\n
    255. INDONESIA: 3D PRINTING METAL MARKET, BY APPLICATION, 2023-2030 (TONS) 163
      1. \r\n
    256. MALAYSIA: 3D PRINTING METAL MARKET, BY MATERIAL, 2023-2030 (USD MILLION) 163
      1. \r\n
    257. MALAYSIA: 3D PRINTING METAL MARKET, BY MATERIAL, 2023-2030 (TONS) 164
      1. \r\n
    258. MALAYSIA: 3D PRINTING METAL MARKET, BY MATERIAL, 2023-2030 (USD MILLION) 164
      1. \r\n
    259. MALAYSIA: 3D PRINTING METAL MARKET, BY MATERIAL, 2023-2030 (TONS) 164
      1. \r\n
    260. MALAYSIA: 3D PRINTING METAL MARKET, BY FORM, 2023-2030 (USD MILLION) 165
      1. \r\n
    261. MALAYSIA: 3D PRINTING METAL MARKET, BY FORM, 2023-2030 (TONS) 165
      1. \r\n
    262. MALAYSIA: 3D PRINTING METAL MARKET, BY FORM, 2023-2030 (USD MILLION) 166
      1. \r\n
    263. MALAYSIA: 3D PRINTING METAL MARKET, BY FORM, 2023-2030 (TONS) 166
      1. \r\n
    264. REST OF ASIA PACIFIC: 3D PRINTING METAL MARKET, BY MATERIAL, 2023-2030 (USD MILLION) 167
      1. \r\n
    265. REST OF ASIA PACIFIC: 3D PRINTING METAL MARKET, BY MATERIAL, 2023-2030 (TONS) 167
      1. \r\n
    266. REST OF ASIA-PACIFIC: 3D PRINTING METAL MARKET, BY MATERIAL, 2023-2030 (USD MILLION) 168
      1. \r\n
    267. REST OF ASIA-PACIFIC: 3D PRINTING METAL MARKET, BY MATERIAL, 2023-2030 (TONS) 168
      1. \r\n
    268. REST OF ASIA-PACIFIC: 3D PRINTING METAL MARKET, BY FORM, 2023-2030 (USD MILLION) 168
      1. \r\n
    269. REST OF ASIA-PACIFIC: 3D PRINTING METAL MARKET, BY FORM, 2023-2030 (TONS) 169
      1. \r\n
    270. REST OF ASIA-PACIFIC: 3D PRINTING METAL MARKET, BY APPLICATION, 2023-2030 (USD MILLION) 169
      1. \r\n
    271. REST OF ASIA-PACIFIC: 3D PRINTING METAL MARKET, BY APPLICATION, 2023-2030 (TONS) 170
      1. \r\n
    272. LATIN AMERICA: 3D PRINTING METAL MARKET, BY COUNTRY, 2023-2030 (USD MILLION) 170
      1. \r\n
    273. LATIN AMERICA: 3D PRINTING METAL MARKET, BY COUNTRY, 2023-2030 (TONS) 171
      1. \r\n
    274. LATIN AMERIUCA: PRINTING METALS MARKET, BY MATERIAL, 2023-2030 (USD MILLION) 171
      1. \r\n
    275. LATIN AMERIUCA: 3D PRINTING METAL MARKET, BY MATERIAL, 2023-2030 (TONS) 172
      1. \r\n
    276. LATIN AMERICA: 3D PRINTING METAL MARKET, BY MATERIAL, 2023-2030 (USD MILLION) 172
      1. \r\n
    277. LATIN AMERICA: 3D PRINTING METAL MARKET, BY MATERIAL, 2023-2030 (TONS) 172
      1. \r\n
    278. LATIN AMERICA: 3D PRINTING METAL MARKET, BY FORM, 2023-2030 (USD MILLION) 173
      1. \r\n
    279. LATIN AMERICA: 3D PRINTING METAL MARKET, BY FORM, 2023-2030 (TONS) 173
      1. \r\n
    280. LATIN AMERICA: 3D PRINTING METAL MARKET, BY APPLICATION, 2023-2030 (USD MILLION) 174
      1. \r\n
    281. LATIN AMERICA: 3D PRINTING METAL MARKET, BY APPLICATION, 2023-2030 (TONS) 174
      1. \r\n
    282. PRINTING METALS MARKET, BY MATERIAL, 2023-2030 (USD MILLION) 175
      1. \r\n
    283. LATIN AMERIUCA: 3D PRINTING METAL MARKET, BY MATERIAL, 2023-2030 (TONS) 175
      1. \r\n
    284. BRAZIL: 3D PRINTING METAL MARKET, BY MATERIAL, 2023-2030 (USD MILLION) 176
      1. \r\n
    285. BRAZIL: 3D PRINTING METAL MARKET, BY MATERIAL, 2023-2030 (TONS) 176
      1. \r\n
    286. BRAZIL: 3D PRINTING METAL MARKET, BY FORM, 2023-2030 (USD MILLION) 176
      1. \r\n
    287. BRAZIL: 3D PRINTING METAL MARKET, BY FORM, 2023-2030 (TONS) 177
      1. \r\n
    288. BRAZIL: 3D PRINTING METAL MARKET, BY APPLICATION, 2023-2030 (USD MILLION) 177
      1. \r\n
    289. BRAZIL: 3D PRINTING METAL MARKET, BY APPLICATION, 2023-2030 (TONS) 178
      1. \r\n
    290. ARGENTINA: 3D PRINTING METAL MARKET, BY MATERIAL, 2023-2030 (USD MILLION) 178
      1. \r\n
    291. ARGENTINA: 3D PRINTING METAL MARKET, BY MATERIAL, 2023-2030 (TONS) 179
      1. \r\n
    292. ARGENTINA: 3D PRINTING METAL MARKET, BY MATERIAL, 2023-2030 (USD MILLION) 179
      1. \r\n
    293. ARGENTINA: 3D PRINTING METAL MARKET, BY MATERIAL, 2023-2030 (TONS) 180
      1. \r\n
    294. ARGENTINA: 3D PRINTING METAL MARKET, BY FORM, 2023-2030 (USD MILLION) 180
      1. \r\n
    295. ARGENTINA: 3D PRINTING METAL MARKET, BY FORM, 2023-2030 (TONS) 181
      1. \r\n
    296. ARGENTINA: 3D PRINTING METAL MARKET, BY APPLICATION, 2023-2030 (USD MILLION) 181
      1. \r\n
    297. ARGENTINA: 3D PRINTING METAL MARKET, BY APPLICATION, 2023-2030 (TONS) 182
      1. \r\n
    298. MEXICO: 3D PRINTING METAL MARKET, BY MATERIAL, 2023-2030 (USD MILLION) 182
      1. \r\n
    299. MEXICO: 3D PRINTING METAL MARKET, BY MATERIAL, 2023-2030 (TONS) 183
      1. \r\n
    300. MEXICO: 3D PRINTING METAL MARKET, BY MATERIAL, 2023-2030 (USD MILLION) 183
      1. \r\n
    301. MEXICO: 3D PRINTING METAL MARKET, BY MATERIAL, 2023-2030 (TONS) 183
      1. \r\n
    302. MEXICO: 3D PRINTING METAL MARKET, BY FORM, 2023-2030 (USD MILLION) 184
      1. \r\n
    303. MEXICO: 3D PRINTING METAL MARKET, BY FORM, 2023-2030 (TONS) 184
      1. \r\n
    304. MEXICO: 3D PRINTING METAL MARKET, BY APPLICATION 2023-2030 (USD MILLION) 185
      1. \r\n
    305. MEXICO: 3D PRINTING METAL MARKET, BY APPLICATION, 2023-2030 (TONS) 185
      1. \r\n
    306. REST OF LATIN AMERICA: 3D PRINTING METAL MARKET, BY MATERIAL, 2023-2030 (USD MILLION) 186
      1. \r\n
    307. REST OF LATIN AMERICA: 3D PRINTING METAL MARKET, BY MATERIAL, 2023-2030 (TONS) 186
      1. \r\n
    308. REST OF LATIN AMERICA: 3D PRINTING METAL MARKET, BY MATERIAL, 2023-2030 (USD MILLION) 187
      1. \r\n
    309. REST OF LATIN AMERICA: 3D PRINTING METAL MARKET, BY MATERIAL, 2023-2030 (TONS) 187
      1. \r\n
    310. REST OF LATIN AMERICA: 3D PRINTING METAL MARKET, BY FORM, 2023-2030 (USD MILLION) 187
      1. \r\n
    311. REST OF LATIN AMERICA: 3D PRINTING METAL MARKET, BY FORM, 2023-2030 (TONS) 188
      1. \r\n
    312. REST OF LATIN AMERICA: 3D PRINTING METAL MARKET, BY APPLICATION, 2023-2030 (USD MILLION) 188
      1. \r\n
    313. REST OF LATIN AMERICA: 3D PRINTING METAL MARKET, BY APPLICATION, 2023-2030 (TONS) 189
      1. \r\n
    314. MIDDLE EAST & AFRICA: 3D PRINTING METAL MARKET, BY COUNTRY, 2023-2030 (USD MILLION) 189
      1. \r\n
    315. MIDDLE EAST & AFRICA: 3D PRINTING METAL MARKET, BY COUNTRY, 2023-2030 (TONS) 190
      1. \r\n
    316. MIDDLE EAST & AFRICA: 3D PRINTING METAL MARKET, BY MATERIAL, 2023-2030 (USD MILLION) 190
      1. \r\n
    317. MIDDLE EAST & AFRICA: 3D PRINTING METAL MARKET, BY MATERIAL, 2023-2030 (TONS) 191
      1. \r\n
    318. MIDDLE EAST & AFRICA: 3D PRINTING METAL MARKET, BY MATERIAL, 2023-2030 (USD MILLION) 191
      1. \r\n
    319. MIDDLE EAST & AFRICA: 3D PRINTING METAL MARKET, BY MATERIAL, 2023-2030 (TONS) 191
      1. \r\n
    320. MIDDLE EAST & AFRICA: 3D PRINTING METAL MARKET, BY FORM, 2023-2030 (USD MILLION) 192
      1. \r\n
    321. MIDDLE EAST & AFRICA: 3D PRINTING METAL MARKET, BY APPLICATION, 2023-2030 (USD MILLION) 192
      1. \r\n
    322. MIDDLE EAST & AFRICA: 3D PRINTING METAL MARKET, BY APPLICATION, 2023-2030 (TONS) 193
      1. \r\n
    323. MIDDLE EAST & AFRICA: 3D PRINTING METAL MARKET, BY FORM, 2023-2030 (TONS) 193
      1. \r\n
    324. TURKEY: 3D PRINTING METAL MARKET, BY MATERIAL, 2023-2030 (USD MILLION) 194
      1. \r\n
    325. TURKEY: 3D PRINTING METAL MARKET, BY MATERIAL, 2023-2030 (TONS) 194
      1. \r\n
    326. TURKEY: 3D PRINTING METAL MARKET, BY MATERIAL, 2023-2030 (USD MILLION) 195
      1. \r\n
    327. TURKEY: 3D PRINTING METAL MARKET, BY MATERIAL, 2023-2030 (TONS) 195
      1. \r\n
    328. TURKEY: 3D PRINTING METAL MARKET, BY FORM, 2023-2030 (USD MILLION) 195
      1. \r\n
    329. TURKEY: 3D PRINTING METAL MARKET, BY FORM, 2023-2030 (TONS) 196
      1. \r\n
    330. TURKEY: 3D PRINTING METAL MARKET, BY APPLICATION, 2023-2030 (USD MILLION) 196
      1. \r\n
    331. TURKEY: 3D PRINTING METAL MARKET, BY APPLICATION, 2023-2030 (TONS) 197
      1. \r\n
    332. SAUDI ARABIA: 3D PRINTING METAL MARKET, BY MATERIAL, 2023-2030 (USD MILLION) 197
      1. \r\n
    333. SAUDI ARABIA: 3D PRINTING METAL MARKET, BY MATERIAL, 2023-2030 (TONS) 198
      1. \r\n
    334. SAUDI ARABIA: 3D PRINTING METAL MARKET, BY MATERIAL, 2023-2030 (USD MILLION) 198
      1. \r\n
    335. SAUDI ARABIA: 3D PRINTING METAL MARKET, BY MATERIAL, 2023-2030 (TONS) 199
      1. \r\n
    336. SAUDI ARABIA: 3D PRINTING METAL MARKET, BY FORM, 2023-2030 (USD MILLION) 199
      1. \r\n
    337. SAUDI ARABIA: 3D PRINTING METAL MARKET, BY FORM, 2023-2030 (TONS) 200
      1. \r\n
    338. SAUDI ARABIA: 3D PRINTING METAL MARKET, BY APPLICATION, 2023-2030 (USD MILLION) 200
      1. \r\n
    339. SAUDI ARABIA: 3D PRINTING METAL MARKET, BY APPLICATION, 2023-2030 (TONS) 201
      1. \r\n
    340. UAE: 3D PRINTING METAL MARKET, BY MATERIAL, 2023-2030 (USD MILLION) 201
      1. \r\n
    341. UAE: 3D PRINTING METAL MARKET, BY MATERIAL, 2023-2030 (TONS) 202
      1. \r\n
    342. UAE 3D PRINTING METAL MARKET, BY MATERIAL, 2023-2030 (USD MILLION) 202
      1. \r\n
    343. UAE : 3D PRINTING METAL MARKET, BY MATERIAL, 2023-2030 (TONS) 202
      1. \r\n
    344. UAE: 3D PRINTING METAL MARKET, BY FORM, 2023-2030 (USD MILLION) 202
      1. \r\n
    345. UAE: 3D PRINTING METAL MARKET, BY APPLICATION, 2023-2030 (TONS) 203
      1. \r\n
    346. UAE: 3D PRINTING METAL MARKET, BY APPLICATION, 2023-2030 (USD MILLION) 204
      1. \r\n
    347. UAE: 3D PRINTING METAL MARKET, BY FORM, 2023-2030 (TONS) 204
      1. \r\n
    348. EGYPT: 3D PRINTING METAL MARKET, BY MATERIAL, 2023-2030 (USD MILLION) 205
      1. \r\n
    349. EGYPT: 3D PRINTING METAL MARKET, BY MATERIAL, 2023-2030 (TONS) 205
      1. \r\n
    350. EGYPT: 3D PRINTING METAL MARKET, BY MATERIAL, 2023-2030 (USD MILLION) 206
      1. \r\n
    351. EGYPT: 3D PRINTING METAL MARKET, BY MATERIAL, 2023-2030 (TONS) 206
      1. \r\n
    352. EGYPT: 3D PRINTING METAL MARKET, BY FORM, 2023-2030 (USD MILLION) 206
      1. \r\n
    353. EGYPT: 3D PRINTING METAL MARKET, BY FORM, 2023-2030 (TONS) 207
      1. \r\n
    354. EGYPT: 3D PRINTING METAL MARKET, BY APPLICATION, 2023-2030 (USD MILLION) 207
      1. \r\n
    355. EGYPT: 3D PRINTING METAL MARKET, BY APPLICATION, 2023-2030 (TONS) 208
      1. \r\n
    356. REST OF MIDDLE EAST & AFRICA: 3D PRINTING METAL MARKET, BY MATERIAL, 2023-2030 (USD MILLION) 208
      1. \r\n
    357. REST OF MIDDLE EAST & AFRICA: 3D PRINTING METAL MARKET, BY MATERIAL, 2023-2030 (TONS) 209
      1. \r\n
    358. REST OF MIDDLE EAST & AFRICA: 3D PRINTING METAL MARKET, BY MATERIAL, 2023-2030 (USD MILLION) 209
      1. \r\n
    359. REST OF MIDDLE EAST & AFRICA: 3D PRINTING METAL MARKET, BY MATERIAL, 2023-2030 (TONS) 209
      1. \r\n
    360. REST OF MIDDLE EAST & AFRICA: 3D PRINTING METAL MARKET, BY FORM, 2023-2030 (USD MILLION) 210
      1. \r\n
    361. REST OF MIDDLE EAST & AFRICA: 3D PRINTING METAL MARKET, BY FORM, 2023-2030 (TONS) 210
      1. \r\n
    362. REST OF MIDDLE EAST & AFRICA: 3D PRINTING METAL MARKET, BY APPLICATION, 2023-2030 (USD MILLION) 211
      1. \r\n
    363. REST OF MIDDLE EAST & AFRICA: 3D PRINTING METAL MARKET, BY APPLICATION, 2023-2030 (TONS) 211
      1. \r\n
    364. TABLE 1 KEY DEVELOPMENTS OVERVIEW 213
      1. \r\n
    365. RENISHAW PLC: PRODUCT OFFERINGS 215
      1. \r\n
    366. RENISHAW PLC: KEY DEVELOPMENT 215
      1. \r\n
    367. VOXELJET AG: PRODUCT OFFERINGS 218
      1. \r\n
    368. VOXELJET AG: KEY DEVELOPMENT 218
      1. \r\n
    369. 3D SYSTEMS, INC: PRODUCT OFFERINGS 221
      1. \r\n
    370. CRS HOLDINGS INC: PRODUCT OFFERINGS 223
      1. \r\n
    371. CRS HOLDINGS INC: KEY DEVELOPMENT 223
      1. \r\n
    372. GKN AEROSPACE: PRODUCT OFFERINGS 225
      1. \r\n
    373. GKN AEROSPACE: KEY DEVELOPMENT 225
      1. \r\n
    374. EOS GMBH: PRODUCT OFFERINGS 227
      1. \r\n
    375. EOS GMBH:KEY DEVELOPMENT 227
      1. \r\n
    376. SANDVIK AB.: PRODUCT OFFERINGS 230
      1. \r\n
    377. SANDVIK AB.: KEY DEVELOPMENT 230
      1. \r\n
    378. SLM SOLUTIONS: PRODUCT OFFERINGS 232
      1. \r\n
    379. SLM SOLUTIONS.: KEY DEVELOPMENT 232
      1. \r\n
    380. MATERIALISE: PRODUCT OFFERINGS 234
      1. \r\n
    381. MATERIALISE.: KEY DEVELOPMENT 234
      1. \r\n
    382. CONCEPT LASER GMBH: PRODUCT OFFERINGS 235
      1. \r\n
    383. CONCEPT LASER GMBH.: KEY DEVELOPMENT 235
      1. \r\n
    384. OPTOMEC, INC.: PRODUCT OFFERINGS 237
      1. \r\n
    385. List of Figures
      1. \r\n
    386. MARKET ATTRACTIVENESS ANALYSIS: GLOBAL 3D PRINTING METAL MARKET 22
      1. \r\n
    387. GLOBAL 3D PRINTING METAL MARKET ANALYSIS BY MATERIAL 22
      1. \r\n
    388. GLOBAL 3D PRINTING METAL MARKET ANALYSIS BY FORM 23
      1. \r\n
    389. GLOBAL 3D PRINTING METAL MARKET ANALYSIS BY TECHNOLOGY 24
      1. \r\n
    390. GLOBAL 3D PRINTING METAL MARKET ANALYSIS BY APPLICATION 25
      1. \r\n
    391. GLOBAL 3D PRINTING METAL MARKET: MARKET STRUCTURE 27
      1. \r\n
    392. KEY TAKEAWAYS OF THE GLOBAL 3D PRINTING METAL MARKET 28
      1. \r\n
    393. KEY BUYING CRITERIA OF THE GLOBAL 3D PRINTING METAL MARKET 28
      1. \r\n
    394. NORTH AMERICA: MARKET SIZE AND MARKET SHARE, BY COUNTRY (2023-2030) 29
      1. \r\n
    395. EUROPE: MARKET SIZE AND MARKET SHARE, BY COUNTRY (2023-2030) 30
      1. \r\n
    396. ASIA-PACIFIC: MARKET SIZE AND MARKET SHARE, BY COUNTRY (2023-2030) 30
      1. \r\n
    397. LATIN AMERICA: MARKET SIZE AND MARKET SHARE, BY COUNTRY (2023-2030) 31
      1. \r\n
    398. MIDDLE EAST & AFRICA: MARKET SIZE AND MARKET SHARE, BY COUNTRY (2023-2030) 31
      1. \r\n
    399. RESEARCH PROCESS OF MRFR 32
      1. \r\n
    400. TOP-DOWN & BOTTOM-UP APPROACHES 35
      1. \r\n
    401. ANALYSIS OF GLOBAL 3D PRINTING METAL MARKET 36
      1. \r\n
    402. REVENUE TURNOVER OF THE AEROSPACE INDUSTRY IN USD BILLION (2023) 37
      1. \r\n
    403. CANADA AIRCRAFT PRODUCTION (2023-2030) 38
      1. \r\n
    404. CAR PRODUCTION (2023-2030) 38
      1. \r\n
    405. INCREASING EXPENDITURE IN HEALTHCARE INDUSTRY (2023-2030) 39
      1. \r\n
    406. DRIVERS IMPACT ANALYSIS: EUROPE SODIUM CHLORITE MARKET 40
      1. \r\n
    407. RESTRAINTS IMPACT ANALYSIS: EUROPE SODIUM CHLORITE MARKET 41
      1. \r\n
    408. SUPPLY CHAIN ANALYSIS 42
      1. \r\n
    409. PORTER'S FIVE FORCES ANALYSIS OF THE GLOBAL 3D PRINTING METAL MARKET 44
      1. \r\n
    410. GLOBAL 3D PRINTING METAL MARKET, BY MATERIAL, 2023-2030 (USD MILLION) 46
      1. \r\n
    411. GLOBAL 3D PRINTING METAL MARKET, BY MATERIAL, 2023-2030 (TONS) 47
      1. \r\n
    412. GLOBAL 3D PRINTING METAL MARKET, BY FORM, 2023-2030 (USD MILLION) 55
      1. \r\n
    413. GLOBAL 3D PRINTING METAL MARKET, BY FORM, 2023-2030 (TONS) 56
      1. \r\n
    414. GLOBAL 3D PRINTING METAL MARKET, BY TECHNOLOGY, 2023-2030 (USD MILLION) 59
      1. \r\n
    415. GLOBAL 3D PRINTING METAL MARKET, BY FORM, 2023-2030 (TONS) 60
      1. \r\n
    416. GLOBAL 3D PRINTING METAL MARKET, BY APPLICATION, 2023-2030 (USD MILLION) 67
      1. \r\n
    417. GLOBAL 3D PRINTING METAL MARKET, BY APPLICATION, 2023-2030 (TONS) 68
      1. \r\n
    418. GLOBAL 3D PRINTING METAL MARKET, BY REGION, 2023-2030 (USD MILLION) 75
      1. \r\n
    419. GLOBAL 3D PRINTING METAL MARKET, BY REGION, 2023-2030 (TONS) 76
      1. \r\n
    420. MARKET STRATEGY SHARE (%) 212
      1. \r\n
    421. RENISHAW PLC: FINANCIAL OVERVIEW SNAPSHOT 214
      1. \r\n
    422. RENISHAW PLC: SWOT ANALYSIS 216
      1. \r\n
    423. VOXELJET AG: FINANCIAL OVERVIEW SNAPSHOT 217
      1. \r\n
    424. VOXELJET AG: SWOT ANALYSIS 218
      1. \r\n
    425. 3D SYSTEMS, INC: FINANCIAL OVERVIEW SNAPSHOT 220
      1. \r\n
    426. 3D SYSTEMS, INC: SWOT ANALYSIS 221
      1. \r\n
    427. CRS HOLDINGS INC: FINANCIAL OVERVIEW SNAPSHOT 222
      1. \r\n
    428. CRS HOLDINGS INC: SWOT ANALYSIS 223
      1. \r\n
    429. GKN AEROSPACE: FINANCIAL OVERVIEW SNAPSHOT 224
      1. \r\n
    430. GKN AEROSPACE: SWOT ANALYSIS 226
      1. \r\n
    431. EOS GMBH: SWOT ANALYSIS 228
      1. \r\n
    432. SANDVIK AB: FINANCIAL OVERVIEW SNAPSHOT 229
      1. \r\n
    433. SANDVIK AB: SWOT ANALYSIS 230
      1. \r\n
    434. SLM SOLUTIONS: FINANCIAL OVERVIEW SNAPSHOT 231
      1. \r\n
    435. SLM SOLUTIONS: SWOT ANALYSIS 232
      1. \r\n
    436. MATERIALISE: FINANCIAL OVERVIEW SNAPSHOT 233
      1. \r\n
    437. MATERIALISE: SWOT ANALYSIS 234
      1. \r\n
    438. CONCEPT LASER GMBH: SWOT ANALYSIS 236
      1. \r\n
    439. OPTOMEC, INC.: SWOT ANALYSIS 237

    3D Printing Metals Market Segmentation

    3D Printing Titanium, Aluminum & Stainless Steels Technology Outlook (USD Million, 2018-2030)

    Vat PhotoNickel & Inconelization & Material Extrusion

    Sheet Lamination

    Binder Jetting & Material Jetting

    Others

    3D Printing Titanium, Aluminum & Stainless Steels Material Outlook (USD Million, 2018-2030)

    Titanium, Aluminum & Stainless Steel

    Nickel & Inconel

    Others

    3D Printing Titanium, Aluminum & Stainless Steels Application Outlook (USD Million, 2018-2030)

    Aerospace & Defense

    Automotive & Healthcare

    Building, Construction & Consumer Electronics

    Others

    3D Printing Titanium, Aluminum & Stainless Steels Regional Outlook (USD Million, 2018-2030)

    North America Outlook (USD Million, 2018-2030)

    North America 3D Printing Titanium, Aluminum & Stainless Steels by Technology

    Vat PhotoNickel & Inconelization & Material Extrusion

    Sheet Lamination

    Binder Jetting & Material Jetting

    Others

    North America 3D Printing Titanium, Aluminum & Stainless Steels by Material

    Titanium, Aluminum & Stainless Steel

    Nickel & Inconel

    Others

    North America 3D Printing Titanium, Aluminum & Stainless Steels by Application

    Aerospace & Defense

    Automotive & Healthcare

    Building, Construction & Consumer Electronics

    Others

    US Outlook (USD Million, 2018-2030)

    US 3D Printing Titanium, Aluminum & Stainless Steels by Technology

    Vat PhotoNickel & Inconelization & Material Extrusion

    Sheet Lamination

    Binder Jetting & Material Jetting

    Others

    US 3D Printing Titanium, Aluminum & Stainless Steels by Material

    Titanium, Aluminum & Stainless Steel

    Nickel & Inconel

    Others

    US 3D Printing Titanium, Aluminum & Stainless Steels by Application

    Aerospace & Defense

    Automotive & Healthcare

    Building, Construction & Consumer Electronics

    Others

    CANADA Outlook (USD Million, 2018-2030)

    CANADA 3D Printing Titanium, Aluminum & Stainless Steels by Technology

    Vat PhotoNickel & Inconelization & Material Extrusion

    Sheet Lamination

    Binder Jetting & Material Jetting

    Others

    CANADA 3D Printing Titanium, Aluminum & Stainless Steels by Material

    Titanium, Aluminum & Stainless Steel

    Nickel & Inconel

    Others

    CANADA 3D Printing Titanium, Aluminum & Stainless Steels by Application

    Aerospace & Defense

    Automotive & Healthcare

    Building, Construction & Consumer Electronics

    Others

    Europe Outlook (USD Million, 2018-2030)

    Europe 3D Printing Titanium, Aluminum & Stainless Steels by Technology

    Vat PhotoNickel & Inconelization & Material Extrusion

    Sheet Lamination

    Binder Jetting & Material Jetting

    Others

    Europe 3D Printing Titanium, Aluminum & Stainless Steels by Material

    Titanium, Aluminum & Stainless Steel

    Nickel & Inconel

    Others

    Europe 3D Printing Titanium, Aluminum & Stainless Steels by Application

    Aerospace & Defense

    Automotive & Healthcare

    Building, Construction & Consumer Electronics

    Others

    Germany Outlook (USD Million, 2018-2030)

    Germany 3D Printing Titanium, Aluminum & Stainless Steels by Technology

    Vat PhotoNickel & Inconelization & Material Extrusion

    Sheet Lamination

    Binder Jetting & Material Jetting

    Others

    Germany 3D Printing Titanium, Aluminum & Stainless Steels by Material

    Titanium, Aluminum & Stainless Steel

    Nickel & Inconel

    Others

    Germany 3D Printing Titanium, Aluminum & Stainless Steels by Application

    Aerospace & Defense

    Automotive & Healthcare

    Building, Construction & Consumer Electronics

    Others

    France Outlook (USD Million, 2018-2030)

    France 3D Printing Titanium, Aluminum & Stainless Steels by Technology

    Vat PhotoNickel & Inconelization & Material Extrusion

    Sheet Lamination

    Binder Jetting & Material Jetting

    Others

    France 3D Printing Titanium, Aluminum & Stainless Steels by Material

    Titanium, Aluminum & Stainless Steel

    Nickel & Inconel

    Others

    France 3D Printing Titanium, Aluminum & Stainless Steels by Application

    Aerospace & Defense

    Automotive & Healthcare

    Building, Construction & Consumer Electronics

    Others

    UK Outlook (USD Million, 2018-2030)

    UK 3D Printing Titanium, Aluminum & Stainless Steels by Technology

    Vat PhotoNickel & Inconelization & Material Extrusion

    Sheet Lamination

    Binder Jetting & Material Jetting

    Others

    UK 3D Printing Titanium, Aluminum & Stainless Steels by Material

    Titanium, Aluminum & Stainless Steel

    Nickel & Inconel

    Others

    UK 3D Printing Titanium, Aluminum & Stainless Steels by Application

    Aerospace & Defense

    Automotive & Healthcare

    Building, Construction & Consumer Electronics

    Others

    ITALY Outlook (USD Million, 2018-2030)

    ITALY 3D Printing Titanium, Aluminum & Stainless Steels by Technology

    Vat PhotoNickel & Inconelization & Material Extrusion

    Sheet Lamination

    Binder Jetting & Material Jetting

    Others

    ITALY 3D Printing Titanium, Aluminum & Stainless Steels by Material

    Titanium, Aluminum & Stainless Steel

    Nickel & Inconel

    Others

    ITALY 3D Printing Titanium, Aluminum & Stainless Steels by Application

    Aerospace & Defense

    Automotive & Healthcare

    Building, Construction & Consumer Electronics

    Others


    SPAIN Outlook (USD Million, 2018-2030)

    Spain 3D Printing Titanium, Aluminum & Stainless Steels by Technology

    Vat PhotoNickel & Inconelization & Material Extrusion

    Sheet Lamination

    Binder Jetting & Material Jetting

    Others

    Spain 3D Printing Titanium, Aluminum & Stainless Steels by Material

    Titanium, Aluminum & Stainless Steel

    Nickel & Inconel

    Others

    Spain 3D Printing Titanium, Aluminum & Stainless Steels by Application

    Aerospace & Defense

    Automotive & Healthcare

    Building, Construction & Consumer Electronics

    Others

    Rest Of Europe Outlook (USD Million, 2018-2030)

    Rest Of Europe 3D Printing Titanium, Aluminum & Stainless Steels by Technology

    Vat PhotoNickel & Inconelization & Material Extrusion

    Sheet Lamination

    Binder Jetting & Material Jetting

    Others

    REST OF EUROPE 3D Printing Titanium, Aluminum & Stainless Steels by Material

    Titanium, Aluminum & Stainless Steel

    Nickel & Inconel

    Others

    REST OF EUROPE 3D Printing Titanium, Aluminum & Stainless Steels by Application

    Aerospace & Defense

    Automotive & Healthcare

    Building, Construction & Consumer Electronics

    Others

    Asia-Pacific Outlook (USD Million, 2018-2030)

    Asia-Pacific 3D Printing Titanium, Aluminum & Stainless Steels by Technology

    Vat PhotoNickel & Inconelization & Material Extrusion

    Sheet Lamination

    Binder Jetting & Material Jetting

    Others

    Asia-Pacific 3D Printing Titanium, Aluminum & Stainless Steels by Material

    Titanium, Aluminum & Stainless Steel

    Nickel & Inconel

    Others

    Asia-Pacific 3D Printing Titanium, Aluminum & Stainless Steels by Application

    Aerospace & Defense

    Automotive & Healthcare

    Building, Construction & Consumer Electronics

    Others

    China Outlook (USD Million, 2018-2030)

    China 3D Printing Titanium, Aluminum & Stainless Steels by Technology

    Vat PhotoNickel & Inconelization & Material Extrusion

    Sheet Lamination

    Binder Jetting & Material Jetting

    Others

    China 3D Printing Titanium, Aluminum & Stainless Steels by Material

    Titanium, Aluminum & Stainless Steel

    Nickel & Inconel

    Others

    China 3D Printing Titanium, Aluminum & Stainless Steels by Application

    Aerospace & Defense

    Automotive & Healthcare

    Building, Construction & Consumer Electronics

    Others

    Japan Outlook (USD Million, 2018-2030)

    Japan 3D Printing Titanium, Aluminum & Stainless Steels by Technology

    Vat PhotoNickel & Inconelization & Material Extrusion

    Sheet Lamination

    Binder Jetting & Material Jetting

    Others

    Japan 3D Printing Titanium, Aluminum & Stainless Steels by Material

    Titanium, Aluminum & Stainless Steel

    Nickel & Inconel

    Others

    Japan 3D Printing Titanium, Aluminum & Stainless Steels by Application

    Aerospace & Defense

    Automotive & Healthcare

    Building, Construction & Consumer Electronics

    Others

    India Outlook (USD Million, 2018-2030)

    India 3D Printing Titanium, Aluminum & Stainless Steels by Technology

    Vat PhotoNickel & Inconelization & Material Extrusion

    Sheet Lamination

    Binder Jetting & Material Jetting

    Others

    India 3D Printing Titanium, Aluminum & Stainless Steels by Material

    Titanium, Aluminum & Stainless Steel

    Nickel & Inconel

    Others

    India 3D Printing Titanium, Aluminum & Stainless Steels by Application

    Aerospace & Defense

    Automotive & Healthcare

    Building, Construction & Consumer Electronics

    Others

    Australia Outlook (USD Million, 2018-2030)

    Australia 3D Printing Titanium, Aluminum & Stainless Steels by Technology

    Vat PhotoNickel & Inconelization & Material Extrusion

    Sheet Lamination

    Binder Jetting & Material Jetting

    Others

    Australia 3D Printing Titanium, Aluminum & Stainless Steels by Material

    Titanium, Aluminum & Stainless Steel

    Nickel & Inconel

    Others

    Australia 3D Printing Titanium, Aluminum & Stainless Steels by Application

    Aerospace & Defense

    Automotive & Healthcare

    Building, Construction & Consumer Electronics

    Others

    Rest of Asia-Pacific Outlook (USD Million, 2018-2030)

    Rest of Asia-Pacific 3D Printing Titanium, Aluminum & Stainless Steels by Technology

    Vat PhotoNickel & Inconelization & Material Extrusion

    Sheet Lamination

    Binder Jetting & Material Jetting

    Others

    Rest of Asia-Pacific 3D Printing Titanium, Aluminum & Stainless Steels by Material

    Titanium, Aluminum & Stainless Steel

    Nickel & Inconel

    Others

    Rest of Asia-Pacific 3D Printing Titanium, Aluminum & Stainless Steels by Application

    Aerospace & Defense

    Automotive & Healthcare

    Building, Construction & Consumer Electronics

    Others

    Rest of the World Outlook (USD Million, 2018-2030)

    Rest of the World 3D Printing Titanium, Aluminum & Stainless Steels by Technology

    Vat PhotoNickel & Inconelization & Material Extrusion

    Sheet Lamination

    Binder Jetting & Material Jetting

    Others

    Rest of the World 3D Printing Titanium, Aluminum & Stainless Steels by Material

    Titanium, Aluminum & Stainless Steel

    Nickel & Inconel

    Others

    Rest of the World 3D Printing Titanium, Aluminum & Stainless Steels by Application

    Aerospace & Defense

    Automotive & Healthcare

    Building, Construction & Consumer Electronics

    Others


    Middle East Outlook (USD Million, 2018-2030)

    Middle East 3D Printing Titanium, Aluminum & Stainless Steels by Technology

    Vat PhotoNickel & Inconelization & Material Extrusion

    Sheet Lamination

    Binder Jetting & Material Jetting

    Others

    Middle East 3D Printing Titanium, Aluminum & Stainless Steels by Material

    Titanium, Aluminum & Stainless Steel

    Nickel & Inconel

    Others

    Middle East 3D Printing Titanium, Aluminum & Stainless Steels by Application

    Aerospace & Defense

    Automotive & Healthcare

    Building, Construction & Consumer Electronics

    Others

    Africa Outlook (USD Million, 2018-2030)

    Africa 3D Printing Titanium, Aluminum & Stainless Steels by Technology

    Vat PhotoNickel & Inconelization & Material Extrusion

    Sheet Lamination

    Binder Jetting & Material Jetting

    Others

    Africa 3D Printing Titanium, Aluminum & Stainless Steels by Material

    Titanium, Aluminum & Stainless Steel

    Nickel & Inconel

    Others

    Africa 3D Printing Titanium, Aluminum & Stainless Steels by Application

    Aerospace & Defense

    Automotive & Healthcare

    Building, Construction & Consumer Electronics

    Others

    Latin America Outlook (USD Million, 2018-2030)

    Latin America 3D Printing Titanium, Aluminum & Stainless Steels by Technology

    Vat PhotoNickel & Inconelization & Material Extrusion

    Sheet Lamination

    Binder Jetting & Material Jetting

    Others

    Latin America 3D Printing Titanium, Aluminum & Stainless Steels by Material

    Titanium, Aluminum & Stainless Steel

    Nickel & Inconel

    Others

    Latin America 3D Printing Titanium, Aluminum & Stainless Steels by Application

    Aerospace & Defense

    Automotive & Healthcare

    Building, Construction & Consumer Electronics

    Others

    Infographic

    Free Sample Request

    Kindly complete the form below to receive a free sample of this Report

    Get Free Sample

    Customer Strories

    “I am very pleased with how market segments have been defined in a relevant way for my purposes (such as "Portable Freezers & refrigerators" and "last-mile"). In general the report is well structured. Thanks very much for your efforts.”

    Victoria Milne

    Founder
    Case Study
    Chemicals and Materials

    Compare Licence

    ×
    Features License Type
    Single User Multiuser License Enterprise User
    Price $4,950 $5,950 $7,250
    Maximum User Access Limit 1 User Upto 10 Users Unrestricted Access Throughout the Organization
    Free Customization
    Direct Access to Analyst
    Deliverable Format
    Platform Access
    Discount on Next Purchase 10% 15% 15%
    Printable Versions