• Cat-intel
  • MedIntelliX
  • Resources
  • About Us
  • Request Free Sample ×

    Kindly complete the form below to receive a free sample of this Report

    Leading companies partner with us for data-driven Insights

    clients tt-cursor

    3D Mobile Mapping Market

    ID: MRFR/ICT/32524-HCR
    100 Pages
    Aarti Dhapte
    September 2025

    3D Mobile Mapping Market Research Report: By Application (Urban Planning, Transportation and Logistics, Construction, Mining, Surveying), By Technology (LiDAR, Photogrammetry, GPS, Computer Vision), By Deployment Type (Cloud-Based, On-Premises), By End Use Industry (Government, Construction, Transportation, Energy, Telecommunications) and By Regional (North America, Europe, South America, Asia Pacific, Middle East and Africa) - Forecast to 2034.

    Share:
    Download PDF ×

    We do not share your information with anyone. However, we may send you emails based on your report interest from time to time. You may contact us at any time to opt-out.

    3D Mobile Mapping Market Research Report - Global Forecast till 2034 Infographic
    Purchase Options
    $ 4,950.0
    $ 5,950.0
    $ 7,250.0
    Table of Contents

    3D Mobile Mapping Market Summary

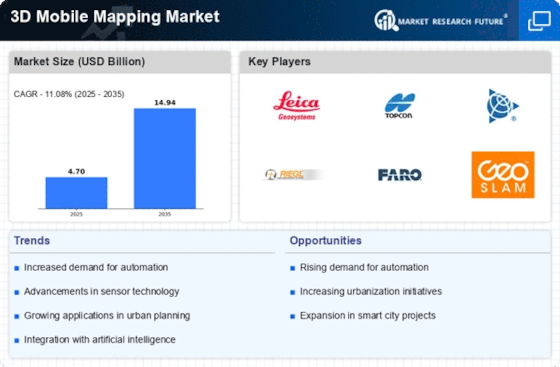
    The Global 3D Mobile Mapping Market is projected to grow from 4.7 USD Billion in 2024 to 15.0 USD Billion by 2035, reflecting a robust growth trajectory.

    Key Market Trends & Highlights

    3D Mobile Mapping Key Trends and Highlights

    • The market is expected to expand at a compound annual growth rate (CAGR) of 11.15% from 2025 to 2035.
    • By 2035, the market valuation is anticipated to reach 15.0 USD Billion, indicating substantial growth potential.
    • In 2024, the market is valued at 4.7 USD Billion, laying a strong foundation for future expansion.
    • Growing adoption of 3D mobile mapping technology due to increasing demand for accurate geographic data is a major market driver.

    Market Size & Forecast

    2024 Market Size 4.7 (USD Billion)
    2035 Market Size 15.0 (USD Billion)
    CAGR (2025-2035) 11.15%

    Major Players

    Leica Geosystems, Velodyne Lidar, FARO Technologies, RIEGL, Topcon, SenseFly, NCTech, Cyclomedia, Paracosm, Trimble, Teledyne Optech, Maptek, Pix4D, GeoSLAM, Aerial Innovations

    3D Mobile Mapping Market Trends

    The 3D mobile mapping market is experiencing significant growth driven by advancements in technology and increasing demand for accurate spatial data. The rise of smart cities is a crucial market driver as urban planners and developers seek efficient solutions for infrastructure management and urban development. Additionally, the growing adoption of autonomous vehicles and the need for high-precision mapping capabilities further fuel the demand for 3D mobile mapping services. Government initiatives to digitize various sectors and the increasing use of augmented reality applications also contribute to the market's expansion. There are numerous opportunities to be explored in this dynamic landscape.

    The integration of advanced technologies in 3D mobile mapping is poised to revolutionize urban planning and infrastructure development, enhancing efficiency and precision in data collection.

    U.S. Department of Transportation

    3D Mobile Mapping Market Drivers

    Market Growth Projections

    The Global 3D Mobile Mapping Market Industry is projected to experience substantial growth over the coming years. With a market value expected to reach 15.0 USD Billion by 2035, the industry is poised for significant expansion. The anticipated CAGR of 11.15% from 2025 to 2035 suggests a robust demand for 3D mobile mapping solutions across various sectors. This growth trajectory may be influenced by factors such as technological advancements, increased urbanization, and the rising need for accurate geographic data. As the market evolves, it is likely to attract further investments and innovations.

    Technological Advancements

    The Global 3D Mobile Mapping Market Industry is experiencing rapid growth driven by technological advancements in sensors and imaging technologies. Innovations such as LiDAR and photogrammetry are enhancing the accuracy and efficiency of data collection. For instance, the integration of high-resolution cameras with mobile mapping systems allows for detailed environmental modeling. This technological evolution is expected to contribute significantly to the market's expansion, with projections indicating a market value of 4.7 USD Billion in 2024. As these technologies continue to evolve, they may further streamline processes across various sectors, including urban planning and infrastructure development.

    Government Initiatives and Funding

    Government initiatives and funding play a crucial role in propelling the Global 3D Mobile Mapping Market Industry forward. Various governments are investing in advanced mapping technologies to enhance public services, improve transportation networks, and support urban planning efforts. For example, initiatives aimed at developing smart cities often incorporate 3D mobile mapping solutions to create accurate digital representations of urban environments. This trend is expected to bolster market growth, as public sector investments are likely to increase the adoption of mobile mapping technologies across different regions, further driving the industry's expansion.

    Growing Adoption in Various Industries

    The Global 3D Mobile Mapping Market Industry is benefiting from the growing adoption of mobile mapping technologies across diverse sectors, including construction, transportation, and environmental monitoring. Industries are increasingly recognizing the advantages of utilizing 3D mapping for project planning, asset management, and compliance monitoring. For instance, construction companies are employing mobile mapping to streamline workflows and enhance project accuracy. This widespread adoption is anticipated to contribute to the market's growth trajectory, with the industry expected to reach a value of 4.7 USD Billion in 2024, reflecting the increasing reliance on advanced mapping solutions.

    Urbanization and Infrastructure Development

    Rapid urbanization and infrastructure development are pivotal drivers of the Global 3D Mobile Mapping Market Industry. As cities expand, the need for precise mapping solutions becomes essential for effective urban planning and management. Mobile mapping technologies facilitate the collection of accurate spatial data, which is crucial for infrastructure projects such as road construction and public transportation systems. The market is projected to grow at a CAGR of 11.15% from 2025 to 2035, indicating that the demand for 3D mapping solutions will likely continue to rise in tandem with urban development initiatives worldwide.

    Increased Demand for Geographic Information Systems

    The Global 3D Mobile Mapping Market Industry is witnessing heightened demand for Geographic Information Systems (GIS) as organizations seek to leverage spatial data for decision-making. The ability to visualize and analyze geographical data in three dimensions provides critical insights for urban planning, disaster management, and environmental monitoring. This demand is reflected in the projected market growth, with an anticipated value of 15.0 USD Billion by 2035. As more industries recognize the value of GIS, the integration of 3D mobile mapping technologies into their operations is likely to become increasingly prevalent, thereby driving market expansion.

    Market Segment Insights

    3D Mobile Mapping Market Application Insights

    The 3D Mobile Mapping Market revenue encompasses various applications that demonstrate significant growth and evolving demand. As of 2023, the entire market is projected to reach a valuation of 3.81 USD Billion, with various segments contributing to its development. Among these applications, Urban Planning holds a notable valuation of 0.768 USD Billion, expected to increase to 1.993 USD Billion by 2032, showcasing its pivotal role in efficient city development and infrastructure planning.

    Transportation and Logistics also play a significant role, beginning at 0.89 USD Billion in 2023 and projected to rise to 2.325 USD Billion by 2032, driven by the increasing need for enhanced logistics and transport systems. The Construction industry is another crucial application within the 3D Mobile Mapping Market industry, valued at 0.971 USD Billion in 2023 and projected to reach 2.492 USD Billion in 2032, reflecting the industry's demand for precise measurements and efficient project execution.

    Mining, although smaller on the scale, is still significant, with a value of 0.647 USD Billion in 2023, predicted to grow to 1.578 USD Billion by 2032, indicating its utility in environmental monitoring and resource management. Surveying remains essential as well, starting from 0.534 USD Billion in 2023 and aiming for 1.412 USD Billion by 2032, highlighting its continued relevance in various surveying applications. These figures illustrate the 3D Mobile Mapping Market segmentation, with Urban Planning, Transportation and Logistics, and Construction dominating the scene due to their respective futures tied closely to urban growth, improved logistics, and construction advancements.

    The growing need for procurement and implementation of 3D mobile mapping technologies across these sectors further amplifies the potential for market growth, with increasing investments in infrastructure and technological advancement serving as key drivers for success. The challenges faced may include the integration of such technologies into existing workflows, along with the need for skilled personnel.

    However, heightened opportunities are evident as industries recognize the importance of precise data acquisition, driving the demand for advanced mapping solutions. Overall, the application segment of the 3D Mobile Mapping Market continues to show a compelling trajectory, with varied applications adapting to the evolving needs of different sectors.

    3D Mobile Mapping Market Technology Insights

    The 3D Mobile Mapping Market is expected to show significant growth and reach a valuation of 3.81 USD Billion by 2023, with projections indicating it could expand further to 9.8 USD Billion by 2032. This growth is primarily driven by advancements in technology, which enhance the accuracy and efficiency of mapping processes. Various technologies contribute to this market, including LiDAR, Photogrammetry, GPS, and Computer Vision, each playing a vital role in the industry's expansion. LiDAR, for example, is essential for precise elevation mapping and landscape modeling, making it a preferred choice for several applications in urban planning and forestry.

    Similarly, Photogrammetry offers a cost-effective method for generating 3D models from images, which has become increasingly popular in surveying and construction sectors. GPS continues to be a cornerstone technology providing location accuracy critical for mobile mapping.

    Computer Vision, on the other hand, has gained traction due to its capability to analyze visual data, enabling real-time mapping solutions. The market growth is further supported by the increasing demand for accurate geographic data across various industries, creating a multitude of opportunities for stakeholders in the 3D Mobile Mapping Market industry. Overall, the 3D Mobile Mapping Market segmentation reflects a diverse array of technologies that collectively push the boundaries of mobile mapping applications.

    3D Mobile Mapping Market Deployment Type Insights

    The 3D Mobile Mapping Market, particularly in the Deployment Type segment, has shown notable growth potential as it moved from a valuation of 3.81 billion USD in 2023 to projected figures nearing 9.8 billion USD by 2032. Within this segment, Cloud-Based deployment has been gaining significant traction due to its scalable nature, enabling organizations to manage vast amounts of data efficiently and access mapping solutions from anywhere. The On-Premises segment, while traditionally favored for data privacy and security, continues to hold importance in scenarios requiring local data processing and control.

    The evolving preferences towards Cloud-Based solutions reflect broader market trends focused on accessibility, real-time data processing, and cost-effectiveness. As businesses increasingly recognize the advantages of cloud services, the dynamics of the 3D Mobile Mapping Market suggest a transformation that balances the benefits of both deployment types according to specific operational needs. These market statistics highlight the growing relevance and adaptability of various deployment types, addressing diverse industry requirements.

    3D Mobile Mapping Market End Use Industry Insights

    The 3D Mobile Mapping Market, valued at 3.81 USD Billion in 2023, is experiencing significant growth driven by various end-use industries. Government applications increasingly utilize mobile mapping for urban planning, public works, and environmental monitoring, facilitating enhanced decision-making and efficiency. The construction sector benefits from accurate mapping for site surveys, project management, and safety improvements, contributing to reduced costs and project timelines. Transportation, a crucial area, relies on this technology to enhance navigation systems, traffic management, and infrastructure assessment, thereby improving operational efficiency.

    The energy sector applies mobile mapping for asset management, site inspections, and network optimization, ensuring the constant delivery of services. Telecommunications companies utilize mobile mapping to streamline the installation and maintenance of communication networks, making it easier to assess site conditions and plan deployment effectively. The integration of 3D Mobile Mapping technology across these industries indicates strong market growth and opportunities for innovation, as each sector seeks to harness accurate data for better operational outcomes.

    As the 3D Mobile Mapping Market segmentation expands, these industries will continue to play a pivotal role in market dynamics, reflecting broader trends of digital transformation and data-driven decision-making.

    Get more detailed insights about 3D Mobile Mapping Market Research Report - Global Forecast till 2034

    Regional Insights

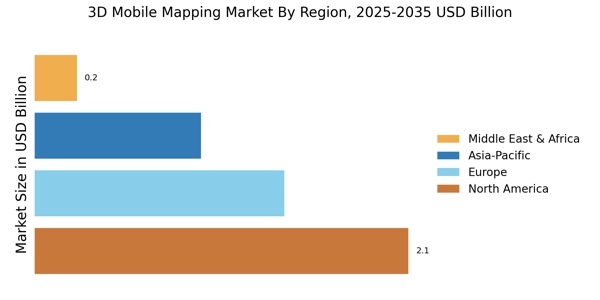
    The 3D Mobile Mapping Market is experiencing substantial growth driven by advancements in technology and growing applications in various fields. In 2023, the North American segment led the way with a valuation of 1.149 USD Billion, reflecting its significant role, driven by infrastructure projects and technological innovation. Europe followed closely with a market value of 0.935 USD Billion, benefiting from investments in urban development and smart city initiatives. The APAC region, valued at 0.832 USD Billion, shows potential due to rapid urbanization and enhanced logistics requirements, marking it as an emerging player in this sector.

    South America and MEA segments valued at 0.317 USD Billion and 0.578 USD Billion respectively, represent niche markets with opportunities driven by regional development projects. The overall 3D Mobile Mapping Market segmentation indicates strong growth across all regions, with North America dominating due to its technological edge and broad applications across multiple industries, underscoring the importance of this market. The market dynamics highlight both opportunities and challenges in effectively harnessing these technologies for various applications.

    Source: Primary Research, Secondary Research, Market Research Future Database and Analyst Review

    Key Players and Competitive Insights

    The 3D Mobile Mapping Market is characterized by rapid technological advancements and increasing applications across various industries such as transportation, construction, and urban planning. As companies strive to achieve higher accuracy and efficiency in capturing spatial data, a range of competitors are vying for market share. 

    The competition is particularly intense among firms that are innovating in sensor technology, data processing capabilities, and integration of artificial intelligence in mapping solutions. The market dynamics are also influenced by partnerships and collaborations, where companies join forces with tech providers and industry leaders to enhance their product offerings. Furthermore, the increasing adoption of autonomous vehicles and smart city initiatives has catalyzed demand for advanced mobile mapping systems, intensifying the competitive landscape as firms seek to differentiate their services and technologies.

    Leica Geosystems holds a prominent position in the 3D Mobile Mapping Market, leveraging its rich legacy in precision measurement and cutting-edge technology.

    The company's strength lies in its comprehensive suite of mobile mapping solutions that combine robust hardware with sophisticated software capabilities. Leica Geosystems is known for its high-performance LiDAR systems and integrated software that provide seamless data collection and processing, thereby enhancing the accuracy and productivity of mapping projects. Additionally, the company's commitment to R&D allows it to stay at the forefront of technological advancements, continuously delivering upgraded products that address the evolving needs of customers. Leica Geosystems’ extensive experience in geospatial data recognizes it as a trusted partner across various sectors, further solidifying its competitive edge.

    Velodyne Lidar plays a significant role in the 3D Mobile Mapping Market, renowned for its pioneering contributions to lidar technology.

    Velodyne's innovative 3D sensors are designed to enable real-time data capture, which is crucial for effective mapping and navigation applications. The company has positioned itself as a leader in high-resolution lidar systems that provide unparalleled detail and accuracy, making them attractive for businesses focused on autonomous vehicles and urban development projects. Notably, Velodyne Lidar’s versatility in product offerings allows it to cater to diverse applications ranging from industrial automation to public safety. The firm’s dedication to improving sensor performance and expanding its product lineup contributes to its competitive strength, attracting partnerships and collaborations that further enhance its market presence.

    Key Companies in the 3D Mobile Mapping Market market include

    Industry Developments

    Recent developments in the 3D Mobile Mapping Market showcase dynamic growth driven by advancements in technology and increasing demand from various sectors such as construction, agriculture, and urban planning. Companies like Leica Geosystems and Trimble are expanding their product portfolios, incorporating advanced software and hardware capabilities. Velodyne Lidar recently gained attention for its innovative lidar sensing technology that significantly enhances data accuracy in mapping applications. FARO Technologies continues to invest in R&D, bolstering its position in the competitive landscape. 

    Significant mergers and acquisitions have also been noted, such as the strategic acquisition initiatives by Topcon to enhance its market presence and capabilities. SenseFly is gaining traction through collaborations aimed at integrating drone technology with mobile mapping solutions. Market valuations for firms like Teledyne Optech and RIEGL are witnessing upward momentum, reflecting investor confidence and growing industry demand. Companies like Pix4D and GeoSLAM are focusing on customer-centric solutions, further driving the market expansion. The increase in various applications for 3D mobile mapping technologies is shaping significant opportunities for growth and innovation in the sector.

    Future Outlook

    3D Mobile Mapping Market Future Outlook

    The 3D Mobile Mapping Market is projected to grow at an 11.15% CAGR from 2024 to 2035, driven by advancements in technology and increasing demand for geospatial data.

    New opportunities lie in:

    • Develop AI-driven analytics tools for enhanced data interpretation.
    • Expand into emerging markets with tailored mobile mapping solutions.
    • Leverage partnerships with urban planners for smart city initiatives.

    By 2035, the 3D Mobile Mapping Market is expected to achieve substantial growth, reflecting its critical role in various industries.

    Market Segmentation

    3D Mobile Mapping Market Regional Outlook

    • North America
    • Europe
    • South America
    • Asia Pacific
    • Middle East and Africa

    3D Mobile Mapping Market Technology Outlook

    • LiDAR
    • Photogrammetry
    • GPS
    • Computer Vision

    3D Mobile Mapping Market Application Outlook

    • Urban Planning
    • Transportation and Logistics
    • Construction
    • Mining
    • Surveying

    3D Mobile Mapping Market Deployment Type Outlook

    • Cloud-Based
    • On-Premises

    3D Mobile Mapping Market End Use Industry Outlook

    • Government
    • Construction
    • Transportation
    • Energy
    • Telecommunications

    Report Scope

    Report Attribute/Metric Details
    Market Size 2024 4.70 (USD Billion)
    Market Size 2025 5.22 (USD Billion)
    Market Size 2034 13.44 (USD Billion)
    Compound Annual Growth Rate (CAGR) 11.82% (2025 - 2034)
    Report Coverage Revenue Forecast, Competitive Landscape, Growth Factors, and Trends
    Base Year 2024
    Market Forecast Period 2025 - 2034
    Historical Data 2019 - 2023
    Market Forecast Units USD Billion
    Key Companies Profiled Leica Geosystems, Velodyne Lidar, FARO Technologies, RIEGL, Topcon, SenseFly, NCTech, Cyclomedia, Paracosm, Trimble, Teledyne Optech, Maptek, Pix4D, GeoSLAM, Aerial Innovations
    Segments Covered Application, Technology, Deployment Type, End Use Industry, Regional
    Key Market Opportunities Increased demand in urban planning, Growth in autonomous vehicle applications, Expansion of infrastructure monitoring, Rising adoption in GIS solutions, Advancements in sensor technologies
    Key Market Dynamics Rising demand for accurate mapping, Advances in sensor technologies, Increasing adoption in various industries, Growing need for automated data collection, Expansion of smart city initiatives
    Countries Covered North America, Europe, APAC, South America, MEA

    Market Highlights

    Author
    Aarti Dhapte
    Team Lead - Research

    She holds an experience of about 6+ years in Market Research and Business Consulting, working under the spectrum of Information Communication Technology, Telecommunications and Semiconductor domains. Aarti conceptualizes and implements a scalable business strategy and provides strategic leadership to the clients. Her expertise lies in market estimation, competitive intelligence, pipeline analysis, customer assessment, etc.

    Leave a Comment

    FAQs

    What is the projected market size of the 3D Mobile Mapping Market by 2034?

    The 3D Mobile Mapping Market is expected to reach a value of 13.44 billion USD by 2034.

    What is the expected CAGR for the 3D Mobile Mapping Market from 2025 to 2034?

    The anticipated CAGR for the 3D Mobile Mapping Market from 2025 to 2034 is 11.82%.

    Which region will hold the largest market share in the 3D Mobile Mapping Market by 2034?

    North America is projected to hold the largest market share, valued at 13.44 billion USD by 2034.

    What will be the market value for the Urban Planning application in 2032?

    The market value for the Urban Planning application is expected to reach 1.993 billion USD by 2032.

    What is the estimated market size for the Construction application in 2032?

    The estimated market size for the Construction application in 2032 will be 2.492 billion USD.

    Who are the key players in the 3D Mobile Mapping Market?

    Major players in the market include Leica Geosystems, Velodyne Lidar, FARO Technologies, and Trimble.

    What is the expected market value of the Transportation and Logistics application by 2032?

    The expected market value of the Transportation and Logistics application is projected to be 2.325 billion USD by 2032.

    What will be the market size for the Mining application in 2032?

    The market size for the Mining application is expected to increase to 1.578 billion USD by 2032.

    What is the projected market value for the MEA region in 2032?

    The projected market value for the MEA region is expected to reach 1.282 billion USD by 2032.

    What is the market value for Surveying applications in 2032?

    The market value for the Surveying application is anticipated to be 1.412 billion USD by 2032.

    1. EXECUTIVE SUMMARY
    2. Market Overview
      1. Key Findings
      2. Market Segmentation
    3. Competitive Landscape
      1. Challenges and Opportunities
      2. Future Outlook
    4. MARKET INTRODUCTION
      1. Definition
      2. Scope of the study
        1. Research Objective
        2. Assumption
        3. Limitations
    5. RESEARCH METHODOLOGY
      1. Overview
    6. Data Mining
      1. Secondary Research
      2. Primary Research
    7. Primary Interviews and Information Gathering Process
      1. Breakdown of Primary
    8. Respondents
      1. Forecasting Model
      2. Market Size Estimation
    9. Bottom-Up Approach
      1. Top-Down Approach
      2. Data Triangulation
      3. Validation
    10. MARKET DYNAMICS
      1. Overview
      2. Drivers
      3. Restraints
      4. Opportunities
    11. MARKET FACTOR ANALYSIS
      1. Value chain Analysis
      2. Porter's Five Forces
    12. Analysis
      1. Bargaining Power of Suppliers
        1. Bargaining Power
    13. of Buyers
      1. Threat of New Entrants
        1. Threat of Substitutes
        2. Intensity of Rivalry
      2. COVID-19 Impact Analysis
    14. Market Impact Analysis
      1. Regional Impact
        1. Opportunity and
    15. Threat Analysis
    16. 3D Mobile Mapping Market, BY Application
    17. (USD Billion)
      1. Urban Planning
      2. Transportation and Logistics
      3. Construction
      4. Mining
      5. Surveying
    18. 3D Mobile
    19. Mapping Market, BY Technology (USD Billion)
      1. LiDAR
      2. Photogrammetry
      3. GPS
      4. Computer Vision
    20. 3D Mobile Mapping Market, BY
    21. Deployment Type (USD Billion)
      1. Cloud-Based
      2. On-Premises
    22. 3D Mobile Mapping Market, BY End Use Industry (USD Billion)
      1. Government
      2. Construction
      3. Transportation
      4. Energy
      5. Telecommunications
    23. 3D Mobile Mapping Market, BY Regional (USD Billion)
      1. North
    24. America
      1. US
        1. Canada
      2. Europe
        1. Germany
        2. UK
        3. France
        4. Russia
        5. Italy
        6. Spain
        7. Rest of Europe
      3. APAC
        1. China
        2. India
        3. Japan
        4. South Korea
    25. Malaysia
      1. Thailand
        1. Indonesia
        2. Rest of APAC
      2. South America
        1. Brazil
        2. Mexico
    26. Argentina
      1. Rest of South America
      2. MEA
        1. GCC
    27. Countries
      1. South Africa
        1. Rest of MEA
    28. Competitive Landscape
      1. Overview
      2. Competitive Analysis
      3. Market share Analysis
      4. Major Growth Strategy in the 3D Mobile
    29. Mapping Market
      1. Competitive Benchmarking
      2. Leading Players
    30. in Terms of Number of Developments in the 3D Mobile Mapping Market
      1. Key
    31. developments and growth strategies
      1. New Product Launch/Service Deployment
        1. Merger & Acquisitions
        2. Joint Ventures
    32. Major Players Financial Matrix
      1. Sales and Operating Income
    33. Major Players R&D Expenditure. 2023
    34. Company Profiles
      1. Leica
    35. Geosystems
      1. Financial Overview
        1. Products Offered
    36. Key Developments
      1. SWOT Analysis
        1. Key Strategies
    37. Velodyne Lidar
      1. Financial Overview
        1. Products Offered
        2. Key Developments
        3. SWOT Analysis
        4. Key Strategies
      2. FARO Technologies
        1. Financial Overview
        2. Products
    38. Offered
      1. Key Developments
        1. SWOT Analysis
    39. Key Strategies
      1. RIEGL
        1. Financial Overview
    40. Products Offered
      1. Key Developments
        1. SWOT Analysis
        2. Key Strategies
      2. Topcon
        1. Financial Overview
        2. Products Offered
        3. Key Developments
        4. SWOT Analysis
        5. Key Strategies
      3. SenseFly
        1. Financial Overview
        2. Products Offered
        3. Key Developments
        4. SWOT
    41. Analysis
      1. Key Strategies
      2. NCTech
        1. Financial
    42. Overview
      1. Products Offered
        1. Key Developments
    43. SWOT Analysis
      1. Key Strategies
      2. Cyclomedia
    44. Financial Overview
      1. Products Offered
        1. Key Developments
        2. SWOT Analysis
        3. Key Strategies
      2. Paracosm
        1. Financial Overview
        2. Products Offered
        3. Key Developments
        4. SWOT Analysis
        5. Key Strategies
      3. Trimble
        1. Financial Overview
        2. Products Offered
        3. Key
    45. Developments
      1. SWOT Analysis
        1. Key Strategies
    46. Teledyne Optech
      1. Financial Overview
        1. Products Offered
        2. Key Developments
        3. SWOT Analysis
        4. Key
    47. Strategies
      1. Maptek
        1. Financial Overview
    48. Products Offered
      1. Key Developments
        1. SWOT Analysis
        2. Key Strategies
      2. Pix4D
        1. Financial Overview
        2. Products Offered
        3. Key Developments
        4. SWOT
    49. Analysis
      1. Key Strategies
      2. GeoSLAM
        1. Financial
    50. Overview
      1. Products Offered
        1. Key Developments
    51. SWOT Analysis
      1. Key Strategies
      2. Aerial Innovations
        1. Financial Overview
        2. Products Offered
        3. Key
    52. Developments
      1. SWOT Analysis
        1. Key Strategies
      2. References
      3. Related Reports
    53. Market SIZE ESTIMATES & FORECAST, BY APPLICATION, 2019-2032 (USD Billions)
    54. BY TECHNOLOGY, 2019-2032 (USD Billions)
    55. Market SIZE ESTIMATES & FORECAST, BY DEPLOYMENT TYPE, 2019-2032 (USD Billions)
    56. BY END USE INDUSTRY, 2019-2032 (USD Billions)
    57. Mapping Market SIZE ESTIMATES & FORECAST, BY REGIONAL, 2019-2032 (USD Billions)
    58. 2032 (USD Billions)
    59. & FORECAST, BY TECHNOLOGY, 2019-2032 (USD Billions)
    60. Mapping Market SIZE ESTIMATES & FORECAST, BY DEPLOYMENT TYPE, 2019-2032 (USD
    61. Billions)
    62. BY END USE INDUSTRY, 2019-2032 (USD Billions)
    63. Market SIZE ESTIMATES & FORECAST, BY REGIONAL, 2019-2032 (USD Billions)
    64. 2032 (USD Billions)
    65. & FORECAST, BY TECHNOLOGY, 2019-2032 (USD Billions)
    66. Mobile Mapping Market SIZE ESTIMATES & FORECAST, BY DEPLOYMENT TYPE, 2019-2032
    67. (USD Billions)
    68. FORECAST, BY END USE INDUSTRY, 2019-2032 (USD Billions)
    69. Mobile Mapping Market SIZE ESTIMATES & FORECAST, BY REGIONAL, 2019-2032 (USD
    70. Billions)
    71. BY APPLICATION, 2019-2032 (USD Billions)
    72. Market SIZE ESTIMATES & FORECAST, BY TECHNOLOGY, 2019-2032 (USD Billions)
    73. TYPE, 2019-2032 (USD Billions)
    74. ESTIMATES & FORECAST, BY END USE INDUSTRY, 2019-2032 (USD Billions)
    75. Europe 3D Mobile Mapping Market SIZE ESTIMATES & FORECAST, BY REGIONAL,
    76. 2032 (USD Billions)
    77. & FORECAST, BY APPLICATION, 2019-2032 (USD Billions)
    78. D Mobile Mapping Market SIZE ESTIMATES & FORECAST, BY TECHNOLOGY, 2019-2032
    79. (USD Billions)
    80. FORECAST, BY DEPLOYMENT TYPE, 2019-2032 (USD Billions)
    81. Mobile Mapping Market SIZE ESTIMATES & FORECAST, BY END USE INDUSTRY, 2019-2032
    82. (USD Billions)
    83. FORECAST, BY REGIONAL, 2019-2032 (USD Billions)
    84. Market SIZE ESTIMATES & FORECAST, BY APPLICATION, 2019-2032 (USD Billions)
    85. 2032 (USD Billions)
    86. & FORECAST, BY DEPLOYMENT TYPE, 2019-2032 (USD Billions)
    87. D Mobile Mapping Market SIZE ESTIMATES & FORECAST, BY END USE INDUSTRY, 2019-2032
    88. (USD Billions)
    89. FORECAST, BY REGIONAL, 2019-2032 (USD Billions)
    90. Mapping Market SIZE ESTIMATES & FORECAST, BY APPLICATION, 2019-2032 (USD Billions)
    91. TECHNOLOGY, 2019-2032 (USD Billions)
    92. SIZE ESTIMATES & FORECAST, BY DEPLOYMENT TYPE, 2019-2032 (USD Billions)
    93. USE INDUSTRY, 2019-2032 (USD Billions)
    94. Market SIZE ESTIMATES & FORECAST, BY REGIONAL, 2019-2032 (USD Billions)
    95. 2032 (USD Billions)
    96. & FORECAST, BY TECHNOLOGY, 2019-2032 (USD Billions)
    97. Mobile Mapping Market SIZE ESTIMATES & FORECAST, BY DEPLOYMENT TYPE, 2019-2032
    98. (USD Billions)
    99. FORECAST, BY END USE INDUSTRY, 2019-2032 (USD Billions)
    100. Mobile Mapping Market SIZE ESTIMATES & FORECAST, BY REGIONAL, 2019-2032 (USD
    101. Billions)
    102. BY APPLICATION, 2019-2032 (USD Billions)
    103. Market SIZE ESTIMATES & FORECAST, BY TECHNOLOGY, 2019-2032 (USD Billions)
    104. TYPE, 2019-2032 (USD Billions)
    105. ESTIMATES & FORECAST, BY END USE INDUSTRY, 2019-2032 (USD Billions)
    106. Italy 3D Mobile Mapping Market SIZE ESTIMATES & FORECAST, BY REGIONAL, 2019-2032
    107. (USD Billions)
    108. FORECAST, BY APPLICATION, 2019-2032 (USD Billions)
    109. Mapping Market SIZE ESTIMATES & FORECAST, BY TECHNOLOGY, 2019-2032 (USD Billions)
    110. DEPLOYMENT TYPE, 2019-2032 (USD Billions)
    111. Market SIZE ESTIMATES & FORECAST, BY END USE INDUSTRY, 2019-2032 (USD Billions)
    112. REGIONAL, 2019-2032 (USD Billions)
    113. Market SIZE ESTIMATES & FORECAST, BY APPLICATION, 2019-2032 (USD Billions)
    114. BY TECHNOLOGY, 2019-2032 (USD Billions)
    115. Mapping Market SIZE ESTIMATES & FORECAST, BY DEPLOYMENT TYPE, 2019-2032 (USD
    116. Billions)
    117. & FORECAST, BY END USE INDUSTRY, 2019-2032 (USD Billions)
    118. of Europe 3D Mobile Mapping Market SIZE ESTIMATES & FORECAST, BY REGIONAL, 2019-2032
    119. (USD Billions)
    120. FORECAST, BY APPLICATION, 2019-2032 (USD Billions)
    121. Mapping Market SIZE ESTIMATES & FORECAST, BY TECHNOLOGY, 2019-2032 (USD Billions)
    122. DEPLOYMENT TYPE, 2019-2032 (USD Billions)
    123. Market SIZE ESTIMATES & FORECAST, BY END USE INDUSTRY, 2019-2032 (USD Billions)
    124. REGIONAL, 2019-2032 (USD Billions)
    125. SIZE ESTIMATES & FORECAST, BY APPLICATION, 2019-2032 (USD Billions)
    126. China 3D Mobile Mapping Market SIZE ESTIMATES & FORECAST, BY TECHNOLOGY,
    127. 2032 (USD Billions)
    128. & FORECAST, BY DEPLOYMENT TYPE, 2019-2032 (USD Billions)
    129. D Mobile Mapping Market SIZE ESTIMATES & FORECAST, BY END USE INDUSTRY, 2019-2032
    130. (USD Billions)
    131. FORECAST, BY REGIONAL, 2019-2032 (USD Billions)
    132. Mapping Market SIZE ESTIMATES & FORECAST, BY APPLICATION, 2019-2032 (USD Billions)
    133. TECHNOLOGY, 2019-2032 (USD Billions)
    134. SIZE ESTIMATES & FORECAST, BY DEPLOYMENT TYPE, 2019-2032 (USD Billions)
    135. USE INDUSTRY, 2019-2032 (USD Billions)
    136. SIZE ESTIMATES & FORECAST, BY REGIONAL, 2019-2032 (USD Billions)
    137. Japan 3D Mobile Mapping Market SIZE ESTIMATES & FORECAST, BY APPLICATION,
    138. 2032 (USD Billions)
    139. & FORECAST, BY TECHNOLOGY, 2019-2032 (USD Billions)
    140. Mobile Mapping Market SIZE ESTIMATES & FORECAST, BY DEPLOYMENT TYPE, 2019-2032
    141. (USD Billions)
    142. FORECAST, BY END USE INDUSTRY, 2019-2032 (USD Billions)
    143. Mobile Mapping Market SIZE ESTIMATES & FORECAST, BY REGIONAL, 2019-2032 (USD
    144. Billions)
    145. FORECAST, BY APPLICATION, 2019-2032 (USD Billions)
    146. Mobile Mapping Market SIZE ESTIMATES & FORECAST, BY TECHNOLOGY, 2019-2032 (USD
    147. Billions)
    148. FORECAST, BY DEPLOYMENT TYPE, 2019-2032 (USD Billions)
    149. D Mobile Mapping Market SIZE ESTIMATES & FORECAST, BY END USE INDUSTRY, 2019-2032
    150. (USD Billions)
    151. & FORECAST, BY REGIONAL, 2019-2032 (USD Billions)
    152. Mobile Mapping Market SIZE ESTIMATES & FORECAST, BY APPLICATION, 2019-2032 (USD
    153. Billions)
    154. FORECAST, BY TECHNOLOGY, 2019-2032 (USD Billions)
    155. Mapping Market SIZE ESTIMATES & FORECAST, BY DEPLOYMENT TYPE, 2019-2032 (USD
    156. Billions)
    157. FORECAST, BY END USE INDUSTRY, 2019-2032 (USD Billions)
    158. D Mobile Mapping Market SIZE ESTIMATES & FORECAST, BY REGIONAL, 2019-2032 (USD
    159. Billions)
    160. FORECAST, BY APPLICATION, 2019-2032 (USD Billions)
    161. Mapping Market SIZE ESTIMATES & FORECAST, BY TECHNOLOGY, 2019-2032 (USD Billions)
    162. BY DEPLOYMENT TYPE, 2019-2032 (USD Billions)
    163. Mapping Market SIZE ESTIMATES & FORECAST, BY END USE INDUSTRY, 2019-2032 (USD
    164. Billions)
    165. FORECAST, BY REGIONAL, 2019-2032 (USD Billions)
    166. Mapping Market SIZE ESTIMATES & FORECAST, BY APPLICATION, 2019-2032 (USD Billions)
    167. BY TECHNOLOGY, 2019-2032 (USD Billions)
    168. Market SIZE ESTIMATES & FORECAST, BY DEPLOYMENT TYPE, 2019-2032 (USD Billions)
    169. BY END USE INDUSTRY, 2019-2032 (USD Billions)
    170. Mapping Market SIZE ESTIMATES & FORECAST, BY REGIONAL, 2019-2032 (USD Billions)
    171. BY APPLICATION, 2019-2032 (USD Billions)
    172. Mapping Market SIZE ESTIMATES & FORECAST, BY TECHNOLOGY, 2019-2032 (USD Billions)
    173. BY DEPLOYMENT TYPE, 2019-2032 (USD Billions)
    174. Mapping Market SIZE ESTIMATES & FORECAST, BY END USE INDUSTRY, 2019-2032 (USD
    175. Billions)
    176. & FORECAST, BY REGIONAL, 2019-2032 (USD Billions)
    177. D Mobile Mapping Market SIZE ESTIMATES & FORECAST, BY APPLICATION, 2019-2032
    178. (USD Billions)
    179. & FORECAST, BY TECHNOLOGY, 2019-2032 (USD Billions)
    180. D Mobile Mapping Market SIZE ESTIMATES & FORECAST, BY DEPLOYMENT TYPE, 2019-2032
    181. (USD Billions)
    182. & FORECAST, BY END USE INDUSTRY, 2019-2032 (USD Billions)
    183. America 3D Mobile Mapping Market SIZE ESTIMATES & FORECAST, BY REGIONAL, 2019-2032
    184. (USD Billions)
    185. FORECAST, BY APPLICATION, 2019-2032 (USD Billions)
    186. Mapping Market SIZE ESTIMATES & FORECAST, BY TECHNOLOGY, 2019-2032 (USD Billions)
    187. BY DEPLOYMENT TYPE, 2019-2032 (USD Billions)
    188. Market SIZE ESTIMATES & FORECAST, BY END USE INDUSTRY, 2019-2032 (USD Billions)
    189. BY REGIONAL, 2019-2032 (USD Billions)
    190. Market SIZE ESTIMATES & FORECAST, BY APPLICATION, 2019-2032 (USD Billions)
    191. 2032 (USD Billions)
    192. & FORECAST, BY DEPLOYMENT TYPE, 2019-2032 (USD Billions)
    193. D Mobile Mapping Market SIZE ESTIMATES & FORECAST, BY END USE INDUSTRY, 2019-2032
    194. (USD Billions)
    195. FORECAST, BY REGIONAL, 2019-2032 (USD Billions)
    196. Mapping Market SIZE ESTIMATES & FORECAST, BY APPLICATION, 2019-2032 (USD Billions)
    197. BY TECHNOLOGY, 2019-2032 (USD Billions)
    198. Market SIZE ESTIMATES & FORECAST, BY DEPLOYMENT TYPE, 2019-2032 (USD Billions)
    199. BY END USE INDUSTRY, 2019-2032 (USD Billions)
    200. Mapping Market SIZE ESTIMATES & FORECAST, BY REGIONAL, 2019-2032 (USD Billions)
    201. FORECAST, BY APPLICATION, 2019-2032 (USD Billions)
    202. America 3D Mobile Mapping Market SIZE ESTIMATES & FORECAST, BY TECHNOLOGY, 2019-2032
    203. (USD Billions)
    204. ESTIMATES & FORECAST, BY DEPLOYMENT TYPE, 2019-2032 (USD Billions)
    205. Rest of South America 3D Mobile Mapping Market SIZE ESTIMATES & FORECAST,
    206. BY END USE INDUSTRY, 2019-2032 (USD Billions)
    207. D Mobile Mapping Market SIZE ESTIMATES & FORECAST, BY REGIONAL, 2019-2032 (USD
    208. Billions)
    209. BY APPLICATION, 2019-2032 (USD Billions)
    210. Market SIZE ESTIMATES & FORECAST, BY TECHNOLOGY, 2019-2032 (USD Billions)
    211. TYPE, 2019-2032 (USD Billions)
    212. ESTIMATES & FORECAST, BY END USE INDUSTRY, 2019-2032 (USD Billions)
    213. MEA 3D Mobile Mapping Market SIZE ESTIMATES & FORECAST, BY REGIONAL, 2019-2032
    214. (USD Billions)
    215. & FORECAST, BY APPLICATION, 2019-2032 (USD Billions)
    216. D Mobile Mapping Market SIZE ESTIMATES & FORECAST, BY TECHNOLOGY, 2019-2032
    217. (USD Billions)
    218. & FORECAST, BY DEPLOYMENT TYPE, 2019-2032 (USD Billions)
    219. Countries 3D Mobile Mapping Market SIZE ESTIMATES & FORECAST, BY END USE INDUSTRY,
    220. 2032 (USD Billions)
    221. SIZE ESTIMATES & FORECAST, BY REGIONAL, 2019-2032 (USD Billions)
    222. South Africa 3D Mobile Mapping Market SIZE ESTIMATES & FORECAST, BY APPLICATION,
    223. 2032 (USD Billions)
    224. SIZE ESTIMATES & FORECAST, BY TECHNOLOGY, 2019-2032 (USD Billions)
    225. South Africa 3D Mobile Mapping Market SIZE ESTIMATES & FORECAST, BY DEPLOYMENT
    226. TYPE, 2019-2032 (USD Billions)
    227. SIZE ESTIMATES & FORECAST, BY END USE INDUSTRY, 2019-2032 (USD Billions)
    228. BY REGIONAL, 2019-2032 (USD Billions)
    229. Market SIZE ESTIMATES & FORECAST, BY APPLICATION, 2019-2032 (USD Billions)
    230. BY TECHNOLOGY, 2019-2032 (USD Billions)
    231. Market SIZE ESTIMATES & FORECAST, BY DEPLOYMENT TYPE, 2019-2032 (USD Billions)
    232. BY END USE INDUSTRY, 2019-2032 (USD Billions)
    233. Mapping Market SIZE ESTIMATES & FORECAST, BY REGIONAL, 2019-2032 (USD Billions)
    234. NORTH AMERICA 3D MOBILE MAPPING MARKET ANALYSIS
    235. MAPPING MARKET ANALYSIS BY APPLICATION
    236. ANALYSIS BY TECHNOLOGY
    237. TYPE
    238. D MOBILE MAPPING MARKET ANALYSIS BY APPLICATION
    239. MAPPING MARKET ANALYSIS BY TECHNOLOGY
    240. MARKET ANALYSIS BY DEPLOYMENT TYPE
    241. ANALYSIS BY END USE INDUSTRY
    242. BY REGIONAL
    243. GERMANY 3D MOBILE MAPPING MARKET ANALYSIS BY APPLICATION
    244. D MOBILE MAPPING MARKET ANALYSIS BY TECHNOLOGY
    245. MAPPING MARKET ANALYSIS BY DEPLOYMENT TYPE
    246. MARKET ANALYSIS BY END USE INDUSTRY
    247. ANALYSIS BY REGIONAL
    248. UK 3D MOBILE MAPPING MARKET ANALYSIS BY DEPLOYMENT TYPE
    249. D MOBILE MAPPING MARKET ANALYSIS BY END USE INDUSTRY
    250. MAPPING MARKET ANALYSIS BY REGIONAL
    251. ANALYSIS BY APPLICATION
    252. BY TECHNOLOGY
    253. TYPE
    254. RUSSIA 3D MOBILE MAPPING MARKET ANALYSIS BY APPLICATION
    255. D MOBILE MAPPING MARKET ANALYSIS BY TECHNOLOGY
    256. MAPPING MARKET ANALYSIS BY DEPLOYMENT TYPE
    257. MARKET ANALYSIS BY END USE INDUSTRY
    258. ANALYSIS BY REGIONAL
    259. APPLICATION
    260. ITALY 3D MOBILE MAPPING MARKET ANALYSIS BY REGIONAL
    261. MOBILE MAPPING MARKET ANALYSIS BY APPLICATION
    262. MARKET ANALYSIS BY TECHNOLOGY
    263. BY DEPLOYMENT TYPE
    264. USE INDUSTRY
    265. TYPE
    266. INDUSTRY
    267. MOBILE MAPPING MARKET ANALYSIS BY APPLICATION
    268. MARKET ANALYSIS BY TECHNOLOGY
    269. BY DEPLOYMENT TYPE
    270. USE INDUSTRY
    271. INDIA 3D MOBILE MAPPING MARKET ANALYSIS BY TECHNOLOGY
    272. D MOBILE MAPPING MARKET ANALYSIS BY DEPLOYMENT TYPE
    273. MAPPING MARKET ANALYSIS BY END USE INDUSTRY
    274. MARKET ANALYSIS BY REGIONAL
    275. BY APPLICATION
    276. JAPAN 3D MOBILE MAPPING MARKET ANALYSIS BY REGIONAL
    277. D MOBILE MAPPING MARKET ANALYSIS BY APPLICATION
    278. MOBILE MAPPING MARKET ANALYSIS BY TECHNOLOGY
    279. MAPPING MARKET ANALYSIS BY DEPLOYMENT TYPE
    280. MAPPING MARKET ANALYSIS BY END USE INDUSTRY
    281. MAPPING MARKET ANALYSIS BY REGIONAL
    282. MARKET ANALYSIS BY APPLICATION
    283. ANALYSIS BY TECHNOLOGY
    284. BY DEPLOYMENT TYPE
    285. END USE INDUSTRY
    286. REGIONAL
    287. THAILAND 3D MOBILE MAPPING MARKET ANALYSIS BY DEPLOYMENT TYPE
    288. THAILAND 3D MOBILE MAPPING MARKET ANALYSIS BY END USE INDUSTRY
    289. THAILAND 3D MOBILE MAPPING MARKET ANALYSIS BY REGIONAL
    290. D MOBILE MAPPING MARKET ANALYSIS BY APPLICATION
    291. MAPPING MARKET ANALYSIS BY TECHNOLOGY
    292. MARKET ANALYSIS BY DEPLOYMENT TYPE
    293. MARKET ANALYSIS BY END USE INDUSTRY
    294. MARKET ANALYSIS BY REGIONAL
    295. ANALYSIS BY APPLICATION
    296. BY TECHNOLOGY
    297. DEPLOYMENT TYPE
    298. BY END USE INDUSTRY
    299. BY REGIONAL
    300. BRAZIL 3D MOBILE MAPPING MARKET ANALYSIS BY TECHNOLOGY
    301. D MOBILE MAPPING MARKET ANALYSIS BY DEPLOYMENT TYPE
    302. MOBILE MAPPING MARKET ANALYSIS BY END USE INDUSTRY
    303. MAPPING MARKET ANALYSIS BY REGIONAL
    304. ANALYSIS BY APPLICATION
    305. BY TECHNOLOGY
    306. TYPE
    307. ARGENTINA 3D MOBILE MAPPING MARKET ANALYSIS BY APPLICATION
    308. ARGENTINA 3D MOBILE MAPPING MARKET ANALYSIS BY TECHNOLOGY
    309. D MOBILE MAPPING MARKET ANALYSIS BY DEPLOYMENT TYPE
    310. D MOBILE MAPPING MARKET ANALYSIS BY END USE INDUSTRY
    311. D MOBILE MAPPING MARKET ANALYSIS BY REGIONAL
    312. D MOBILE MAPPING MARKET ANALYSIS BY APPLICATION
    313. AMERICA 3D MOBILE MAPPING MARKET ANALYSIS BY TECHNOLOGY
    314. SOUTH AMERICA 3D MOBILE MAPPING MARKET ANALYSIS BY DEPLOYMENT TYPE
    315. REST OF SOUTH AMERICA 3D MOBILE MAPPING MARKET ANALYSIS BY END USE INDUSTRY
    316. D MOBILE MAPPING MARKET ANALYSIS BY APPLICATION
    317. D MOBILE MAPPING MARKET ANALYSIS BY TECHNOLOGY
    318. D MOBILE MAPPING MARKET ANALYSIS BY DEPLOYMENT TYPE
    319. D MOBILE MAPPING MARKET ANALYSIS BY END USE INDUSTRY
    320. D MOBILE MAPPING MARKET ANALYSIS BY REGIONAL
    321. MOBILE MAPPING MARKET ANALYSIS BY APPLICATION
    322. MOBILE MAPPING MARKET ANALYSIS BY TECHNOLOGY
    323. MAPPING MARKET ANALYSIS BY DEPLOYMENT TYPE
    324. MAPPING MARKET ANALYSIS BY END USE INDUSTRY
    325. MAPPING MARKET ANALYSIS BY REGIONAL
    326. MARKET ANALYSIS BY APPLICATION
    327. ANALYSIS BY TECHNOLOGY
    328. BY DEPLOYMENT TYPE
    329. BY END USE INDUSTRY
    330. BY REGIONAL
    331. MAPPING MARKET
    332. SUPPLY / VALUE CHAIN: 3D MOBILE MAPPING MARKET
    333. MAPPING MARKET, BY APPLICATION, 2024 (% SHARE)
    334. MARKET, BY APPLICATION, 2019 TO 2032 (USD Billions)
    335. MAPPING MARKET, BY TECHNOLOGY, 2024 (% SHARE)
    336. MARKET, BY TECHNOLOGY, 2019 TO 2032 (USD Billions)
    337. MARKET, BY DEPLOYMENT TYPE, 2024 (% SHARE)
    338. BY DEPLOYMENT TYPE, 2019 TO 2032 (USD Billions)
    339. MARKET, BY END USE INDUSTRY, 2024 (% SHARE)
    340. MARKET, BY END USE INDUSTRY, 2019 TO 2032 (USD Billions)
    341. MAPPING MARKET, BY REGIONAL, 2024 (% SHARE)
    342. MARKET, BY REGIONAL, 2019 TO 2032 (USD Billions)
    343. OF MAJOR COMPETITORS

    3D Mobile Mapping Market Segmentation


    • 3D Mobile Mapping Market By Application (USD Billion, 2019-2032)

      • Urban Planning
      • Transportation and Logistics
      • Construction
      • Mining
      • Surveying


    • 3D Mobile Mapping Market By Technology (USD Billion, 2019-2032)

      • LiDAR
      • Photogrammetry
      • GPS
      • Computer Vision


    • 3D Mobile Mapping Market By Deployment Type (USD Billion, 2019-2032)

      • Cloud-Based
      • On-Premises


    • 3D Mobile Mapping Market By End Use Industry (USD Billion, 2019-2032)

      • Government
      • Construction
      • Transportation
      • Energy
      • Telecommunications


    • 3D Mobile Mapping Market By Regional (USD Billion, 2019-2032)

      • North America
      • Europe
      • South America
      • Asia Pacific
      • Middle East and Africa


    3D Mobile Mapping Market Regional Outlook (USD Billion, 2019-2032)


    • North America Outlook (USD Billion, 2019-2032)

      • North America 3D Mobile Mapping Market by Application Type

        • Urban Planning
        • Transportation and Logistics
        • Construction
        • Mining
        • Surveying
      • North America 3D Mobile Mapping Market by Technology Type

        • LiDAR
        • Photogrammetry
        • GPS
        • Computer Vision
      • North America 3D Mobile Mapping Market by Deployment Type

        • Cloud-Based
        • On-Premises
      • North America 3D Mobile Mapping Market by End Use Industry Type

        • Government
        • Construction
        • Transportation
        • Energy
        • Telecommunications
      • North America 3D Mobile Mapping Market by Regional Type

        • US
        • Canada
      • US Outlook (USD Billion, 2019-2032)
      • US 3D Mobile Mapping Market by Application Type

        • Urban Planning
        • Transportation and Logistics
        • Construction
        • Mining
        • Surveying
      • US 3D Mobile Mapping Market by Technology Type

        • LiDAR
        • Photogrammetry
        • GPS
        • Computer Vision
      • US 3D Mobile Mapping Market by Deployment Type

        • Cloud-Based
        • On-Premises
      • US 3D Mobile Mapping Market by End Use Industry Type

        • Government
        • Construction
        • Transportation
        • Energy
        • Telecommunications
      • CANADA Outlook (USD Billion, 2019-2032)
      • CANADA 3D Mobile Mapping Market by Application Type

        • Urban Planning
        • Transportation and Logistics
        • Construction
        • Mining
        • Surveying
      • CANADA 3D Mobile Mapping Market by Technology Type

        • LiDAR
        • Photogrammetry
        • GPS
        • Computer Vision
      • CANADA 3D Mobile Mapping Market by Deployment Type

        • Cloud-Based
        • On-Premises
      • CANADA 3D Mobile Mapping Market by End Use Industry Type

        • Government
        • Construction
        • Transportation
        • Energy
        • Telecommunications
    • Europe Outlook (USD Billion, 2019-2032)

      • Europe 3D Mobile Mapping Market by Application Type

        • Urban Planning
        • Transportation and Logistics
        • Construction
        • Mining
        • Surveying
      • Europe 3D Mobile Mapping Market by Technology Type

        • LiDAR
        • Photogrammetry
        • GPS
        • Computer Vision
      • Europe 3D Mobile Mapping Market by Deployment Type

        • Cloud-Based
        • On-Premises
      • Europe 3D Mobile Mapping Market by End Use Industry Type

        • Government
        • Construction
        • Transportation
        • Energy
        • Telecommunications
      • Europe 3D Mobile Mapping Market by Regional Type

        • Germany
        • UK
        • France
        • Russia
        • Italy
        • Spain
        • Rest of Europe
      • GERMANY Outlook (USD Billion, 2019-2032)
      • GERMANY 3D Mobile Mapping Market by Application Type

        • Urban Planning
        • Transportation and Logistics
        • Construction
        • Mining
        • Surveying
      • GERMANY 3D Mobile Mapping Market by Technology Type

        • LiDAR
        • Photogrammetry
        • GPS
        • Computer Vision
      • GERMANY 3D Mobile Mapping Market by Deployment Type

        • Cloud-Based
        • On-Premises
      • GERMANY 3D Mobile Mapping Market by End Use Industry Type

        • Government
        • Construction
        • Transportation
        • Energy
        • Telecommunications
      • UK Outlook (USD Billion, 2019-2032)
      • UK 3D Mobile Mapping Market by Application Type

        • Urban Planning
        • Transportation and Logistics
        • Construction
        • Mining
        • Surveying
      • UK 3D Mobile Mapping Market by Technology Type

        • LiDAR
        • Photogrammetry
        • GPS
        • Computer Vision
      • UK 3D Mobile Mapping Market by Deployment Type

        • Cloud-Based
        • On-Premises
      • UK 3D Mobile Mapping Market by End Use Industry Type

        • Government
        • Construction
        • Transportation
        • Energy
        • Telecommunications
      • FRANCE Outlook (USD Billion, 2019-2032)
      • FRANCE 3D Mobile Mapping Market by Application Type

        • Urban Planning
        • Transportation and Logistics
        • Construction
        • Mining
        • Surveying
      • FRANCE 3D Mobile Mapping Market by Technology Type

        • LiDAR
        • Photogrammetry
        • GPS
        • Computer Vision
      • FRANCE 3D Mobile Mapping Market by Deployment Type

        • Cloud-Based
        • On-Premises
      • FRANCE 3D Mobile Mapping Market by End Use Industry Type

        • Government
        • Construction
        • Transportation
        • Energy
        • Telecommunications
      • RUSSIA Outlook (USD Billion, 2019-2032)
      • RUSSIA 3D Mobile Mapping Market by Application Type

        • Urban Planning
        • Transportation and Logistics
        • Construction
        • Mining
        • Surveying
      • RUSSIA 3D Mobile Mapping Market by Technology Type

        • LiDAR
        • Photogrammetry
        • GPS
        • Computer Vision
      • RUSSIA 3D Mobile Mapping Market by Deployment Type

        • Cloud-Based
        • On-Premises
      • RUSSIA 3D Mobile Mapping Market by End Use Industry Type

        • Government
        • Construction
        • Transportation
        • Energy
        • Telecommunications
      • ITALY Outlook (USD Billion, 2019-2032)
      • ITALY 3D Mobile Mapping Market by Application Type

        • Urban Planning
        • Transportation and Logistics
        • Construction
        • Mining
        • Surveying
      • ITALY 3D Mobile Mapping Market by Technology Type

        • LiDAR
        • Photogrammetry
        • GPS
        • Computer Vision
      • ITALY 3D Mobile Mapping Market by Deployment Type

        • Cloud-Based
        • On-Premises
      • ITALY 3D Mobile Mapping Market by End Use Industry Type

        • Government
        • Construction
        • Transportation
        • Energy
        • Telecommunications
      • SPAIN Outlook (USD Billion, 2019-2032)
      • SPAIN 3D Mobile Mapping Market by Application Type

        • Urban Planning
        • Transportation and Logistics
        • Construction
        • Mining
        • Surveying
      • SPAIN 3D Mobile Mapping Market by Technology Type

        • LiDAR
        • Photogrammetry
        • GPS
        • Computer Vision
      • SPAIN 3D Mobile Mapping Market by Deployment Type

        • Cloud-Based
        • On-Premises
      • SPAIN 3D Mobile Mapping Market by End Use Industry Type

        • Government
        • Construction
        • Transportation
        • Energy
        • Telecommunications
      • REST OF EUROPE Outlook (USD Billion, 2019-2032)
      • REST OF EUROPE 3D Mobile Mapping Market by Application Type

        • Urban Planning
        • Transportation and Logistics
        • Construction
        • Mining
        • Surveying
      • REST OF EUROPE 3D Mobile Mapping Market by Technology Type

        • LiDAR
        • Photogrammetry
        • GPS
        • Computer Vision
      • REST OF EUROPE 3D Mobile Mapping Market by Deployment Type

        • Cloud-Based
        • On-Premises
      • REST OF EUROPE 3D Mobile Mapping Market by End Use Industry Type

        • Government
        • Construction
        • Transportation
        • Energy
        • Telecommunications
    • APAC Outlook (USD Billion, 2019-2032)

      • APAC 3D Mobile Mapping Market by Application Type

        • Urban Planning
        • Transportation and Logistics
        • Construction
        • Mining
        • Surveying
      • APAC 3D Mobile Mapping Market by Technology Type

        • LiDAR
        • Photogrammetry
        • GPS
        • Computer Vision
      • APAC 3D Mobile Mapping Market by Deployment Type

        • Cloud-Based
        • On-Premises
      • APAC 3D Mobile Mapping Market by End Use Industry Type

        • Government
        • Construction
        • Transportation
        • Energy
        • Telecommunications
      • APAC 3D Mobile Mapping Market by Regional Type

        • China
        • India
        • Japan
        • South Korea
        • Malaysia
        • Thailand
        • Indonesia
        • Rest of APAC
      • CHINA Outlook (USD Billion, 2019-2032)
      • CHINA 3D Mobile Mapping Market by Application Type

        • Urban Planning
        • Transportation and Logistics
        • Construction
        • Mining
        • Surveying
      • CHINA 3D Mobile Mapping Market by Technology Type

        • LiDAR
        • Photogrammetry
        • GPS
        • Computer Vision
      • CHINA 3D Mobile Mapping Market by Deployment Type

        • Cloud-Based
        • On-Premises
      • CHINA 3D Mobile Mapping Market by End Use Industry Type

        • Government
        • Construction
        • Transportation
        • Energy
        • Telecommunications
      • INDIA Outlook (USD Billion, 2019-2032)
      • INDIA 3D Mobile Mapping Market by Application Type

        • Urban Planning
        • Transportation and Logistics
        • Construction
        • Mining
        • Surveying
      • INDIA 3D Mobile Mapping Market by Technology Type

        • LiDAR
        • Photogrammetry
        • GPS
        • Computer Vision
      • INDIA 3D Mobile Mapping Market by Deployment Type

        • Cloud-Based
        • On-Premises
      • INDIA 3D Mobile Mapping Market by End Use Industry Type

        • Government
        • Construction
        • Transportation
        • Energy
        • Telecommunications
      • JAPAN Outlook (USD Billion, 2019-2032)
      • JAPAN 3D Mobile Mapping Market by Application Type

        • Urban Planning
        • Transportation and Logistics
        • Construction
        • Mining
        • Surveying
      • JAPAN 3D Mobile Mapping Market by Technology Type

        • LiDAR
        • Photogrammetry
        • GPS
        • Computer Vision
      • JAPAN 3D Mobile Mapping Market by Deployment Type

        • Cloud-Based
        • On-Premises
      • JAPAN 3D Mobile Mapping Market by End Use Industry Type

        • Government
        • Construction
        • Transportation
        • Energy
        • Telecommunications
      • SOUTH KOREA Outlook (USD Billion, 2019-2032)
      • SOUTH KOREA 3D Mobile Mapping Market by Application Type

        • Urban Planning
        • Transportation and Logistics
        • Construction
        • Mining
        • Surveying
      • SOUTH KOREA 3D Mobile Mapping Market by Technology Type

        • LiDAR
        • Photogrammetry
        • GPS
        • Computer Vision
      • SOUTH KOREA 3D Mobile Mapping Market by Deployment Type

        • Cloud-Based
        • On-Premises
      • SOUTH KOREA 3D Mobile Mapping Market by End Use Industry Type

        • Government
        • Construction
        • Transportation
        • Energy
        • Telecommunications
      • MALAYSIA Outlook (USD Billion, 2019-2032)
      • MALAYSIA 3D Mobile Mapping Market by Application Type

        • Urban Planning
        • Transportation and Logistics
        • Construction
        • Mining
        • Surveying
      • MALAYSIA 3D Mobile Mapping Market by Technology Type

        • LiDAR
        • Photogrammetry
        • GPS
        • Computer Vision
      • MALAYSIA 3D Mobile Mapping Market by Deployment Type

        • Cloud-Based
        • On-Premises
      • MALAYSIA 3D Mobile Mapping Market by End Use Industry Type

        • Government
        • Construction
        • Transportation
        • Energy
        • Telecommunications
      • THAILAND Outlook (USD Billion, 2019-2032)
      • THAILAND 3D Mobile Mapping Market by Application Type

        • Urban Planning
        • Transportation and Logistics
        • Construction
        • Mining
        • Surveying
      • THAILAND 3D Mobile Mapping Market by Technology Type

        • LiDAR
        • Photogrammetry
        • GPS
        • Computer Vision
      • THAILAND 3D Mobile Mapping Market by Deployment Type

        • Cloud-Based
        • On-Premises
      • THAILAND 3D Mobile Mapping Market by End Use Industry Type

        • Government
        • Construction
        • Transportation
        • Energy
        • Telecommunications
      • INDONESIA Outlook (USD Billion, 2019-2032)
      • INDONESIA 3D Mobile Mapping Market by Application Type

        • Urban Planning
        • Transportation and Logistics
        • Construction
        • Mining
        • Surveying
      • INDONESIA 3D Mobile Mapping Market by Technology Type

        • LiDAR
        • Photogrammetry
        • GPS
        • Computer Vision
      • INDONESIA 3D Mobile Mapping Market by Deployment Type

        • Cloud-Based
        • On-Premises
      • INDONESIA 3D Mobile Mapping Market by End Use Industry Type

        • Government
        • Construction
        • Transportation
        • Energy
        • Telecommunications
      • REST OF APAC Outlook (USD Billion, 2019-2032)
      • REST OF APAC 3D Mobile Mapping Market by Application Type

        • Urban Planning
        • Transportation and Logistics
        • Construction
        • Mining
        • Surveying
      • REST OF APAC 3D Mobile Mapping Market by Technology Type

        • LiDAR
        • Photogrammetry
        • GPS
        • Computer Vision
      • REST OF APAC 3D Mobile Mapping Market by Deployment Type

        • Cloud-Based
        • On-Premises
      • REST OF APAC 3D Mobile Mapping Market by End Use Industry Type

        • Government
        • Construction
        • Transportation
        • Energy
        • Telecommunications
    • South America Outlook (USD Billion, 2019-2032)

      • South America 3D Mobile Mapping Market by Application Type

        • Urban Planning
        • Transportation and Logistics
        • Construction
        • Mining
        • Surveying
      • South America 3D Mobile Mapping Market by Technology Type

        • LiDAR
        • Photogrammetry
        • GPS
        • Computer Vision
      • South America 3D Mobile Mapping Market by Deployment Type

        • Cloud-Based
        • On-Premises
      • South America 3D Mobile Mapping Market by End Use Industry Type

        • Government
        • Construction
        • Transportation
        • Energy
        • Telecommunications
      • South America 3D Mobile Mapping Market by Regional Type

        • Brazil
        • Mexico
        • Argentina
        • Rest of South America
      • BRAZIL Outlook (USD Billion, 2019-2032)
      • BRAZIL 3D Mobile Mapping Market by Application Type

        • Urban Planning
        • Transportation and Logistics
        • Construction
        • Mining
        • Surveying
      • BRAZIL 3D Mobile Mapping Market by Technology Type

        • LiDAR
        • Photogrammetry
        • GPS
        • Computer Vision
      • BRAZIL 3D Mobile Mapping Market by Deployment Type

        • Cloud-Based
        • On-Premises
      • BRAZIL 3D Mobile Mapping Market by End Use Industry Type

        • Government
        • Construction
        • Transportation
        • Energy
        • Telecommunications
      • MEXICO Outlook (USD Billion, 2019-2032)
      • MEXICO 3D Mobile Mapping Market by Application Type

        • Urban Planning
        • Transportation and Logistics
        • Construction
        • Mining
        • Surveying
      • MEXICO 3D Mobile Mapping Market by Technology Type

        • LiDAR
        • Photogrammetry
        • GPS
        • Computer Vision
      • MEXICO 3D Mobile Mapping Market by Deployment Type

        • Cloud-Based
        • On-Premises
      • MEXICO 3D Mobile Mapping Market by End Use Industry Type

        • Government
        • Construction
        • Transportation
        • Energy
        • Telecommunications
      • ARGENTINA Outlook (USD Billion, 2019-2032)
      • ARGENTINA 3D Mobile Mapping Market by Application Type

        • Urban Planning
        • Transportation and Logistics
        • Construction
        • Mining
        • Surveying
      • ARGENTINA 3D Mobile Mapping Market by Technology Type

        • LiDAR
        • Photogrammetry
        • GPS
        • Computer Vision
      • ARGENTINA 3D Mobile Mapping Market by Deployment Type

        • Cloud-Based
        • On-Premises
      • ARGENTINA 3D Mobile Mapping Market by End Use Industry Type

        • Government
        • Construction
        • Transportation
        • Energy
        • Telecommunications
      • REST OF SOUTH AMERICA Outlook (USD Billion, 2019-2032)
      • REST OF SOUTH AMERICA 3D Mobile Mapping Market by Application Type

        • Urban Planning
        • Transportation and Logistics
        • Construction
        • Mining
        • Surveying
      • REST OF SOUTH AMERICA 3D Mobile Mapping Market by Technology Type

        • LiDAR
        • Photogrammetry
        • GPS
        • Computer Vision
      • REST OF SOUTH AMERICA 3D Mobile Mapping Market by Deployment Type

        • Cloud-Based
        • On-Premises
      • REST OF SOUTH AMERICA 3D Mobile Mapping Market by End Use Industry Type

        • Government
        • Construction
        • Transportation
        • Energy
        • Telecommunications
    • MEA Outlook (USD Billion, 2019-2032)

      • MEA 3D Mobile Mapping Market by Application Type

        • Urban Planning
        • Transportation and Logistics
        • Construction
        • Mining
        • Surveying
      • MEA 3D Mobile Mapping Market by Technology Type

        • LiDAR
        • Photogrammetry
        • GPS
        • Computer Vision
      • MEA 3D Mobile Mapping Market by Deployment Type

        • Cloud-Based
        • On-Premises
      • MEA 3D Mobile Mapping Market by End Use Industry Type

        • Government
        • Construction
        • Transportation
        • Energy
        • Telecommunications
      • MEA 3D Mobile Mapping Market by Regional Type

        • GCC Countries
        • South Africa
        • Rest of MEA
      • GCC COUNTRIES Outlook (USD Billion, 2019-2032)
      • GCC COUNTRIES 3D Mobile Mapping Market by Application Type

        • Urban Planning
        • Transportation and Logistics
        • Construction
        • Mining
        • Surveying
      • GCC COUNTRIES 3D Mobile Mapping Market by Technology Type

        • LiDAR
        • Photogrammetry
        • GPS
        • Computer Vision
      • GCC COUNTRIES 3D Mobile Mapping Market by Deployment Type

        • Cloud-Based
        • On-Premises
      • GCC COUNTRIES 3D Mobile Mapping Market by End Use Industry Type

        • Government
        • Construction
        • Transportation
        • Energy
        • Telecommunications
      • SOUTH AFRICA Outlook (USD Billion, 2019-2032)
      • SOUTH AFRICA 3D Mobile Mapping Market by Application Type

        • Urban Planning
        • Transportation and Logistics
        • Construction
        • Mining
        • Surveying
      • SOUTH AFRICA 3D Mobile Mapping Market by Technology Type

        • LiDAR
        • Photogrammetry
        • GPS
        • Computer Vision
      • SOUTH AFRICA 3D Mobile Mapping Market by Deployment Type

        • Cloud-Based
        • On-Premises
      • SOUTH AFRICA 3D Mobile Mapping Market by End Use Industry Type

        • Government
        • Construction
        • Transportation
        • Energy
        • Telecommunications
      • REST OF MEA Outlook (USD Billion, 2019-2032)
      • REST OF MEA 3D Mobile Mapping Market by Application Type

        • Urban Planning
        • Transportation and Logistics
        • Construction
        • Mining
        • Surveying
      • REST OF MEA 3D Mobile Mapping Market by Technology Type

        • LiDAR
        • Photogrammetry
        • GPS
        • Computer Vision
      • REST OF MEA 3D Mobile Mapping Market by Deployment Type

        • Cloud-Based
        • On-Premises
      • REST OF MEA 3D Mobile Mapping Market by End Use Industry Type

        • Government
        • Construction
        • Transportation
        • Energy
        • Telecommunications


    Report Infographic
    Free Sample Request

    Kindly complete the form below to receive a free sample of this Report

    Customer Strories

    “I am very pleased with how market segments have been defined in a relevant way for my purposes (such as "Portable Freezers & refrigerators" and "last-mile"). In general the report is well structured. Thanks very much for your efforts.”

    Victoria Milne Founder
    Case Study

    Chemicals and Materials