• Cat-intel
  • MedIntelliX
  • Resources
  • About Us
  • Request Free Sample ×

    Kindly complete the form below to receive a free sample of this Report

    Leading companies partner with us for data-driven Insights

    clients tt-cursor

    Refined Beet Market

    ID: MRFR/F-B & N/33301-HCR
    128 Pages
    Varsha More
    September 2025

    Rapport d’étude de marché sur la betterave raffinée par type (sucre granulé, sucre liquide, sucre en poudre, cassonade), par application (aliments et boissons, produits pharmaceutiques, cosmétiques, aliments pour animaux), par utilisation finale (ménage, restauration, industriel), par source (biologique, conventionnelle) et par région (Amérique du Nord, Europe, Amérique du Sud, Asie-Pacifique, Moyen-Orient et Afrique) – Prévisions jusqu’en 2032.

    Share:
    Download PDF ×

    We do not share your information with anyone. However, we may send you emails based on your report interest from time to time. You may contact us at any time to opt-out.

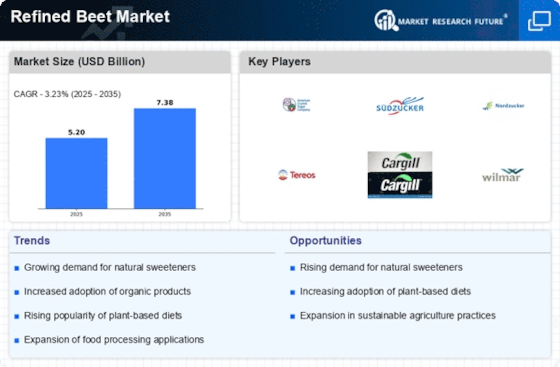
    Refined Beet Market Research Report — Global Forecast till 2032 Infographic
    Purchase Options
    $ 4 950,0
    $ 5 950,0
    $ 7 250,0
    Table of Contents

    Aperçu du marché mondial de la betterave raffinée

    La taille du marché de la betterave raffinée a été estimée à 4,73 (milliards USD) en 2022. L’industrie du marché de la betterave raffinée devrait passer de 4,88 (milliards USD) en 2023 à 6,5 (milliards USD) d’ici 2032. Le TCAC du marché de la betterave raffinée ( taux de croissance) devrait se situer autour de 3,23 % au cours de la période de prévision (2024 - 2032).

    Aperçu du marché de la betterave raffinée

    Source de la recherche primaire, de la recherche secondaire, de la base de données MRFR et de l'examen des analystes

    Principales tendances du marché de la betterave raffinée mises en évidence

    Le marché de la betterave raffinée est façonné par plusieurs facteurs clés du marché. La demande croissante d’édulcorants naturels par rapport aux édulcorants artificiels augmente considérablement la popularité des produits raffinés à base de betterave. La sensibilisation croissante des consommateurs à la santé entraîne des changements dans les préférences alimentaires, ce qui pousse le marché vers des options plus durables et biologiques. De plus, l’industrie agroalimentaire est en constante évolution, avec l’apparition d’applications innovantes pour les produits dérivés de la betterave, stimulant encore davantage ce marché. L’expansion du régime végétalien et végétarien favorise également une consommation accrue de produits à base de betterave. Les opportunités abondent sur le marché de la betterave raffinée alors que les entreprises explorent la diversification de leurs gammes de produits.

    Il existe un potentiel de croissance dans des segments de niche, tels que les produits à base de betterave raffinée biologique et sans OGM, qui s'adressent aux consommateurs soucieux de leur santé. Le développement de nouvelles technologies de transformation pourrait permettre d’améliorer les profils aromatiques et les bienfaits nutritionnels, rendant ainsi les produits raffinés à base de betterave plus attrayants. Les collaborations entre les fabricants et les entreprises de restauration peuvent conduire à des applications innovantes et élargir la portée du marché. En outre, l’expansion sur les marchés émergents présente des opportunités de croissance à mesure que la sensibilisation aux bienfaits des produits à base de betterave pour la santé augmente. Les tendances récentes indiquent une évolution croissante vers la durabilité au sein du marché de la betterave raffinée.

    Les producteurs se concentrent sur des pratiques respectueuses de l'environnement, de la culture à la transformation, pour attirer les consommateurs soucieux de l'environnement. L’essor des plateformes de marketing en ligne et de commerce électronique a modifié la manière dont les consommateurs accèdent à ces produits et les achètent. De plus, les préférences des consommateurs se tournent vers la transparence et les produits clean label, encourageant les entreprises à fournir des informations claires sur les méthodes d’approvisionnement et de production. Ces tendances façonneront probablement l'avenir du marché, car les consommateurs et les entreprises accordent la priorité à la santé, à la durabilité et à l'innovation.

    Moteurs du marché de la betterave raffinée

    Conscience croissante des consommateurs en matière de santé

    L'industrie du marché de la betterave raffinée est témoin d'une augmentation significative de la conscience de la santé chez les consommateurs. À mesure que de plus en plus de personnes prennent conscience des bienfaits pour la santé associés à la consommation de produits raffinés à base de betterave, la demande devrait augmenter. La betterave raffinée est reconnue pour son riche profil nutritionnel, comprenant des vitamines, des minéraux et des antioxydants essentiels, qui contribuent à la santé globale. De plus, le faible indice glycémique de la betterave raffinée en fait un choix alimentaire favorable pour ceux qui s'inquiètent de leur glycémie.

    Cette prise de conscience accrue des problèmes liés à la santé pousse les consommateurs vers des alternatives alimentaires naturelles et plus saines, positionnant la betterave raffinée comme un ingrédient préféré dans diverses applications culinaires. Le marché devrait bénéficier d’un changement considérable dans les préférences des consommateurs vers des produits biologiques et axés sur la santé, amplifiant la croissance du segment des betteraves raffinées. Par conséquent, cette tendance crée un environnement favorable permettant aux fabricants d'innover et de développer de nouveaux produits raffinés à base de betterave qui répondent à cette population soucieuse de leur santé.

    À mesure que les habitudes alimentaires évoluent et que les gens recherchent des options alimentaires plus nutritives, le secteur du marché de la betterave raffinée se trouve sur une trajectoire de croissance prometteuse, alimentée par des campagnes d'éducation et de santé en cours soulignant les avantages de la consommation de betterave raffinée.

    Demande croissante d'ingrédients alimentaires naturels

    Le secteur du marché de la betterave raffinée connaît une recrudescence de la demande d'ingrédients alimentaires naturels, les consommateurs préférant de plus en plus les produits fabriqués à partir de sources naturelles aux alternatives synthétiques. Ce changement est motivé par une prise de conscience croissante des risques potentiels pour la santé associés aux additifs chimiques et aux ingrédients artificiels. Les fabricants réagissent en incorporant la betterave raffinée comme agent colorant et aromatisant naturel dans divers produits alimentaires.

    La polyvalence de la betterave raffinée lui permet d'être utilisée à la fois dans des applications salées et sucrées, augmentant ainsi son attrait pour les producteurs alimentaires souhaitant répondre à la demande croissante des consommateurs pour des produits clean label. Par conséquent, l'accent mis sur les ingrédients naturels devrait stimuler la croissance du marché de la betterave raffinée, offrant aux fabricants de nombreuses opportunités d'innover et d'élargir leur offre.

    Élargissement du champ d'application dans l'industrie alimentaire et des boissons

    L'industrie du marché de la betterave raffinée bénéficie également du champ d'application croissant de la betterave raffinée dans le secteur de l'alimentation et des boissons. Alors que de plus en plus d’entreprises du secteur agroalimentaire reconnaissent les attributs de la betterave raffinée, telles que sa douceur naturelle et sa couleur vibrante, elles l’incorporent dans une large gamme de produits, notamment des collations, des boissons et des produits de boulangerie. Cette tendance ouvre la voie à des formulations de produits innovantes qui contiennent de la betterave raffinée comme ingrédient clé, stimulant la demande et améliorant la croissance du marché.

    De plus, la polyvalence de la betterave raffinée permet son incorporation dans diverses créations culinaires, attirant à la fois les fabricants et les consommateurs.

    Aperçu du segment de marché de la betterave raffinée

    Informations sur les types de marché de la betterave raffinée

    Le marché de la betterave raffinée est segmenté par type, présentant une gamme diversifiée de produits qui répondent aux divers besoins et préférences des consommateurs. À partir de 2023, le marché devrait atteindre une valorisation de 4,88 milliards USD, avec une trajectoire de croissance régulière attendue jusqu'en 2032. Au sein de ce marché, le sucre granulé apparaît comme un contributeur important, évalué à 1,6 milliard USD en 2023 et qui devrait atteindre 1,6 milliard USD. 2,1 milliards USD d'ici 2032. Ce sous-segment détient une participation majoritaire, soulignant son importance en raison de sa large application dans le secteur de l'alimentation et des boissons. industries. La polyvalence et l'acceptation générale du sucre cristallisé par les consommateurs en font un choix privilégié, ce qui soutient sa forte présence sur le marché.

    Le sucre liquide est un autre composant majeur, avec une valorisation de 1,2 milliard de dollars en 2023, qui devrait atteindre 1,7 milliard de dollars d'ici 2032. Ce segment s'adresse principalement aux industries des boissons gazeuses et de transformation où la facilité de dissolution et de combinaison est très avantageux. La forme liquide constitue une alternative intéressante dans les formulations qui nécessitent une solubilité plus rapide, ce qui stimule sa demande dans les pratiques de fabrication contemporaines.

    Le sucre en poudre, évalué à 1,0 milliard de dollars en 2023 et devrait atteindre 1,3 milliard de dollars d'ici 2032, est un autre élément essentiel du marché, principalement utilisé dans les produits de confiserie et de boulangerie. Sa texture fine lui permet de s'intégrer parfaitement aux recettes, ce qui en fait une option privilégiée par les boulangers et pâtissiers. La croissance constante du secteur de la boulangerie met en évidence l'importance de ce sous-segment, reflétant les préférences des consommateurs pour les édulcorants qui améliorent le goût et l'esthétique.

    Brown Sugar, avec une valorisation de 1,08 milliard de dollars en 2023 et qui devrait atteindre 1,4 milliard de dollars d'ici 2032, séduit les clients soucieux de leur santé et ceux qui recherchent des alternatives plus naturelles. Sa teneur en mélasse lui confère des propriétés uniques qui rehaussent la saveur, ce qui la rend populaire aussi bien dans la cuisine familiale que dans les applications culinaires professionnelles. La tendance croissante vers les produits biologiques et non raffinés soutient l'augmentation de la demande dans ce segment, représentant une évolution vers des modes de consommation plus diversifiés en édulcorants.

    En résumé, le segment du sucre granulé domine le marché de la betterave raffinée, suivi de près par le sucre liquide en raison de ses applications répandues et des préférences des consommateurs. Le sucre en poudre et la cassonade contribuent également de manière significative, reflétant l'évolution des tendances vers des produits alimentaires plus sains et plus pratiques. L'expansion continue de tous ces types indique un fort potentiel de croissance pour le marché de la betterave raffinée, démontrant comment des offres de produits diversifiées peuvent répondre aux demandes variables des consommateurs et des utilisations industrielles.

    Informations sur les types de marché de la betterave raffinée

    Source de la recherche primaire, de la recherche secondaire, de la base de données MRFR et de l'examen des analystes

    Informations sur les applications du marché de la betterave raffinée

    Le segment des applications du marché de la betterave raffinée révèle un paysage diversifié et en pleine croissance, évalué à 4,88 milliards de dollars en 2023, avec des projections indiquant que sa valeur atteindra 6,5 ​​milliards de dollars d'ici 2032. Ce segment englobe diverses industries, notamment l'alimentation et Boissons, produits pharmaceutiques, cosmétiques et aliments pour animaux, chacun contribuant à la croissance globale du marché. Le secteur de l'alimentation et des boissons est particulièrement influent, car les produits raffinés à base de betterave sont de plus en plus appréciés pour leur coloration naturelle et leur douceur, s'adressant ainsi aux consommateurs soucieux de leur santé.

    Les produits pharmaceutiques connaissent également une demande importante, exploitant les propriétés thérapeutiques des extraits raffinés de betterave pour les compléments alimentaires. Dans l'industrie cosmétique, la betterave raffinée est reconnue pour ses colorants naturels, valorisant les gammes de produits biologiques. Pendant ce temps, Animal Feed utilise la betterave raffinée comme complément nutritionnel, améliorant ainsi l’alimentation du bétail avec des nutriments précieux. L'intégration d'ingrédients naturels dans ces applications stimule les tendances du marché, présentant d'importantes opportunités de croissance, même si le marché est confronté à des défis tels que des réglementations strictes et la concurrence des alternatives synthétiques.

    Les tendances vers des produits clean label et durables renforcent encore la demande dans ces applications, illustrant la nature dynamique du marché de la betterave raffinée.

    Informations sur l'utilisation finale du marché de la betterave raffinée

    Le marché de la betterave raffinée, évalué à 4,88 milliards de dollars en 2023, présente une structure diversifiée, son segment d'utilisation finale jouant un rôle crucial dans la dynamique globale. Au sein de ce segment, les applications ménagères représentent une part importante, tirées par la demande croissante d'édulcorants naturels et de colorants alimentaires. Le secteur de la restauration se développe parallèlement à mesure que les restaurants et les services de restauration intègrent de plus en plus de produits raffinés à base de betterave dans leurs offres, améliorant à la fois le goût et l'attrait visuel. Les applications industrielles détiennent également une part importante, car la polyvalence de la betterave raffinée permet son utilisation dans divers processus de fabrication, notamment dans la production de sucre et d'additifs alimentaires.

    Les tendances actuelles en faveur d'options alimentaires plus saines et d'ingrédients naturels alimentent une croissance robuste dans ces domaines, les consommateurs étant de plus en plus conscients de l'approvisionnement et de la qualité des produits. Chaque catégorie d'utilisation finale contribue de manière unique aux revenus du marché de la betterave raffinée, reflétant les préférences distinctes des consommateurs et les exigences de l'industrie qui soutiennent une croissance et une adaptabilité soutenues du marché.

    Informations sur les sources du marché de la betterave raffinée

    Le marché de la betterave raffinée, avec une valorisation de 4,88 milliards USD en 2023, présente un paysage prometteur en se concentrant sur sa segmentation Source. Le marché est principalement divisé en segments Biologique et Conventionnel, chacun jouant un rôle crucial dans la dynamique de croissance. LeLe segment biologique gagne du terrain en raison de la sensibilisation croissante des consommateurs aux bienfaits pour la santé et aux pratiques durables, reflétant une évolution vers des produits plus naturels. À l'inverse, le segment conventionnel continue de dominer le marché en raison de ses chaînes d'approvisionnement établies et de ses prix compétitifs, le rendant accessible à une base de consommateurs plus large.

    Cette dualité entre les sources biologiques et conventionnelles crée un environnement enrichissant, alors que les tendances en matière de santé et de durabilité continuent d'influencer le comportement d'achat. Le marché global de la betterave raffinée devrait atteindre une valorisation de 6,5 milliards de dollars d’ici 2032, démontrant une trajectoire de croissance constante tirée par ces segments. La croissance du marché est en outre soutenue par des facteurs tels que la demande croissante d’édulcorants naturels et la polyvalence des produits raffinés à base de betterave dans diverses applications. Des défis tels que la fluctuation des coûts des matières premières et des réglementations strictes peuvent affecter les progrès, mais il reste des opportunités pour élargir l'offre biologique afin de répondre à l'évolution des préférences des consommateurs.

    Par conséquent, les données du marché de la betterave raffinée indiquent un fort potentiel pour une intégration équilibrée des sources biologiques et conventionnelles.

    Aperçu régional du marché de la betterave raffinée

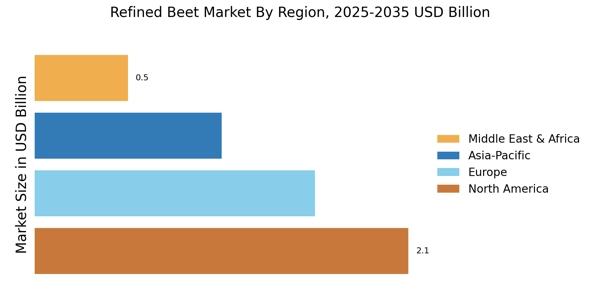
    Le marché de la betterave raffinée est sur le point de connaître une croissance régulière dans diverses régions, reflétant une valorisation globale de 4,88 milliards de dollars en 2023, avec des projections atteignant 6,5 milliards de dollars d'ici 2032. Dans ce paysage de marché, l'Europe prend une avance significative avec un valorisation de 1,8 milliard USD en 2023, indiquant sa domination dans le secteur. L'Amérique du Nord suit de près, évaluée à 1,2 milliard de dollars, affichant une forte présence sur le marché, tirée par la demande des consommateurs pour des produits raffinés à base de betterave. La région APAC, évaluée à 1,25 milliard de dollars, est également remarquable, présentant des opportunités de croissance substantielles en raison de la sensibilisation croissante des consommateurs à la santé.

    L'Amérique du Sud et la MEA représentent des segments plus petits avec des valorisations de 0,45 milliard de dollars et 0,18 milliard de dollars en 2023, respectivement, soulignant leur potentiel émergent. La participation majoritaire sur le marché de la betterave raffinée est attribuée à l'adoption accrue d'édulcorants naturels et d'offres de produits soucieux de la santé, créant des opportunités dans un contexte d'évolution des préférences des consommateurs. Toutefois, des défis tels que la concurrence et la fluctuation des prix des matières premières pourraient avoir un impact sur les trajectoires de croissance de ces régions dans un avenir proche. Dans l’ensemble, la segmentation du marché de la betterave raffinée fournit des informations essentielles sur les performances et la dynamique régionales, ayant un impact sur la prise de décision stratégique dans l’ensemble du secteur.

    Aperçu régional du marché de la betterave raffinée

    Source de la recherche primaire, de la recherche secondaire, de la base de données MRFR et de l'examen des analystes

    Acteurs clés du marché de la betterave raffinée et perspectives concurrentielles

    Le marché de la betterave raffinée se caractérise par un paysage concurrentiel qui englobe divers acteurs engagés dans la culture, la transformation et la distribution de produits raffinés à base de betterave. À mesure que la demande d'alternatives au sucre et d'édulcorants naturels augmente, les entreprises de ce marché se concentrent sur l'amélioration de l'efficacité opérationnelle, en investissant dans des technologies de transformation innovantes et en élargissant leur offre de produits. Les stratégies concurrentielles sont souvent centrées sur des pratiques durables, de nombreux acteurs cherchant à réduire leur empreinte environnementale tout en répondant aux demandes des consommateurs pour des options plus saines. La dynamique du marché est influencée par des facteurs tels que les tendances agricoles, les politiques réglementaires et les fluctuations des prix, qui poussent les entreprises à adopter des stratégies adaptatives pour maintenir leur pertinence sur le marché. L'évolution des préférences des consommateurs façonne le développement de produits, avec un accent croissant sur les options biologiques et sans OGM qui s'adressent aux acheteurs soucieux de leur santé.

    American Crystal Sugar Company se distingue sur le marché de la betterave raffinée grâce à ses vastes capacités de production et à l'accent mis sur la qualité. L'entreprise bénéficie d'une chaîne d'approvisionnement robuste qui lui permet de transformer efficacement de grands volumes de betteraves en sucre raffiné. Cette compétence opérationnelle positionne American Crystal Sugar Company comme un acteur important sur le marché, permettant une disponibilité constante des produits et un engagement à répondre aux spécifications des clients. De plus, American Crystal Sugar Company s'engage dans des partenariats stratégiques et des investissements dans une technologie de transformation de pointe, contribuant ainsi à une plus grande efficacité et à une meilleure qualité des produits. L'engagement de l'entreprise en faveur du développement durable et l'adoption de pratiques respectueuses de l'environnement renforcent encore sa réputation et ses atouts sur le marché, attirant une clientèle fidèle.

    Rhea Group occupe une position importante sur le marché de la betterave raffinée grâce à son approche dédiée à la recherche et au développement, qui permet la création de produits innovants répondant aux goûts changeants des consommateurs. L'entreprise met fortement l'accent sur l'intégration de la durabilité dans ses opérations, en cherchant à mettre en œuvre des techniques qui optimisent l'utilisation des ressources tout en minimisant les déchets. Rhea Group propose une gamme de produits diversifiée, comprenant une variété de sucres de betterave raffinés, ce qui lui permet de répondre efficacement à des segments de marché spécifiques. Les expansions stratégiques de l'entreprise sur différents marchés géographiques améliorent sa compétitivité, tandis que son engagement en faveur de l'assurance qualité tout au long du processus de production garantit une satisfaction élevée des clients. Le mélange d'innovation et de durabilité intégré dans la philosophie opérationnelle du Groupe Rhea renforce sa forte présence dans l'industrie de la betterave raffinée.

    Les principales entreprises du marché de la betterave raffinée comprennent

    • Société américaine de sucre cristal

    • Groupe Rhéa

    • Plantation Sime Darby Berhad

    • Société d'approvisionnement en édulcorants

    • Cargill

    • Téréos

    • Cosan Limitée

    • Suedzucker AG

    • Wilmar International Limitée

    • Olam International

    • Zhejiang Nanyuan Sugar Industry Co. Ltd.

    • Associated British Foods plc

    • Groupe Emsland

    • Nordzucker AG

    Développements de l'industrie du marché de la betterave raffinée

    Les développements récents sur le marché de la betterave raffinée reflètent un paysage dynamique marqué par la croissance et les changements stratégiques. American Crystal Sugar Company a élargi ses capacités de production, s'alignant sur la demande croissante de produits à base de sucre raffiné. Rhea Group et Cargill continuent d'améliorer leurs chaînes d'approvisionnement, en investissant dans des pratiques durables qui renforcent leurs positions sur le marché. Tereos et Sweetener Supply Corporation affichent des valorisations boursières plus élevées, ce qui influence positivement la concurrence dans le secteur. Cosan Limited et Suedzucker AG recherchent activement des méthodes innovantes pour optimiser l'efficacité du traitement. En termes de fusions et d'acquisitions, Olam International a acquis ce qui suscite des spéculations sur de nouvelles consolidations dans le secteur. Notamment, Nordzucker AG explore des partenariats pour renforcer sa présence sur les marchés clés. À mesure que Wilmar International Limited augmente également ses investissements, l'environnement concurrentiel s'intensifie. La trajectoire de croissance de Zhejiang Nanyuan Sugar Industry Co. Ltd. reflète les préférences croissantes des consommateurs pour le sucre de betterave raffiné. Pendant ce temps, Associated British Foods plc et Emsland Group prennent des mesures stratégiques pour capitaliser sur les opportunités émergentes, signalant un paysage solide sur le marché de la betterave raffinée, motivé à la fois par la demande du marché et par les stratégies d'entreprise.

    Aperçu de la segmentation du marché de la betterave raffinée

    • Perspectives du type de marché de la betterave raffinée
      • Sucre granulé
      • Sucre liquide
      • Sucre en poudre
      • Sucre roux
    • Perspectives des applications du marché de la betterave raffinée
      • Nourriture et boissons
      • Produits pharmaceutiques
      • Cosmétiques
      • Aliments pour animaux
    • Perspectives d'utilisation finale du marché de la betterave raffinée
      • Ménage
      • Service alimentaire
      • Industriel
    • Perspectives des sources du marché de la betterave raffinée
      • Biologique
      • Conventionnel
    • Perspectives régionales du marché de la betterave raffinée
      • Amérique du Nord
      • Europe
      • Amérique du Sud
      • Asie-Pacifique
      • Moyen-Orient et Afrique

    Portée du rapport sur le marché de la betterave raffinée

    TABLE DES MATIÈRES


    1. RÉSUMÉ EXÉCUTIF
    1.1. Aperçu du marché
    1.2. Principales conclusions
    1.3. Segmentation du marché
    1.4. Paysage concurrentiel
    1.5. Défis et opportunités
    1.6. Perspectives d'avenir


    2. INTRODUCTION AU MARCHÉ
    2.1. Définition
    2.2. Périmètre de l'étude
    2.2.1. Objectif de recherche
    2.2.2. Hypothèse
    2.2.3. Limites
    3. METHODOLOGIE DE RECHERCHE
    3.1. Présentation
    3.2. Exploration de données
    3.3. Recherche secondaire
    3.4. Recherche primaire
    3.4.1. Entretiens primaires et processus de collecte d'informations
    3.4.2. Répartition des principaux répondants
    3.5. Modèle de prévision
    3.6. Estimation de la taille du marché
    3.6.1. Approche ascendante
    3.6.2. Approche descendante
    3.7. Triangulation des données
    3.8. Validation


    4. DYNAMIQUE DU MARCHÉ
    4.1. Présentation
    4.2. Pilotes
    4.3. Contraintes
    4.4. Opportunités
    5. ANALYSE DES FACTEURS DE MARCHÉ
    5.1. Analyse de la chaîne de valeur
    5.2. Analyse des cinq forces de Porter
    5.2.1. Pouvoir de négociation des fournisseurs
    5.2.2. Pouvoir de négociation des acheteurs
    5.2.3. Menace des nouveaux entrants
    5.2.4. Menace des remplaçants
    5.2.5. Intensité de la rivalité
    5.3. Analyse d'impact du COVID-19
    5.3.1. Analyse d'impact sur le marché
    5.3.2. Impact régional
    5.3.3. Analyse des opportunités et des menaces


    6. MARCHÉ DE LA BETTERAVE RAFFINÉE, PAR TYPE (MILLIARDS USD)
    6.1. Sucre Granulé
    6.2. Sucre liquide
    6.3. Sucre en poudre
    6.4. Cassonade
    7. MARCHÉ DE LA BETTERAVE RAFFINÉE, PAR APPLICATION (MILLIARDS USD)
    7.1. Aliments et boissons
    7.2. Produits pharmaceutiques
    7.3. Cosmétiques
    7.4. Alimentation animale
    8. MARCHÉ DE LA BETTERAVE RAFFINÉE, PAR UTILISATION FINALE (MILLIARDS USD)
    8.1. Ménage
    8.2. Restauration
    8.3. Industriel
    9. MARCHÉ DE LA BETTERAVE RAFFINÉE, PAR SOURCE (MILLIARDS USD)
    9.1. Biologique
    9.2. Conventionnel
    10. MARCHÉ DE LA BETTERAVE RAFFINÉE, PAR RÉGION (MILLIARDS USD)
    10.1. Amérique du Nord
    10.1.1. États-Unis
    10.1.2. Canada
    10.2. Europe
    10.2.1. Allemagne
    10.2.2. Royaume-Uni
    10.2.3. France
    10.2.4. Russie
    10.2.5. Italie
    10.2.6. Espagne
    10.2.7. Reste de l'Europe
    10.3. APAC
    10.3.1. Chine
    10.3.2. Inde
    10.3.3. Japon
    10.3.4. Corée du Sud
    10.3.5. Malaisie
    10.3.6. Thaïlande
    10.3.7. Indonésie
    10.3.8. Reste de l'APAC
    10.4. Amérique du Sud
    10.4.1. Brésil
    10.4.2. Mexique
    10.4.3. Argentine
    10.4.4. Reste de l'Amérique du Sud
    10.5. AME
    10.5.1. Pays du CCG
    10.5.2. Afrique du Sud
    10.5.3. Reste du MEA


    11. PAYSAGE CONCURRENTIEL
    11.1. Présentation
    11.2. Analyse concurrentielle
    11.3. Analyse des parts de marché
    11.4. Stratégie de croissance majeure sur le marché de la betterave raffinée
    11.5. Analyse comparative concurrentielle
    11.6. Acteurs de premier plan en termes de nombre d’évolutions sur le marché de la betterave raffinée
    11.7. Développements clés et stratégies de croissance
    11.7.1. Lancement de nouveaux produits/déploiement de services
    11.7.2. Fusion & Acquisitions
    11.7.3. Coentreprises
    11.8. Matrice financière des principaux acteurs
    11.8.1. Chiffre d'affaires et résultat opérationnel
    11.8.2. Dépenses de R&D des principaux acteurs. 2023
    12. PROFILS D'ENTREPRISE
    12.1. Société américaine Crystal Sugar
    12.1.1. Aperçu financier
    12.1.2. Produits proposés
    12.1.3. Développements clés
    12.1.4. Analyse SWOT
    12.1.5. Stratégies clés
    12.2. Groupe Rhéa
    12.2.1. Aperçu financier
    12.2.2. Produits proposés
    12.2.3. Développements clés
    12.2.4. Analyse SWOT
    12.2.5. Stratégies clés
    12.3. Plantation Sime Darby Berhad
    12.3.1. Aperçu financier
    12.3.2. Produits proposés
    12.3.3. Développements clés
    12.3.4. Analyse SWOT
    12.3.5. Stratégies clés
    12.4. Société d'approvisionnement en édulcorants
    12.4.1. Aperçu financier
    12.4.2. Produits proposés
    12.4.3. Développements clés
    12.4.4. Analyse SWOT
    12.4.5. Stratégies clés
    12.5. Cargill
    12.5.1. Aperçu financier
    12.5.2. Produits proposés
    12.5.3. Développements clés
    12.5.4. Analyse SWOT
    12.5.5. Stratégies clés
    12.6. Tereos
    12.6.1. Aperçu financier
    12.6.2. Produits proposés
    12.6.3. Développements clés
    12.6.4. Analyse SWOT
    12.6.5. Stratégies clés
    12.7. Cosan Limitée
    12.7.1. Aperçu financier
    12.7.2. Produits proposés
    12.7.3. Développements clés
    12.7.4. Analyse SWOT
    12.7.5. Stratégies clés
    12.8. Suedzucker AG
    12.8.1. Aperçu financier
    12.8.2. Produits proposés
    12.8.3. Développements clés
    12.8.4. Analyse SWOT
    12.8.5. Stratégies clés
    12.9. Wilmar International Limitée
    12.9.1. Aperçu financier
    12.9.2. Produits proposés
    12.9.3. Développements clés
    12.9.4. Analyse SWOT
    12.9.5. Stratégies clés
    12.10. Olam International
    12.10.1. Aperçu financier
    12.10.2. Produits offerts
    12.10.3. Développements clés
    12.10.4. Analyse SWOT
    12.10.5. Stratégies clés
    12.11. Zhejiang Nanyuan Sugar Industry Co. Ltd.
    12.11.1. Aperçu financier
    12.11.2. Produits offerts
    12.11.3. Développements clés
    12.11.4. Analyse SWOT
    12.11.5. Stratégies clés
    12.12. Associated British Foods plc
    12.12.1. Aperçu financier
    12.12.2. Produits offerts
    12.12.3. Développements clés
    12.12.4. Analyse SWOT
    12.12.5. Stratégies clés
    12.13. Groupe Emsland
    12.13.1. Aperçu financier
    12.13.2. Produits offerts
    12.13.3. Développements clés
    12.13.4. Analyse SWOT
    12.13.5. Stratégies clés
    12.14. Nordzucker AG
    12.14.1. Aperçu financier
    12.14.2. Produits offerts
    12.14.3. Développements clés
    12.14.4. Analyse SWOT
    12.14.5. Stratégies clés
    13. ANNEXE
    13.1. Références
    13.2. Rapports connexes
    LISTE DES TABLEAUX

    TABLEAU 1. LISTE DES HYPOTHÈSES
    TABLEAU 2. ESTIMATIONS DE LA TAILLE DU MARCHÉ DE LA BETTERAVE RAFFINÉE EN AMÉRIQUE DU NORD & PRÉVISIONS, PAR TYPE, 2019-2032 (MILLIARDS USD)
    TABLEAU 3. ESTIMATIONS DE LA TAILLE ET DU MARCHÉ DE LA BETTERAVE RAFFINÉE EN AMÉRIQUE DU NORD PRÉVISIONS, PAR APPLICATION, 2019-2032 (MILLIARDS USD)
    TABLEAU 4. ESTIMATIONS DE LA TAILLE ET DU MARCHÉ DE LA BETTERAVE RAFFINÉE EN AMÉRIQUE DU NORD PRÉVISIONS, PAR UTILISATION FINALE, 2019-2032 (MILLIARDS USD)
    TABLEAU 5. ESTIMATIONS DE LA TAILLE ET DU MARCHÉ DE LA BETTERAVE RAFFINÉE EN AMÉRIQUE DU NORD PRÉVISIONS, PAR SOURCE, 2019-2032 (MILLIARDS USD)
    TABLEAU 6. ESTIMATIONS DE LA TAILLE ET DU MARCHÉ DE LA BETTERAVE RAFFINÉE EN AMÉRIQUE DU NORD PRÉVISIONS, PAR RÉGION, 2019-2032 (MILLIARDS USD)
    TABLEAU 7. ESTIMATIONS DE LA TAILLE ET DU MARCHÉ AMÉRICAIN DE LA BETTERAVE RAFFINÉE PRÉVISIONS, PAR TYPE, 2019-2032 (MILLIARDS USD)
    TABLEAU 8. ESTIMATIONS DE LA TAILLE ET DU MARCHÉ AMÉRICAIN DE LA BETTERAVE RAFFINÉE. PRÉVISIONS, PAR APPLICATION, 2019-2032 (MILLIARDS USD)
    TABLEAU 9. ESTIMATIONS DE LA TAILLE ET DU MARCHÉ AMÉRICAIN DE LA BETTERAVE RAFFINÉE. PRÉVISIONS, PAR UTILISATION FINALE, 2019-2032 (MILLIARDS USD)
    TABLEAU 10. ESTIMATIONS DE LA TAILLE ET DU MARCHÉ AMÉRICAIN DE LA BETTERAVE RAFFINÉE PRÉVISIONS, PAR SOURCE, 2019-2032 (MILLIARDS USD)
    TABLEAU 11. ESTIMATIONS DE LA TAILLE ET DU MARCHÉ AMÉRICAIN DE LA BETTERAVE RAFFINÉE PRÉVISIONS, PAR RÉGION, 2019-2032 (MILLIARDS USD)
    TABLEAU 12. ESTIMATIONS DE LA TAILLE ET DU MARCHÉ DE LA BETTERAVE RAFFINÉE AU CANADA PRÉVISIONS, PAR TYPE, 2019-2032 (MILLIARDS USD)
    TABLEAU 13. ESTIMATIONS DE LA TAILLE ET DU MARCHÉ DE LA BETTERAVE RAFFINÉE AU CANADA PRÉVISIONS, PAR APPLICATION, 2019-2032 (MILLIARDS USD)
    TABLEAU 14. ESTIMATIONS DE LA TAILLE ET DU MARCHÉ DE LA BETTERAVE RAFFINÉE AU CANADA PRÉVISIONS, PAR UTILISATION FINALE, 2019-2032 (MILLIARDS USD)
    TABLEAU 15. ESTIMATIONS DE LA TAILLE ET DU MARCHÉ DE LA BETTERAVE RAFFINÉE AU CANADA PRÉVISIONS, PAR SOURCE, 2019-2032 (MILLIARDS USD)
    TABLEAU 16. ESTIMATIONS DE LA TAILLE ET DU MARCHÉ DE LA BETTERAVE RAFFINÉE AU CANADA PRÉVISIONS, PAR RÉGION, 2019-2032 (MILLIARDS USD)
    TABLEAU 17. ESTIMATIONS DE LA TAILLE ET DU MARCHÉ DE LA BETTERAVE RAFFINÉE EN EUROPE PRÉVISIONS, PAR TYPE, 2019-2032 (MILLIARDS USD)
    TABLEAU 18. ESTIMATIONS ET ESTIMATIONS DE LA TAILLE DU MARCHÉ DE LA BETTERAVE RAFFINÉE EN EUROPE PRÉVISIONS, PAR APPLICATION, 2019-2032 (MILLIARDS USD)
    TABLEAU 19. ESTIMATIONS DE LA TAILLE ET DU MARCHÉ DE LA BETTERAVE RAFFINÉE EN EUROPE PRÉVISIONS, PAR UTILISATION FINALE, 2019-2032 (MILLIARDS USD)
    TABLEAU 20. ESTIMATIONS ET ESTIMATIONS DE LA TAILLE DU MARCHÉ DE LA BETTERAVE RAFFINÉE EN EUROPE PRÉVISIONS, PAR SOURCE, 2019-2032 (MILLIARDS USD)
    TABLEAU 21. ESTIMATIONS DE LA TAILLE ET DU MARCHÉ DE LA BETTERAVE RAFFINÉE EN EUROPE PRÉVISIONS, PAR RÉGION, 2019-2032 (MILLIARDS USD)
    TABLEAU 22. ESTIMATIONS DE LA TAILLE ET DU MARCHÉ DE LA BETTERAVE RAFFINÉE EN ALLEMAGNE PRÉVISIONS, PAR TYPE, 2019-2032 (MILLIARDS USD)
    TABLEAU 23. ESTIMATIONS DE LA TAILLE ET DU MARCHÉ DE LA BETTERAVE RAFFINÉE EN ALLEMAGNE PRÉVISIONS, PAR APPLICATION, 2019-2032 (MILLIARDS USD)
    TABLEAU 24. ESTIMATIONS DE LA TAILLE ET DU MARCHÉ DE LA BETTERAVE RAFFINÉE EN ALLEMAGNE PRÉVISIONS, PAR UTILISATION FINALE, 2019-2032 (MILLIARDS USD)
    TABLEAU 25. ESTIMATIONS DE LA TAILLE ET DU MARCHÉ DE LA BETTERAVE RAFFINÉE EN ALLEMAGNE PRÉVISIONS, PAR SOURCE, 2019-2032 (MILLIARDS USD)
    TABLEAU 26. ESTIMATIONS DE LA TAILLE ET DU MARCHÉ DE LA BETTERAVE RAFFINÉE EN ALLEMAGNE PRÉVISIONS, PAR RÉGION, 2019-2032 (MILLIARDS USD)
    TABLEAU 27. ESTIMATIONS DE LA TAILLE ET DU MARCHÉ DE LA BETTERAVE RAFFINÉE AU ROYAUME-UNI PRÉVISIONS, PAR TYPE, 2019-2032 (MILLIARDS USD)
    TABLEAU 28. ESTIMATIONS DE LA TAILLE ET DU MARCHÉ DE LA BETTERAVE RAFFINÉE AU ROYAUME-UNI PRÉVISIONS, PAR APPLICATION, 2019-2032 (MILLIARDS USD)
    TABLEAU 29. ESTIMATIONS DE LA TAILLE ET DU MARCHÉ DE LA BETTERAVE RAFFINÉE AU ROYAUME-UNI PRÉVISIONS, PAR UTILISATION FINALE, 2019-2032 (MILLIARDS USD)
    TABLEAU 30. ESTIMATIONS DE LA TAILLE ET DU MARCHÉ DE LA BETTERAVE RAFFINÉE AU ROYAUME-UNI PRÉVISIONS, PAR SOURCE, 2019-2032 (MILLIARDS USD)
    TABLEAU 31. ESTIMATIONS DE LA TAILLE ET DU MARCHÉ DE LA BETTERAVE RAFFINÉE AU ROYAUME-UNI PRÉVISIONS, PAR RÉGION, 2019-2032 (MILLIARDS USD)
    TABLEAU 32. ESTIMATIONS DE LA TAILLE ET DU MARCHÉ DE LA BETTERAVE RAFFINÉE EN FRANCE PRÉVISIONS, PAR TYPE, 2019-2032 (MILLIARDS USD)
    TABLEAU 33. ESTIMATIONS DE LA TAILLE ET DU MARCHÉ DE LA BETTERAVE RAFFINÉE EN FRANCE PRÉVISIONS, PAR APPLICATION, 2019-2032 (MILLIARDS USD)
    TABLEAU 34. ESTIMATIONS DE LA TAILLE ET DU MARCHÉ DE LA BETTERAVE RAFFINÉE EN FRANCE PRÉVISIONS, PAR UTILISATION FINALE, 2019-2032 (MILLIARDS USD)
    TABLEAU 35. ESTIMATIONS DE LA TAILLE ET DU MARCHÉ DE LA BETTERAVE RAFFINÉE EN FRANCE PRÉVISIONS, PAR SOURCE, 2019-2032 (MILLIARDS USD)
    TABLEAU 36. ESTIMATIONS DE LA TAILLE ET DU MARCHÉ DE LA BETTERAVE RAFFINÉE EN FRANCE PRÉVISIONS, PAR RÉGION, 2019-2032 (MILLIARDS USD)
    TABLEAU 37. ESTIMATIONS DE LA TAILLE ET DU MARCHÉ DE LA BETTERAVE RAFFINÉE EN RUSSIE PRÉVISIONS, PAR TYPE, 2019-2032 (MILLIARDS USD)
    TABLEAU 38. ESTIMATIONS DE LA TAILLE ET DU MARCHÉ DE LA BETTERAVE RAFFINÉE EN RUSSIE PRÉVISIONS, PAR APPLICATION, 2019-2032 (MILLIARDS USD)
    TABLEAU 39. ESTIMATIONS DE LA TAILLE ET DU MARCHÉ DE LA BETTERAVE RAFFINÉE EN RUSSIE PRÉVISIONS, PAR UTILISATION FINALE, 2019-2032 (MILLIARDS USD)
    TABLEAU 40. ESTIMATIONS DE LA TAILLE ET DU MARCHÉ DE LA BETTERAVE RAFFINÉE EN RUSSIE PRÉVISIONS, PAR SOURCE, 2019-2032 (MILLIARDS USD)
    TABLEAU 41. ESTIMATIONS DE LA TAILLE ET DU MARCHÉ DE LA BETTERAVE RAFFINÉE EN RUSSIE PRÉVISIONS, PAR RÉGION, 2019-2032 (MILLIARDS USD)
    TABLEAU 42. ESTIMATIONS DE LA TAILLE ET DU MARCHÉ DE LA BETTERAVE RAFFINÉE EN ITALIE PRÉVISIONS, PAR TYPE, 2019-2032 (MILLIARDS USD)
    TABLEAU 43. ESTIMATIONS DE LA TAILLE ET DU MARCHÉ DE LA BETTERAVE RAFFINÉE EN ITALIE PRÉVISIONS, PAR APPLICATION, 2019-2032 (MILLIARDS USD)
    TABLEAU 44. ESTIMATIONS DE LA TAILLE ET DU MARCHÉ DE LA BETTERAVE RAFFINÉE EN ITALIE PRÉVISIONS, PAR UTILISATION FINALE, 2019-2032 (MILLIARDS USD)
    TABLEAU 45. ESTIMATIONS DE LA TAILLE ET DU MARCHÉ DE LA BETTERAVE RAFFINÉE EN ITALIE PRÉVISIONS, PAR SOURCE, 2019-2032 (MILLIARDS USD)
    TABLEAU 46. ESTIMATIONS DE LA TAILLE ET DU MARCHÉ DE LA BETTERAVE RAFFINÉE EN ITALIE PRÉVISIONS, PAR RÉGION, 2019-2032 (MILLIARDS USD)
    TABLEAU 47. ESTIMATIONS DE LA TAILLE ET DU MARCHÉ DE LA BETTERAVE RAFFINÉE EN ESPAGNE PRÉVISIONS, PAR TYPE, 2019-2032 (MILLIARDS USD)
    TABLEAU 48. ESTIMATIONS DE LA TAILLE ET DU MARCHÉ DE LA BETTERAVE RAFFINÉE EN ESPAGNE PRÉVISIONS, PAR APPLICATION, 2019-2032 (MILLIARDS USD)
    TABLEAU 49. ESTIMATIONS DE LA TAILLE ET DU MARCHÉ DE LA BETTERAVE RAFFINÉE EN ESPAGNE PRÉVISIONS, PAR UTILISATION FINALE, 2019-2032 (MILLIARDS USD)
    TABLEAU 50. ESTIMATIONS DE LA TAILLE ET DU MARCHÉ DE LA BETTERAVE RAFFINÉE EN ESPAGNE PRÉVISIONS, PAR SOURCE, 2019-2032 (MILLIARDS USD)
    TABLEAU 51. ESTIMATIONS DE LA TAILLE ET DU MARCHÉ DE LA BETTERAVE RAFFINÉE EN ESPAGNE PRÉVISIONS, PAR RÉGION, 2019-2032 (MILLIARDS USD)
    TABLEAU 52. RESTE DE L'EUROPE, ESTIMATIONS DE LA TAILLE DU MARCHÉ DE LA BETTERAVE RAFFINÉE & PRÉVISIONS, PAR TYPE, 2019-2032 (MILLIARDS USD)
    TABLEAU 53. RESTE DE L'EUROPE ESTIMATIONS DE LA TAILLE DU MARCHÉ DE LA BETTERAVE RAFFINÉE & PRÉVISIONS, PAR APPLICATION, 2019-2032 (MILLIARDS USD)
    TABLEAU 54. RESTE DE L'EUROPE, ESTIMATIONS DE LA TAILLE DU MARCHÉ DE LA BETTERAVE RAFFINÉE & PRÉVISIONS, PAR UTILISATION FINALE, 2019-2032 (MILLIARDS USD)
    TABLE 55. RESTE DE L'EUROPE ESTIMATIONS DE LA TAILLE DU MARCHÉ DE LA BETTERAVE RAFFINÉE & PRÉVISIONS, PAR SOURCE, 2019-2032 (MILLIARDS USD)
    TABLEAU 56. RESTE DE L'EUROPE, ESTIMATIONS DE LA TAILLE DU MARCHÉ DE LA BETTERAVE RAFFINÉE & PRÉVISIONS, PAR RÉGIONAL, 2019-2032 (MILLIARDS USD)
    TABLEAU 57. ESTIMATIONS DE LA TAILLE ET DU MARCHÉ DE LA BETTERAVE RAFFINÉE APAC PRÉVISIONS, PAR TYPE, 2019-2032 (MILLIARDS USD)
    TABLEAU 58. ESTIMATIONS DE LA TAILLE ET DU MARCHÉ DE LA BETTERAVE RAFFINÉE APAC PRÉVISIONS, PAR APPLICATION, 2019-2032 (MILLIARDS USD)
    TABLEAU 59. ESTIMATIONS DE LA TAILLE ET DU MARCHÉ DE LA BETTERAVE RAFFINÉE APAC PRÉVISIONS, PAR UTILISATION FINALE, 2019-2032 (MILLIARDS USD)
    TABLEAU 60. ESTIMATIONS DE LA TAILLE ET DU MARCHÉ DE LA BETTERAVE RAFFINÉE APAC PRÉVISIONS, PAR SOURCE, 2019-2032 (MILLIARDS USD)
    TABLEAU 61. ESTIMATIONS DE LA TAILLE ET DU MARCHÉ DE LA BETTERAVE RAFFINÉE APAC PRÉVISIONS, PAR RÉGIONAL, 2019-2032 (MILLIARDS USD)
    TABLEAU 62. ESTIMATIONS DE LA TAILLE ET DU MARCHÉ DE LA BETTERAVE RAFFINÉE EN CHINE EN CHINE PRÉVISIONS, PAR TYPE, 2019-2032 (MILLIARDS USD)
    TABLEAU 63. ESTIMATIONS DE LA TAILLE ET DU MARCHÉ DE LA BETTERAVE RAFFINÉE EN CHINE EN CHINE PRÉVISIONS, PAR APPLICATION, 2019-2032 (MILLIARDS USD)
    TABLEAU 64. ESTIMATIONS DE LA TAILLE ET DU MARCHÉ DE LA BETTERAVE RAFFINÉE EN CHINE EN CHINE PRÉVISIONS, PAR UTILISATION FINALE, 2019-2032 (MILLIARDS USD)
    TABLEAU 65. ESTIMATIONS DE LA TAILLE ET DU MARCHÉ DE LA BETTERAVE RAFFINÉE EN CHINE EN CHINE PRÉVISIONS, PAR SOURCE, 2019-2032 (MILLIARDS USD)
    TABLEAU 66. ESTIMATIONS DE LA TAILLE ET DU MARCHÉ DE LA BETTERAVE RAFFINÉE EN CHINE EN CHINE PRÉVISIONS, PAR RÉGIONAL, 2019-2032 (MILLIARDS USD)
    TABLEAU 67. ESTIMATIONS DE LA TAILLE ET DU MARCHÉ DE LA BETTERAVE RAFFINÉE EN INDE PRÉVISIONS, PAR TYPE, 2019-2032 (MILLIARDS USD)
    TABLEAU 68. ESTIMATIONS DE LA TAILLE ET DU MARCHÉ DE LA BETTERAVE RAFFINÉE EN INDE PRÉVISIONS, PAR APPLICATION, 2019-2032 (MILLIARDS USD)
    TABLEAU 69. ESTIMATIONS DE LA TAILLE ET DU MARCHÉ DE LA BETTERAVE RAFFINÉE EN INDE PRÉVISIONS, PAR UTILISATION FINALE, 2019-2032 (MILLIARDS USD)
    TABLEAU 70. ESTIMATIONS DE LA TAILLE ET DU MARCHÉ DE LA BETTERAVE RAFFINÉE EN INDE PRÉVISIONS, PAR SOURCE, 2019-2032 (MILLIARDS USD)
    TABLEAU 71. ESTIMATIONS DE LA TAILLE ET DU MARCHÉ DE LA BETTERAVE RAFFINÉE EN INDE PRÉVISIONS, PAR RÉGIONAL, 2019-2032 (MILLIARDS USD)
    TABLEAU 72. ESTIMATIONS DE LA TAILLE ET DU MARCHÉ DE LA BETTERAVE RAFFINÉE AU JAPON PRÉVISIONS, PAR TYPE, 2019-2032 (MILLIARDS USD)
    TABLEAU 73. ESTIMATIONS DE LA TAILLE ET DU MARCHÉ DE LA BETTERAVE RAFFINÉE AU JAPON PRÉVISIONS, PAR APPLICATION, 2019-2032 (MILLIARDS USD)
    TABLEAU 74. ESTIMATIONS DE LA TAILLE ET DU MARCHÉ DE LA BETTERAVE RAFFINÉE AU JAPON PRÉVISIONS, PAR UTILISATION FINALE, 2019-2032 (MILLIARDS USD)
    TABLEAU 75. ESTIMATIONS DE LA TAILLE ET DU MARCHÉ DE LA BETTERAVE RAFFINÉE AU JAPON PRÉVISIONS, PAR SOURCE, 2019-2032 (MILLIARDS USD)
    TABLEAU 76. ESTIMATIONS DE LA TAILLE ET DU MARCHÉ DE LA BETTERAVE RAFFINÉE AU JAPON PRÉVISIONS, PAR RÉGION, 2019-2032 (MILLIARDS USD)
    TABLEAU 77. ESTIMATIONS DE LA TAILLE ET DU MARCHÉ DE LA BETTERAVE RAFFINÉE EN CORÉE DU SUD PRÉVISIONS, PAR TYPE, 2019-2032 (MILLIARDS USD)
    TABLEAU 78. ESTIMATIONS DE LA TAILLE ET DU MARCHÉ DE LA BETTERAVE RAFFINÉE EN CORÉE DU SUD PRÉVISIONS, PAR APPLICATION, 2019-2032 (MILLIARDS USD)
    TABLEAU 79. ESTIMATIONS DE LA TAILLE ET DU MARCHÉ DE LA BETTERAVE RAFFINÉE EN CORÉE DU SUD PRÉVISIONS, PAR UTILISATION FINALE, 2019-2032 (MILLIARDS USD)
    TABLEAU 80. ESTIMATIONS DE LA TAILLE ET DU MARCHÉ DE LA BETTERAVE RAFFINÉE EN CORÉE DU SUD PRÉVISIONS, PAR SOURCE, 2019-2032 (MILLIARDS USD)
    TABLEAU 81. ESTIMATIONS DE LA TAILLE ET DU MARCHÉ DE LA BETTERAVE RAFFINÉE EN CORÉE DU SUD PRÉVISIONS, PAR RÉGION, 2019-2032 (MILLIARDS USD)
    TABLEAU 82. ESTIMATIONS DE LA TAILLE ET DU MARCHÉ DE LA BETTERAVE RAFFINÉE EN MALAISIE PRÉVISIONS, PAR TYPE, 2019-2032 (MILLIARDS USD)
    TABLEAU 83. ESTIMATIONS DE LA TAILLE ET DU MARCHÉ DE LA BETTERAVE RAFFINÉE EN MALAISIE PRÉVISIONS, PAR APPLICATION, 2019-2032 (MILLIARDS USD)
    TABLEAU 84. ESTIMATIONS DE LA TAILLE ET DU MARCHÉ DE LA BETTERAVE RAFFINÉE EN MALAISIE PRÉVISIONS, PAR UTILISATION FINALE, 2019-2032 (MILLIARDS USD)
    TABLEAU 85. ESTIMATIONS DE LA TAILLE ET DU MARCHÉ DE LA BETTERAVE RAFFINÉE EN MALAISIE PRÉVISIONS, PAR SOURCE, 2019-2032 (MILLIARDS USD)
    TABLEAU 86. ESTIMATIONS DE LA TAILLE ET DU MARCHÉ DE LA BETTERAVE RAFFINÉE EN MALAISIE PRÉVISIONS, PAR RÉGION, 2019-2032 (MILLIARDS USD)
    TABLEAU 87. ESTIMATIONS DE LA TAILLE ET DU MARCHÉ DE LA BETTERAVE RAFFINÉE EN THAÏLANDE PRÉVISIONS, PAR TYPE, 2019-2032 (MILLIARDS USD)
    TABLEAU 88. ESTIMATIONS DE LA TAILLE ET DU MARCHÉ DE LA BETTERAVE RAFFINÉE EN THAÏLANDE PRÉVISIONS, PAR APPLICATION, 2019-2032 (MILLIARDS USD)
    TABLEAU 89. ESTIMATIONS DE LA TAILLE ET DU MARCHÉ DE LA BETTERAVE RAFFINÉE EN THAÏLANDE PRÉVISIONS, PAR UTILISATION FINALE, 2019-2032 (MILLIARDS USD)
    TABLEAU 90. ESTIMATIONS DE LA TAILLE ET DU MARCHÉ DE LA BETTERAVE RAFFINÉE EN THAÏLANDE PRÉVISIONS, PAR SOURCE, 2019-2032 (MILLIARDS USD)
    TABLEAU 91. ESTIMATIONS DE LA TAILLE ET DU MARCHÉ DE LA BETTERAVE RAFFINÉE EN THAÏLANDE PRÉVISIONS, PAR RÉGION, 2019-2032 (MILLIARDS USD)
    TABLEAU 92. ESTIMATIONS DE LA TAILLE ET DU MARCHÉ DE LA BETTERAVE RAFFINÉE EN INDONÉSIE PRÉVISIONS, PAR TYPE, 2019-2032 (MILLIARDS USD)
    TABLEAU 93. ESTIMATIONS DE LA TAILLE ET DU MARCHÉ DE LA BETTERAVE RAFFINÉE EN INDONÉSIE PRÉVISIONS, PAR APPLICATION, 2019-2032 (MILLIARDS USD)
    TABLEAU 94. ESTIMATIONS DE LA TAILLE ET DU MARCHÉ DE LA BETTERAVE RAFFINÉE EN INDONÉSIE PRÉVISIONS, PAR UTILISATION FINALE, 2019-2032 (MILLIARDS USD)
    TABLEAU 95. ESTIMATIONS DE LA TAILLE ET DU MARCHÉ DE LA BETTERAVE RAFFINÉE EN INDONÉSIE PRÉVISIONS, PAR SOURCE, 2019-2032 (MILLIARDS USD)
    TABLEAU 96. ESTIMATIONS DE LA TAILLE ET DU MARCHÉ DE LA BETTERAVE RAFFINÉE EN INDONÉSIE PRÉVISIONS, PAR RÉGION, 2019-2032 (MILLIARDS USD)
    TABLEAU 97. ESTIMATIONS DE LA TAILLE ET DU MARCHÉ DE LA BETTERAVE RAFFINÉE DU RESTE DE L'APAC PRÉVISIONS, PAR TYPE, 2019-2032 (MILLIARDS USD)
    TABLEAU 98. ESTIMATIONS DE LA TAILLE DU MARCHÉ DE LA BETTERAVE RAFFINÉE DE L'APAC & PRÉVISIONS, PAR APPLICATION, 2019-2032 (MILLIARDS USD)
    TABLEAU 99. RESTE DE L'APAC ESTIMATIONS DE LA TAILLE DU MARCHÉ DE LA BETTERAVE RAFFINÉE & PRÉVISIONS, PAR UTILISATION FINALE, 2019-2032 (MILLIARDS USD)
    TABLEAU 100. ESTIMATIONS ET ESTIMATIONS DE LA TAILLE DU MARCHÉ DE LA BETTERAVE RAFFINÉE DANS LE RESTE DE L'APAC PRÉVISIONS, PAR SOURCE, 2019-2032 (MILLIARDS USD)
    TABLEAU 101. ESTIMATIONS DE LA TAILLE ET DU MARCHÉ DES BETTERAVES RAFFINÉES DU RESTE DE L'APAC APAC PRÉVISIONS, PAR RÉGION, 2019-2032 (MILLIARDS USD)
    TABLEAU 102. ESTIMATIONS DE LA TAILLE ET DU MARCHÉ DE LA BETTERAVE RAFFINÉE EN AMÉRIQUE DU SUD PRÉVISIONS, PAR TYPE, 2019-2032 (MILLIARDS USD)
    TABLEAU 103. ESTIMATIONS DE LA TAILLE ET DU MARCHÉ DE LA BETTERAVE RAFFINÉE EN AMÉRIQUE DU SUD PRÉVISIONS, PAR APPLICATION, 2019-2032 (MILLIARDS USD)
    TABLEAU 104. ESTIMATIONS DE LA TAILLE ET DU MARCHÉ DE LA BETTERAVE RAFFINÉE EN AMÉRIQUE DU SUD PRÉVISIONS, PAR UTILISATION FINALE, 2019-2032 (MILLIARDS USD)
    TABLEAU 105. ESTIMATIONS DE LA TAILLE ET DU MARCHÉ DE LA BETTERAVE RAFFINÉE EN AMÉRIQUE DU SUD PRÉVISIONS, PAR SOURCE, 2019-2032 (MILLIARDS USD)
    TABLEAU 106. ESTIMATIONS DE LA TAILLE ET DU MARCHÉ DE LA BETTERAVE RAFFINÉE EN AMÉRIQUE DU SUD PRÉVISIONS, PAR RÉGION, 2019-2032 (MILLIARDS USD)
    TABLEAU 107. ESTIMATIONS DE LA TAILLE ET DU MARCHÉ DE LA BETTERAVE RAFFINÉE AU BRÉSIL PRÉVISIONS, PAR TYPE, 2019-2032 (MILLIARDS USD)
    TABLEAU 108. ESTIMATIONS DE LA TAILLE ET DU MARCHÉ DE LA BETTERAVE RAFFINÉE AU BRÉSIL PRÉVISIONS, PAR APPLICATION, 2019-2032 (MILLIARDS USD)
    TABLEAU 109. ESTIMATIONS DE LA TAILLE ET DU MARCHÉ DE LA BETTERAVE RAFFINÉE AU BRÉSIL PRÉVISIONS, PAR UTILISATION FINALE, 2019-2032 (MILLIARDS USD)
    TABLEAU 110. ESTIMATIONS DE LA TAILLE ET DU MARCHÉ DE LA BETTERAVE RAFFINÉE AU BRÉSIL PRÉVISIONS, PAR SOURCE, 2019-2032 (MILLIARDS USD)
    TABLEAU 111. ESTIMATIONS DE LA TAILLE ET DU MARCHÉ DE LA BETTERAVE RAFFINÉE AU BRÉSIL PRÉVISIONS, PAR RÉGION, 2019-2032 (MILLIARDS USD)
    TABLEAU 112. ESTIMATIONS DE LA TAILLE ET DU MARCHÉ DE LA BETTERAVE RAFFINÉE AU MEXIQUE PRÉVISIONS, PAR TYPE, 2019-2032 (MILLIARDS USD)
    TABLEAU 113. ESTIMATIONS DE LA TAILLE ET DU MARCHÉ DE LA BETTERAVE RAFFINÉE AU MEXIQUE PRÉVISIONS, PAR APPLICATION, 2019-2032 (MILLIARDS USD)
    TABLEAU 114. ESTIMATIONS DE LA TAILLE ET DU MARCHÉ DE LA BETTERAVE RAFFINÉE AU MEXIQUE PRÉVISIONS, PAR UTILISATION FINALE, 2019-2032 (MILLIARDS USD)
    TABLEAU 115. ESTIMATIONS DE LA TAILLE ET DU MARCHÉ DE LA BETTERAVE RAFFINÉE AU MEXIQUE PRÉVISIONS, PAR SOURCE, 2019-2032 (MILLIARDS USD)
    TABLEAU 116. ESTIMATIONS DE LA TAILLE ET DU MARCHÉ DE LA BETTERAVE RAFFINÉE AU MEXIQUE PRÉVISIONS, PAR RÉGION, 2019-2032 (MILLIARDS USD)
    TABLEAU 117. ESTIMATIONS DE LA TAILLE ET DU MARCHÉ DE LA BETTERAVE RAFFINÉE EN ARGENTINE PRÉVISIONS, PAR TYPE, 2019-2032 (MILLIARDS USD)
    TABLEAU 118. ESTIMATIONS DE LA TAILLE ET DU MARCHÉ DE LA BETTERAVE RAFFINÉE EN ARGENTINE PRÉVISIONS, PAR APPLICATION, 2019-2032 (MILLIARDS USD)
    TABLEAU 119. ESTIMATIONS DE LA TAILLE ET DU MARCHÉ DE LA BETTERAVE RAFFINÉE EN ARGENTINE PRÉVISIONS, PAR UTILISATION FINALE, 2019-2032 (MILLIARDS USD)
    TABLEAU 120. ESTIMATIONS DE LA TAILLE ET DU MARCHÉ DE LA BETTERAVE RAFFINÉE EN ARGENTINE PRÉVISIONS, PAR SOURCE, 2019-2032 (MILLIARDS USD)
    TABLEAU 121. ESTIMATIONS DE LA TAILLE ET DU MARCHÉ DE LA BETTERAVE RAFFINÉE EN ARGENTINE PRÉVISIONS, PAR RÉGION, 2019-2032 (MILLIARDS USD)
    TABLEAU 122. RESTE DE L'AMÉRIQUE DU SUD, ESTIMATIONS DE LA TAILLE DU MARCHÉ DE LA BETTERAVE RAFFINÉE et amp; PRÉVISIONS, PAR TYPE, 2019-2032 (MILLIARDS USD)
    TABLEAU 123. RESTE DE L'AMÉRIQUE DU SUD, ESTIMATIONS DE LA TAILLE DU MARCHÉ DE LA BETTERAVE RAFFINÉE et amp; PRÉVISIONS, PAR APPLICATION, 2019-2032 (MILLIARDS USD)
    TABLEAU 124. RESTE DE L'AMÉRIQUE DU SUD, ESTIMATIONS DE LA TAILLE DU MARCHÉ DE LA BETTERAVE RAFFINÉE et amp; PRÉVISIONS, PAR UTILISATION FINALE, 2019-2032 (MILLIARDS USD)
    TABLEAU 125. RESTE DE L'AMÉRIQUE DU SUD, ESTIMATIONS DE LA TAILLE DU MARCHÉ DE LA BETTERAVE RAFFINÉE et amp; PRÉVISIONS, PAR SOURCE, 2019-2032 (MILLIARDS USD)
    TABLEAU 126. RESTE DE L'AMÉRIQUE DU SUD, ESTIMATIONS DE LA TAILLE DU MARCHÉ DE LA BETTERAVE RAFFINÉE et amp; PRÉVISIONS, PAR RÉGION, 2019-2032 (MILLIARDS USD)
    TABLEAU 127. ESTIMATIONS DE LA TAILLE ET DU MARCHÉ DE LA BETTERAVE RAFFINÉE MEA PRÉVISIONS, PAR TYPE, 2019-2032 (MILLIARDS USD)
    TABLEAU 128. ESTIMATIONS DE LA TAILLE ET DU MARCHÉ DE LA BETTERAVE RAFFINÉE MEA PRÉVISIONS, PAR APPLICATION, 2019-2032 (MILLIARDS USD)
    TABLEAU 129. ESTIMATIONS DE LA TAILLE ET DU MARCHÉ DE LA BETTERAVE RAFFINÉE MEA PRÉVISIONS, PAR UTILISATION FINALE, 2019-2032 (MILLIARDS USD)
    TABLEAU 130. ESTIMATIONS DE LA TAILLE ET DU MARCHÉ DE LA BETTERAVE RAFFINÉE MEA PRÉVISIONS, PAR SOURCE, 2019-2032 (MILLIARDS USD)
    TABLEAU 131. ESTIMATIONS DE LA TAILLE ET DU MARCHÉ DE LA BETTERAVE RAFFINÉE MEA PRÉVISIONS, PAR RÉGION, 2019-2032 (MILLIARDS USD)
    TABLEAU 132. ESTIMATIONS DE LA TAILLE ET DU MARCHÉ DE LA BETTERAVE RAFFINÉE DANS LES PAYS DU CCG PRÉVISIONS, PAR TYPE, 2019-2032 (MILLIARDS USD)
    TABLEAU 133. ESTIMATIONS DE LA TAILLE ET DU MARCHÉ DE LA BETTERAVE RAFFINÉE DANS LES PAYS DU CCG PRÉVISIONS, PAR APPLICATION, 2019-2032 (MILLIARDS USD)
    TABLEAU 134. ESTIMATIONS ET ESTIMATIONS DE LA TAILLE DU MARCHÉ DE LA BETTERAVE RAFFINÉE DANS LES PAYS DU CCG PRÉVISIONS, PAR UTILISATION FINALE, 2019-2032 (MILLIARDS USD)
    TABLEAU 135. ESTIMATIONS DE LA TAILLE ET DU MARCHÉ DE LA BETTERAVE RAFFINÉE DANS LES PAYS DU CCG PRÉVISIONS, PAR SOURCE, 2019-2032 (MILLIARDS USD)
    TABLEAU 136. ESTIMATIONS ET ESTIMATIONS DE LA TAILLE DU MARCHÉ DE LA BETTERAVE RAFFINÉE DANS LES PAYS DU CCG PRÉVISIONS, PAR RÉGION, 2019-2032 (MILLIARDS USD)
    TABLEAU 137. ESTIMATIONS DE LA TAILLE ET DU MARCHÉ DE LA BETTERAVE RAFFINÉE EN AFRIQUE DU SUD PRÉVISIONS, PAR TYPE, 2019-2032 (MILLIARDS USD)
    TABLEAU 138. ESTIMATIONS DE LA TAILLE ET DU MARCHÉ DE LA BETTERAVE RAFFINÉE EN AFRIQUE DU SUD PRÉVISIONS, PAR APPLICATION, 2019-2032 (MILLIARDS USD)
    TABLEAU 139. ESTIMATIONS DE LA TAILLE ET DU MARCHÉ DE LA BETTERAVE RAFFINÉE EN AFRIQUE DU SUD PRÉVISIONS, PAR UTILISATION FINALE, 2019-2032 (MILLIARDS USD)
    TABLEAU 140. ESTIMATIONS DE LA TAILLE ET DU MARCHÉ DE LA BETTERAVE RAFFINÉE EN AFRIQUE DU SUD PRÉVISIONS, PAR SOURCE, 2019-2032 (MILLIARDS USD)
    TABLEAU 141. ESTIMATIONS DE LA TAILLE ET DU MARCHÉ DE LA BETTERAVE RAFFINÉE EN AFRIQUE DU SUD PRÉVISIONS, PAR RÉGIONAL, 2019-2032 (MILLIARDS USD)
    TABLEAU 142. RESTE DE MEA, ESTIMATIONS DE LA TAILLE DU MARCHÉ DE LA BETTERAVE RAFFINÉE & PRÉVISIONS, PAR TYPE, 2019-2032 (MILLIARDS USD)
    TABLEAU 143. RESTE DE MEA, ESTIMATIONS DE LA TAILLE DU MARCHÉ DE LA BETTERAVE RAFFINÉE & PRÉVISIONS, PAR APPLICATION, 2019-2032 (MILLIARDS USD)
    TABLEAU 144. RESTE DE MEA, ESTIMATIONS DE LA TAILLE DU MARCHÉ DE LA BETTERAVE RAFFINÉE & PRÉVISIONS, PAR UTILISATION FINALE, 2019-2032 (MILLIARDS USD)
    TABLEAU 145. RESTE DE MEA, ESTIMATIONS DE LA TAILLE DU MARCHÉ DE LA BETTERAVE RAFFINÉE & PRÉVISIONS, PAR SOURCE, 2019-2032 (MILLIARDS USD)
    TABLEAU 146. RESTE DE MEA, ESTIMATIONS DE LA TAILLE DU MARCHÉ DE LA BETTERAVE RAFFINÉE & PRÉVISIONS, PAR RÉGIONAL, 2019-2032 (MILLIARDS USD)
    TABLEAU 147. LANCEMENT DE PRODUIT/DÉVELOPPEMENT DE PRODUIT/APPROBATION
    TABLEAU 148. ACQUISITION/PARTENARIAT


    LISTE DES CHIFFRES

    FIGURE 1. SYNOPSIS DU MARCHÉ
    FIGURE 2. ANALYSE DU MARCHÉ DE LA BETTERAVE RAFFINÉE EN AMÉRIQUE DU NORD
    FIGURE 3. ANALYSE DU MARCHÉ DE LA BETTERAVE RAFFINÉE AUX ÉTATS-UNIS PAR TYPE
    FIGURE 4. ANALYSE DU MARCHÉ AMÉRICAIN DE LA BETTERAVE RAFFINÉE PAR APPLICATION
    FIGURE 5. ANALYSE DU MARCHÉ AMÉRICAIN DE LA BETTERAVE RAFFINÉE PAR UTILISATION FINALE
    FIGURE 6. ANALYSE DU MARCHÉ AMÉRICAIN DE LA BETTERAVE RAFFINÉE PAR SOURCE
    FIGURE 7 ANALYSE DU MARCHÉ AMÉRICAIN DE LA BETTERAVE RAFFINÉE PAR RÉGION
    FIGURE 8. CANADA. ANALYSE DU MARCHÉ DE LA BETTERAVE RAFFINÉE AU CANADA PAR TYPE
    FIGURE 9. ANALYSE DU MARCHÉ DE LA BETTERAVE RAFFINÉE AU CANADA PAR APPLICATION
    FIGURE 10. ANALYSE DU MARCHÉ DE LA BETTERAVE RAFFINÉE AU CANADA PAR UTILISATION FINALE
    FIGURE 11. ANALYSE DU MARCHÉ DE LA BETTERAVE RAFFINÉE AU CANADA PAR SOURCE
    br />FIGURE 12. ANALYSE DU MARCHÉ CANADIEN DE LA BETTERAVE RAFFINÉE PAR RÉGIONAL
    FIGURE 13. ANALYSE DU MARCHÉ EUROPE DE LA BETTERAVE RAFFINÉE
    FIGURE 14. ANALYSE DU MARCHÉ ALLEMAGNE DE LA BETTERAVE RAFFINÉE PAR TYPE
    FIGURE 15. ANALYSE DU MARCHÉ ALLEMAGNE DE LA BETTERAVE RAFFINÉE PAR APPLICATION
    FIGURE 16. ALLEMAGNE RAFFINÉE ANALYSE DU MARCHÉ DE LA Betterave PAR UTILISATION FINALE
    FIGURE 17. ANALYSE DU MARCHÉ DE LA BETTERAVE RAFFINÉE EN ALLEMAGNE PAR SOURCE
    FIGURE 18. ANALYSE DU MARCHÉ DE LA BETTERAVE RAFFINÉE EN ALLEMAGNE PAR RÉGION
    FIGURE 19. ANALYSE DU MARCHÉ DE LA BETTERAVE RAFFINÉE AU ROYAUME-UNI PAR TYPE
    FIGURE 20. ANALYSE DU MARCHÉ DE LA BETTERAVE RAFFINÉE AU ROYAUME-UNI PAR APPLICATION
    FIGURE 21. ANALYSE DU MARCHÉ DE LA BETTERAVE RAFFINÉE AU ROYAUME-UNI PAR UTILISATION FINALE
    FIGURE 22. ANALYSE DU MARCHÉ DE LA BETTERAVE RAFFINÉE AU ROYAUME-UNI PAR SOURCE
    FIGURE 23. BETTERAVE RAFFINÉE AU ROYAUME-UNI ANALYSE DU MARCHÉ PAR RÉGION
    FIGURE 24. FRANCE ANALYSE DU MARCHÉ DE LA BETTERAVE RAFFINÉE PAR TYPE
    FIGURE 25. ANALYSE DU MARCHÉ DE LA BETTERAVE RAFFINÉE EN FRANCE PAR APPLICATION
    FIGURE 26. ANALYSE DU MARCHÉ DE LA BETTERAVE RAFFINÉE EN FRANCE PAR UTILISATION FINALE
    FIGURE 27. ANALYSE DU MARCHÉ DE LA BETTERAVE RAFFINÉE EN FRANCE PAR SOURCE
    br />FIGURE 28. ANALYSE DU MARCHÉ FRANCE DE LA BETTERAVE RAFFINÉE PAR RÉGIONAL
    FIGURE 29. ANALYSE DU MARCHÉ DE LA BETTERAVE RAFFINÉE EN RUSSIE PAR TYPE
    FIGURE 30. ANALYSE DU MARCHÉ DE LA BETTERAVE RAFFINÉE EN RUSSIE PAR APPLICATION
    FIGURE 31. ANALYSE DU MARCHÉ DE LA BETTERAVE RAFFINÉE EN RUSSIE PAR UTILISATION FINALE
    FIGURE 32 ANALYSE DU MARCHÉ DE LA BETTERAVE RAFFINÉE EN RUSSIE PAR SOURCE.
    FIGURE 33. ANALYSE DU MARCHÉ DE LA BETTERAVE RAFFINÉE EN RUSSIE PAR RÉGION
    FIGURE 34. ANALYSE DU MARCHÉ DE LA BETTERAVE RAFFINÉE EN ITALIE PAR TYPE
    FIGURE 35. ANALYSE DU MARCHÉ DE LA BETTERAVE RAFFINÉE EN ITALIE PAR APPLICATION
    FIGURE 36. ITALIE ANALYSE DU MARCHÉ DE LA BETTERAVE RAFFINÉE PAR UTILISATION FINALE
    FIGURE 37. ANALYSE DU MARCHÉ DE LA BETTERAVE RAFFINÉE EN ITALIE PAR SOURCE
    FIGURE 38. ANALYSE DU MARCHÉ DE LA BETTERAVE RAFFINÉE EN ITALIE PAR RÉGION
    FIGURE 39. ANALYSE DU MARCHÉ DE LA BETTERAVE RAFFINÉE EN ESPAGNE PAR TYPE
    FIGURE 40. ESPAGNE BETTERAVE RAFFINÉE ANALYSE DU MARCHÉ PAR APPLICATION
    CHIFFRE 41. ANALYSE DU MARCHÉ DE LA BETTERAVE RAFFINÉE EN ESPAGNE PAR UTILISATION FINALE
    FIGURE 42. ANALYSE DU MARCHÉ DE LA BETTERAVE RAFFINÉE EN ESPAGNE PAR SOURCE
    FIGURE 43. ANALYSE DU MARCHÉ DE LA BETTERAVE RAFFINÉE EN ESPAGNE PAR RÉGION
    FIGURE 44. RESTE DE L'EUROPE BETTERAVE RAFFINÉE ANALYSE DU MARCHÉ PAR TYPE
    FIGURE 45. RESTE DE L'EUROPE ANALYSE DU MARCHÉ DE LA BETTERAVE RAFFINÉE PAR APPLICATION
    FIGURE 46. RESTE DE L'EUROPE ANALYSE DU MARCHÉ DE LA BETTERAVE RAFFINÉE PAR UTILISATION FINALE
    FIGURE 47. RESTE DE L'EUROPE ANALYSE DU MARCHÉ DE LA BETTERAVE RAFFINÉE PAR SOURCE
    FIGURE 48. RESTE ANALYSE DU MARCHÉ DE LA BETTERAVE RAFFINÉE EN EUROPE PAR RÉGIONAL
    FIGURE 49. ANALYSE DU MARCHÉ DE LA BETTERAVE RAFFINÉE EN APAC
    FIGURE 50. ANALYSE DU MARCHÉ DE LA BETTERAVE RAFFINÉE EN CHINE PAR TYPE
    FIGURE 51. ANALYSE DU MARCHÉ DE LA BETTERAVE RAFFINÉE EN CHINE PAR APPLICATION
    FIGURE 52. ANALYSE DU MARCHÉ DE LA BETTERAVE RAFFINÉE EN CHINE PAR UTILISATION FINALE
    FIGURE 53. CHINE ANALYSE DU MARCHÉ DE LA BETTERAVE RAFFINÉE PAR SOURCE
    FIGURE 54. ANALYSE DU MARCHÉ DE LA BETTERAVE RAFFINÉE EN CHINE PAR RÉGION
    FIGURE 55. ANALYSE DU MARCHÉ DE LA BETTERAVE RAFFINÉE EN INDE PAR TYPE
    FIGURE 56. ANALYSE DU MARCHÉ DE LA BETTERAVE RAFFINÉE EN INDE PAR APPLICATION
    />FIGURE 57. MARCHÉ INDE DE LA BETTERAVE RAFFINÉE ANALYSE PAR UTILISATION FINALE
    FIGURE 58. ANALYSE DU MARCHÉ DE LA BETTERAVE RAFFINÉE EN INDE PAR SOURCE
    FIGURE 59. ANALYSE DU MARCHÉ DE LA BETTERAVE RAFFINÉE EN INDE PAR RÉGION
    FIGURE 60. ANALYSE DU MARCHÉ DE LA BETTERAVE RAFFINÉE AU JAPON PAR TYPE
    FIGURE 61. ANALYSE DU MARCHÉ DE LA BETTERAVE RAFFINÉE AU JAPON PAR APPLICATION
    FIGURE 62. ANALYSE DU MARCHÉ DE LA BETTERAVE RAFFINÉE AU JAPON PAR UTILISATION FINALE
    FIGURE 63. ANALYSE DU MARCHÉ DE LA BETTERAVE RAFFINÉE AU JAPON PAR SOURCE
    FIGURE 64. ANALYSE DU MARCHÉ DE LA BETTERAVE RAFFINÉE AU JAPON PAR RÉGION
    FIGURE 65. ANALYSE DU MARCHÉ DE LA BETTERAVE RAFFINÉE EN CORÉE DU SUD PAR TYPE
    FIGURE 66. ANALYSE DU MARCHÉ DE LA BETTERAVE RAFFINÉE EN CORÉE DU SUD PAR APPLICATION
    FIGURE 67. ANALYSE DU MARCHÉ DE LA BETTERAVE RAFFINÉE EN CORÉE DU SUD PAR UTILISATION FINALE
    FIGURE 68. ANALYSE DU MARCHÉ DE LA BETTERAVE RAFFINÉE EN CORÉE DU SUD PAR SOURCE
    FIGURE 69 ANALYSE DU MARCHÉ DE LA BETTERAVE RAFFINÉE EN CORÉE DU SUD PAR RÉGION.
    FIGURE 70. ANALYSE DU MARCHÉ DE LA BETTERAVE RAFFINÉE EN MALAISIE PAR TYPE
    FIGURE 71. ANALYSE DU MARCHÉ DE LA BETTERAVE RAFFINÉE EN MALAISIE PAR APPLICATION
    FIGURE 72. ANALYSE DU MARCHÉ DE LA BETTERAVE RAFFINÉE EN MALAISIE PAR UTILISATION FINALE
    FIGURE 73. ANALYSE DU MARCHÉ DE LA BETTERAVE RAFFINÉE EN MALAISIE PAR SOURCE
    FIGURE 74. ANALYSE DU MARCHÉ DE LA BETTERAVE RAFFINÉE EN MALAISIE PAR RÉGION
    FIGURE 75. ANALYSE DU MARCHÉ DE LA BETTERAVE RAFFINÉE EN THAÏLANDE PAR TYPE
    FIGURE 76. ANALYSE DU MARCHÉ DE LA BETTERAVE RAFFINÉE EN THAÏLANDE PAR APPLICATION
    FIGURE 77. THAÏLANDE ANALYSE DU MARCHÉ DE LA BETTERAVE RAFFINÉE PAR UTILISATION FINALE
    FIGURE 78. ANALYSE DU MARCHÉ DE LA BETTERAVE RAFFINÉE EN THAÏLANDE PAR SOURCE
    FIGURE 79. ANALYSE DU MARCHÉ DE LA BETTERAVE RAFFINÉE EN THAÏLANDE PAR RÉGION
    FIGURE 80. ANALYSE DU MARCHÉ DE LA BETTERAVE RAFFINÉE EN INDONÉSIE PAR TYPE
    FIGURE 81. BETTERAVE RAFFINÉE EN INDONÉSIE ANALYSE DE MARCHÉ PAR APPLICATION
    FIGURE 82. ANALYSE DU MARCHÉ DE LA BETTERAVE RAFFINÉE EN INDONÉSIE PAR UTILISATION FINALE
    FIGURE 83. ANALYSE DU MARCHÉ DE LA BETTERAVE RAFFINÉE EN INDONÉSIE PAR SOURCE
    FIGURE 84. ANALYSE DU MARCHÉ DE LA BETTERAVE RAFFINÉE EN INDONÉSIE PAR RÉGION
    FIGURE 85. RESTE DE ANALYSE DU MARCHÉ DE LA BETTERAVE RAFFINÉE APAC PAR TYPE
    FIGURE 86. ANALYSE DU MARCHÉ RESTE DE LA BETTERAVE RAFFINÉE APAC PAR APPLICATION
    FIGURE 87. ANALYSE DU MARCHÉ RESTE DE LA BETTERAVE RAFFINÉE APAC PAR UTILISATION FINALE
    FIGURE 88. ANALYSE DU MARCHÉ RESTE DE LA BETTERAVE RAFFINÉE APAC PAR SOURCE < br />FIGURE 89. RESTE DU MARCHÉ DE LA BETTERAVE RAFFINÉE EN APAC ANALYSE PAR RÉGION
    FIGURE 90. ANALYSE DU MARCHÉ DE LA BETTERAVE RAFFINÉE EN AMÉRIQUE DU SUD
    FIGURE 91. ANALYSE DU MARCHÉ DE LA BETTERAVE RAFFINÉE AU BRÉSIL PAR TYPE
    FIGURE 92. ANALYSE DU MARCHÉ DE LA BETTERAVE RAFFINÉE AU BRÉSIL PAR APPLICATION
    FIGURE 93 ANALYSE DU MARCHÉ DE LA BETTERAVE RAFFINÉE AU BRÉSIL D'ICI LA FIN. UTILISATION
    FIGURE 94. ANALYSE DU MARCHÉ DE LA BETTERAVE RAFFINÉE AU BRÉSIL PAR SOURCE
    FIGURE 95. ANALYSE DU MARCHÉ DE LA BETTERAVE RAFFINÉE AU BRÉSIL PAR RÉGION
    FIGURE 96. ANALYSE DU MARCHÉ DE LA BETTERAVE RAFFINÉE AU MEXIQUE PAR TYPE
    FIGURE 97. ANALYSE DU MARCHÉ DE LA BETTERAVE RAFFINÉE AU MEXIQUE PAR APPLICATION
    FIGURE 98. ANALYSE DU MARCHÉ DE LA BETTERAVE RAFFINÉE AU MEXIQUE PAR UTILISATION FINALE
    FIGURE 99. ANALYSE DU MARCHÉ DE LA BETTERAVE RAFFINÉE AU MEXIQUE PAR SOURCE
    FIGURE 100. ANALYSE DU MARCHÉ DE LA BETTERAVE RAFFINÉE AU MEXIQUE PAR RÉGION
    FIGURE 101. ARGENTINE RAFFINÉE ANALYSE DU MARCHÉ DE LA Betterave PAR TYPE
    FIGURE 102. ANALYSE DU MARCHÉ DE LA BETTERAVE RAFFINÉE EN ARGENTINE PAR APPLICATION
    FIGURE 103. ANALYSE DU MARCHÉ DE LA BETTERAVE RAFFINÉE EN ARGENTINE PAR UTILISATION FINALE
    FIGURE 104. ANALYSE DU MARCHÉ DE LA BETTERAVE RAFFINÉE EN ARGENTINE PAR SOURCE
    FIGURE 105. ARGENTINE RAFFINÉE ANALYSE DU MARCHÉ DE LA Betterave PAR RÉGION
    FIGURE 106. RESTE DE L'AMÉRIQUE DU SUD ANALYSE DU MARCHÉ DE LA BETTERAVE RAFFINÉE PAR TYPE
    FIGURE 107. RESTE DE L'AMÉRIQUE DU SUD ANALYSE DU MARCHÉ DE LA BETTERAVE RAFFINÉE PAR APPLICATION
    FIGURE 108. RESTE DE L'AMÉRIQUE DU SUD MARCHÉ DE LA BETTERAVE RAFFINÉE ANALYSE PAR UTILISATION FINALE
    CHIFFRE 109. RESTE DE L'AMÉRIQUE DU SUD ANALYSE DU MARCHÉ DE LA BETTERAVE RAFFINÉE PAR SOURCE
    FIGURE 110. RESTE DE L'AMÉRIQUE DU SUD ANALYSE DU MARCHÉ DE LA BETTERAVE RAFFINÉE PAR RÉGION
    FIGURE 111. ANALYSE DU MARCHÉ DE LA BETTERAVE RAFFINÉE MEA
    FIGURE 112. PAYS DU CCG ANALYSE DU MARCHÉ DE LA Betterave RAFFINÉE PAR TYPE
    FIGURE 113. ANALYSE DU MARCHÉ DE LA BETTERAVE RAFFINÉE DES PAYS DU CCG PAR APPLICATION
    FIGURE 114. ANALYSE DU MARCHÉ DE LA BETTERAVE RAFFINÉE DES PAYS DU CCG PAR UTILISATION FINALE
    FIGURE 115. ANALYSE DU MARCHÉ DE LA BETTERAVE RAFFINÉE DES PAYS DU CCG PAR SOURCE
    FIGURE 116. BETTERAVE RAFFINÉE DES PAYS DU CCG ANALYSE DU MARCHÉ PAR RÉGION
    FIGURE 117. ANALYSE DU MARCHÉ DE LA BETTERAVE RAFFINÉE EN AFRIQUE DU SUD PAR TYPE
    FIGURE 118. ANALYSE DU MARCHÉ DE LA BETTERAVE RAFFINÉE EN AFRIQUE DU SUD PAR APPLICATION
    FIGURE 119. ANALYSE DU MARCHÉ DE LA BETTERAVE RAFFINÉE EN AFRIQUE DU SUD PAR UTILISATION FINALE
    FIGURE 120. SUD ANALYSE DU MARCHÉ DE LA BETTERAVE RAFFINÉE EN AFRIQUE PAR SOURCE
    FIGURE 121. ANALYSE DU MARCHÉ DE LA BETTERAVE RAFFINÉE EN AFRIQUE DU SUD PAR RÉGION
    FIGURE 122. ANALYSE DU MARCHÉ DE LA BETTERAVE RAFFINÉE RESTE DE MEA PAR TYPE
    FIGURE 123. RESTE DE LA BETTERAVE RAFFINÉE MEA ANALYSE DU MARCHÉ PAR APPLICATION
    CHIFFRE 124. ANALYSE DU MARCHÉ DE LA BETTERAVE RAFFINÉE RESTE DE MEA PAR UTILISATION FINALE
    FIGURE 125. ANALYSE DU MARCHÉ DE LA Betterave RAFFINÉE RESTE DE MEA PAR SOURCE
    FIGURE 126. ANALYSE DU MARCHÉ DE LA BETTERAVE RAFFINÉE RESTE DE MEA PAR RÉGION
    FIGURE 127 CRITÈRES CLÉS D'ACHAT DE BETTERAVE RAFFINÉE. MARCHÉ
    FIGURE 128. PROCESSUS DE RECHERCHE DU MRFR
    FIGURE 129. ANALYSE DRO DU MARCHÉ DE LA BETTERAVE RAFFINÉE
    FIGURE 130. ANALYSE DE L'IMPACT DES FACTEURS : MARCHÉ DE LA BETTERAVE RAFFINÉE
    FIGURE 131. ANALYSE DE L'IMPACT DES RESTRICTIONS : MARCHÉ DE LA BETTERAVE RAFFINÉE
    CHIFFRE 132. CHAÎNE D'APPROVISIONNEMENT/ DE VALEUR : MARCHÉ DE LA BETTERAVE RAFFINÉE
    FIGURE 133. MARCHÉ DE LA BETTERAVE RAFFINÉE, PAR TYPE, 2024 (% DE PART)
    FIGURE 134. MARCHÉ DE LA BETTERAVE RAFFINÉE, PAR TYPE, 2019 À 2032 (en milliards USD)
    FIGURE 135. MARCHÉ DE LA BETTERAVE RAFFINÉE, PAR APPLICATION, 2024 (% PART)
    FIGURE 136. MARCHÉ DE LA BETTERAVE RAFFINÉE, PAR APPLICATION, 2019 À 2032 (en milliards USD)
    FIGURE 137. MARCHÉ DE LA BETTERAVE RAFFINÉE, PAR UTILISATION FINALE, 2024 (% PART)
    FIGURE 138. MARCHÉ DE LA BETTERAVE RAFFINÉE, PAR UTILISATION FINALE, 2019 À 2032 (en milliards USD)
    FIGURE 139. MARCHÉ DE LA BETTERAVE RAFFINÉE, PAR SOURCE, 2024 (PART EN %)
    FIGURE 140. MARCHÉ DE LA BETTERAVE RAFFINÉE, PAR SOURCE, 2019 À 2032 (en milliards USD)
    FIGURE 141. MARCHÉ DE LA BETTERAVE RAFFINÉE, PAR RÉGIONAL, 2024 (% PART)
    FIGURE 142. MARCHÉ DE LA BETTERAVE RAFFINÉE, PAR RÉGION, 2019 À 2032 (en milliards USD)
    FIGURE 143. ANALYSE COMPÉTITANTE DES PRINCIPAUX CONCURRENTS

    Segmentation du marché du marché de la betterave raffinée

    • Marché de la betterave raffinée par type (en milliards USD, 2019-2032)

      • Sucre granulé

      • Sucre liquide

      • Sucre en poudre

      • Sucre roux

    • Marché de la betterave raffinée par application (en milliards USD, 2019-2032)

      • Nourriture et boissons

      • Produits pharmaceutiques

      • Cosmétiques

      • Aliments pour animaux

    • Marché de la betterave raffinée par utilisation finale (en milliards USD, 2019-2032)

      • Ménage

      • Service alimentaire

      • Industriel

    • Marché de la betterave raffinée par source (en milliards USD, 2019-2032)

      • Biologique

      • Conventionnel

    • Marché de la betterave raffinée par région (en milliards USD, 2019-2032)

      • Amérique du Nord

      • Europe

      • Amérique du Sud

      • Asie-Pacifique

      • Moyen-Orient et Afrique

    Perspectives régionales du marché de la betterave raffinée (en milliards USD, 2019-2032)

    • Perspectives de l'Amérique du Nord (milliards USD, 2019-2032)

      • Marché de la betterave raffinée en Amérique du Nord par type

        • Sucre granulé

        • Sucre liquide

        • Sucre en poudre

        • Sucre roux

      • Marché de la betterave raffinée en Amérique du Nord par type d'application

        • Nourriture et boissons

        • Produits pharmaceutiques

        • Cosmétiques

        • Aliments pour animaux

      • Marché de la betterave raffinée en Amérique du Nord par type d'utilisation finale

        • Ménage

        • Service alimentaire

        • Industriel

      • Marché de la betterave raffinée en Amérique du Nord par type de source

        • Biologique

        • Conventionnel

      • Marché de la betterave raffinée en Amérique du Nord par type régional

        • États-Unis

        • Canada

      • Perspectives des États-Unis (milliards USD, 2019-2032)

      • Marché américain de la betterave raffinée par type

        • Sucre granulé

        • Sucre liquide

        • Sucre en poudre

        • Sucre roux

      • Marché américain de la betterave raffinée par type d'application

        • Nourriture et boissons

        • Produits pharmaceutiques

        • Cosmétiques

        • Aliments pour animaux

      • Marché américain de la betterave raffinée par type d'utilisation finale

        • Ménage

        • Service alimentaire

        • Industriel

      • Marché américain de la betterave raffinée par type de source

        • Biologique

        • Conventionnel

      • Perspectives du CANADA (milliards USD, 2019-2032)

      • Marché canadien de la betterave raffinée par type

        • Sucre granulé

        • Sucre liquide

        • Sucre en poudre

        • Sucre roux

      • Marché canadien de la betterave raffinée par type d'application

        • Nourriture et boissons

        • Produits pharmaceutiques

        • Cosmétiques

        • Aliments pour animaux

      • Marché canadien de la betterave raffinée par type d'utilisation finale

        • Ménage

        • Service alimentaire

        • Industriel

      • Marché canadien de la betterave raffinée par type de source

        • Biologique

        • Conventionnel

      • Perspectives européennes (milliards USD, 2019-2032)

        • Marché européen de la betterave raffinée par type

          • Sucre granulé

          • Sucre liquide

          • Sucre en poudre

          • Sucre roux

        • Marché européen de la betterave raffinée par type d'application

          • Nourriture et boissons

          • Produits pharmaceutiques

          • Cosmétiques

          • Aliments pour animaux

        • Marché européen de la betterave raffinée par type d'utilisation finale

          • Ménage

          • Service alimentaire

          • Industriel

        • Marché européen de la betterave raffinée par type de source

          • Biologique

          • Conventionnel

        • Marché européen de la betterave raffinée par type régional

          • Allemagne

          • Royaume-Uni

          • France

          • Russie

          • Italie

          • Espagne

          • Reste de l'Europe

        • Perspectives de l'ALLEMAGNE (milliards USD, 2019-2032)

        • ALLEMAGNE Marché de la betterave raffinée par type

          • Sucre granulé

          • Sucre liquide

          • Sucre en poudre

          • Sucre roux

        • ALLEMAGNE Marché de la betterave raffinée par type d'application

          • Nourriture et boissons

          • Produits pharmaceutiques

          • Cosmétiques

          • Aliments pour animaux

        • ALLEMAGNE Marché de la betterave raffinée par type d'utilisation finale

          • Ménage

          • Service alimentaire

          • Industriel

        • ALLEMAGNE Marché de la betterave raffinée par type de source

          • Biologique

          • Conventionnel

        • Perspectives du Royaume-Uni (milliards USD, 2019-2032)

        • Marché britannique de la betterave raffinée par type

          • Sucre granulé

          • Sucre liquide

          • Sucre en poudre

          • Sucre roux

        • Marché britannique de la betterave raffinée par type d'application

          • Nourriture et boissons

          • Produits pharmaceutiques

          • Cosmétiques

          • Aliments pour animaux

        • Marché britannique de la betterave raffinée par type d'utilisation finale

          • Ménage

          • Service alimentaire

          • Industriel

        • Marché britannique de la betterave raffinée par type de source

          • Biologique

          • Conventionnel

        • Perspectives de la FRANCE (en milliards de dollars, 2019-2032)

        • FRANCE Marché de la betterave raffinée par type

          • Sucre granulé

          • Sucre liquide

          • Sucre en poudre

          • Sucre roux

        • FRANCE Marché de la betterave raffinée par type d'application

          • Nourriture et boissons

          • Produits pharmaceutiques

          • Cosmétiques

          • Aliments pour animaux

        • FRANCE Marché de la betterave raffinée par type d'utilisation finale

          • Ménage

          • Service alimentaire

          • Industriel

        • FRANCE Marché de la betterave raffinée par type de source

          • Biologique

          • Conventionnel

        • Perspectives de la RUSSIE (milliards USD, 2019-2032)

        • Marché de la betterave raffinée en RUSSIE par type

          • Sucre granulé

          • Sucre liquide

          • Sucre en poudre

          • Sucre roux

        • Marché de la betterave raffinée en RUSSIE par type d'application

          • Nourriture et boissons

          • Produits pharmaceutiques

          • Cosmétiques

          • Aliments pour animaux

        • Marché de la betterave raffinée en RUSSIE par type d'utilisation finale

          • Ménage

          • Service alimentaire

          • Industriel

        • Marché de la betterave raffinée en RUSSIE par type de source

          • Biologique

          • Conventionnel

        • Perspectives de l'ITALIE (milliards USD, 2019-2032)

        • ITALIE Marché de la betterave raffinée par type

          • Sucre granulé

          • Sucre liquide

          • Sucre en poudre

          • Sucre roux

        • ITALIE Marché de la betterave raffinée par type d'application

          • Nourriture et boissons

          • Produits pharmaceutiques

          • Cosmétiques

          • Aliments pour animaux

        • ITALIE Marché de la betterave raffinée par type d'utilisation finale

          • Ménage

          • Service alimentaire

          • Industriel

        • ITALIE Marché de la betterave raffinée par type de source

          • Biologique

          • Conventionnel

        • Perspectives de l'ESPAGNE (milliards USD, 2019-2032)

        • ESPAGNE Marché de la betterave raffinée par type

          • Sucre granulé

          • Sucre liquide

          • Sucre en poudre

          • Sucre roux

        • ESPAGNE Marché de la betterave raffinée par type d'application

          • Nourriture et boissons

          • Produits pharmaceutiques

          • Cosmétiques

          • Aliments pour animaux

        • ESPAGNE Marché de la betterave raffinée par type d'utilisation finale

          • Ménage

          • Service alimentaire

          • Industriel

        • ESPAGNE Marché de la betterave raffinée par type de source

          • Biologique

          • Conventionnel

        • Perspectives RESTE DE L'EUROPE (milliards USD, 2019-2032)

        • RESTE DE L'EUROPE Marché de la betterave raffinée par type

          • Sucre granulé

          • Sucre liquide

          • Sucre en poudre

          • Sucre roux

        • RESTE DE L'EUROPE Marché de la betterave raffinée par type d'application

          • Nourriture et boissons

          • Produits pharmaceutiques

          • Cosmétiques

          • Aliments pour animaux

        • RESTE DE L'EUROPE Marché de la betterave raffinée par type d'utilisation finale

          • Ménage

          • Service alimentaire

          • Industriel

        • RESTE DE L'EUROPE Marché de la betterave raffinée par type de source

          • Biologique

          • Conventionnel

        • Perspectives APAC (milliards USD, 2019-2032)

          • Marché de la betterave raffinée APAC par type

            • Sucre granulé

            • Sucre liquide

            • Sucre en poudre

            • Sucre roux

          • Marché de la betterave raffinée APAC par type d'application

            • Nourriture et boissons

            • Produits pharmaceutiques

            • Cosmétiques

            • Aliments pour animaux

          • Marché de la betterave raffinée APAC par type d'utilisation finale

            • Ménage

            • Service alimentaire

            • Industriel

          • Marché de la betterave raffinée APAC par type de source

            • Biologique

            • Conventionnel

          • Marché de la betterave raffinée APAC par type régional

            • Chine

            • Inde

            • Japon

            • Corée du Sud

            • Malaisie

            • Thaïlande

            • Indonésie

            • Reste de l'APAC

          • Perspectives de la CHINE (milliards USD, 2019-2032)

          • Marché de la betterave raffinée en CHINE par type

            • Sucre granulé

            • Sucre liquide

            • PoudreSucre rouge

            • Sucre roux

          • Marché de la betterave raffinée en CHINE par type d'application

            • Nourriture et boissons

            • Produits pharmaceutiques

            • Cosmétiques

            • Aliments pour animaux

          • Marché de la betterave raffinée en CHINE par type d'utilisation finale

            • Ménage

            • Service alimentaire

            • Industriel

          • Marché de la betterave raffinée en CHINE par type de source

            • Biologique

            • Conventionnel

          • Perspectives de l'INDE (milliards USD, 2019-2032)

          • Marché de la betterave raffinée en INDE par type

            • Sucre granulé

            • Sucre liquide

            • Sucre en poudre

            • Sucre roux

          • Marché de la betterave raffinée en INDE par type d'application

            • Nourriture et boissons

            • Produits pharmaceutiques

            • Cosmétiques

            • Aliments pour animaux

          • Marché de la betterave raffinée en INDE par type d'utilisation finale

            • Ménage

            • Service alimentaire

            • Industriel

          • Marché indien de la betterave raffinée par type de source

            • Biologique

            • Conventionnel

          • Perspectives du JAPON (milliards USD, 2019-2032)

          • Marché de la betterave raffinée au JAPON par type

            • Sucre granulé

            • Sucre liquide

            • Sucre en poudre

            • Sucre roux

          • Marché de la betterave raffinée au JAPON par type d'application

            • Nourriture et boissons

            • Produits pharmaceutiques

            • Cosmétiques

            • Aliments pour animaux

          • Marché de la betterave raffinée au JAPON par type d'utilisation finale

            • Ménage

            • Service alimentaire

            • Industriel

          • Marché de la betterave raffinée au JAPON par type de source

            • Biologique

            • Conventionnel

          • Perspectives de la CORÉE DU SUD (milliards USD, 2019-2032)

          • Marché de la betterave raffinée en CORÉE DU SUD par type

            • Sucre granulé

            • Sucre liquide

            • Sucre en poudre

            • Sucre roux

          • Marché de la betterave raffinée en CORÉE DU SUD par type d'application

            • Nourriture et boissons

            • Produits pharmaceutiques

            • Cosmétiques

            • Aliments pour animaux

          • Marché de la betterave raffinée en CORÉE DU SUD par type d'utilisation finale

            • Ménage

            • Service alimentaire

            • Industriel

          • Marché de la betterave raffinée en CORÉE DU SUD par type de source

            • Biologique

            • Conventionnel

          • Perspectives de la MALAISIE (milliards USD, 2019-2032)

          • MALAISIE Marché de la betterave raffinée par type

            • Sucre granulé

            • Sucre liquide

            • Sucre en poudre

            • Sucre roux

          • MALAISIE Marché de la betterave raffinée par type d'application

            • Nourriture et boissons

            • Produits pharmaceutiques

            • Cosmétiques

            • Aliments pour animaux

          • MALAISIE Marché de la betterave raffinée par type d'utilisation finale

            • Ménage

            • Service alimentaire

            • Industriel

          • MALAISIE Marché de la betterave raffinée par type de source

            • Biologique

            • Conventionnel

          • Perspectives de la THAÏLANDE (milliards USD, 2019-2032)

          • THAÏLANDE Marché de la betterave raffinée par type

            • Sucre granulé

            • Sucre liquide

            • Sucre en poudre

            • Sucre roux

          • THAÏLANDE Marché de la betterave raffinée par type d'application

            • Nourriture et boissons

            • Produits pharmaceutiques

            • Cosmétiques

            • Aliments pour animaux

          • THAÏLANDE Marché de la betterave raffinée par type d'utilisation finale

            • Ménage

            • Service alimentaire

            • Industriel

          • THAÏLANDE Marché de la betterave raffinée par type de source

            • Biologique

            • Conventionnel

          • Perspectives de l'INDONÉSIE (milliards USD, 2019-2032)

          • INDONÉSIE Marché de la betterave raffinée par type

            • Sucre granulé

            • Sucre liquide

            • Sucre en poudre

            • Sucre roux

          • INDONÉSIE Marché de la betterave raffinée par type d'application

            • Nourriture et boissons

            • Produits pharmaceutiques

            • Cosmétiques

            • Aliments pour animaux

          • INDONÉSIE Marché de la betterave raffinée par type d'utilisation finale

            • Ménage

            • Service alimentaire

            • Industriel

          • Marché de la betterave raffinée en INDONÉSIE par type de source

            • Biologique

            • Conventionnel

          • Perspectives RESTE DE L'APAC (milliards USD, 2019-2032)

          • RESTE DE L'APAC Marché de la betterave raffinée par type

            • Sucre granulé

            • Sucre liquide

            • Sucre en poudre

            • Sucre roux

          • RESTE DE L'APAC Marché de la betterave raffinée par type d'application

            • Nourriture et boissons

            • Produits pharmaceutiques

            • Cosmétiques

            • Aliments pour animaux

          • RESTE DE L'APAC Marché de la betterave raffinée par type d'utilisation finale

            • Ménage

            • Service alimentaire

            • Industriel

          • RESTE DE L'APAC Marché de la betterave raffinée par type de source

            • Biologique

            • Conventionnel

          • Perspectives de l'Amérique du Sud (milliards USD, 2019-2032)

            • Marché de la betterave raffinée en Amérique du Sud par type

              • Sucre granulé

              • Sucre liquide

              • Sucre en poudre

              • Sucre roux

            • Marché de la betterave raffinée en Amérique du Sud par type d'application

              • Nourriture et boissons

              • Produits pharmaceutiques

              • Cosmétiques

              • Aliments pour animaux

            • Marché de la betterave raffinée en Amérique du Sud par type d'utilisation finale

              • Ménage

              • Service alimentaire

              • Industriel

            • Marché de la betterave raffinée en Amérique du Sud par type de source

              • Biologique

              • Conventionnel

            • Marché de la betterave raffinée en Amérique du Sud par type régional

              • Brésil

              • Mexique

              • Argentine

              • Reste de l'Amérique du Sud

            • Perspectives du BRÉSIL (milliards USD, 2019-2032)

            • BRÉSIL Marché de la betterave raffinée par type

              • Sucre granulé

              • Sucre liquide

              • Sucre en poudre

              • Sucre roux

            • BRESIL Marché de la betterave raffinée par type d'application

              • Nourriture et boissons

              • Produits pharmaceutiques

              • Cosmétiques

              • Aliments pour animaux

            • BRÉSIL Marché de la betterave raffinée par type d'utilisation finale

              • Ménage

              • Service alimentaire

              • Industriel

            • BRESIL Marché de la betterave raffinée par type de source

              • Biologique

              • Conventionnel

            • Perspectives du MEXIQUE (milliards USD, 2019-2032)

            • MEXIQUE Marché de la betterave raffinée par type

              • Sucre granulé

              • Sucre liquide

              • Sucre en poudre

              • Sucre roux

            • MEXIQUE Marché de la betterave raffinée par type d'application

              • Nourriture et boissons

              • Produits pharmaceutiques

              • Cosmétiques

              • Aliments pour animaux

            • MEXIQUE Marché de la betterave raffinée par type d'utilisation finale

              • Ménage

              • Service alimentaire

              • Industriel

            • MEXIQUE Marché de la betterave raffinée par type de source

              • Biologique

              • Conventionnel

            • Perspectives de l'ARGENTINE (milliards USD, 2019-2032)

            • Marché de la betterave raffinée d'ARGENTINE par type

              • Sucre granulé

              • Sucre liquide

              • Sucre en poudre

              • Sucre roux

            • Marché de la betterave raffinée d'ARGENTINE par type d'application

              • Nourriture et boissons

              • Produits pharmaceutiques

              • Cosmétiques

              • Aliments pour animaux

            • Marché de la betterave raffinée d'ARGENTINE par type d'utilisation finale

              • Ménage

              • Service alimentaire

              • Industriel

            • Marché de la betterave raffinée d'ARGENTINE par type de source

              • Biologique

              • Conventionnel

            • Perspectives du reste de l'Amérique du Sud (en milliards de dollars américains, 2019-2032)

            • RESTE DE L'AMÉRIQUE DU SUD Marché de la betterave raffinée par type

              • Sucre granulé

              • Sucre liquide

              • Sucre en poudre

              • Sucre roux

            • RESTE DE L'AMÉRIQUE DU SUD Marché de la betterave raffinée par type d'application

              • Nourriture et boissons

              • Produits pharmaceutiques

              • Cosmétiques

              • Aliments pour animaux

            • RESTE DE L'AMÉRIQUE DU SUD Marché de la betterave raffinée par type d'utilisation finale

              • Ménage

              • Service alimentaire

              • Industriel

            • RESTE DE L'AMÉRIQUE DU SUD Marché de la betterave raffinée par type de source

              • Biologique

              • Conventionnel

            • Perspectives MEA (milliards USD, 2019-2032)

              • Marché de la betterave raffinée MEA par type

                • Sucre granulé

                • Sucre liquide

                • Sucre en poudre

                • Sucre roux

              • Marché de la betterave raffinée MEA par type d'application

                • Nourriture et boissons

                • Produits pharmaceutiques

                • Cosmétiques

                • Aliments pour animaux

              • Marché de la betterave raffinée MEA par type d'utilisation finale

                • Ménage

                • Service alimentaire

                • Industriel

              • Marché de la betterave raffinée MEA par type de source

                • Biologique

                • Conventionnel

              • Marché de la betterave raffinée MEA par type régional

                • Pays du CCG

                • Afrique du Sud

                • Reste de la MEA

              • Perspectives des pays du CCG (en milliards de dollars, 2019-2032)

              • PAYS DU CCG Marché de la betterave raffinée par type

                • Sucre granulé

                • Sucre liquide

                • Sucre en poudre

                • Sucre roux

              • PAYS DU CCG Marché de la betterave raffinée par applicationnType

                • Nourriture et boissons

                • Produits pharmaceutiques

                • Cosmétiques

                • Aliments pour animaux

              • PAYS DU CCG Marché de la betterave raffinée par type d'utilisation finale

                • Ménage

                • Service alimentaire

                • Industriel

              • PAYS DU CCG Marché de la betterave raffinée par type de source

                • Biologique

                • Conventionnel

              • Perspectives de l'AFRIQUE DU SUD (milliards USD, 2019-2032)

              • AFRIQUE DU SUD Marché de la betterave raffinée par type

                • Sucre granulé

                • Sucre liquide

                • Sucre en poudre

                • Sucre roux

              • AFRIQUE DU SUD Marché de la betterave raffinée par type d'application

                • Nourriture et boissons

                • Produits pharmaceutiques

                • Cosmétiques

                • Aliments pour animaux

              • AFRIQUE DU SUD Marché de la betterave raffinée par type d'utilisation finale

                • Ménage

                • Service alimentaire

                • Industriel

              • Marché de la betterave raffinée en AFRIQUE DU SUD par type de source

                • Biologique

                • Conventionnel

              • Perspectives RESTE DES MEA (milliards USD, 2019-2032)

              • RESTE DE MEA Marché de la betterave raffinée par type

                • Sucre granulé

                • Sucre liquide

                • Sucre en poudre

                • Sucre roux

              • RESTE DU MEA Marché de la betterave raffinée par type d'application

                • Nourriture et boissons

                • Produits pharmaceutiques

                • Cosmétiques

                • Aliments pour animaux

              • RESTE DE MEA Marché de la betterave raffinée par type d'utilisation finale

                • Ménage

                • Service alimentaire

                • Industriel

              • RESTE DU MEA Marché de la betterave raffinée par type de source

                • Biologique

                • Conventionnel


    Report Infographic
    Free Sample Request

    Kindly complete the form below to receive a free sample of this Report

    Customer Strories

    “I am very pleased with how market segments have been defined in a relevant way for my purposes (such as "Portable Freezers & refrigerators" and "last-mile"). In general the report is well structured. Thanks very much for your efforts.”

    Victoria Milne Founder
    Case Study

    Chemicals and Materials