• Cat-intel
  • MedIntelliX
  • Resources
  • About Us
  • Request Free Sample ×

    Kindly complete the form below to receive a free sample of this Report

    Leading companies partner with us for data-driven Insights

    clients tt-cursor

    Pervasive Computing Ubiquitous Computing Market

    ID: MRFR/ICT/34302-HCR
    100 Pages
    Aarti Dhapte
    September 2025

    Rapport d'étude de marché sur l'informatique omniprésente et l'informatique omniprésente : par application (maisons intelligentes, technologies portables, soins de santé, villes intelligentes, automatisation industrielle), par technologie (réseaux de capteurs, cloud computing, intelligence artificielle, Internet des objets, Edge Computing), par utilisation finale (résidentiel, commercial, établissements de santé, industriel, gouvernement), par type d'appareil (appareils intelligents, systèmes embarqués, appareils mobiles, ord...

    Share:
    Download PDF ×

    We do not share your information with anyone. However, we may send you emails based on your report interest from time to time. You may contact us at any time to opt-out.

    Pervasive Computing and Ubiquitous Computing Market Research Report - Global Forecast to 2032 Infographic
    Purchase Options
    $ 4 950,0
    $ 5 950,0
    $ 7 250,0
    Table of Contents

    Aperçu du marché de l'informatique omniprésente et de l'informatique omniprésente< /strong>

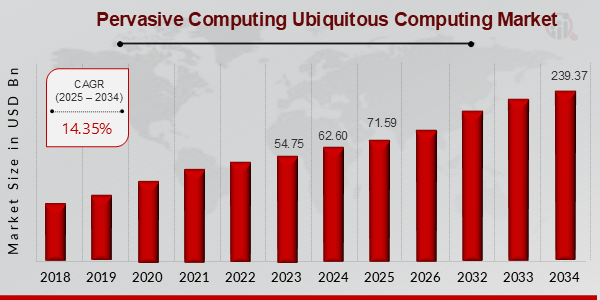
    Selon l'analyse MRFR, l'informatique omniprésente et l'informatique omniprésente La taille du marché a été estimée à 41,87 (milliards USD) en 2022.    Le L’industrie du marché de l’informatique omniprésente et de l’informatique omniprésente devrait passer de 47,87 (milliards USD) en 2023 à 160,0 (milliards USD) d’ici 2032. Le TCAC (taux de croissance) du marché de l’informatique omniprésente et de l’informatique omniprésente devrait être d’environ 14,35 % au cours de la prévision. période (2024 - 2032).

    Principales tendances du marché de l'informatique omniprésente et de l'informatique omniprésente Mis en surbrillance

    Selon une analyse récente, le Global Pervasive Computing et le Le marché de l’informatique omniprésente est prêt à connaître une forte croissance compte tenu de la demande d’environnements intelligents et d’appareils connectés. L’expansion des technologies IoT (Internet des objets), l’adoption croissante des maisons intelligentes et des tendances du marché des vêtements portables sont les principaux moteurs des dirigeants. Les organisations utilisent ces technologies pour améliorer l’efficacité opérationnelle et le service client, suscitant ainsi des innovations. En outre, l’accent croissant mis sur l’automatisation et le traitement des données en temps réel a conduit à des progrès dans les applications informatiques omniprésentes. La capacité de capturer, d'interpréter et d'exécuter des données instantanément révolutionne les opérations des secteurs, qu'il s'agisse de la santé ou de l'industrie manufacturière.

    Ce marché offre de nombreuses pistes d'exploration, car plus les opportunités résident dans la sécurité et la protection des données. Avec le nombre croissant d’appareils connectés les uns aux autres, il est impératif que les données des utilisateurs soient sécurisées. Ces entreprises peuvent s’attendre à une augmentation de la demande. En outre, les progrès de l’intelligence artificielle et de l’apprentissage automatique peuvent contribuer à intégrer davantage les applications informatiques populaires avec de meilleurs processus d’analyse et d’automatisation. L’inclusion de ces technologies informatiques dans des objets ordinaires crée de nombreuses opportunités pour améliorer les processus dans différentes industries. Aujourd'hui, cependant, certains modèles montrent une transition progressive vers l'informatique de pointe, ou le placement des ressources informatiques et des applications à proximité de la source de génération de données.

    Cela réduit le degré de latence ou de retard et augmente le l'efficacité des temps de réponse et améliore ainsi l'efficacité des applications informatiques populaires. Il y a une augmentation significative de l'adoption de la réalité augmentée et virtuelle qui stimule l'interaction des utilisateurs dans plusieurs secteurs, notamment l'éducation, la formation et le divertissement. L’informatique omniprésente et la technologie blockchain sont une autre tendance qui commence à émerger, dans laquelle les deux sont combinés pour renforcer la sécurité et la transparence. La situation est cependant tout à fait différente, car le marché croît à un rythme rapide et toutes les parties concernées doivent tenir compte de l'évolution rapide des tendances afin de récolter les bénéfices des technologies informatiques omniprésentes et omniprésentes. p>

    Fig 1 : Informatique omniprésente et informatique omniprésente Aperçu du marché

    Informatique omniprésente mondiale et omniprésente Aperçu du marché informatique

    Source : recherche primaire, recherche secondaire, Base de données MRFR et examen par les analystes

    L'informatique omniprésente et les moteurs du marché de l'informatique omniprésente< /strong>

    Adoption accrue des appareils IoT

    L'adoption croissante des appareils Internet des objets (IoT) est une force motrice importante pour l’industrie du marché de l’informatique omniprésente et de l’informatique omniprésente. À mesure que de plus en plus d’appareils sont interconnectés, le volume de données que les organisations peuvent exploiter augmente considérablement. Cette interconnectivité facilite un flux transparent d’informations qui améliore la prise de décision et l’efficacité opérationnelle dans divers secteurs. De nombreux secteurs, notamment les soins de santé, l'industrie manufacturière et les villes intelligentes, capitalisent sur les technologies IoT, ce qui conduit à des investissements plus importants dans des solutions informatiques omniprésentes. Avec la demande croissante d'applications innovantes qui s'appuient sur des données en temps réel, le marché est témoin d'une transformation qui est soutenu par les progrès du cloud computing, de l’informatique de pointe et de l’analyse des données. De plus, cette transformation encourage le développement d’écosystèmes intelligents qui non seulement améliorent l’expérience utilisateur mais contribuent également à des pratiques durables. L'adoption de la technologie de la maison intelligente et de l'automatisation industrielle illustre encore davantage cette tendance, créant un écosystème dans lequel les appareils communiquent intelligemment tout en améliorant la productivité. L'accent mis sur une automatisation accrue et des analyses plus intelligentes devrait élever les capacités opérationnelles, propulsant le marché vers l'avant dans les années à venir. /envergure>

    Progrès en matière d'IA et d'apprentissage automatique fort>

    Progrès en matière d'intelligence artificielle (IA) et de technologies d'apprentissage automatique sont cruciaux pour la croissance de l’industrie du marché de l’informatique omniprésente et de l’informatique omniprésente. Ces technologies permettent aux appareils d'apprendre de leur environnement et de prendre des décisions intelligentes sans intervention humaine. En intégrant l'IA et l'apprentissage automatique dans des systèmes informatiques omniprésents, les entreprises peuvent optimiser leurs opérations, améliorer l'expérience utilisateur et améliorer l'efficacité des services. La capacité d'analyser de grandes quantités de données permet aux organisations d'obtenir des informations qui prennent en charge la maintenance prédictive, les services personnalisés et une gestion améliorée des ressources. . Cette évolution technologique favorise un environnement dans lequel les appareils intelligents peuvent s'adapter et réagir en temps réel, favorisant ainsi l'innovation et l'adoption dans divers secteurs, notamment la santé, la finance et l'industrie manufacturière.

    Demande croissante de villes intelligentes

    Le besoin croissant d'initiatives de villes intelligentes est un autre moteur important influencer l’industrie du marché de l’informatique omniprésente et de l’informatique omniprésente. À mesure que les populations urbaines continuent de croître, les villes sont confrontées à des défis liés aux infrastructures, à la gestion des ressources et à la durabilité. Les technologies des villes intelligentes visent à résoudre ces problèmes en utilisant des solutions informatiques omniprésentes pour renforcer la sécurité publique, améliorer les systèmes de transport et optimiser la consommation d'énergie. Le développement d'infrastructures intelligentes grâce à des capteurs et des appareils connectés favorise une allocation efficace des ressources et permet une surveillance en temps réel des opérations de la ville. . En conséquence, les investissements dans les projets de villes intelligentes augmentent rapidement, ouvrant la voie à des applications et des services innovants qui améliorent la qualité de la vie urbaine.

    Informations sur le segment de marché de l'informatique omniprésente et de l'informatique omniprésente

    Informations sur les applications du marché de l'informatique omniprésente et de l'informatique omniprésente

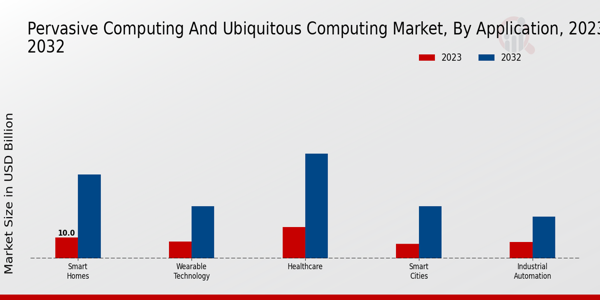
    Le marché de l'informatique omniprésente et omniprésente, en particulier au sein du Le segment des applications présente un paysage robuste caractérisé par des opportunités diverses et un potentiel de croissance important. En 2023, la valeur globale de ce segment est évaluée à environ 47,87 milliards USD, reflétant une forte adoption de technologies avancées dans diverses applications. L'un des domaines dominants est celui des maisons intelligentes, évaluées à 10,0 milliards de dollars en 2023, et qui devrait atteindre 40,0 milliards de dollars d'ici 2032. L'essor des technologies de maison intelligente, telles que l'éclairage automatisé, les systèmes de sécurité et les appareils intelligents, souligne leur rôle crucial. en augmentant la commodité et l’efficacité énergétique pour les consommateurs. De même, la technologie portable, dont la valorisation s'élève à 8,0 milliards de dollars en 2023 et qui devrait atteindre 25,0 milliards de dollars d'ici 2032, démontre son impact significatif sur la gestion de la santé personnelle, le suivi de la condition physique et la connectivité, engageant ainsi les consommateurs et les entreprises. Les soins de santé constituent un autre axe majeur de ce marché, initialement évalué à 15,0 milliards USD en 2023 et qui devrait atteindre 50,0 milliards USD d'ici 2032. Ce secteur est largement motivé par le besoin de surveillance à distance des patients, de télémédecine et d'analyse des données de santé, qui ont gagné en popularité. l’élan post-pandémique, démontrant le caractère essentiel de la technologie pour améliorer les soins aux patients et rationaliser les services de santé. En outre, les villes intelligentes apparaissent comme un objectif essentiel, avec une valeur marchande de 7,0 milliards de dollars qui pourrait atteindre 25,0 milliards de dollars d'ici 2032. Le développement d'infrastructures intelligentes, y compris les systèmes de transport et les réseaux de sécurité publique, signifie une tendance croissante à l'urbanisation, visant à améliorer la vie en ville grâce à des solutions durables et efficaces. Enfin, l'automatisation industrielle, qui représente actuellement 7,87 milliards de dollars et devrait atteindre 20,0 milliards de dollars d'ici 2032, met l'accent sur l'intégration des dispositifs IoT et de la robotique avancée pour améliorer l'efficacité opérationnelle et la productivité dans la fabrication et la logistique, ce qui en fait un domaine de croissance crucial à l'échelle mondiale. -secteur industriel en évolution. L'interaction de ces applications au sein du marché de l'informatique omniprésente et de l'informatique omniprésente est sur le point de façonner de manière significative le paysage futur, sous l'impulsion des progrès technologiques continus et de l'évolution des préférences des consommateurs.

    Fig 2 : Informatique omniprésente et informatique omniprésente Aperçus du marché

    Informatique omniprésente et marché informatique omniprésent Informations sur les applications

    Source : recherche primaire, recherche secondaire, Base de données MRFR et examen par les analystes

    Informations technologiques sur le marché de l'informatique omniprésente et de l'informatique omniprésente

    Le marché de l'informatique omniprésente et omniprésente, évalué à environ 47,87 milliards USD en 2023, présente un solide potentiel de croissance tiré par diverses avancées technologiques. Le marché devrait atteindre une valorisation d’environ 160,0 milliards USD d’ici 2032, reflétant une forte évolution au sein du secteur. Les domaines clés contribuant à cette croissance comprennent les réseaux de capteurs, qui jouent un rôle crucial dans la collecte de données à des fins d'analyse, améliorant ainsi les processus décisionnels dans tous les secteurs. Le cloud computing a un impact significatif sur l'efficacité du stockage et de la gestion des données, permettant un accès transparent aux informations. L'intelligence artificielle continue de révolutionner les opérations, en fournissant des informations et une automatisation qui améliorent l'efficacité. L'Internet des objets intègre des appareils et des solutions intelligentes, ce qui facilite la communication et l'échange de données en temps réel. Enfin, Edge Computing se concentre sur le traitement des données au plus près de la source, réduisant ainsi la latence et améliorant l'efficacité opérationnelle. Ces segments contribuent collectivement aux statistiques croissantes du marché de l’informatique omniprésente et de l’informatique omniprésente, avec des tendances indiquant une évolution vers des systèmes plus interconnectés et intelligents qui profitent à diverses industries grâce à des fonctionnalités et des capacités opérationnelles améliorées. À mesure que ce marché évolue, il présente des opportunités substantielles tout en étant confronté à des défis. liés à la sécurité des données et à l'évolutivité de l'infrastructure.

    Informatique omniprésente et utilisation finale sur le marché de l'informatique omniprésente Informations

    Le marché de l'informatique omniprésente et omniprésente devrait être évalué à 47,87 milliards USD d’ici 2023, reflétant des progrès substantiels dans divers secteurs. Le marché, classé par utilisation finale, est considérablement influencé par l'adoption croissante de technologies intelligentes qui améliorent l'efficacité opérationnelle et l'engagement des parties prenantes. Dans le secteur résidentiel, la préférence des consommateurs pour les appareils domestiques intelligents contribue à sa croissance notable, tandis que le secteur commercial bénéficie d'outils d'automatisation et d'analyse de données qui améliorent les opérations commerciales. Les établissements de santé exploitent l'informatique omniprésente pour améliorer la gestion des patients et les systèmes de prestation de soins de santé, ce qui en fait un secteur vital sur le marché. Les applications industrielles se concentrent sur les solutions IoT, optimisant les processus de production et minimisant les temps d'arrêt. Parallèlement, les initiatives gouvernementales visent à développer des villes intelligentes, stimulant ainsi la demande d’intégration technologique dans les services publics. Dans l'ensemble, ces segments présentent un mélange d'adoption de technologies innovantes et d'applications transformatrices, renforçant l'importance du marché de l'informatique omniprésente et de l'informatique omniprésente dans divers scénarios d'utilisation finale.

    Type de périphérique du marché de l'informatique omniprésente et de l'informatique omniprésente Informations

    Le marché de l'informatique omniprésente et omniprésente, évalué à 47,87 Le milliard de dollars américains en 2023 connaît une croissance notable sur différents types d'appareils. Ce marché se caractérise par plusieurs segments, notamment les appareils intelligents, les systèmes embarqués, les appareils mobiles, les ordinateurs et les appareils IoT, chacun contribuant de manière significative à la dynamique du marché. Les appareils intelligents jouent un rôle central en améliorant la connectivité et la commodité dans la vie quotidienne, conquérant ainsi une part de marché considérable. Les systèmes embarqués sont essentiels à leur intégration dans diverses applications, minimisant ainsi la complexité opérationnelle. Les appareils mobiles, avec leur adoption généralisée, continuent de dominer le paysage technologique grand public en offrant portabilité et accès instantané à l'information. Pendant ce temps, les ordinateurs sont essentiels pour les tâches informatiques plus intensives dans des contextes personnels et professionnels. Le segment des appareils IoT apparaît de plus en plus important, reflétant la demande d'appareils interconnectés, repoussant les limites de l'automatisation et du partage de données dans pratiquement tous les secteurs. Cette diversification entre les types d'appareils stimule l'innovation et présente des opportunités tant pour les entreprises que pour les consommateurs. La progression du marché est influencée par des tendances telles que la numérisation accrue et les progrès technologiques, tandis que des défis tels que la sécurité des données et l'interopérabilité restent des préoccupations pertinentes ayant un impact sur la croissance globale.

    Informations régionales sur le marché de l'informatique omniprésente et de l'informatique omniprésente

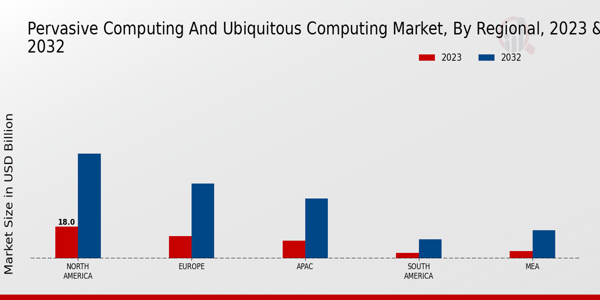
    La segmentation régionale du marché de l'informatique omniprésente et de l'informatique omniprésente présente un solide potentiel de croissance, avec un marché global évalué à 47,87 milliards USD en 2023. L’Amérique du Nord détient une part majoritaire avec 18,0 milliards USD, qui devrait augmenter considérablement pour atteindre 58,8 milliards USD d’ici 2032, soulignant son rôle central dans les progrès et innovations technologiques. L'Europe suit avec une valorisation de 12,5 milliards USD en 2023, qui devrait atteindre 42,0 milliards USD, ce qui indique une forte présence sur le marché tirée par l'adoption croissante des technologies intelligentes. La région APAC, évaluée à 10,0 milliards USD, devrait croître pour atteindre 33,6 milliards USD. , principalement alimentée par une urbanisation rapide et des infrastructures numériques en expansion. L’Amérique du Sud et la MEA représentent des marchés plus petits mais remarquables, avec des valorisations de 3,2 milliards de dollars et 4,17 milliards de dollars en 2023, respectivement, et des projections de 10,7 milliards de dollars et 15,9 milliards de dollars d’ici 2032, reflétant les opportunités émergentes dans ces régions. Ensemble, ces informations révèlent un paysage diversifié dans lequel l'Amérique du Nord domine tandis que l'APAC et l'Europe sont des acteurs importants qui stimulent l'évolution du marché de l'informatique omniprésente et de l'informatique omniprésente.

    Fig 3 : Informatique omniprésente et informatique omniprésente Aperçus régionaux du marché

    Informatique omniprésente et marché informatique omniprésent Aperçus régionaux

    Source : recherche primaire, recherche secondaire, Base de données MRFR et examen par les analystes

    Acteurs clés du marché de l'informatique omniprésente et de l'informatique omniprésente et informations concurrentielles

    Le marché de l'informatique omniprésente et omniprésente se caractérise par un paysage dynamique porté par les progrès technologiques continus et une intégration croissante des appareils intelligents dans la vie quotidienne. Ce marché englobe un large éventail d'applications allant de la gestion des ressources d'entreprise aux gadgets personnels intelligents, toutes promouvant une connectivité transparente et une expérience utilisateur améliorée. Les perspectives concurrentielles mettent en évidence la manière dont les entreprises exploitent des solutions innovantes pour répondre aux besoins de divers secteurs, notamment la santé, les transports et la maison intelligente. Les tendances clés telles que l'Internet des objets (IoT) et le cloud computing influencent considérablement la dynamique du marché, conduisant à une concurrence accrue entre les entreprises qui s'efforcent d'établir un leadership grâce à des alliances stratégiques, à la recherche et au développement et à un engagement client accru.

    Hewlett Packard Enterprise s'est positionné comme un acteur redoutable dans le marché de l'informatique omniprésente et de l'informatique omniprésente, démontrant ses atouts dans la fourniture de solutions d'infrastructure évolutives et agiles. La société met l'accent sur son engagement en faveur de l'innovation, en particulier dans ses stratégies d'informatique de pointe et de cloud hybride, qui garantissent que les clients peuvent gérer efficacement le traitement et le stockage des données sur plusieurs plates-formes. Le solide portefeuille de services de Hewlett Packard Enterprise, notamment ses solutions informatiques d'entreprise, permet aux entreprises d'exploiter le potentiel de l'informatique omniprésente. Ses vastes capacités de recherche et de développement renforcent encore sa présence sur le marché, permettant à l'entreprise de répondre efficacement aux besoins émergents et aux évolutions technologiques. L'accent stratégique mis sur l'amélioration de l'expérience client, combiné à une chaîne d'approvisionnement résiliente et à une portée mondiale, contribue à son avantage concurrentiel sur le marché. Microsoft se distingue sur le marché de l'informatique omniprésente et de l'informatique omniprésente grâce à ses solutions cloud complètes et à l'intégration de l'intelligence artificielle dans l'ensemble du marché. ses offres logicielles.

    La société excelle dans la promotion de la collaboration et de la connectivité grâce à des plateformes telles que comme Azure, qui permet une gestion et un traitement transparents des données en temps réel. L'engagement de Microsoft en faveur de la sécurité, de la fiabilité et de l'amélioration continue améliore sa proposition de valeur pour les entreprises cherchant à adopter des technologies informatiques omniprésentes. Les partenariats stratégiques et l'écosystème construits autour de ses services créent une expérience utilisateur globale qui s'adresse à divers secteurs en mettant l'accent sur l'efficacité et l'innovation. De plus, l'investissement de Microsoft dans la recherche et le développement en fait un leader capable de naviguer dans les complexités du marché tout en répondant systématiquement aux attentes des clients. Grâce à ses initiatives, Microsoft façonne le futur paysage de l'informatique omniprésente, renforçant ainsi sa position concurrentielle en tant que puissant influenceur du marché.

    Entreprises clés du secteur de l'informatique omniprésente et omniprésente Inclure le marché informatique

    • Hewlett Packard Enterprise
    • Microsoft
    • Google
    • Apple
    • Cisco
    • Qualcomm
    • Dell
    • Amazon
    • IBM
    • NVIDIA
    • Sony
    • Intel
    • HTC
    • Oracle
    • Samsung

    Développements de l'industrie du marché de l'informatique omniprésente et de l'informatique omniprésente

    Les développements récents sur le marché de l'informatique omniprésente et de l'informatique omniprésente indiquent des avancées significatives et des stratégies concurrentielles entre les principaux acteurs. Hewlett Packard Enterprise s'est concentré sur l'amélioration de ses capacités informatiques de pointe, tandis que Microsoft continue d'étendre ses services Azure IoT pour proposer des solutions intégrées pour l'informatique omniprésente. Google investit dans l'intelligence artificielle pour augmenter ses technologies informatiques omniprésentes, améliorant ainsi les interactions des utilisateurs et le traitement des données. Pendant ce temps, Apple a annoncé des mises à jour de son système HomeKit, rendant l'intégration de la maison intelligente plus transparente. Cisco et Qualcomm collaborent également sur des initiatives visant à renforcer l'infrastructure réseau essentielle à l'informatique omniprésente. Les acquisitions ont notamment occupé le devant de la scène ; L'acquisition par Dell d'une société de cybersécurité vise à renforcer ses offres de sécurité informatique de pointe. NVIDIA a étendu ses capacités de traitement graphique grâce à des partenariats stratégiques, renforçant ainsi les performances des applications informatiques omniprésentes. Les valorisations boursières indiquent une trajectoire de croissance robuste, avec des sociétés comme Amazon et IBM tirant parti des solutions basées sur le cloud pour pénétrer davantage dans ce domaine. Ce paysage en évolution met en évidence l'importance de l'innovation et de la collaboration entre les géants de l'industrie pour maintenir un avantage concurrentiel et stimuler l'expansion du marché.

    Informations sur la segmentation du marché de l'informatique omniprésente et de l'informatique omniprésente

    Perspectives des applications du marché de l'informatique omniprésente et de l'informatique omniprésente
    • Maisons intelligentes
    • Technologie portable
    • Soins de santé
    • Villes intelligentes
    • Automatisation industrielle 

    Perspectives technologiques du marché de l'informatique omniprésente et de l'informatique omniprésente
    • Réseaux de capteurs
    • Cloud computing
    • Intelligence artificielle
    • Internet des objets
    • Edge Computing

    Perspectives d'utilisation finale du marché de l'informatique omniprésente et de l'informatique omniprésente < /
    • Résidentiel
    • Commercial
    • Établissements de santé
    • Industriel
    • Gouvernement 

    L'informatique omniprésente et le marché de l'informatique omniprésente Type d'appareil Outlook < /
    • Appareils intelligents
    • Systèmes embarqués
    • Appareils mobiles
    • Ordinateurs
    • Appareils IoT

    Perspectives régionales du marché de l'informatique omniprésente et de l'informatique omniprésente
    • Amérique du Nord
    • Europe
    • Amérique du Sud
    • Asie-Pacifique
    • Moyen-Orient et Afrique

    TABLE DES MATIÈRES


    1. RÉSUMÉ EXÉCUTIF
    1.1. Aperçu du marché
    1.2. Principales conclusions
    1.3. Segmentation du marché
    1.4. Paysage concurrentiel
    1.5. Défis et opportunités
    1.6. Perspectives d'avenir


    2. INTRODUCTION AU MARCHÉ
    2.1. Définition
    2.2. Périmètre de l'étude
    2.2.1. Objectif de recherche
    2.2.2. Hypothèse
    2.2.3. Limites
    3. METHODOLOGIE DE RECHERCHE
    3.1. Présentation
    3.2. Exploration de données
    3.3. Recherche secondaire
    3.4. Recherche primaire
    3.4.1. Entretiens primaires et processus de collecte d'informations
    3.4.2. Répartition des principaux répondants
    3.5. Modèle de prévision
    3.6. Estimation de la taille du marché
    3.6.1. Approche ascendante
    3.6.2. Approche descendante
    3.7. Triangulation des données
    3.8. Validation


    4. DYNAMIQUE DU MARCHÉ
    4.1. Présentation
    4.2. Pilotes
    4.3. Contraintes
    4.4. Opportunités
    5. ANALYSE DES FACTEURS DE MARCHÉ
    5.1. Analyse de la chaîne de valeur
    5.2. Analyse des cinq forces de Porter
    5.2.1. Pouvoir de négociation des fournisseurs
    5.2.2. Pouvoir de négociation des acheteurs
    5.2.3. Menace des nouveaux entrants
    5.2.4. Menace des remplaçants
    5.2.5. Intensité de la rivalité
    5.3. Analyse d'impact du COVID-19
    5.3.1. Analyse d'impact sur le marché
    5.3.2. Impact régional
    5.3.3. Analyse des opportunités et des menaces


    6. MARCHÉ DE L'INFORMATIQUE PERVASIF ET DE L'INFORMATIQUE UBIQUITEUX, PAR APPLICATION (MILLIARDS USD)
    6.1. Maisons intelligentes
    6.2. Technologie portable
    6.3. Santé
    6.4. Villes intelligentes
    6.5. Automatisation industrielle
    7. MARCHÉ INFORMATIQUE PERVASIF ET UBIQUITEUX, PAR TECHNOLOGIE (MILLIARDS USD)
    7.1. Réseaux de capteurs
    7.2. Informatique en nuage
    7.3. Intelligence Artificielle
    7.4. Internet des objets
    7.5. Informatique de pointe
    8. MARCHÉ DE L'INFORMATIQUE PERVASIF ET DE L'INFORMATIQUE UBIQUITEUX, PAR UTILISATION FINALE (MILLIARDS USD)
    8.1. Résidentiel
    8.2. Commercial
    8.3. Établissements de santé
    8.4. Industriel
    8.5. Gouvernement
    9. MARCHÉ DE L'INFORMATIQUE PERVASIVE ET DE L'INFORMATIQUE OMNIQUISE, PAR TYPE D'APPAREIL (MILLIARDS DE USD)
    9.1. Appareils intelligents
    9.2. Systèmes embarqués
    9.3. Appareils mobiles
    9.4. Ordinateurs
    9.5. Appareils IoT
    10. MARCHÉ DE L'INFORMATIQUE PERVASIF ET DE L'INFORMATIQUE UBIQUITEUX, PAR RÉGIONAL (MILLIARDS USD)
    10.1. Amérique du Nord
    10.1.1. États-Unis
    10.1.2. Canada
    10.2. Europe
    10.2.1. Allemagne
    10.2.2. Royaume-Uni
    10.2.3. France
    10.2.4. Russie
    10.2.5. Italie
    10.2.6. Espagne
    10.2.7. Reste de l'Europe
    10.3. APAC
    10.3.1. Chine
    10.3.2. Inde
    10.3.3. Japon
    10.3.4. Corée du Sud
    10.3.5. Malaisie
    10.3.6. Thaïlande
    10.3.7. Indonésie
    10.3.8. Reste de l'APAC
    10.4. Amérique du Sud
    10.4.1. Brésil
    10.4.2. Mexique
    10.4.3. Argentine
    10.4.4. Reste de l'Amérique du Sud
    10.5. AME
    10.5.1. Pays du CCG
    10.5.2. Afrique du Sud
    10.5.3. Reste du MEA


    11. PAYSAGE CONCURRENTIEL
    11.1. Présentation
    11.2. Analyse concurrentielle
    11.3. Analyse des parts de marché
    11.4. Stratégie de croissance majeure sur le marché de l’informatique omniprésente et omniprésente
    11.5. Analyse comparative concurrentielle
    11.6. Acteurs de premier plan en termes de nombre de développements sur le marché de l’informatique omniprésente et de l’informatique omniprésente
    11.7. Développements clés et stratégies de croissance
    11.7.1. Lancement de nouveaux produits/déploiement de services
    11.7.2. Fusion & Acquisitions
    11.7.3. Coentreprises
    11.8. Matrice financière des principaux acteurs
    11.8.1. Chiffre d'affaires et résultat opérationnel
    11.8.2. Dépenses de R&D des principaux acteurs. 2023
    12. PROFILS D'ENTREPRISE
    12.1. Hewlett Packard Entreprise
    12.1.1. Aperçu financier
    12.1.2. Produits proposés
    12.1.3. Développements clés
    12.1.4. Analyse SWOT
    12.1.5. Stratégies clés
    12.2. Microsoft
    12.2.1. Aperçu financier
    12.2.2. Produits proposés
    12.2.3. Développements clés
    12.2.4. Analyse SWOT
    12.2.5. Stratégies clés
    12.3. Google
    12.3.1. Aperçu financier
    12.3.2. Produits proposés
    12.3.3. Développements clés
    12.3.4. Analyse SWOT
    12.3.5. Stratégies clés
    12.4. Pomme
    12.4.1. Aperçu financier
    12.4.2. Produits proposés
    12.4.3. Développements clés
    12.4.4. Analyse SWOT
    12.4.5. Stratégies clés
    12.5. Cisco
    12.5.1. Aperçu financier
    12.5.2. Produits proposés
    12.5.3. Développements clés
    12.5.4. Analyse SWOT
    12.5.5. Stratégies clés
    12.6. Qualcomm
    12.6.1. Aperçu financier
    12.6.2. Produits proposés
    12.6.3. Développements clés
    12.6.4. Analyse SWOT
    12.6.5. Stratégies clés
    12.7. Dell
    12.7.1. Aperçu financier
    12.7.2. Produits proposés
    12.7.3. Développements clés
    12.7.4. Analyse SWOT
    12.7.5. Stratégies clés
    12.8. Amazon
    12.8.1. Aperçu financier
    12.8.2. Produits proposés
    12.8.3. Développements clés
    12.8.4. Analyse SWOT
    12.8.5. Stratégies clés
    12.9. IBM
    12.9.1. Aperçu financier
    12.9.2. Produits proposés
    12.9.3. Développements clés
    12.9.4. Analyse SWOT
    12.9.5. Stratégies clés
    12.10. NVIDIA
    12.10.1. Aperçu financier
    12.10.2. Produits offerts
    12.10.3. Développements clés
    12.10.4. Analyse SWOT
    12.10.5. Stratégies clés
    12.11. Sony
    12.11.1. Aperçu financier
    12.11.2. Produits offerts
    12.11.3. Développements clés
    12.11.4. Analyse SWOT
    12.11.5. Stratégies clés
    12.12. Intel
    12.12.1. Aperçu financier
    12.12.2. Produits offerts
    12.12.3. Développements clés
    12.12.4. Analyse SWOT
    12.12.5. Stratégies clés
    12.13. HTC
    12.13.1. Aperçu financier
    12.13.2. Produits offerts
    12.13.3. Développements clés
    12.13.4. Analyse SWOT
    12.13.5. Stratégies clés
    12.14. Oracle
    12.14.1. Aperçu financier
    12.14.2. Produits offerts
    12.14.3. Développements clés
    12.14.4. Analyse SWOT
    12.14.5. Stratégies clés
    12.15. Samsung
    12.15.1. Aperçu financier
    12.15.2. Produits offerts
    12.15.3. Développements clés
    12.15.4. Analyse SWOT
    12.15.5. Stratégies clés
    13. ANNEXE
    13.1. Références
    13.2. Rapports connexes
    LISTE DES TABLEAUX

    TABLEAU 1. LISTE DES HYPOTHÈSES
    TABLEAU 2. ESTIMATIONS ET ESTIMATIONS DE LA TAILLE DU MARCHÉ DE L'INFORMATIQUE PERVASIVE ET DE L'INFORMATIQUE omniprésente en Amérique du Nord PRÉVISIONS, PAR APPLICATION, 2019-2032 (MILLIARDS USD)
    TABLEAU 3. ESTIMATIONS ET ESTIMATIONS DE LA TAILLE DU MARCHÉ DE L'INFORMATIQUE PERVASIVE ET DE L'INFORMATIQUE OBLIQUISE EN AMÉRIQUE DU NORD PRÉVISIONS, PAR TECHNOLOGIE, 2019-2032 (MILLIARDS USD)
    TABLEAU 4. ESTIMATIONS ET ESTIMATIONS DE LA TAILLE DU MARCHÉ DE L'INFORMATIQUE PERVASIVE ET DE L'INFORMATIQUE UBIQUITÉE EN AMÉRIQUE DU NORD PRÉVISIONS, PAR UTILISATION FINALE, 2019-2032 (MILLIARDS USD)
    TABLEAU 5. ESTIMATIONS DE LA TAILLE DU MARCHÉ DE L'INFORMATIQUE PERVASIVE ET DE L'INFORMATIQUE OBLIQUISE EN AMÉRIQUE DU NORD PRÉVISIONS, PAR TYPE D'APPAREIL, 2019-2032 (MILLIARDS USD)
    TABLEAU 6. ESTIMATIONS DE LA TAILLE ET DU MARCHÉ DE L'INFORMATIQUE PERVASSIVE ET DE L'INFORMATIQUE OBLIQUISE EN AMÉRIQUE DU NORD PRÉVISIONS, PAR RÉGION, 2019-2032 (MILLIARDS USD)
    TABLEAU 7. ESTIMATIONS ET ESTIMATIONS DE LA TAILLE DU MARCHÉ DE L'INFORMATIQUE PERVASIVE ET DE L'INFORMATIQUE UBIQUITÉE AUX ÉTATS-UNIS PRÉVISIONS, PAR APPLICATION, 2019-2032 (MILLIARDS USD)
    TABLEAU 8. ESTIMATIONS ET ESTIMATIONS DE LA TAILLE DU MARCHÉ DE L'INFORMATIQUE PERVASIVE ET DE L'INFORMATIQUE UBIQUITÉE AUX ÉTATS-UNIS PRÉVISIONS, PAR TECHNOLOGIE, 2019-2032 (MILLIARDS USD)
    TABLEAU 9. ESTIMATIONS ET ESTIMATIONS DE LA TAILLE DU MARCHÉ DE L'INFORMATIQUE PERVASIVE ET DE L'INFORMATIQUE UBIQUITÉE AUX ÉTATS-UNIS PRÉVISIONS, PAR UTILISATION FINALE, 2019-2032 (MILLIARDS USD)
    TABLEAU 10. ESTIMATIONS ET ESTIMATIONS DE LA TAILLE DU MARCHÉ DE L'INFORMATIQUE PERVASIVE ET DE L'INFORMATIQUE UBIQUITÉE AUX ÉTATS-UNIS PRÉVISIONS, PAR TYPE D'APPAREIL, 2019-2032 (MILLIARDS USD)
    TABLEAU 11. ESTIMATIONS ET ESTIMATIONS DE LA TAILLE DU MARCHÉ DE L'INFORMATIQUE PERVASIVE ET DE L'INFORMATIQUE UBIQUITÉE AUX ÉTATS-UNIS PRÉVISIONS, PAR RÉGION, 2019-2032 (MILLIARDS USD)
    TABLEAU 12. ESTIMATIONS DE LA TAILLE ET DU MARCHÉ DE L'INFORMATIQUE PERVASIVE ET DE L'INFORMATIQUE OBLIQUISE AU CANADA PRÉVISIONS, PAR APPLICATION, 2019-2032 (MILLIARDS USD)
    TABLEAU 13. ESTIMATIONS DE LA TAILLE ET DU MARCHÉ DE L'INFORMATIQUE PERVASIVE ET DE L'INFORMATIQUE UBIQUITÉE AU CANADA PRÉVISIONS, PAR TECHNOLOGIE, 2019-2032 (MILLIARDS USD)
    TABLEAU 14. ESTIMATIONS DE LA TAILLE ET DU MARCHÉ DE L'INFORMATIQUE PERVASIVE ET DE L'INFORMATIQUE OBLIQUISE AU CANADA PRÉVISIONS, PAR UTILISATION FINALE, 2019-2032 (MILLIARDS USD)
    TABLEAU 15. ESTIMATIONS DE LA TAILLE ET DU MARCHÉ DE L'INFORMATIQUE PERVASIVE ET DE L'INFORMATIQUE OBLIQUISE AU CANADA PRÉVISIONS, PAR TYPE D'APPAREIL, 2019-2032 (MILLIARDS USD)
    TABLEAU 16. ESTIMATIONS DE LA TAILLE ET DU MARCHÉ DE L'INFORMATIQUE PERVASIVE ET DE L'INFORMATIQUE OBLIQUISE AU CANADA PRÉVISIONS, PAR RÉGION, 2019-2032 (MILLIARDS USD)
    TABLEAU 17. ESTIMATIONS ET ESTIMATIONS DE LA TAILLE DU MARCHÉ DE L'INFORMATIQUE PERVASIVE ET DE L'INFORMATIQUE OBLIQUISE EN EUROPE PRÉVISIONS, PAR APPLICATION, 2019-2032 (MILLIARDS USD)
    TABLEAU 18. ESTIMATIONS ET ESTIMATIONS DE LA TAILLE DU MARCHÉ DE L'INFORMATIQUE PERVASIVE ET DE L'INFORMATIQUE OBLIGATOIRE EN EUROPE PRÉVISIONS, PAR TECHNOLOGIE, 2019-2032 (MILLIARDS USD)
    TABLEAU 19. ESTIMATIONS ET ESTIMATIONS DE LA TAILLE DU MARCHÉ DE L'INFORMATIQUE PERVASIVE ET DE L'INFORMATIQUE OBLIQUISE EN EUROPE PRÉVISIONS, PAR UTILISATION FINALE, 2019-2032 (MILLIARDS USD)
    TABLEAU 20. ESTIMATIONS ET ESTIMATIONS DE LA TAILLE DU MARCHÉ DE L'INFORMATIQUE PERVASIVE ET DE L'INFORMATIQUE OBLIQUISE EN EUROPE PRÉVISIONS, PAR TYPE D'APPAREIL, 2019-2032 (MILLIARDS USD)
    TABLEAU 21. ESTIMATIONS ET ESTIMATIONS DE LA TAILLE DU MARCHÉ DE L'INFORMATIQUE PERVASIVE ET DE L'INFORMATIQUE OBLIQUISE EN EUROPE PRÉVISIONS, PAR RÉGION, 2019-2032 (MILLIARDS USD)
    TABLEAU 22. ESTIMATIONS ET ESTIMATIONS DE LA TAILLE DU MARCHÉ DE L'INFORMATIQUE PERVASIVE ET DE L'INFORMATIQUE omniprésente en Allemagne PRÉVISIONS, PAR APPLICATION, 2019-2032 (MILLIARDS USD)
    TABLEAU 23. ESTIMATIONS ET ESTIMATIONS DE LA TAILLE DU MARCHÉ DE L'INFORMATIQUE PERVASIVE ET DE L'INFORMATIQUE UBIQUITEUX EN ALLEMAGNE PRÉVISIONS, PAR TECHNOLOGIE, 2019-2032 (MILLIARDS USD)
    TABLEAU 24. ALLEMAGNE, ESTIMATIONS DE LA TAILLE ET DU MARCHÉ DE L'INFORMATIQUE PERVASIVE ET DE L'INFORMATIQUE OBLIQUISE PRÉVISIONS, PAR UTILISATION FINALE, 2019-2032 (MILLIARDS USD)
    TABLEAU 25. ESTIMATIONS ET ESTIMATIONS DE LA TAILLE DU MARCHÉ DE L'INFORMATIQUE PERVASIVE ET DE L'INFORMATIQUE OBLIQUISE EN ALLEMAGNE PRÉVISIONS, PAR TYPE D'APPAREIL, 2019-2032 (MILLIARDS USD)
    TABLEAU 26. ESTIMATIONS ET ESTIMATIONS DE LA TAILLE DU MARCHÉ DE L'INFORMATIQUE PERVASIVE ET DE L'INFORMATIQUE OBLIQUISE EN ALLEMAGNE PRÉVISIONS, PAR RÉGION, 2019-2032 (MILLIARDS USD)
    TABLEAU 27. ESTIMATIONS ET ESTIMATIONS DE LA TAILLE DU MARCHÉ DE L'INFORMATIQUE PERVASIVE ET DE L'INFORMATIQUE OBLIQUISE AU ROYAUME-UNI PRÉVISIONS, PAR APPLICATION, 2019-2032 (MILLIARDS USD)
    TABLEAU 28. ESTIMATIONS ET ESTIMATIONS DE LA TAILLE DU MARCHÉ DE L'INFORMATIQUE PERVASIVE ET DE L'INFORMATIQUE UBIQUITEUX AU ROYAUME-UNI PRÉVISIONS, PAR TECHNOLOGIE, 2019-2032 (MILLIARDS USD)
    TABLEAU 29. ESTIMATIONS ET ESTIMATIONS DE LA TAILLE DU MARCHÉ DE L'INFORMATIQUE PERVASIVE ET DE L'INFORMATIQUE UBIQUITÉE AU ROYAUME-UNI PRÉVISIONS, PAR UTILISATION FINALE, 2019-2032 (MILLIARDS USD)
    TABLEAU 30. ESTIMATIONS ET ESTIMATIONS DE LA TAILLE DU MARCHÉ DE L'INFORMATIQUE PERVASIVE ET DE L'INFORMATIQUE UBIQUITÉE AU ROYAUME-UNI PRÉVISIONS, PAR TYPE D'APPAREIL, 2019-2032 (MILLIARDS USD)
    TABLEAU 31. ESTIMATIONS ET ESTIMATIONS DE LA TAILLE DU MARCHÉ DE L'INFORMATIQUE PERVASIVE ET DE L'INFORMATIQUE UBIQUITÉE AU ROYAUME-UNI PRÉVISIONS, PAR RÉGIONAL, 2019-2032 (MILLIARDS USD)
    TABLEAU 32. FRANCE, ESTIMATIONS DE LA TAILLE DU MARCHÉ DE L'INFORMATIQUE PERVASIVE ET DE L'INFORMATIQUE UBIQUITÉE & PRÉVISIONS, PAR APPLICATION, 2019-2032 (MILLIARDS USD)
    TABLEAU 33. FRANCE ESTIMATIONS DE LA TAILLE DU MARCHÉ DE L'INFORMATIQUE PERVASIVE ET DE L'INFORMATIQUE UBIQUITÉE & PRÉVISIONS, PAR TECHNOLOGIE, 2019-2032 (MILLIARDS USD)
    TABLEAU 34. FRANCE, ESTIMATIONS DE LA TAILLE DU MARCHÉ DE L'INFORMATIQUE PERVASIVE ET DE L'INFORMATIQUE UBIQUITÉE & PRÉVISIONS, PAR UTILISATION FINALE, 2019-2032 (MILLIARDS USD)
    TABLEAU 35. FRANCE, ESTIMATIONS DE LA TAILLE DU MARCHÉ DE L'INFORMATIQUE PERVASIVE ET DE L'INFORMATIQUE UBIQUITÉE & PRÉVISIONS, PAR TYPE D'APPAREIL, 2019-2032 (MILLIARDS USD)
    TABLEAU 36. FRANCE, ESTIMATIONS DE LA TAILLE DU MARCHÉ DE L'INFORMATIQUE PERVASIVE ET DE L'INFORMATIQUE UBIQUITÉE & PRÉVISIONS, PAR RÉGION, 2019-2032 (MILLIARDS USD)
    TABLEAU 37. ESTIMATIONS ET ESTIMATIONS DE LA TAILLE DU MARCHÉ DE L'INFORMATIQUE PERVASIVE ET DE L'INFORMATIQUE OBLIQUISE EN RUSSIE PRÉVISIONS, PAR APPLICATION, 2019-2032 (MILLIARDS USD)
    TABLEAU 38. ESTIMATIONS ET ESTIMATIONS DE LA TAILLE DU MARCHÉ DE L'INFORMATIQUE PERVASIVE ET DE L'INFORMATIQUE UBIQUITEUX EN RUSSIE PRÉVISIONS, PAR TECHNOLOGIE, 2019-2032 (MILLIARDS USD)
    TABLEAU 39. Estimation de la taille du marché de l'informatique omniprésente et de l'informatique omniprésente en RussieES & PRÉVISIONS, PAR UTILISATION FINALE, 2019-2032 (MILLIARDS USD)
    TABLEAU 40. ESTIMATIONS ET ESTIMATIONS DE LA TAILLE DU MARCHÉ DE L'INFORMATIQUE PERVASIVE ET DE L'INFORMATIQUE OBLIQUISE EN RUSSIE PRÉVISIONS, PAR TYPE D'APPAREIL, 2019-2032 (MILLIARDS USD)
    TABLEAU 41. ESTIMATIONS ET ESTIMATIONS DE LA TAILLE DU MARCHÉ DE L'INFORMATIQUE PERVASIVE ET DE L'INFORMATIQUE OBLIQUISE EN RUSSIE PRÉVISIONS, PAR RÉGION, 2019-2032 (MILLIARDS USD)
    TABLEAU 42. ITALIE, ESTIMATIONS DE LA TAILLE DU MARCHÉ DE L'INFORMATIQUE PERVASIVE ET DE L'INFORMATIQUE UBIQUITÉE & PRÉVISIONS, PAR APPLICATION, 2019-2032 (MILLIARDS USD)
    TABLEAU 43. ITALIE, ESTIMATIONS DE LA TAILLE DU MARCHÉ DE L'INFORMATIQUE PERVASIVE ET DE L'INFORMATIQUE UBIQUITÉE & PRÉVISIONS, PAR TECHNOLOGIE, 2019-2032 (MILLIARDS USD)
    TABLEAU 44. ITALIE, ESTIMATIONS DE LA TAILLE DU MARCHÉ DE L'INFORMATIQUE PERVASIVE ET DE L'INFORMATIQUE UBIQUITÉE & PRÉVISIONS, PAR UTILISATION FINALE, 2019-2032 (MILLIARDS USD)
    TABLEAU 45. ITALIE, ESTIMATIONS DE LA TAILLE ET DU MARCHÉ DE L'INFORMATIQUE PERVASIVE ET DE L'INFORMATIQUE UBIQUITÉE PRÉVISIONS, PAR TYPE D'APPAREIL, 2019-2032 (MILLIARDS USD)
    TABLEAU 46. ITALIE, ESTIMATIONS DE LA TAILLE DU MARCHÉ DE L'INFORMATIQUE PERVASIVE ET DE L'INFORMATIQUE UBIQUITÉE & PRÉVISIONS, PAR RÉGION, 2019-2032 (MILLIARDS USD)
    TABLEAU 47. ESPAGNE, ESTIMATIONS DE LA TAILLE ET DU MARCHÉ DE L'INFORMATIQUE PERVASIVE ET DE L'INFORMATIQUE OBLIQUISE EN ESPAGNE PRÉVISIONS, PAR APPLICATION, 2019-2032 (MILLIARDS USD)
    TABLEAU 48. ESPAGNE, ESTIMATIONS DE LA TAILLE DU MARCHÉ DE L'INFORMATIQUE PERVASIVE ET DE L'INFORMATIQUE UBIQUITÉE & PRÉVISIONS, PAR TECHNOLOGIE, 2019-2032 (MILLIARDS USD)
    TABLEAU 49. ESPAGNE, ESTIMATIONS DE LA TAILLE ET DU MARCHÉ DE L'INFORMATIQUE PERVASIVE ET DE L'INFORMATIQUE OMNIQUISE EN ESPAGNE PRÉVISIONS, PAR UTILISATION FINALE, 2019-2032 (MILLIARDS USD)
    TABLEAU 50. ESPAGNE, ESTIMATIONS ET ESTIMATIONS DE LA TAILLE DU MARCHÉ DE L'INFORMATIQUE PERVASIVE ET DE L'INFORMATIQUE OBLIQUISE EN ESPAGNE PRÉVISIONS, PAR TYPE D'APPAREIL, 2019-2032 (MILLIARDS USD)
    TABLEAU 51. ESPAGNE, ESTIMATIONS DE LA TAILLE ET DU MARCHÉ DE L'INFORMATIQUE PERVASIVE ET DE L'INFORMATIQUE UBIQUITÉE PRÉVISIONS, PAR RÉGION, 2019-2032 (MILLIARDS USD)
    TABLEAU 52. RESTE DE L'EUROPE INFORMATIQUE PERVASIVE ET INFORMATIQUE UBIQUITÉE ESTIMATIONS DE LA TAILLE DU MARCHÉ & PRÉVISIONS, PAR APPLICATION, 2019-2032 (MILLIARDS USD)
    TABLEAU 53. RESTE DE L'EUROPE INFORMATIQUE PERVASIVE ET INFORMATIQUE UBIQUITÉE ESTIMATIONS DE LA TAILLE DU MARCHÉ & PRÉVISIONS, PAR TECHNOLOGIE, 2019-2032 (MILLIARDS USD)
    TABLEAU 54. RESTE DE L'EUROPE INFORMATIQUE PERVASIVE ET INFORMATIQUE UBIQUITÉE ESTIMATIONS DE LA TAILLE DU MARCHÉ & PRÉVISIONS, PAR UTILISATION FINALE, 2019-2032 (MILLIARDS USD)
    TABLEAU 55. RESTE DE L'EUROPE INFORMATIQUE PERVASIVE ET INFORMATIQUE UBIQUITÉE ESTIMATIONS DE LA TAILLE DU MARCHÉ & PRÉVISIONS, PAR TYPE D'APPAREIL, 2019-2032 (MILLIARDS USD)
    TABLEAU 56. RESTE DE L'EUROPE INFORMATIQUE PERVASIVE ET INFORMATIQUE UBIQUITÉE, ESTIMATIONS DE LA TAILLE DU MARCHÉ & PRÉVISIONS, PAR RÉGION, 2019-2032 (MILLIARDS USD)
    TABLEAU 57. ESTIMATIONS ET ESTIMATIONS DE LA TAILLE DU MARCHÉ DE L'INFORMATIQUE PERVASIVE ET DE L'INFORMATIQUE OBLIQUISE APAC PRÉVISIONS, PAR APPLICATION, 2019-2032 (MILLIARDS USD)
    TABLEAU 58. ESTIMATIONS ET ESTIMATIONS DE LA TAILLE DU MARCHÉ DE L'INFORMATIQUE PERVASIVE ET DE L'INFORMATIQUE OBLIQUISE APAC PRÉVISIONS, PAR TECHNOLOGIE, 2019-2032 (MILLIARDS USD)
    TABLEAU 59. ESTIMATIONS ET ESTIMATIONS DE LA TAILLE DU MARCHÉ DE L'INFORMATIQUE PERVASIVE ET DE L'INFORMATIQUE OBLIQUISE APAC PRÉVISIONS, PAR UTILISATION FINALE, 2019-2032 (MILLIARDS USD)
    TABLEAU 60. ESTIMATIONS ET ESTIMATIONS DE LA TAILLE DU MARCHÉ DE L'INFORMATIQUE PERVASIVE ET DE L'INFORMATIQUE OBLIQUISE APAC PRÉVISIONS, PAR TYPE D'APPAREIL, 2019-2032 (MILLIARDS USD)
    TABLEAU 61. ESTIMATIONS ET ESTIMATIONS DE LA TAILLE DU MARCHÉ DE L'INFORMATIQUE PERVASIVE ET DE L'INFORMATIQUE OBLIGATOIRE EN APAC PRÉVISIONS, PAR RÉGION, 2019-2032 (MILLIARDS USD)
    TABLEAU 62. ESTIMATIONS ET ESTIMATIONS DE LA TAILLE DU MARCHÉ DE L'INFORMATIQUE PERVASIVE ET DE L'INFORMATIQUE UBIQUITEUX EN CHINE PRÉVISIONS, PAR APPLICATION, 2019-2032 (MILLIARDS USD)
    TABLEAU 63. ESTIMATIONS ET ESTIMATIONS DE LA TAILLE DU MARCHÉ DE L'INFORMATIQUE PERVASIVE ET DE L'INFORMATIQUE OBLIGATOIRE EN CHINE PRÉVISIONS, PAR TECHNOLOGIE, 2019-2032 (MILLIARDS USD)
    TABLEAU 64. ESTIMATIONS ET ESTIMATIONS DE LA TAILLE DU MARCHÉ DE L'INFORMATIQUE PERVASIVE ET DE L'INFORMATIQUE OBLIQUISE EN CHINE PRÉVISIONS, PAR UTILISATION FINALE, 2019-2032 (MILLIARDS USD)
    TABLEAU 65. ESTIMATIONS ET ESTIMATIONS DE LA TAILLE DU MARCHÉ DE L'INFORMATIQUE PERVASIVE ET DE L'INFORMATIQUE OBLIQUISE EN CHINE PRÉVISIONS, PAR TYPE D'APPAREIL, 2019-2032 (MILLIARDS USD)
    TABLEAU 66. ESTIMATIONS ET ESTIMATIONS DE LA TAILLE DU MARCHÉ DE L'INFORMATIQUE PERVASIVE ET DE L'INFORMATIQUE OBLIQUISE EN CHINE PRÉVISIONS, PAR RÉGION, 2019-2032 (MILLIARDS USD)
    TABLEAU 67. ESTIMATIONS ET ESTIMATIONS DE LA TAILLE DU MARCHÉ DE L'INFORMATIQUE PERVASIVE ET DE L'INFORMATIQUE UBIQUITÉE EN INDE PRÉVISIONS, PAR APPLICATION, 2019-2032 (MILLIARDS USD)
    TABLEAU 68. INDE, ESTIMATIONS DE LA TAILLE DU MARCHÉ DE L'INFORMATIQUE PERVASIVE ET DE L'INFORMATIQUE UBIQUITÉE PRÉVISIONS, PAR TECHNOLOGIE, 2019-2032 (MILLIARDS USD)
    TABLEAU 69. INDE, ESTIMATIONS DE LA TAILLE DU MARCHÉ DE L'INFORMATIQUE PERVASIVE ET DE L'INFORMATIQUE UBIQUITÉE ET AMP; PRÉVISIONS, PAR UTILISATION FINALE, 2019-2032 (MILLIARDS USD)
    TABLEAU 70. ESTIMATIONS ET ESTIMATIONS DE LA TAILLE DU MARCHÉ DE L'INFORMATIQUE PERVASIVE ET DE L'INFORMATIQUE UBIQUITÉE EN INDE PRÉVISIONS, PAR TYPE D'APPAREIL, 2019-2032 (MILLIARDS USD)
    TABLEAU 71. INDE, ESTIMATIONS DE LA TAILLE DU MARCHÉ DE L'INFORMATIQUE PERVASIVE ET DE L'INFORMATIQUE UBIQUITÉE & PRÉVISIONS, PAR RÉGION, 2019-2032 (MILLIARDS USD)
    TABLEAU 72. ESTIMATIONS DE LA TAILLE ET DU MARCHÉ DE L'INFORMATIQUE PERVASIVE ET DE L'INFORMATIQUE UBIQUITÉE AU JAPON PRÉVISIONS, PAR APPLICATION, 2019-2032 (MILLIARDS USD)
    TABLEAU 73. ESTIMATIONS ET ESTIMATIONS DE LA TAILLE DU MARCHÉ DE L'INFORMATIQUE PERVASIVE ET DE L'INFORMATIQUE UBIQUITÉE AU JAPON PRÉVISIONS, PAR TECHNOLOGIE, 2019-2032 (MILLIARDS USD)
    TABLEAU 74. ESTIMATIONS ET ESTIMATIONS DE LA TAILLE DU MARCHÉ DE L'INFORMATIQUE PERVASIVE ET DE L'INFORMATIQUE UBIQUITÉE AU JAPON PRÉVISIONS, PAR UTILISATION FINALE, 2019-2032 (MILLIARDS USD)
    TABLEAU 75. ESTIMATIONS ET ESTIMATIONS DE LA TAILLE DU MARCHÉ DE L'INFORMATIQUE PERVASIVE ET DE L'INFORMATIQUE UBIQUITÉE AU JAPON PRÉVISIONS, PAR TYPE D'APPAREIL, 2019-2032 (MILLIARDS USD)
    TABLEAU 76. ESTIMATIONS ET ESTIMATIONS DE LA TAILLE DU MARCHÉ DE L'INFORMATIQUE PERVASIVE ET DE L'INFORMATIQUE UBIQUITÉE AU JAPON PRÉVISIONS, PAR RÉGION, 2019-2032 (MILLIARDS USD)
    TABLEAU 77. ESTIMATIONS DE LA TAILLE ET DU MARCHÉ DE L'INFORMATIQUE PERVASIVE ET DE L'INFORMATIQUE OBLIQUIS EN CORÉE DU SUD PRÉVISIONS, PAR APPLICATION, 2019-2032 (MILLIARDS USD)
    TABLEAU 78. ESTIMATIONS ET ESTIMATIONS DE LA TAILLE DU MARCHÉ DE L'INFORMATIQUE PERVASIVE ET DE L'INFORMATIQUE OBLIQUISE EN CORÉE DU SUD PRÉVISIONS, PAR TECHNOLOGIE, 2019-2032 (MILLIARDS USD)
    TABLEAU 79. ESTIMATIONS ET ESTIMATIONS DE LA TAILLE DU MARCHÉ DE L'INFORMATIQUE PERVASSIVE ET DE L'INFORMATIQUE OBLIQUISE EN CORÉE DU SUD PRÉVISIONS, PAR UTILISATION FINALE, 2019-2032 (MILLIARDS USD)
    TABLEAU 80. ESTIMATIONS ET ESTIMATIONS DE LA TAILLE DU MARCHÉ DE L'INFORMATIQUE PERVASIVE ET DE L'INFORMATIQUE OBLIQUISE EN CORÉE DU SUD PRÉVISIONS, PAR TYPE D'APPAREIL, 2019-2032 (MILLIARDS USD)
    TABLEAU 81. ESTIMATIONS ET ESTIMATIONS DE LA TAILLE DU MARCHÉ DE L'INFORMATIQUE PERVASIVE ET DE L'INFORMATIQUE OBLIQUISE EN CORÉE DU SUD PRÉVISIONS, PAR RÉGION, 2019-2032 (MILLIARDS USD)
    TABLEAU 82. ESTIMATIONS ET ESTIMATIONS DE LA TAILLE DU MARCHÉ DE L'INFORMATIQUE PERVASIVE ET DE L'INFORMATIQUE OBLIQUISE EN MALAISIE PRÉVISIONS, PAR APPLICATION, 2019-2032 (MILLIARDS USD)
    TABLEAU 83. ESTIMATIONS ET ESTIMATIONS DE LA TAILLE DU MARCHÉ DE L'INFORMATIQUE PERVASIVE ET DE L'INFORMATIQUE OBLIQUISE EN MALAISIE PRÉVISIONS, PAR TECHNOLOGIE, 2019-2032 (MILLIARDS USD)
    TABLEAU 84. ESTIMATIONS ET ESTIMATIONS DE LA TAILLE DU MARCHÉ DE L'INFORMATIQUE PERVASIVE ET DE L'INFORMATIQUE omniprésente en MALAISIE PRÉVISIONS, PAR UTILISATION FINALE, 2019-2032 (MILLIARDS USD)
    TABLEAU 85. ESTIMATIONS ET ESTIMATIONS DE LA TAILLE DU MARCHÉ DE L'INFORMATIQUE PERVASIVE ET DE L'INFORMATIQUE OBLIQUISE EN MALAISIE PRÉVISIONS, PAR TYPE D'APPAREIL, 2019-2032 (MILLIARDS USD)
    TABLEAU 86. ESTIMATIONS ET ESTIMATIONS DE LA TAILLE DU MARCHÉ DE L'INFORMATIQUE PERVASIVE ET DE L'INFORMATIQUE omniprésente en MALAISIE PRÉVISIONS, PAR RÉGION, 2019-2032 (MILLIARDS USD)
    TABLEAU 87. THAÏLANDE, ESTIMATIONS ET ESTIMATIONS DE LA TAILLE DU MARCHÉ DE L'INFORMATIQUE PERVASIVE ET DE L'INFORMATIQUE UBIQUITÉE. PRÉVISIONS, PAR APPLICATION, 2019-2032 (MILLIARDS USD)
    TABLEAU 88. THAÏLANDE, ESTIMATIONS ET ESTIMATIONS DE LA TAILLE DU MARCHÉ DE L'INFORMATIQUE PERVASIVE ET DE L'INFORMATIQUE OBLIQUISE ; PRÉVISIONS, PAR TECHNOLOGIE, 2019-2032 (MILLIARDS USD)
    TABLEAU 89. THAÏLANDE, ESTIMATIONS ET ESTIMATIONS DE LA TAILLE DU MARCHÉ DE L'INFORMATIQUE PERVASSIVE ET DE L'INFORMATIQUE OBLIQUISE ; PRÉVISIONS, PAR UTILISATION FINALE, 2019-2032 (MILLIARDS USD)
    TABLEAU 90. THAÏLANDE, ESTIMATIONS ET ESTIMATIONS DE LA TAILLE DU MARCHÉ DE L'INFORMATIQUE PERVASSIVE ET DE L'INFORMATIQUE UBIQUITÉE. PRÉVISIONS, PAR TYPE D'APPAREIL, 2019-2032 (MILLIARDS USD)
    TABLEAU 91. THAÏLANDE, ESTIMATIONS DE LA TAILLE ET DU MARCHÉ DE L'INFORMATIQUE PERVASIVE ET DE L'INFORMATIQUE OBLIQUISE PRÉVISIONS, PAR RÉGIONAL, 2019-2032 (MILLIARDS USD)
    TABLEAU 92. INDONÉSIE INFORMATIQUE PERVASIVE ET INFORMATIQUE UBIQUITÉE ESTIMATIONS DE LA TAILLE ET DU MARCHÉ PRÉVISIONS, PAR APPLICATION, 2019-2032 (MILLIARDS USD)
    TABLEAU 93. INDONÉSIE INFORMATIQUE PERVASIVE ET INFORMATIQUE UBIQUITÉE ESTIMATIONS DE LA TAILLE ET DU MARCHÉ PRÉVISIONS, PAR TECHNOLOGIE, 2019-2032 (MILLIARDS USD)
    TABLEAU 94. INDONÉSIE INFORMATIQUE PERVASIVE ET INFORMATIQUE UBIQUITÉE ESTIMATIONS DE LA TAILLE DU MARCHÉ & PRÉVISIONS, PAR UTILISATION FINALE, 2019-2032 (MILLIARDS USD)
    TABLEAU 95. INDONÉSIE INFORMATIQUE PERVASIVE ET INFORMATIQUE UBIQUITÉE ESTIMATIONS DE LA TAILLE DU MARCHÉ & PRÉVISIONS, PAR TYPE D'APPAREIL, 2019-2032 (MILLIARDS USD)
    TABLEAU 96. INDONÉSIE INFORMATIQUE PERVASIVE ET INFORMATIQUE UBIQUITÉE ESTIMATIONS DE LA TAILLE DU MARCHÉ & PRÉVISIONS, PAR RÉGION, 2019-2032 (MILLIARDS USD)
    TABLEAU 97. RESTE DE L'INFORMATIQUE PERVASIVE ET DE L'INFORMATIQUE omniprésente ESTIMATIONS DE LA TAILLE DU MARCHÉ & PRÉVISIONS, PAR APPLICATION, 2019-2032 (MILLIARDS USD)
    TABLEAU 98. RESTE DE L'INFORMATIQUE PERVASIVE ET DE L'INFORMATIQUE UBIQUITÉE, ESTIMATIONS DE LA TAILLE DU MARCHÉ & PRÉVISIONS, PAR TECHNOLOGIE, 2019-2032 (MILLIARDS USD)
    TABLEAU 99. RESTE DE L'INFORMATIQUE PERVASIVE ET DE L'INFORMATIQUE UBIQUITÉE, ESTIMATIONS DE LA TAILLE DU MARCHÉ & PRÉVISIONS, PAR UTILISATION FINALE, 2019-2032 (MILLIARDS USD)
    TABLEAU 100. RESTE DE L'INFORMATIQUE PERVASIVE ET DE L'INFORMATIQUE UBIQUITÉE, ESTIMATIONS DE LA TAILLE DU MARCHÉ & PRÉVISIONS, PAR TYPE D'APPAREIL, 2019-2032 (MILLIARDS USD)
    TABLEAU 101. RESTE DE L'INFORMATIQUE PERVASIVE ET DE L'INFORMATIQUE UBIQUITÉE, ESTIMATIONS DE LA TAILLE DU MARCHÉ & PRÉVISIONS, PAR RÉGION, 2019-2032 (MILLIARDS USD)
    TABLEAU 102. ESTIMATIONS ET ESTIMATIONS DE LA TAILLE DU MARCHÉ DE L'INFORMATIQUE PERVASSIVE ET DE L'INFORMATIQUE OBLIQUISE EN AMÉRIQUE DU SUD PRÉVISIONS, PAR APPLICATION, 2019-2032 (MILLIARDS USD)
    TABLEAU 103. ESTIMATIONS ET ESTIMATIONS DE LA TAILLE DU MARCHÉ DE L'INFORMATIQUE PERVASIVE ET DE L'INFORMATIQUE OBLIQUISE EN AMÉRIQUE DU SUD PRÉVISIONS, PAR TECHNOLOGIE, 2019-2032 (MILLIARDS USD)
    TABLEAU 104. ESTIMATIONS ET ESTIMATIONS DE LA TAILLE DU MARCHÉ DE L'INFORMATIQUE PERVASIVE ET DE L'INFORMATIQUE omniprésente en Amérique du Sud PRÉVISIONS, PAR UTILISATION FINALE, 2019-2032 (MILLIARDS USD)
    TABLEAU 105. ESTIMATIONS ET ESTIMATIONS DE LA TAILLE DU MARCHÉ DE L'INFORMATIQUE PERVASIVE ET DE L'INFORMATIQUE omniprésente en Amérique du Sud PRÉVISIONS, PAR TYPE D'APPAREIL, 2019-2032 (MILLIARDS USD)
    TABLEAU 106. ESTIMATIONS ET ESTIMATIONS DE LA TAILLE DU MARCHÉ DE L'INFORMATIQUE PERVASIVE ET DE L'INFORMATIQUE omniprésente en Amérique du Sud PRÉVISIONS, PAR RÉGION, 2019-2032 (MILLIARDS USD)
    TABLEAU 107. BRÉSIL, ESTIMATIONS ET ESTIMATIONS DE LA TAILLE DU MARCHÉ DE L'INFORMATIQUE PERVASIVE ET DE L'INFORMATIQUE OBLIQUISE PRÉVISIONS, PAR APPLICATION, 2019-2032 (MILLIARDS USD)
    TABLEAU 108. BRÉSIL, ESTIMATIONS ET ESTIMATIONS DE LA TAILLE DU MARCHÉ DE L'INFORMATIQUE PERVASIVE ET DE L'INFORMATIQUE UBIQUITÉE. PRÉVISIONS, PAR TECHNOLOGIE, 2019-2032 (MILLIARDS USD)
    TABLEAU 109. BRÉSIL, ESTIMATIONS ET ESTIMATIONS DE LA TAILLE DU MARCHÉ DE L'INFORMATIQUE PERVASSIVE ET DE L'INFORMATIQUE UBIQUITÉE. PRÉVISIONS, PAR UTILISATION FINALE, 2019-2032 (MILLIARDS USD)
    TABLEAU 110. BRÉSIL, ESTIMATIONS ET ESTIMATIONS DE LA TAILLE DU MARCHÉ DE L'INFORMATIQUE PERVASIVE ET DE L'INFORMATIQUE OBLIQUISE PRÉVISIONS, PAR TYPE D'APPAREIL, 2019-2032 (MILLIARDS USD)
    TABLEAU 111. BRÉSIL, ESTIMATIONS ET ESTIMATIONS DE LA TAILLE DU MARCHÉ DE L'INFORMATIQUE PERVASIVE ET DE L'INFORMATIQUE OBLIQUISE PRÉVISIONS, PAR RÉGION, 2019-2032 (MILLIARDS USD)
    TABLEAU 112. MEXIQUE, ESTIMATIONS ET ESTIMATIONS DE LA TAILLE DU MARCHÉ DE L'INFORMATIQUE PERVASIVE ET DE L'INFORMATIQUE omniprésente au Mexique. PRÉVISIONS, PAR APPLICATION, 2019-2032 (MILLIARDS USD)
    TABLEAU 113. MEXIQUE, ESTIMATIONS ET ESTIMATIONS DE LA TAILLE DU MARCHÉ DE L'INFORMATIQUE PERVASIVE ET DE L'INFORMATIQUE OBLIQUISE PRÉVISIONS, PAR TECHNOLOGIE, 2019-2032 (MILLIARDS USD)
    TABLEAU 114. MEXIQUE, ESTIMATIONS ET ESTIMATIONS DE LA TAILLE DU MARCHÉ DE L'INFORMATIQUE PERVASIVE ET DE L'INFORMATIQUE OBLIQUISE PRÉVISIONS, PAR UTILISATION FINALE, 2019-2032 (MILLIARDS USD)
    TABLEAU 115. MEXIQUE, ESTIMATIONS ET ESTIMATIONS DE LA TAILLE DU MARCHÉ DE L'INFORMATIQUE PERVASIVE ET DE L'INFORMATIQUE OBLIQUISE PRÉVISIONS, PAR TYPE D'APPAREIL, 2019-2032 (MILLIARDS USD)
    TABLEAU 116. MEXIQUE, ESTIMATIONS ET ESTIMATIONS DE LA TAILLE DU MARCHÉ DE L'INFORMATIQUE PERVASIVE ET DE L'INFORMATIQUE OBLIQUISE PRÉVISIONS, PAR RÉGION, 2019-2032 (MILLIARDS USD)
    TABLEAU 117. ESTIMATIONS ET ESTIMATIONS DE LA TAILLE DU MARCHÉ DE L'INFORMATIQUE PERVASIVE ET DE L'INFORMATIQUE omniprésente en Argentine PRÉVISIONS, PAR APPLICATION, 2019-2032 (MILLIARDS USD)
    TABLEAU 118. ESTIMATIONS ET ESTIMATIONS DE LA TAILLE DU MARCHÉ DE L'INFORMATIQUE PERVASIVE ET DE L'INFORMATIQUE OBLIQUISE EN ARGENTINE PRÉVISIONS, PAR TECHNOLOGIE, 2019-2032 (MILLIARDS USD)
    TABLEAU 119. ESTIMATIONS ET ESTIMATIONS DE LA TAILLE DU MARCHÉ DE L'INFORMATIQUE PERVASIVE ET DE L'INFORMATIQUE OBLIQUISE EN ARGENTINE PRÉVISIONS, PAR UTILISATION FINALE, 2019-2032 (MILLIARDS USD)
    TABLEAU 120. ESTIMATIONS ET ESTIMATIONS DE LA TAILLE DU MARCHÉ DE L'INFORMATIQUE PERVASIVE ET DE L'INFORMATIQUE OBLIQUISE EN ARGENTINE PRÉVISIONS, PAR TYPE D'APPAREIL, 2019-2032 (MILLIARDS USD)
    TABLEAU 121. ESTIMATIONS ET AMP; PRÉVISIONS, PAR RÉGION, 2019-2032 (MILLIARDS USD)
    TABLEAU 122. RESTE DE L'AMÉRIQUE DU SUD INFORMATIQUE PERVASIVE ET INFORMATIQUE UBIQUITÉE ESTIMATIONS DE LA TAILLE DU MARCHÉ & PRÉVISIONS, PAR APPLICATION, 2019-2032 (MILLIARDS USD)
    TABLEAU 123. RESTE DE L'AMÉRIQUE DU SUD INFORMATIQUE PERVASIVE ET INFORMATIQUE UBIQUITÉE ESTIMATIONS DE LA TAILLE DU MARCHÉ & PRÉVISIONS, PAR TECHNOLOGIE, 2019-2032 (MILLIARDS USD)
    TABLEAU 124. RESTE DE L'AMÉRIQUE DU SUD INFORMATIQUE PERVASIVE ET INFORMATIQUE UBIQUITÉE ESTIMATIONS DE LA TAILLE DU MARCHÉ & PRÉVISIONS, PAR UTILISATION FINALE, 2019-2032 (MILLIARDS USD)
    TABLEAU 125. RESTE DE L'AMÉRIQUE DU SUD INFORMATIQUE PERVASIVE ET INFORMATIQUE UBIQUITÉE ESTIMATIONS DE LA TAILLE DU MARCHÉ & PRÉVISIONS, PAR TYPE D'APPAREIL, 2019-2032 (MILLIARDS USD)
    TABLEAU 126. RESTE DE L'AMÉRIQUE DU SUD, ESTIMATIONS DE LA TAILLE DU MARCHÉ DE L'INFORMATIQUE PERVASIVE ET DE L'INFORMATIQUE UBIQUITÉE & PRÉVISIONS, PAR RÉGION, 2019-2032 (MILLIARDS USD)
    TABLEAU 127. ESTIMATIONS ET ESTIMATIONS DE LA TAILLE DU MARCHÉ DE L'INFORMATIQUE PERVASIVE ET DE L'INFORMATIQUE UBIQUITÉE PAR MEA PRÉVISIONS, PAR APPLICATION, 2019-2032 (MILLIARDS USD)
    TABLEAU 128. ESTIMATIONS ET ESTIMATIONS DE LA TAILLE DU MARCHÉ DE L'INFORMATIQUE PERVASIVE ET DE L'INFORMATIQUE UBIQUITÉE PAR MEA PRÉVISIONS, PAR TECHNOLOGIE, 2019-2032 (MILLIARDS USD)
    TABLEAU 129. ESTIMATIONS ET ESTIMATIONS DE LA TAILLE DU MARCHÉ DE L'INFORMATIQUE PERVASIVE ET DE L'INFORMATIQUE UBIQUITÉE PAR MEA PRÉVISIONS, PAR UTILISATION FINALE, 2019-2032 (MILLIARDS USD)
    TABLEAU 130. ESTIMATIONS ET ESTIMATIONS DE LA TAILLE DU MARCHÉ DE L'INFORMATIQUE PERVASIVE ET DE L'INFORMATIQUE UBIQUITÉE PAR LES MEA PRÉVISIONS, PAR TYPE D'APPAREIL, 2019-2032 (MILLIARDS USD)
    TABLEAU 131. ESTIMATIONS ET ESTIMATIONS DE LA TAILLE DU MARCHÉ DE L'INFORMATIQUE PERVASIVE ET DE L'INFORMATIQUE UBIQUITÉE PAR MEA PRÉVISIONS, PAR RÉGION, 2019-2032 (MILLIARDS USD)
    TABLEAU 132. PAYS DU CCG INFORMATIQUE PERVASIVE ET INFORMATIQUE UBIQUITÉE ESTIMATIONS DE LA TAILLE DU MARCHÉ & PRÉVISIONS, PAR APPLICATION, 2019-2032 (MILLIARDS USD)
    TABLEAU 133. PAYS DU CCG INFORMATIQUE PERVASIVE ET INFORMATIQUE UBIQUITÉE ESTIMATIONS DE LA TAILLE DU MARCHÉ & PRÉVISIONS, PAR TECHNOLOGIE, 2019-2032 (MILLIARDS USD)
    TABLEAU 134. PAYS DU CCG INFORMATIQUE PERVASIVE ET INFORMATIQUE UBIQUITÉE ESTIMATIONS DE LA TAILLE DU MARCHÉ & PRÉVISIONS, PAR UTILISATION FINALE, 2019-2032 (MILLIARDS USD)
    TABLEAU 135. ESTIMATIONS ET ESTIMATIONS DE LA TAILLE DU MARCHÉ DE L'INFORMATIQUE PERVASIVE ET DE L'INFORMATIQUE UBIQUITÉE DANS LES PAYS DU CCG PRÉVISIONS, PAR TYPE D'APPAREIL, 2019-2032 (MILLIARDS USD)
    TABLEAU 136. PAYS DU CCG INFORMATIQUE PERVASIVE ET INFORMATIQUE UBIQUITÉE ESTIMATIONS DE LA TAILLE DU MARCHÉ & PRÉVISIONS, PAR RÉGION, 2019-2032 (MILLIARDS USD)
    TABLEAU 137. ESTIMATIONS DE LA TAILLE ET DU MARCHÉ DE L'INFORMATIQUE PERVASSIVE ET DE L'INFORMATIQUE OBLIQUISE EN AFRIQUE DU SUD PRÉVISIONS, PAR APPLICATION, 2019-2032 (MILLIARDS USD)
    TABLEAU 138. ESTIMATIONS ET ESTIMATIONS DE LA TAILLE DU MARCHÉ DE L'INFORMATIQUE PERVASIVE ET DE L'INFORMATIQUE OBLIQUISE EN AFRIQUE DU SUD PRÉVISIONS, PAR TECHNOLOGIE, 2019-2032 (MILLIARDS USD)
    TABLEAU 139. AFRIQUE DU SUD INFORMATIQUE PERVASIVE ET INFORMATIQUE UBIQUITÉE, ESTIMATIONS DE LA TAILLE DU MARCHÉ & PRÉVISIONS, PAR UTILISATION FINALE, 2019-2032 (MILLIARDS USD)
    TABLEAU 140. ESTIMATIONS ET ESTIMATIONS DE LA TAILLE DU MARCHÉ DE L'INFORMATIQUE omniprésente et de l'informatique omniprésente en Afrique du Sud PRÉVISIONS, PAR TYPE D'APPAREIL, 2019-2032 (MILLIARDS USD)
    TABLEAU 141. ESTIMATIONS DE LA TAILLE ET DU MARCHÉ DE L'INFORMATIQUE PERVASIVE ET DE L'INFORMATIQUE OBLIQUISE EN AFRIQUE DU SUD PRÉVISIONS, PAR RÉGION, 2019-2032 (MILLIARDS USD)
    TABLEAU 142. RESTE DES AME, ESTIMATIONS DE LA TAILLE DU MARCHÉ DE L'INFORMATIQUE PERVASIVE ET DE L'INFORMATIQUE UBIQUITÉE & PRÉVISIONS, PAR APPLICATION, 2019-2032 (MILLIARDS USD)
    TABLEAU 143. ESTIMATIONS ET ESTIMATIONS DE LA TAILLE DU MARCHÉ DE L'INFORMATIQUE PERVASIVE ET DE L'INFORMATIQUE UBIQUITÉE DU RESTE DES AME PRÉVISIONS, PAR TECHNOLOGIE, 2019-2032 (MILLIARDS USD)
    TABLEAU 144. RESTE DES MEA INFORMATIQUE PERVASIVE ET INFORMATIQUE UBIQUITÉE ESTIMATIONS DE LA TAILLE DU MARCHÉ & PRÉVISIONS, PAR UTILISATION FINALE, 2019-2032 (MILLIARDS USD)
    TABLEAU 145. RESTE DES MEA INFORMATIQUE PERVASIVE ET INFORMATIQUE UBIQUITÉE, ESTIMATIONS DE LA TAILLE DU MARCHÉ & PRÉVISIONS, PAR TYPE D'APPAREIL, 2019-2032 (MILLIARDS USD)
    TABLEAU 146. RESTE DES MEA INFORMATIQUE PERVASIVE ET INFORMATIQUE UBIQUITÉE, ESTIMATIONS DE LA TAILLE DU MARCHÉ & PRÉVISIONS, PAR RÉGIONAL, 2019-2032 (MILLIARDS USD)
    TABLEAU 147. LANCEMENT DE PRODUIT/DÉVELOPPEMENT DE PRODUIT/APPROBATION
    TABLEAU 148. ACQUISITION/PARTENARIAT


    LISTE DES CHIFFRES

    FIGURE 1. SYNOPSIS DU MARCHÉ
    FIGURE 2. ANALYSE DU MARCHÉ DE L'INFORMATIQUE PERVASIVE ET DE L'INFORMATIQUE UBIQUITÉE EN AMÉRIQUE DU NORD
    FIGURE 3. ÉTATS-UNIS ANALYSE DU MARCHÉ DE L'INFORMATIQUE PERVASIVE ET DE L'INFORMATIQUE UBIQUITÉE PAR APPLICATION
    FIGURE 4. ANALYSE DU MARCHÉ DE L'INFORMATIQUE PERVASIVE ET DE L'INFORMATIQUE UBIQUITÉE AUX ÉTATS-UNIS PAR TECHNOLOGIE
    FIGURE 5. ANALYSE DU MARCHÉ DE L'INFORMATIQUE PERVASIVE ET DE L'INFORMATIQUE UBIQUITÉE AUX ÉTATS-UNIS PAR UTILISATION FINALE
    FIGURE 6 . ANALYSE DU MARCHÉ DE L'INFORMATIQUE PERVASIVE ET DE L'INFORMATIQUE UBIQUITANTE PAR TYPE D'APPAREIL
    FIGURE 7. ANALYSE DU MARCHÉ DE L'INFORMATIQUE PERVASIVE ET DE L'INFORMATIQUE UBIQUITANTE AUX ÉTATS-UNIS PAR RÉGION
    FIGURE 8. ANALYSE DU MARCHÉ DE L'INFORMATIQUE PERVASIVE ET DE L'INFORMATIQUE UBIQUISE AU CANADA PAR APPLICATION
    FIGURE 9. CANADA INFORMATIQUE PERVASIVE ET ANALYSE DU MARCHÉ DE L'INFORMATIQUE PERVASIVE PAR TECHNOLOGIE
    FIGURE 10. ANALYSE DU MARCHÉ DE L'INFORMATIQUE PERVASIVE ET DE L'INFORMATIQUE UBIQUITÉE AU CANADA PAR UTILISATION FINALE
    FIGURE 11. ANALYSE DU MARCHÉ DE L'INFORMATIQUE PERVASIVE ET DE L'INFORMATIQUE URBAIN AU CANADA PAR TYPE D'APPAREIL
    FIGURE 12. CANADA INFORMATIQUE PERVASIVE ET ANALYSE DU MARCHÉ DE L'INFORMATIQUE PERVASIVE PAR RÉGION
    FIGURE 13. ANALYSE DU MARCHÉ DE L'INFORMATIQUE PERVASIVE ET DE L'INFORMATIQUE PERVASIVE EN EUROPE
    FIGURE 14. ANALYSE DU MARCHÉ DE L'INFORMATIQUE PERVASIVE ET DE L'INFORMATIQUE PERVASIVE EN ALLEMAGNE PAR APPLICATION
    FIGURE 15. ALLEMAGNE INFORMATIQUE PERVASIVE ET ANALYSE DU MARCHÉ DE L'INFORMATIQUE PERVASIVE ET ANALYSE DU MARCHÉ DE L'INFORMATIQUE UBIQUITÉE PAR TECHNOLOGIE
    FIGURE 16. ANALYSE DU MARCHÉ DE L'INFORMATIQUE PERVASIVE ET DE L'INFORMATIQUE omniprésente en ALLEMAGNE PAR UTILISATION FINALE
    FIGURE 17. ANALYSE DU MARCHÉ DE L'INFORMATIQUE PERVASIVE ET DE L'INFORMATIQUE omniprésente en ALLEMAGNE PAR TYPE D'APPAREIL
    FIGURE 18. ANALYSE DU MARCHÉ DE L'INFORMATIQUE PERVASIVE ET DE L'INFORMATIQUE PERVASIVE EN ALLEMAGNE PAR RÉGION
    FIGURE 19. ANALYSE DU MARCHÉ DE L'INFORMATIQUE PERVASIVE ET DE L'INFORMATIQUE omniprésente AU ROYAUME-UNI PAR APPLICATION
    FIGURE 20. ANALYSE DU MARCHÉ DE L'INFORMATIQUE PERVASIVE ET DE L'INFORMATIQUE omniprésente AU ROYAUME-UNI PAR TECHNOLOGIE
    FIGURE 21 . ANALYSE DU MARCHÉ DE L'INFORMATIQUE PERVASIVE ET DE L'INFORMATIQUE omniprésente au Royaume-Uni par utilisation finale
    FIGURE 22. ANALYSE DU MARCHÉ DE L'informatique omniprésente et de l'informatique omniprésente au Royaume-Uni par type d'appareil
    FIGURE 23. ANALYSE DU MARCHÉ DE L'informatique omniprésente et de l'informatique omniprésente au Royaume-Uni par
    FIGURE 24. FRANCE ANALYSE DU MARCHÉ DE L'INFORMATIQUE PERVASIVE ET DE L'INFORMATIQUE UBIQUITÉE PAR APPLICATION
    FIGURE 25. FRANCE ANALYSE DU MARCHÉ DE L'INFORMATIQUE PERVASIVE ET DE L'INFORMATIQUE UBIQUITÉE PAR TECHNOLOGIE
    FIGURE 26. FRANCE ANALYSE DU MARCHÉ DE L'INFORMATIQUE PERVASIVE ET DE L'INFORMATIQUE UBIQUISE PAR UTILISATION FINALE
    FIGURE 27 . FRANCE ANALYSE DU MARCHÉ DE L'INFORMATIQUE PERVASIVE ET DE L'INFORMATIQUE UBIQUITÉE PAR TYPE D'APPAREIL
    FIGURE 28. FRANCE ANALYSE DU MARCHÉ DE L'INFORMATIQUE PERVASIVE ET DE L'INFORMATIQUE UBIQUITÉE PAR RÉGION
    FIGURE 29. RUSSIE ANALYSE DU MARCHÉ DE L'INFORMATIQUE PERVASIVE ET DE L'INFORMATIQUE UBIQUISE PAR APPLICATION
    FIGURE 30 . RUSSIE ANALYSE DU MARCHÉ DE L'INFORMATIQUE PERVASIVE ET DE L'INFORMATIQUE UBIQUITÉE PAR TECHNOLOGIE
    FIGURE 31. ANALYSE DU MARCHÉ DE L'INFORMATIQUE PERVASIVE ET DE L'INFORMATIQUE UBIQUITÉE EN RUSSIE PAR UTILISATION FINALE
    FIGURE 32. ANALYSE DU MARCHÉ DE L'INFORMATIQUE PERVASIVE ET DE L'INFORMATIQUE omniprésente EN RUSSIE PAR TYPE D'APPAREIL
    FIGURE 33. ANALYSE DU MARCHÉ DE L'INFORMATIQUE PERVASIVE ET DE L'INFORMATIQUE omniprésente en Russie par région
    FIGURE 34. ANALYSE DU MARCHÉ DE L'informatique omniprésente et de l'informatique omniprésente en Italie par application
    FIGURE 35. ANALYSE DU MARCHÉ DE L'INFORMATIQUE PERVASIVE ET DE L'INFORMATIQUE omniprésente en ITALIE PAR TECHNOLOGIE
    FIGURE 36. ANALYSE DU MARCHÉ DE L'INFORMATIQUE PERVASIVE ET DE L'INFORMATIQUE omniprésente en Italie par utilisation finale
    FIGURE 37. ANALYSE DU MARCHÉ DE L'informatique omniprésente et de l'informatique omniprésente en Italie par type d'appareil
    FIGURE 38. ANALYSE DU MARCHÉ DE L'informatique omniprésente et de l'informatique omniprésente en Italie par
    REGIONAL
    FIGURE 39. ESPAGNE ANALYSE DU MARCHÉ DE L'INFORMATIQUE PERVASIVE ET DE L'INFORMATIQUE omniprésente par application
    FIGURE 40. Espagne ANALYSE DU MARCHÉ DE L'informatique omniprésente et de l'informatique omniprésente par technologie
    FIGURE 41. ESPAGNE ANALYSE DU MARCHÉ DE L'INFORMATIQUE PERVASIVE ET DE L'INFORMATIQUE omniprésente PAR UTILISATION FINALE
    FIGURE 42. ANALYSE DU MARCHÉ DE L'INFORMATIQUE PERVASIVE ET DE L'INFORMATIQUE PERVASIVE EN ESPAGNE PAR TYPE D'APPAREIL
    FIGURE 43. ANALYSE DU MARCHÉ DE L'INFORMATIQUE PERVASIVE ET DE L'INFORMATIQUE PERVASIVE EN ESPAGNE PAR RÉGION
    FIGURE 44. RESTE DE L'EUROPE INFORMATIQUE PERVASIVE ET Un marché informatique omniprésent ANALYSE PAR APPLICATION
    FIGURE 45. RESTE DE L'EUROPE ANALYSE DU MARCHÉ DE L'INFORMATIQUE PERVASIVE ET DE L'INFORMATIQUE UBIQUITÉE PAR TECHNOLOGIE
    FIGURE 46. RESTE DE L'EUROPE ANALYSE DU MARCHÉ DE L'INFORMATIQUE PERVASIVE ET DE L'INFORMATIQUE UBIQUITÉE PAR UTILISATION FINALE
    FIGURE 47. REST DE L'INFORMATIQUE PERVASIVE EN EUROPE ET ANALYSE DU MARCHÉ DE L'INFORMATIQUE UBIQUITÉE PAR TYPE D'APPAREIL
    FIGURE 48. RESTE DE L'EUROPE ANALYSE DU MARCHÉ DE L'INFORMATIQUE PERVASIVE ET DE L'INFORMATIQUE UBIQUITÉE PAR RÉGION
    FIGURE 49. APAC ANALYSE DU MARCHÉ DE L'INFORMATIQUE PERVASIVE ET DE L'INFORMATIQUE UBIQUITOUS
    FIGURE 50. CHINE PERVASIVE INFORMATIQUE ET ANALYSE DU MARCHÉ DE L'INFORMATIQUE PERVASIVE EN CHINE PAR APPLICATION
    FIGURE 51. ANALYSE DU MARCHÉ DE L'INFORMATIQUE PERVASIVE ET DE L'INFORMATIQUE omniprésente EN CHINE PAR TECHNOLOGIE
    FIGURE 52. ANALYSE DU MARCHÉ DE L'INFORMATIQUE PERVASIVE ET DE L'INFORMATIQUE PERVASIVE EN CHINE PAR UTILISATION FINALE
    FIGURE 53. CHINE PERVASIVE INFORMATIQUE ET ANALYSE DU MARCHÉ DE L'INFORMATIQUE PERVASIVE ET DE L'INFORMATIQUE OBLIQUISE PAR TYPE D'APPAREIL
    FIGURE 54. CHINE ANALYSE DU MARCHÉ DE L'INFORMATIQUE PERVASIVE ET DE L'INFORMATIQUE UBIQUITÉE PAR RÉGION
    FIGURE 55. INDE ANALYSE DU MARCHÉ DE L'INFORMATIQUE PERVASIVE ET DE L'INFORMATIQUE OBLIQUISE PAR APPLICATION
    FIGURE 56. INDE INFORMATIQUE PERVASIVE ET ANALYSE DU MARCHÉ DE L'INFORMATIQUE omniprésente par technologie
    FIGURE 57. INDE ANALYSE DU MARCHÉ DE L'INFORMATIQUE omniprésente et de l'informatique omniprésente par utilisation finale
    FIGURE 58. INDE ANALYSE DU MARCHÉ DE L'INFORMATIQUE omniprésente et de l'informatique omniprésente par type d'appareil
    FIGURE 59. INDE ENVAHISSANT ANALYSE DU MARCHÉ DE L'INFORMATIQUE PERVASIVE ET DE L'INFORMATIQUE omniprésente par région
    FIGURE 60. ANALYSE DU MARCHÉ DE L'informatique omniprésente et de l'informatique omniprésente au Japon par application
    FIGURE 61. ANALYSE DU MARCHÉ DE L'informatique omniprésente et de l'informatique omniprésente au Japon par technologie
    FIGURE 62. JAPON ENVAHISSANT ANALYSE DU MARCHÉ DE L'INFORMATIQUE PERVASSIVE ET DE L'INFORMATIQUE omniprésente par utilisation finale
    FIGURE 63. ANALYSE DU MARCHÉ DE L'informatique omniprésente et de l'informatique omniprésente au Japon par type d'appareil
    FIGURE 64. ANALYSE DU MARCHÉ DE L'INFORMATIQUE PERVASIVE ET DE L'INFORMATIQUE omniprésente au Japon par
    FIGURE 65 RÉGIONALE CORÉE DU SUD ANALYSE DU MARCHÉ DE L'INFORMATIQUE PERVASIVE ET DE L'INFORMATIQUE UBIQUITÉE PAR APPLICATION
    FIGURE 66. ANALYSE DU MARCHÉ DE L'INFORMATIQUE PERVASIVE ET DE L'INFORMATIQUE UBIQUITÉE EN CORÉE DU SUD PAR TECHNOLOGIE
    FIGURE 67. ANALYSE DU MARCHÉ DE L'INFORMATIQUE PERVASIVE ET DE L'INFORMATIQUE UBIQUITÉE EN CORÉE DU SUD PAR UTILISATION FINALE
    CHIFFRE 68. ANALYSE DU MARCHÉ DE L'INFORMATIQUE PERVASIVE ET DE L'INFORMATIQUE omniprésente en Corée du Sud par type d'appareil
    FIGURE 69. ANALYSE DU MARCHÉ DE L'informatique omniprésente et de l'informatique omniprésente en Corée du Sud par région
    FIGURE 70. MALAISIE ANALYSE DU MARCHÉ DE L'INFORMATIQUE PERVASIVE ET DE L'INFORMATIQUE omniprésente PAR APPLICATION < br />FIGURE 71. ANALYSE DU MARCHÉ DE L'INFORMATIQUE PERVASIVE ET DE L'INFORMATIQUE omniprésente en Malaisie par technologie
    FIGURE 72. ANALYSE DU MARCHÉ DE L'informatique omniprésente et de l'informatique omniprésente en Malaisie par utilisation finale
    FIGURE 73. MARCHÉ DE L'informatique omniprésente et de l'informatique omniprésente en Malaisie ANALYSE PAR TYPE D'APPAREIL
    FIGURE 74. ANALYSE DU MARCHÉ DE L'INFORMATIQUE PERVASIVE ET DE L'INFORMATIQUE PERVASIVE EN MALAISIE PAR RÉGION
    FIGURE 75. ANALYSE DU MARCHÉ DE L'INFORMATIQUE PERVASIVE ET DE L'INFORMATIQUE PERVASIVE EN THAÏLANDE PAR APPLICATION
    FIGURE 76. THAÏLANDE ANALYSE DU MARCHÉ DE L'INFORMATIQUE PAR TECHNOLOGIE
    FIGURE 77. ANALYSE DU MARCHÉ DE L'INFORMATIQUE PERVASIVE ET DE L'INFORMATIQUE UBIQUITÉE EN THAÏLANDE PAR UTILISATION FINALE
    FIGURE 78. ANALYSE DU MARCHÉ DE L'INFORMATIQUE PERVASIVE ET DE L'INFORMATIQUE UBIQUITÉE EN THAÏLANDE PAR TYPE D'APPAREIL
    FIGURE 79. THAÏLANDE PERVASIVE INFORMATIQUE ET ANALYSE DU MARCHÉ DE L'INFORMATIQUE omniprésente par région
    FIGURE 80. INDONÉSIE INFORMATIQUE PERVASIVE ET UANALYSE DU MARCHÉ DE L'INFORMATIQUE PERVASIVE ET DE L'INFORMATIQUE UBIQUITÉE EN INDONÉSIE
    FIGURE 81. ANALYSE DU MARCHÉ DE L'INFORMATIQUE PERVASIVE ET DE L'INFORMATIQUE UBIQUITÉE EN INDONÉSIE PAR UTILISATION FINALE
    FIGURE 83. INDONÉSIE ANALYSE DU MARCHÉ DE L'INFORMATIQUE PERVASIVE ET DE L'INFORMATIQUE omniprésente par type d'appareil
    FIGURE 84. INDONÉSIE ANALYSE DU MARCHÉ DE L'INFORMATIQUE PERVASIVE ET DE L'INFORMATIQUE omniprésente PAR RÉGION
    FIGURE 85. RESTE DE L'APAC ANALYSE DU MARCHÉ DE L'INFORMATIQUE PERVASIVE ET DE L'INFORMATIQUE omniprésente PAR APPLICATION
    CHIFFRE 86. ANALYSE DU MARCHÉ DE L'INFORMATIQUE PERVASIVE ET DE L'INFORMATIQUE UBIQUITÉE DANS LE RESTE DE L'APAC PAR TECHNOLOGIE
    FIGURE 87. ANALYSE DU MARCHÉ DE L'INFORMATIQUE PERVASIVE ET DE L'INFORMATIQUE UBIQUITÉE DANS LE RESTE DE L'APAC PAR UTILISATION FINALE
    FIGURE 88. RESTE DE L'INFORMATIQUE PERVASIVE ET DU MARCHÉ DE L'INFORMATIQUE UBIQUITÉE EN APAC ANALYSE PAR TYPE D'APPAREIL
    FIGURE 89. RESTE DE L'APAC ANALYSE DU MARCHÉ DE L'INFORMATIQUE PERVASIVE ET DE L'INFORMATIQUE UBIQUITÉE PAR RÉGION
    FIGURE 90. ANALYSE DU MARCHÉ DE L'INFORMATIQUE PERVASIVE ET DE L'INFORMATIQUE PERVASIVE EN AMÉRIQUE DU SUD
    FIGURE 91. BRÉSIL MARCHÉ INFORMATIQUE ANALYSE PAR APPLICATION
    FIGURE 92. ANALYSE DU MARCHÉ DE L'INFORMATIQUE PERVASIVE ET DE L'INFORMATIQUE PERVASIVE AU BRÉSIL PAR TECHNOLOGIE
    FIGURE 93. ANALYSE DU MARCHÉ DE L'INFORMATIQUE PERVASIVE ET DE L'INFORMATIQUE PERVASIVE AU BRÉSIL PAR UTILISATION FINALE
    FIGURE 94. BRÉSIL INFORMATIQUE PERVASIVE ET INFORMATIQUE UBIQUITE ANALYSE DU MARCHÉ DE L'INFORMATIQUE PERVASIVE PAR TYPE D'APPAREIL
    FIGURE 95. ANALYSE DU MARCHÉ DE L'INFORMATIQUE PERVASIVE ET DE L'INFORMATIQUE PERVASIVE AU BRÉSIL PAR RÉGION
    FIGURE 96. ANALYSE DU MARCHÉ DE L'INFORMATIQUE PERVASIVE ET DE L'INFORMATIQUE PERVASIVE AU MEXIQUE PAR APPLICATION
    FIGURE 97. MEXIQUE INFORMATIQUE PERVASIVE ET ANALYSE DU MARCHÉ DE L'INFORMATIQUE PERVASIVE PAR TECHNOLOGIE
    FIGURE 98. MEXIQUE ANALYSE DU MARCHÉ DE L'INFORMATIQUE PERVASIVE ET DE L'INFORMATIQUE OBLIQUISE PAR UTILISATION FINALE
    FIGURE 99. MEXIQUE ANALYSE DU MARCHÉ DE L'INFORMATIQUE PERVASIVE ET DE L'INFORMATIQUE UBIQUISE PAR TYPE D'APPAREIL
    FIGURE 100. MEXIQUE ANALYSE DU MARCHÉ DE L'INFORMATIQUE PERVASIVE ET DE L'INFORMATIQUE UBIQUITÉE PAR RÉGION
    FIGURE 101. ARGENTINE ANALYSE DU MARCHÉ DE L'INFORMATIQUE PERVASIVE ET DE L'INFORMATIQUE omniprésente PAR APPLICATION
    FIGURE 102. ARGENTINE ANALYSE DU MARCHÉ DE L'INFORMATIQUE PERVASIVE ET DE L'INFORMATIQUE UBIQUISE PAR TECHNOLOGIE
    FIGURE 103. ANALYSE DU MARCHÉ DE L'INFORMATIQUE PERVASIVE ET DE L'INFORMATIQUE PERVASIVE EN ARGENTINE PAR UTILISATION FINALE
    FIGURE 104. ANALYSE DU MARCHÉ DE L'INFORMATIQUE PERVASIVE ET DE L'INFORMATIQUE PERVASIVE EN ARGENTINE PAR TYPE D'APPAREIL
    FIGURE 105. ANALYSE DU MARCHÉ DE L'INFORMATIQUE PERVASIVE ET DE L'INFORMATIQUE PERVASIVE EN ARGENTINE PAR TYPE D'APPAREIL RÉGIONAL
    FIGURE 106. RESTE DE L'AMÉRIQUE DU SUD ANALYSE DU MARCHÉ DE L'INFORMATIQUE PERVASIVE ET DE L'INFORMATIQUE UBIQUITÉE PAR APPLICATION
    FIGURE 107. RESTE DE L'AMÉRIQUE DU SUD ANALYSE DU MARCHÉ DE L'INFORMATIQUE PERVASIVE ET DE L'INFORMATIQUE UBIQUISE PAR TECHNOLOGIE
    FIGURE 108. RESTE DE AMÉRIQUE DU SUD ANALYSE DU MARCHÉ DE L'INFORMATIQUE PERVASIVE ET DE L'INFORMATIQUE UBIQUITÉE PAR UTILISATION FINALE
    FIGURE 109. RESTE DE L'AMÉRIQUE DU SUD ANALYSE DU MARCHÉ DE L'INFORMATIQUE PERVASIVE ET DE L'INFORMATIQUE UBIQUITÉE PAR TYPE D'APPAREIL
    FIGURE 110. RESTE DE L'AMÉRIQUE DU SUD ANALYSE DU MARCHÉ DE L'INFORMATIQUE PERVASIVE ET DE L'INFORMATIQUE UBIQUITÉE PAR
    RÉGIONAL
    FIGURE 111. MEA ANALYSE DU MARCHÉ DE L'INFORMATIQUE PERVASIVE ET DE L'INFORMATIQUE UBIQUITÉE
    FIGURE 112. ANALYSE DU MARCHÉ DE L'INFORMATIQUE PERVASIVE ET DE L'INFORMATIQUE UBIQUITÉE DANS LES PAYS DU CCG PAR APPLICATION
    FIGURE 113. PAYS DU CCG ANALYSE PAR TECHNOLOGIE
    FIGURE 114. ANALYSE DU MARCHÉ DE L'INFORMATIQUE PERVASIVE ET DE L'INFORMATIQUE UBIQUITÉE DANS LES PAYS DU CCG PAR UTILISATION FINALE
    FIGURE 115. ANALYSE DU MARCHÉ DE L'INFORMATIQUE PERVASIVE ET DE L'INFORMATIQUE omniprésente dans les pays du CCG PAR TYPE D'APPAREIL
    FIGURE 116. PAYS DU CCG ANALYSE DU MARCHÉ DE L'INFORMATIQUE PERVASIVE ET DE L'INFORMATIQUE OBLIQUISE PAR RÉGION
    FIGURE 117. AFRIQUE DU SUD ANALYSE DU MARCHÉ DE L'INFORMATIQUE PERVASIVE ET DE L'INFORMATIQUE UBIQUISE PAR APPLICATION
    FIGURE 118. AFRIQUE DU SUD ANALYSE DU MARCHÉ DE L'INFORMATIQUE PERVASIVE ET DE L'INFORMATIQUE UBIQUISE PAR TECHNOLOGIE
    FIGURE 119. ANALYSE DU MARCHÉ DE L'INFORMATIQUE PERVASIVE ET DE L'INFORMATIQUE PERVASIVE EN AFRIQUE DU SUD PAR UTILISATION FINALE
    FIGURE 120. ANALYSE DU MARCHÉ DE L'INFORMATIQUE PERVASIVE ET DE L'INFORMATIQUE PERVASIVE EN AFRIQUE DU SUD PAR TYPE D'APPAREIL
    FIGURE 121. AFRIQUE DU SUD DE L'INFORMATIQUE PERVASIVE ET DE L'INFORMATIQUE omniprésente ANALYSE DU MARCHÉ DE L'INFORMATIQUE PAR RÉGION
    FIGURE 122. RESTE DE MEA ANALYSE DU MARCHÉ DE L'INFORMATIQUE PERVASIVE ET DE L'INFORMATIQUE UBIQUITÉE PAR APPLICATION
    FIGURE 123. RESTE DE MEA ANALYSE DU MARCHÉ DE L'INFORMATIQUE PERVASIVE ET DE L'INFORMATIQUE UBIQUITÉE PAR TECHNOLOGIE
    FIGURE 124. RESTE DE LA MEA ANALYSE DU MARCHÉ DE L'INFORMATIQUE PERVASIVE ET DE L'INFORMATIQUE omniprésente par utilisation finale
    FIGURE 125. Reste de l'analyse du marché de l'informatique omniprésente et de l'informatique omniprésente par type d'appareil
    FIGURE 126. Reste de l'analyse du marché de l'informatique omniprésente et de l'informatique omniprésente par région
    br />FIGURE 127. CRITÈRES D'ACHAT CLÉS DU MARCHÉ DE L'INFORMATIQUE PERVASIVE ET DE L'INFORMATIQUE UBIQUITEUX
    FIGURE 128. PROCESSUS DE RECHERCHE DU MRFR
    FIGURE 129. ANALYSE DRO DU MARCHÉ DE L'INFORMATIQUE PERVASIVE ET DE L'INFORMATIQUE UBIQUIT
    FIGURE 130. FACTEURS ANALYSE D'IMPACT : MARCHÉ DE L'INFORMATIQUE PERVASIVE ET DE L'INFORMATIQUE omniprésente
    FIGURE 131. ANALYSE D'IMPACT DES RESTRICTIONS : MARCHÉ DE L'INFORMATIQUE PERVASIVE ET DE L'INFORMATIQUE omniprésente
    FIGURE 132. CHAÎNE D'APPROVISIONNEMENT / DE VALEUR : MARCHÉ DE L'INFORMATIQUE PERVASIVE ET DE L'INFORMATIQUE UBIQUIT
    FIGURE 133. INFORMATIQUE PERVASIVE ET MARCHÉ DE L'INFORMATIQUE omniprésent, par application, 2024 (part en %)
    FIGURE 134. Marché de l'informatique omniprésente, par application, 2019 à 2032 (en milliards de dollars)
    FIGURE 135. Marché de l'informatique omniprésente et de l'informatique omniprésente, par application, 2019 à 2032 (en milliards de dollars)
    FIGURE 135. Marché de l'informatique omniprésente et de l'informatique omniprésente , PAR TECHNOLOGIE, 2024 (% DE PART)
    FIGURE 136. MARCHÉ DE L'INFORMATIQUE PERVASIVE ET DE L'INFORMATIQUE UBIQUITÉE, PAR TECHNOLOGIE, 2019 À 2032 (en milliards de dollars)
    FIGURE 137. MARCHÉ DE L'INFORMATIQUE PERVASIVE ET DE L'INFORMATIQUE UBIQUITÉE, PAR UTILISATION FINALE, 2024 (% PARTAGER)
    CHIFFRE 138. MARCHÉ DE L'INFORMATIQUE PERVASIVE ET DE L'INFORMATIQUE UBIQUITÉE, PAR UTILISATION FINALE, 2019 À 2032 (en milliards de dollars)
    FIGURE 139. MARCHÉ DE L'INFORMATIQUE PERVASIVE ET DE L'INFORMATIQUE UBIQUITE, PAR TYPE D'APPAREIL, 2024 (% DE PART)
    FIGURE 140. INFORMATIQUE PERVASIVE ET UBIQUITÉE MARCHÉ DE L'INFORMATIQUE, PAR TYPE D'APPAREIL, 2019 À 2032 (en milliards de dollars)
    FIGURE 141. MARCHÉ DE L'INFORMATIQUE PERVASIVE ET DE L'INFORMATIQUE UBIQUITÉE, PAR RÉGION, 2024 (PART EN%)
    FIGURE 142. MARCHÉ DE L'INFORMATIQUE PERVASIVE ET DE L'INFORMATIQUE UBIQUITÉE, PAR RÉGIONAL, DE 2019 À 2032 (en milliards USD)
    FIGURE 143. BENCHMARKING DES PRINCIPAUX CONCURRENTS

    Segmentation du marché de l'informatique omniprésente et de l'informatique omniprésente


    • Marché de l’informatique omniprésente et de l’informatique omniprésente par application (en milliards USD, 2019-2032)
      • Maisons intelligentes
      • Technologie portable
      • Soins de santé
      • Villes intelligentes
      • Automatisation industrielle


    • Marché de l’informatique omniprésente et de l’informatique omniprésente par technologie (en milliards USD, 2019-2032)
      • Réseaux de capteurs
      • Cloud computing
      • Intelligence artificielle
      • Internet des objets
      • Edge Computing


    • Marché de l'informatique omniprésente et omniprésente, par utilisation finale (en milliards de dollars américains, 2019-2032)
      • Résidentiel
      • Commercial
      • Établissements de santé
      • Industriel
      • Gouvernement


    • Marché de l’informatique omniprésente et de l’informatique omniprésente par type d’appareil (en milliards de dollars, 2019-2032)
      • Appareils intelligents
      • Systèmes embarqués
      • Appareils mobiles
      • Ordinateurs
      • Appareils IoT


    • Marché de l’informatique omniprésente et omniprésente par région (en milliards de dollars américains, 2019-2032)
      • Amérique du Nord
      • Europe
      • Amérique du Sud
      • Asie-Pacifique
      • Moyen-Orient et Afrique


    Perspectives régionales du marché de l'informatique omniprésente et de l'informatique omniprésente (en milliards de dollars américains, 2019-2032)


    • Perspectives de l'Amérique du Nord (en milliards de dollars, 2019-2032)
      • Marché nord-américain de l'informatique omniprésente et de l'informatique omniprésente, par type d'application
        • Maisons intelligentes
        • Technologie portable
        • Soins de santé
        • Villes intelligentes
        • Automatisation industrielle
      • Marché nord-américain de l'informatique omniprésente et de l'informatique omniprésente, par type de technologie
        • Réseaux de capteurs
        • Cloud computing
        • Intelligence artificielle
        • Internet des objets
        • Edge Computing
      • Marché nord-américain de l'informatique omniprésente et de l'informatique omniprésente, par type d'utilisation finale
        • Résidentiel
        • Commercial
        • Établissements de santé
        • Industriel
        • Gouvernement
      • Marché nord-américain de l'informatique omniprésente et de l'informatique omniprésente, par type d'appareil
        • Appareils intelligents
        • Systèmes embarqués
        • Appareils mobiles
        • Ordinateurs
        • Appareils IoT
      • Marché de l'informatique omniprésente et omniprésente en Amérique du Nord, par type régional
        • États-Unis
        • Canada
      • Perspectives des États-Unis (en milliards de dollars, 2019-2032)
      • Marché américain de l'informatique omniprésente et de l'informatique omniprésente, par type d'application
        • Maisons intelligentes
        • Technologie portable
        • Soins de santé
        • Villes intelligentes
        • Automatisation industrielle
      • Marché américain de l'informatique omniprésente et de l'informatique omniprésente, par type de technologie
        • Réseaux de capteurs
        • Cloud computing
        • Intelligence artificielle
        • Internet des objets
        • Edge Computing
      • Marché américain de l'informatique omniprésente et de l'informatique omniprésente, par type d'utilisation finale
        • Résidentiel
        • Commercial
        • Établissements de santé
        • Industriel
        • Gouvernement
      • Marché américain de l'informatique omniprésente et de l'informatique omniprésente, par type d'appareil
        • Appareils intelligents
        • Systèmes embarqués
        • Appareils mobiles
        • Ordinateurs
        • Appareils IoT
      • Perspectives du CANADA (milliards de dollars américains, 2019-2032)
      • CANADA Marché de l'informatique omniprésente et de l'informatique omniprésente par type d'application
        • Maisons intelligentes
        • Technologie portable
        • Soins de santé
        • Villes intelligentes
        • Automatisation industrielle
      • CANADA Marché de l'informatique omniprésente et omniprésente, par type de technologie
        • Réseaux de capteurs
        • Cloud computing
        • Intelligence artificielle
        • Internet des objets
        • Edge Computing
      • CANADA Marché de l'informatique omniprésente et omniprésente, par type d'utilisation finale
        • Résidentiel
        • Commercial
        • Établissements de santé
        • Industriel
        • Gouvernement
      • CANADA Marché de l'informatique omniprésente et de l'informatique omniprésente, par type d'appareil
        • Appareils intelligents
        • Systèmes embarqués
        • Appareils mobiles
        • Ordinateurs
        • Appareils IoT
      • Perspectives de l'Europe (en milliards de dollars, 2019-2032)
        • Marché européen de l'informatique omniprésente et de l'informatique omniprésente, par type d'application
          • Maisons intelligentes
          • Technologie portable
          • Soins de santé
          • Villes intelligentes
          • Automatisation industrielle
        • Marché européen de l'informatique omniprésente et de l'informatique omniprésente, par type de technologie
          • Réseaux de capteurs
          • Cloud computing
          • Intelligence artificielle
          • Internet des objets
          • Edge Computing
        • Marché européen de l'informatique omniprésente et de l'informatique omniprésente, par type d'utilisation finale
          • Résidentiel
          • Commercial
          • Établissements de santé
          • Industriel
          • Gouvernement
        • Marché européen de l'informatique omniprésente et de l'informatique omniprésente, par type d'appareil
          • Appareils intelligents
          • Systèmes embarqués
          • Appareils mobiles
          • Ordinateurs
          • Appareils IoT
        • Marché européen de l'informatique omniprésente et de l'informatique omniprésente, par type régional
          • Allemagne
          • Royaume-Uni
          • France
          • Russie
          • Italie
          • Espagne
          • Reste de l'Europe
        • Perspectives de l'ALLEMAGNE (en milliards de dollars, 2019-2032)
        • ALLEMAGNE Marché de l'informatique omniprésente et omniprésente, par type d'application
          • Maisons intelligentes
          • Technologie portable
          • Soins de santé
          • Villes intelligentes
          • Automatisation industrielle
        • ALLEMAGNE Marché de l'informatique omniprésente et omniprésente, par type de technologie
          • Réseaux de capteurs
          • Cloud computing
          • Intelligence artificielle
          • Internet des objets
          • Edge Computing
        • ALLEMAGNE Marché de l'informatique omniprésente et omniprésente, par type d'utilisation finale
          • Résidentiel
          • Commercial
          • Établissements de santé
          • Industriel
          • Gouvernement
        • ALLEMAGNE Marché de l'informatique omniprésente et omniprésente, par type d'appareil
          • Appareils intelligents
          • Systèmes embarqués
          • Appareils mobiles
          • Ordinateurs
          • Appareils IoT
        • Perspectives du Royaume-Uni (milliards de dollars américains, 2019-2032)
        • Marché britannique de l'informatique omniprésente et de l'informatique omniprésente, par type d'application
          • Maisons intelligentes
          • Technologie portable
          • Soins de santé
          • Villes intelligentes
          • Automatisation industrielle
        • Marché britannique de l'informatique omniprésente et de l'informatique omniprésente, par type de technologie
          • Réseaux de capteurs
          • Cloud computing
          • Intelligence artificielle
          • Internet des objets
          • Edge Computing
        • Marché britannique de l'informatique omniprésente et de l'informatique omniprésente, par type d'utilisation finale
          • Résidentiel
          • Commercial
          • Établissements de santé
          • Industriel
          • Gouvernement
        • Marché britannique de l'informatique omniprésente et de l'informatique omniprésente, par type d'appareil
          • Appareils intelligents
          • Systèmes embarqués
          • Appareils mobiles
          • Ordinateurs
          • Appareils IoT
        • Perspectives de la FRANCE (en milliards de dollars, 2019-2032)
        • FRANCE Marché de l'informatique omniprésente et de l'informatique omniprésente par type d'application
          • Maisons intelligentes
          • Technologie portable
          • Soins de santé
          • Villes intelligentes
          • Automatisation industrielle
        • FRANCE Marché de l'informatique omniprésente et omniprésente, par type de technologie
          • Réseaux de capteurs
          • Cloud computing
          • Intelligence artificielle
          • Internet des objets
          • Edge Computing
        • FRANCE Marché de l'informatique omniprésente et omniprésente, par type d'utilisation finale
          • Résidentiel
          • Commercial
          • Établissements de santé
          • Industriel
          • Gouvernement
        • FRANCE Marché de l'informatique omniprésente et omniprésente, par type d'appareil
          • Appareils intelligents
          • Systèmes embarqués
          • Appareils mobiles
          • Ordinateurs
          • Appareils IoT
        • Perspectives de la RUSSIE (en milliards de dollars, 2019-2032)
        • RUSSIE Marché de l'informatique omniprésente et omniprésente, par type d'application
          • Maisons intelligentes
          • Technologie portable
          • Soins de santé
          • Villes intelligentes
          • Automatisation industrielle
        • RUSSIE Marché de l'informatique omniprésente et omniprésente, par type de technologie
          • Réseaux de capteurs
          • Cloud computing
          • Intelligence artificielle
          • Internet des objets
          • Edge Computing
        • RUSSIE Marché de l'informatique omniprésente et de l'informatique omniprésente, par type d'utilisation finale
          • Résidentiel
          • Commercial
          • Établissements de santé
          • Industriel
          • Gouvernement
        • RUSSIE Marché de l'informatique omniprésente et omniprésente, par type d'appareil
          • Appareils intelligents
          • Systèmes embarqués
          • Appareils mobiles
          • Ordinateurs
          • Appareils IoT
        • Perspectives de l'ITALIE (en milliards de dollars, 2019-2032)
        • ITALIE Marché de l'informatique omniprésente et omniprésente, par type d'application
          • Maisons intelligentes
          • Technologie portable
          • Soins de santé
          • Villes intelligentes
          • Automatisation industrielle
        • ITALIE Marché de l'informatique omniprésente et omniprésente, par type de technologie
          • Réseaux de capteurs
          • Cloud computing
          • Intelligence artificielle
          • Internet des objets
          • Edge Computing
        • ITALIE Marché de l'informatique omniprésente et omniprésente, par type d'utilisation finale
          • Résidentiel
          • Commercial
          • Établissements de santé
          • Industriel
          • Gouvernement
        • ITALIE Marché de l'informatique omniprésente et de l'informatique omniprésente, par type d'appareil
          • Appareils intelligents
          • Systèmes embarqués
          • Appareils mobiles
          • Ordinateurs
          • Appareils IoT
        • Perspectives de l'ESPAGNE (milliards USD, 2019-2032)
        • ESPAGNE Marché de l'informatique omniprésente et omniprésente, par type d'application
          • Maisons intelligentes
          • Technologie portable
          • Soins de santé
          • Villes intelligentes
          • Automatisation industrielle
        • ESPAGNE Marché de l'informatique omniprésente et omniprésente, par type de technologie
          • Réseaux de capteurs
          • Cloud computing
          • Intelligence artificielle
          • Internet des objets
          • Edge Computing
        • ESPAGNE Marché de l'informatique omniprésente et omniprésente, par type d'utilisation finale
          • Résidentiel
          • Commercial
          • Établissements de santé
          • Industriel
          • Gouvernement
        • ESPAGNE Marché de l'informatique omniprésente et omniprésente, par type d'appareil
          • Appareils intelligents
          • Systèmes embarqués
          • Appareils mobiles
          • Ordinateurs
          • Appareils IoT
        • Perspectives RESTE DE L'EUROPE (en milliards USD, 2019-2032)
        • RESTE DE L'EUROPE Marché de l'informatique omniprésente et de l'informatique omniprésente par type d'application
          • Maisons intelligentes
          • Technologie portable
          • Soins de santé
          • Villes intelligentes
          • Automatisation industrielle
        • RESTE DE L'EUROPE Marché informatique omniprésent et omniprésentpar type de technologie
          • Réseaux de capteurs
          • Cloud computing
          • Intelligence artificielle
          • Internet des objets
          • Edge Computing
        • RESTE DE L'EUROPE Marché de l'informatique omniprésente et omniprésente, par type d'utilisation finale
          • Résidentiel
          • Commercial
          • Établissements de santé
          • Industriel
          • Gouvernement
        • RESTE DE L'EUROPE Marché de l'informatique omniprésente et omniprésente, par type d'appareil
          • Appareils intelligents
          • Systèmes embarqués
          • Appareils mobiles
          • Ordinateurs
          • Appareils IoT
        • Perspectives APAC (en milliards de dollars, 2019-2032)
          • Marché de l'informatique omniprésente et de l'informatique omniprésente en Asie-Pacifique, par type d'application
            • Maisons intelligentes
            • Technologie portable
            • Soins de santé
            • Villes intelligentes
            • Automatisation industrielle
          • Marché de l'informatique omniprésente et de l'informatique omniprésente en Asie-Pacifique, par type de technologie
            • Réseaux de capteurs
            • Cloud computing
            • Intelligence artificielle
            • Internet des objets
            • Edge Computing
          • Marché de l'informatique omniprésente et de l'informatique omniprésente en Asie-Pacifique, par type d'utilisation finale
            • Résidentiel
            • Commercial
            • Établissements de santé
            • Industriel
            • Gouvernement
          • Marché de l'informatique omniprésente et de l'informatique omniprésente en Asie-Pacifique, par type d'appareil
            • Appareils intelligents
            • Systèmes embarqués
            • Appareils mobiles
            • Ordinateurs
            • Appareils IoT
          • Marché de l'informatique omniprésente et de l'informatique omniprésente en Asie-Pacifique, par type régional
            • Chine
            • Inde
            • Japon
            • Corée du Sud
            • Malaisie
            • Thaïlande
            • Indonésie
            • Reste de l'APAC
          • Perspectives de la CHINE (milliards USD, 2019-2032)
          • CHINE Marché de l'informatique omniprésente et omniprésente, par type d'application
            • Maisons intelligentes
            • Technologie portable
            • Soins de santé
            • Villes intelligentes
            • Automatisation industrielle
          • CHINE Marché de l'informatique omniprésente et omniprésente, par type de technologie
            • Réseaux de capteurs
            • Cloud computing
            • Intelligence artificielle
            • Internet des objets
            • Edge Computing
          • CHINE Marché de l'informatique omniprésente et de l'informatique omniprésente, par type d'utilisation finale
            • Résidentiel
            • Commercial
            • Établissements de santé
            • Industriel
            • Gouvernement
          • CHINE Marché de l'informatique omniprésente et omniprésente, par type d'appareil
            • Appareils intelligents
            • Systèmes embarqués
            • Appareils mobiles
            • Ordinateurs
            • Appareils IoT
          • Perspectives de l'INDE (en milliards de dollars, 2019-2032)
          • INDE Marché de l'informatique omniprésente et omniprésente, par type d'application
            • Maisons intelligentes
            • Technologie portable
            • Soins de santé
            • Villes intelligentes
            • Automatisation industrielle
          • INDE Marché de l'informatique omniprésente et omniprésente, par type de technologie
            • Réseaux de capteurs
            • Cloud computing
            • Intelligence artificielle
            • Internet des objets
            • Edge Computing
          • INDE Marché de l'informatique omniprésente et de l'informatique omniprésente, par type d'utilisation finale
            • Résidentiel
            • Commercial
            • Établissements de santé
            • Industriel
            • Gouvernement
          • INDE Marché de l'informatique omniprésente et de l'informatique omniprésente, par type d'appareil
            • Appareils intelligents
            • Systèmes embarqués
            • Appareils mobiles
            • Ordinateurs
            • Appareils IoT
          • Perspectives du JAPON (milliards USD, 2019-2032)
          • JAPON Marché de l'informatique omniprésente et de l'informatique omniprésente par type d'application
            • Maisons intelligentes
            • Technologie portable
            • Soins de santé
            • Villes intelligentes
            • Automatisation industrielle
          • JAPON Marché de l'informatique omniprésente et omniprésente, par type de technologie
            • Réseaux de capteurs
            • Cloud computing
            • Intelligence artificielle
            • Internet des objets
            • Edge Computing
          • JAPON Marché de l'informatique omniprésente et omniprésente, par type d'utilisation finale
            • Résidentiel
            • Commercial
            • Établissements de santé
            • Industriel
            • Gouvernement
          • JAPON Marché de l'informatique omniprésente et omniprésente, par type d'appareil
            • Appareils intelligents
            • Systèmes embarqués
            • Appareils mobiles
            • Ordinateurs
            • Appareils IoT
          • Perspectives de la CORÉE DU SUD (en milliards de dollars américains, 2019-2032)
          • CORÉE DU SUD Marché de l'informatique omniprésente et omniprésente par type d'application
            • Maisons intelligentes
            • Technologie portable
            • Soins de santé
            • Villes intelligentes
            • Automatisation industrielle
          • CORÉE DU SUD Marché de l'informatique omniprésente et omniprésente, par type de technologie
            • Réseaux de capteurs
            • Cloud computing
            • Intelligence artificielle
            • Internet des objets
            • Edge Computing
          • CORÉE DU SUD Marché de l'informatique omniprésente et omniprésente, par type d'utilisation finale
            • Résidentiel
            • Commercial
            • Établissements de santé
            • Industriel
            • Gouvernement
          • CORÉE DU SUD Marché de l'informatique omniprésente et de l'informatique omniprésente, par type d'appareil
            • Appareils intelligents
            • Systèmes embarqués
            • Appareils mobiles
            • Ordinateurs
            • Appareils IoT
          • Perspectives de la MALAISIE (en milliards de dollars américains, 2019-2032)
          • MALAISIE Marché de l'informatique omniprésente et de l'informatique omniprésente par type d'application
            • Maisons intelligentes
            • Technologie portable
            • Soins de santé
            • Villes intelligentes
            • Automatisation industrielle
          • MALAISIE Marché de l'informatique omniprésente et omniprésente, par type de technologie
            • Réseaux de capteurs
            • Cloud computing
            • Intelligence artificielle
            • Internet des objets
            • Edge Computing
          • MALAISIE Marché de l'informatique omniprésente et omniprésente, par type d'utilisation finale
            • Résidentiel
            • Commercial
            • Établissements de santé
            • Industriel
            • Gouvernement
          • MALAISIE Marché de l'informatique omniprésente et omniprésente, par type d'appareil
            • Appareils intelligents
            • Systèmes embarqués
            • Appareils mobiles
            • Ordinateurs
            • Appareils IoT
          • Perspectives de la THAÏLANDE (en milliards de dollars américains, 2019-2032)
          • THAÏLANDE Marché de l'informatique omniprésente et de l'informatique omniprésente par type d'application
            • Maisons intelligentes
            • Technologie portable
            • Soins de santé
            • Villes intelligentes
            • Automatisation industrielle
          • THAÏLANDE Marché de l'informatique omniprésente et de l'informatique omniprésente par type de technologie
            • Réseaux de capteurs
            • Cloud computing
            • Intelligence artificielle
            • Internet des objets
            • Edge Computing
          • THAÏLANDE Marché de l'informatique omniprésente et de l'informatique omniprésente, par type d'utilisation finale
            • Résidentiel
            • Commercial
            • Établissements de santé
            • Industriel
            • Gouvernement
          • THAÏLANDE Marché de l'informatique omniprésente et omniprésente, par type d'appareil
            • Appareils intelligents
            • Systèmes embarqués
            • Appareils mobiles
            • Ordinateurs
            • Appareils IoT
          • Perspectives de l'INDONÉSIE (en milliards de dollars américains, 2019-2032)
          • INDONÉSIE Marché de l'informatique omniprésente et de l'informatique omniprésente par type d'application
            • Maisons intelligentes
            • Technologie portable
            • Soins de santé
            • Villes intelligentes
            • Automatisation industrielle
          • INDONÉSIE Marché de l'informatique omniprésente et omniprésente, par type de technologie
            • Réseaux de capteurs
            • Cloud computing
            • Intelligence artificielle
            • Internet des objets
            • Edge Computing
          • INDONÉSIE Marché de l'informatique omniprésente et omniprésente, par type d'utilisation finale
            • Résidentiel
            • Commercial
            • Établissements de santé
            • Industriel
            • Gouvernement
          • INDONÉSIE Marché de l'informatique omniprésente et omniprésente, par type d'appareil
            • Appareils intelligents
            • Systèmes embarqués
            • Appareils mobiles
            • Ordinateurs
            • Appareils IoT
          • Perspectives du reste de l'APAC (en milliards de dollars, 2019-2032)
          • RESTE DE L'APAC Marché de l'informatique omniprésente et de l'informatique omniprésente par type d'application
            • Maisons intelligentes
            • Technologie portable
            • Soins de santé
            • Villes intelligentes
            • Automatisation industrielle
          • RESTE DE L'APAC Marché de l'informatique omniprésente et de l'informatique omniprésente par type de technologie
            • Réseaux de capteurs
            • Cloud computing
            • Intelligence artificielle
            • Internet des objets
            • Edge Computing
          • RESTE DE LA APAC Marché de l'informatique omniprésente et de l'informatique omniprésente, par type d'utilisation finale
            • Résidentiel
            • Commercial
            • Établissements de santé
            • Industriel
            • Gouvernement
          • RESTE DE L'APAC Marché de l'informatique omniprésente et de l'informatique omniprésente par type d'appareil
            • Appareils intelligents
            • Systèmes embarqués
            • Appareils mobiles
            • Ordinateurs
            • Appareils IoT
          • Perspectives de l'Amérique du Sud (en milliards de dollars, 2019-2032)
            • Marché de l'informatique omniprésente et de l'informatique omniprésente en Amérique du Sud, par type d'application
              • Maisons intelligentes
              • Technologie portable
              • Soins de santé
              • Villes intelligentes
              • Automatisation industrielle
            • Marché de l'informatique omniprésente et de l'informatique omniprésente en Amérique du Sud, par type de technologie
              • Réseaux de capteurs
              • Cloud computing
              • Intelligence artificielle
              • Internet des objets
              • Edge Computing
            • Marché de l'informatique omniprésente et de l'informatique omniprésente en Amérique du Sud, par type d'utilisation finale
              • Résidentiel
              • Commercial
              • Établissements de santé
              • Industriel
              • Gouvernement
            • Marché de l'informatique omniprésente et omniprésente en Amérique du Sud, par type d'appareil
              • Appareils intelligents
              • Systèmes embarqués
              • Appareils mobiles
              • Ordinateurs
              • Appareils IoT
            • Marché de l'informatique omniprésente et de l'informatique omniprésente en Amérique du Sud, par type régional
              • Brésil
              • Mexique
              • Argentine
              • Reste de l'Amérique du Sud
            • Perspectives du BRÉSIL (milliards USD, 2019-2032)
            • BRÉSIL Marché de l'informatique omniprésente et omniprésente, par type d'application
              • Maisons intelligentes
              • Technologie portable
              • Soins de santé
              • Villes intelligentes
              • Automatisation industrielle
            • BRÉSIL Marché de l'informatique omniprésente et de l'informatique omniprésente, par type de technologie
              • Réseaux de capteurs
              • Cloud computing
              • Intelligence artificielle
              • Internet des objets
              • Edge Computing
            • BRÉSIL Marché de l'informatique omniprésente et omniprésente, par type d'utilisation finale
              • Résidentiel
              • Commercial
              • Établissements de santé
              • Industriel
              • Gouvernement
            • BRÉSIL Marché de l'informatique omniprésente et de l'informatique omniprésente, par type d'appareil
              • Appareils intelligents
              • Systèmes embarqués
              • Appareils mobiles
              • Ordinateurs
              • Appareils IoT
            • Perspectives du MEXIQUE (en milliards de dollars, 2019-2032)
            • MEXIQUE Marché de l'informatique omniprésente et de l'informatique omniprésente par type d'application
              • Maisons intelligentes
              • Technologie portable
              • Soins de santé
              • Villes intelligentes
              • IndustrielAutomatisation
            • MEXIQUE Marché de l'informatique omniprésente et omniprésente, par type de technologie
              • Réseaux de capteurs
              • Cloud computing
              • Intelligence artificielle
              • Internet des objets
              • Edge Computing
            • MEXIQUE Marché de l'informatique omniprésente et omniprésente, par type d'utilisation finale
              • Résidentiel
              • Commercial
              • Établissements de santé
              • Industriel
              • Gouvernement
            • MEXIQUE Marché de l'informatique omniprésente et omniprésente, par type d'appareil
              • Appareils intelligents
              • Systèmes embarqués
              • Appareils mobiles
              • Ordinateurs
              • Appareils IoT
            • Perspectives de l'ARGENTINE (milliards USD, 2019-2032)
            • ARGENTINE Marché de l'informatique omniprésente et de l'informatique omniprésente par type d'application
              • Maisons intelligentes
              • Technologie portable
              • Soins de santé
              • Villes intelligentes
              • Automatisation industrielle
            • ARGENTINE Marché de l'informatique omniprésente et omniprésente, par type de technologie
              • Réseaux de capteurs
              • Cloud computing
              • Intelligence artificielle
              • Internet des objets
              • Edge Computing
            • ARGENTINE Marché de l'informatique omniprésente et omniprésente, par type d'utilisation finale
              • Résidentiel
              • Commercial
              • Établissements de santé
              • Industriel
              • Gouvernement
            • ARGENTINE Marché de l'informatique omniprésente et omniprésente, par type d'appareil
              • Appareils intelligents
              • Systèmes embarqués
              • Appareils mobiles
              • Ordinateurs
              • Appareils IoT
            • Perspectives du reste de l'Amérique du Sud (en milliards de dollars américains, 2019-2032)
            • RESTE DE L'AMÉRIQUE DU SUD Marché de l'informatique omniprésente et omniprésente, par type d'application
              • Maisons intelligentes
              • Technologie portable
              • Soins de santé
              • Villes intelligentes
              • Automatisation industrielle
            • RESTE DE L'AMÉRIQUE DU SUD Marché de l'informatique omniprésente et omniprésente, par type de technologie
              • Réseaux de capteurs
              • Cloud computing
              • Intelligence artificielle
              • Internet des objets
              • Edge Computing
            • RESTE DE L'AMÉRIQUE DU SUD Marché de l'informatique omniprésente et omniprésente, par type d'utilisation finale
              • Résidentiel
              • Commercial
              • Établissements de santé
              • Industriel
              • Gouvernement
            • RESTE DE L'AMÉRIQUE DU SUD Marché de l'informatique omniprésente et omniprésente, par type d'appareil
              • Appareils intelligents
              • Systèmes embarqués
              • Appareils mobiles
              • Ordinateurs
              • Appareils IoT
            • Perspectives MEA (milliards USD, 2019-2032)
              • MEA Marché de l'informatique omniprésente et de l'informatique omniprésente par type d'application
                • Maisons intelligentes
                • Technologie portable
                • Soins de santé
                • Villes intelligentes
                • Automatisation industrielle
              • MEA Marché de l'informatique omniprésente et de l'informatique omniprésente par type de technologie
                • Réseaux de capteurs
                • Cloud computing
                • Intelligence artificielle
                • Internet des objets
                • Edge Computing
              • MEA Marché de l'informatique omniprésente et de l'informatique omniprésente par type d'utilisation finale
                • Résidentiel
                • Commercial
                • Établissements de santé
                • Industriel
                • Gouvernement
              • Marché MEA de l'informatique omniprésente et de l'informatique omniprésente par type d'appareil
                • Appareils intelligents
                • Systèmes embarqués
                • Appareils mobiles
                • Ordinateurs
                • Appareils IoT
              • MEA Marché de l'informatique omniprésente et de l'informatique omniprésente par type régional
                • Pays du CCG
                • Afrique du Sud
                • Reste de la MEA
              • Perspectives des pays du CCG (en milliards de dollars, 2019-2032)
              • PAYS du CCG Marché de l'informatique omniprésente et de l'informatique omniprésente par type d'application
                • Maisons intelligentes
                • Technologie portable
                • Soins de santé
                • Villes intelligentes
                • Automatisation industrielle
              • PAYS du CCG Marché de l'informatique omniprésente et de l'informatique omniprésente par type de technologie
                • Réseaux de capteurs
                • Cloud computing
                • Intelligence artificielle
                • Internet des objets
                • Edge Computing
              • PAYS du CCG Marché de l'informatique omniprésente et omniprésente, par type d'utilisation finale
                • Résidentiel
                • Commercial
                • Établissements de santé
                • Industriel
                • Gouvernement
              • PAYS du CCG Marché de l'informatique omniprésente et omniprésente, par type d'appareil
                • Appareils intelligents
                • Systèmes embarqués
                • Appareils mobiles
                • Ordinateurs
                • Appareils IoT
              • Perspectives de l'AFRIQUE DU SUD (en milliards de dollars, 2019-2032)
              • AFRIQUE DU SUD Marché de l'informatique omniprésente et omniprésente, par type d'application
                • Maisons intelligentes
                • Technologie portable
                • Soins de santé
                • Villes intelligentes
                • Automatisation industrielle
              • AFRIQUE DU SUD Marché de l'informatique omniprésente et omniprésente, par type de technologie
                • Réseaux de capteurs
                • Cloud computing
                • Intelligence artificielle
                • Internet des objets
                • Edge Computing
              • AFRIQUE DU SUD Marché de l'informatique omniprésente et omniprésente, par type d'utilisation finale
                • Résidentiel
                • Commercial
                • Établissements de santé
                • Industriel
                • Gouvernement
              • AFRIQUE DU SUD Marché de l'informatique omniprésente et omniprésente, par type d'appareil
                • Appareils intelligents
                • Systèmes embarqués
                • Appareils mobiles
                • Ordinateurs
                • Appareils IoT
              • Perspectives RESTE DES MEA (milliards USD, 2019-2032)
              • RESTE DU MEA Marché de l'informatique omniprésente et de l'informatique omniprésente par type d'application
                • Maisons intelligentes
                • Technologie portable
                • Soins de santé
                • Villes intelligentes
                • Automatisation industrielle
              • RESTE DU MEA Marché de l'informatique omniprésente et de l'informatique omniprésente par type de technologie
                • Réseaux de capteurs
                • Cloud computing
                • Intelligence artificielle
                • Internet des objets
                • Edge Computing
              • RESTE DU MEA Marché de l'informatique omniprésente et de l'informatique omniprésente par type d'utilisation finale
                • Résidentiel
                • Commercial
                • Établissements de santé
                • Industriel
                • Gouvernement
              • RESTE DE MEA Marché de l'informatique omniprésente et de l'informatique omniprésente par type d'appareil
                • Appareils intelligents
                • Systèmes embarqués
                • Appareils mobiles
                • Ordinateurs
                • Appareils IoT
    Report Infographic
    Free Sample Request

    Kindly complete the form below to receive a free sample of this Report

    Customer Strories

    “I am very pleased with how market segments have been defined in a relevant way for my purposes (such as "Portable Freezers & refrigerators" and "last-mile"). In general the report is well structured. Thanks very much for your efforts.”

    Victoria Milne Founder
    Case Study

    Chemicals and Materials