• Cat-intel
  • MedIntelliX
  • Resources
  • About Us
  • Request Free Sample ×

    Kindly complete the form below to receive a free sample of this Report

    Leading companies partner with us for data-driven Insights

    clients tt-cursor

    Variable Refrigerant Flow System Market

    ID: MRFR/CnM/28572-HCR
    100 Pages
    Priya Nagrale
    September 2025

    Informe de investigación de mercado de sistemas de flujo de refrigerante variable: por capacidad (menos de 18 000 BTU/h, 18 000 - 24 000 BTU/h, más de 24 000 BTU/h), por aplicación (residencial, comercial, industrial), por configuración (zona única, zona múltiple) , Por tecnología (bomba de calor, solo refrigeración) y por región (América del Norte, Europa, América del Sur, Asia Pacífico, Medio Oriente y África): pronóstico para 2032

    Share:
    Download PDF ×

    We do not share your information with anyone. However, we may send you emails based on your report interest from time to time. You may contact us at any time to opt-out.

    Variable Refrigerant Flow System Market Research Report — Global Forecast till 2034 Infographic
    Purchase Options
    $ 4.950,0
    $ 5.950,0
    $ 7.250,0
    Table of Contents

    Descripción general del mercado global de sistemas de flujo de refrigerante variable

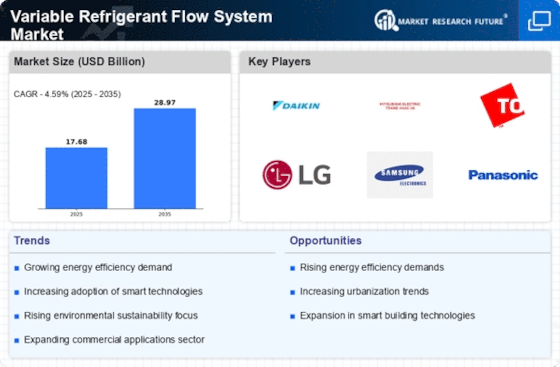
    El tamaño del mercado de sistemas de flujo de refrigerante variable se estimó en 15,45 (miles de millones de USD) en 2022. Se espera que la industria de sistemas de flujo de refrigerante variable crezca de 16,15 (miles de millones de USD) en 2023 a 24,2 (miles de millones de USD) para 2032. Se espera que la CAGR (tasa de crecimiento) del mercado de sistemas de flujo de refrigerante sea de alrededor del 4,59% durante el período previsto (2024 - 2032).

    Se destacan las tendencias clave del mercado de sistemas de flujo de refrigerante variable

    El mercado mundial de sistemas de flujo de refrigerante variable (VRF) está experimentando un crecimiento significativo, impulsado por la creciente demanda de sistemas de control climático personalizables y energéticamente eficientes. Los gobiernos de todo el mundo están implementando estrictas regulaciones energéticas, fomentando la adopción de sistemas VRF que ofrecen un consumo de energía y emisiones de carbono reducidos. Además, la creciente popularidad de los edificios multifamiliares y de uso mixto está impulsando la demanda de sistemas VRF que puedan gestionar eficazmente los requisitos de refrigeración y calefacción en diferentes zonas. Los avances tecnológicos, como la integración de IoT y controles inteligentes, están mejorando aún más la funcionalidad y eficiencia de los sistemas VRF. La proliferación de edificios ecológicos, junto con la creciente conciencia sobre la sostenibilidad ambiental, está creando amplias oportunidades para que los actores de la industria aprovechen la creciente demanda de soluciones HVAC respetuosas con el medio ambiente.

    Descripción general del mercado de sistemas de flujo de refrigerante variable

    Fuente: investigación primaria, investigación secundaria, base de datos MRFR y revisión de analistas

    Impulsores del mercado de sistemas de flujo de refrigerante variable

    Creciente demanda de sistemas HVAC energéticamente eficientes

    Se prevé que el mercado mundial de sistemas de flujo de refrigerante variable (VRF) experimente un crecimiento sustancial en los próximos años, impulsado por la creciente demanda de sistemas HVAC energéticamente eficientes y respetuosos con el medio ambiente. Los sistemas VRF ofrecen varias ventajas sobre los sistemas HVAC tradicionales, incluido un menor consumo de energía, una mejor calidad del aire interior y mayores niveles de comodidad. Como resultado, los sistemas VRF se están volviendo cada vez más populares en edificios comerciales y residenciales de todo el mundo. Se espera que la creciente adopción de sistemas VRF impulse el crecimiento de la industria del mercado de sistemas de flujo de refrigerante variable durante el período de pronóstico.

    Regulaciones e incentivos gubernamentales

    Las regulaciones e incentivos gubernamentales también están desempeñando un papel importante en impulsar el crecimiento de la industria del mercado de sistemas de flujo de refrigerante variable. Los gobiernos de todo el mundo están implementando estándares de eficiencia energética más estrictos para los edificios, lo que está generando una mayor demanda de sistemas VRF. Además, muchos gobiernos están ofreciendo incentivos, como exenciones y devoluciones de impuestos, para fomentar la adopción de sistemas VRF. Se espera que estas iniciativas gubernamentales impulsen aún más el crecimiento del mercado en los próximos años.

    Avances tecnológicos

    Los avances tecnológicos también están contribuyendo al crecimiento de la industria del mercado Sistema de flujo de refrigerante variable. Los sistemas VRF son cada vez más sofisticados y eficientes, y constantemente se agregan nuevas características y capacidades. Por ejemplo, algunos sistemas VRF ahora ofrecen sistemas integrados de purificación de aire, que pueden ayudar a mejorar la calidad del aire interior. Además, los sistemas VRF son cada vez más asequibles, lo que los hace más accesibles a una gama más amplia de clientes.

    Información sobre el segmento de mercado del sistema de flujo de refrigerante variable:

    Perspectivas sobre la capacidad del mercado de sistemas de flujo de refrigerante variable

    El segmento de capacidad desempeña un papel crucial en la configuración de la dinámica del mercado de sistemas de flujo de refrigerante variable. Clasifica los sistemas VRV/VRF según sus capacidades de refrigeración y calefacción, que varían según las diferentes aplicaciones. Por debajo de 18.000 BTU/h: este segmento atiende a espacios pequeños como apartamentos residenciales, habitaciones de hotel y oficinas pequeñas. Ofrece soluciones compactas y energéticamente eficientes para áreas que requieren hasta 18.000 unidades térmicas británicas por hora (BTU/h) de capacidad de refrigeración o calefacción. 18.000 - 24.000 BTU/h: este segmento se dirige a espacios de tamaño mediano, como apartamentos más grandes, pequeños edificios comerciales y tiendas minoristas. Los sistemas VRV/VRF de esta gama proporcionan capacidades mejoradas de refrigeración y calefacción, que van desde 18.000 a 24.000 BTU/h, catering al aumento de cargas térmicas en estos espacios. Más de 24.000 BTU/h: el segmento de alta capacidad aborda las necesidades de grandes edificios comerciales e industriales, centros de datos e instalaciones sanitarias. Estos sistemas ofrecen potentes capacidades de refrigeración y calefacción que superan los 24 000 BTU/h, lo que garantiza una gestión eficiente de la temperatura en entornos amplios y exigentes. El crecimiento del mercado para cada segmento de capacidad está influenciado por factores como las tendencias de construcción, la urbanización, las regulaciones de eficiencia energética y los avances tecnológicos. Se espera que la creciente adopción de sistemas VRV/VRF en edificios residenciales y comerciales impulse los ingresos generales del mercado en los próximos años. años. Además, las iniciativas gubernamentales que promueven la eficiencia energética y las prácticas de construcción sostenible contribuyen aún más al crecimiento de este segmento.

    Perspectivas sobre la capacidad del mercado de sistemas de flujo de refrigerante variable

    Fuente: investigación primaria, investigación secundaria, base de datos MRFR y revisión de analistas

    Información sobre aplicaciones de mercado de sistemas de flujo de refrigerante variable

    El mercado de sistemas de flujo de refrigerante variable está segmentado por aplicación en residencial, comercial e industrial. Se espera que el segmento residencial posea la mayor participación del mercado en 2023, representando más del 45% de los ingresos globales. Esto se debe a la creciente demanda de soluciones de refrigeración y calefacción confortables y energéticamente eficientes en edificios residenciales. Se espera que el segmento comercial crezca a una tasa compuesta anual más rápida durante el período de pronóstico, debido a la creciente adopción de sistemas VRF en edificios comerciales como oficinas, hoteles y hospitales. Se espera que el segmento industrial represente una participación menor del mercado. , pero se espera que crezca de manera constante durante el período de pronóstico debido a la creciente demanda de sistemas VRF en aplicaciones industriales como plantas de fabricación y almacenes.

    Información sobre la configuración del mercado del sistema de flujo de refrigerante variable

    El mercado de sistemas de flujo de refrigerante variable está segmentado por configuración en zona única y zona múltiple. Se espera que el segmento de Zona Única represente una mayor participación del mercado en 2023, debido a su menor costo y su proceso de instalación más sencillo. Sin embargo, se espera que el segmento multizona crezca a una CAGR más rápida durante el período de pronóstico, debido a su capacidad para proporcionar más flexibilidad y control sobre la temperatura en diferentes zonas. En 2023, se estima que el segmento de Zona Única estará valorado en 10,5 mil millones de dólares, mientras que el segmento Multizona estará valorado en 5,65 mil millones de dólares. Para 2032, se proyecta que el segmento de Zona Única crecerá a 15,7 mil millones de dólares, mientras que el Se prevé que el segmento multizona crezca hasta los 8.500 millones de dólares. Los factores clave que impulsan el crecimiento del segmento de Zona Única incluyen su bajo costo y su sencillo proceso de instalación. Los sistemas de zona única son ideales para espacios pequeños, como habitaciones individuales o apartamentos, ya que son menos costosos y más fáciles de instalar que los sistemas multizona. Por otro lado, los sistemas Multi Zona ofrecen más flexibilidad y control sobre la temperatura en diferentes zonas. Los sistemas multizona son ideales para espacios más grandes, como oficinas o edificios comerciales, ya que permiten configurar diferentes temperaturas en diferentes habitaciones o zonas.

    Perspectivas tecnológicas del mercado de sistemas de flujo de refrigerante variable

    El mercado de sistemas de flujo de refrigerante variable está segmentado por tecnología en bombas de calor y refrigeración únicamente. El segmento de bombas de calor tuvo la mayor cuota de mercado en 2023, representando más del 60% de los ingresos del mercado global. Se espera que el segmento Solo refrigeración crezca a una tasa compuesta anual más rápida durante el período previsto, debido a la creciente demanda de soluciones de refrigeración energéticamente eficientes en edificios comerciales y residenciales. El segmento de bombas de calor está impulsado por la creciente popularidad de las bombas de calor como una alternativa energéticamente eficiente a los sistemas tradicionales de calefacción y refrigeración. Las bombas de calor pueden proporcionar tanto calefacción como refrigeración, lo que las convierte en una opción versátil para edificios en todos los climas. El crecimiento del mercado se atribuye a la creciente demanda de soluciones HVAC energéticamente eficientes, la creciente industria de la construcción y el aumento de los ingresos disponibles de los consumidores.

    Perspectivas regionales del mercado de sistemas de flujo de refrigerante variable

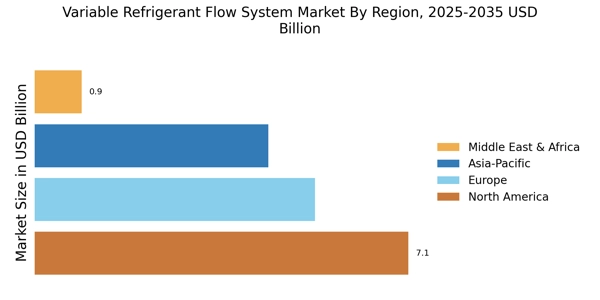
    El panorama regional del mercado de sistemas de flujo de refrigerante variable presenta una dinámica de crecimiento distinta en regiones geográficas clave. América del Norte tiene una participación de mercado significativa, impulsada por la creciente adopción de sistemas HVAC energéticamente eficientes en edificios comerciales y residenciales. Se prevé que la región mantenga su dominio durante todo el período previsto. Europa le sigue de cerca, con una demanda creciente de sistemas VRF tanto en proyectos de nueva construcción como de renovación. La región de Asia y el Pacífico emerge como un mercado de rápido crecimiento, liderado por China e India, donde la urbanización y el aumento de los ingresos disponibles alimentan la demanda de espacios habitables modernos y confortables. América del Sur y las regiones de Medio Oriente y África (MEA) también ofrecen un crecimiento prometedor. oportunidades, a medida que los gobiernos y las empresas priorizan la eficiencia energética y el desarrollo sostenible. Con sus diversos mercados regionales, el Mercado de Sistemas de Flujo de Refrigerante Variable presenta amplias oportunidades para que los participantes de la industria atiendan las necesidades y preferencias específicas de cada región.

    Perspectivas regionales del mercado de sistemas de flujo de refrigerante variable

    Fuente: investigación primaria, investigación secundaria, base de datos MRFR y revisión de analistas

    Sistema de flujo de refrigerante variable Jugadores clave del mercado e información competitiva:

    Los principales actores de la industria del mercado de sistemas de flujo de refrigerante variable se están centrando en el desarrollo de productos innovadores para satisfacer la creciente demanda de soluciones energéticamente eficientes y respetuosas con el medio ambiente. Los principales actores del mercado Sistema de flujo de refrigerante variable están invirtiendo en actividades de investigación y desarrollo para mejorar el rendimiento y la eficiencia de sus productos. El desarrollo del mercado de sistemas de flujo de refrigerante variable también está siendo impulsado por la creciente adopción de tecnologías domésticas inteligentes, que permiten a los usuarios controlar de forma remota sus sistemas HVAC. El panorama competitivo del mercado de sistemas de flujo de refrigerante variable se caracteriza por la presencia de actores tanto globales como regionales. Daikin Industries, un actor líder en el mercado de sistemas de flujo de refrigerante variable, ofrece una amplia gama de sistemas VRF diseñados para diversas aplicaciones. Los sistemas VRF de la empresa son conocidos por su eficiencia energética, confiabilidad y facilidad de instalación. Daikin Industries tiene una fuerte presencia global y está ampliando su alcance en el mercado a través de asociaciones y adquisiciones estratégicas. La empresa se compromete a proporcionar soluciones HVAC innovadoras y sostenibles a sus clientes. Mitsubishi Electric, un competidor clave en el mercado de sistemas de flujo de refrigerante variable, es otro actor importante que ofrece una amplia gama de sistemas VRF. Los sistemas VRF de la empresa están diseñados para proporcionar un confort y una eficiencia energética óptimos. Mitsubishi Electric esconocido por su avanzada tecnología y compromiso con la satisfacción del cliente. La empresa tiene presencia global y está enfocada en expandir su participación de mercado a través del desarrollo de nuevos productos y alianzas estratégicas. Mitsubishi Electric es un proveedor líder de soluciones HVAC innovadoras y confiables para aplicaciones residenciales, comerciales e industriales.

    Las empresas clave en el mercado de sistemas de flujo de refrigerante variable incluyen:

    • Gree Electric Appliances, Inc. de Zhuhai
    • LG Electronics Inc.
    • Corporación Eléctrica Mitsubishi
    • Corporación Panasonic
    • Corporación del Grupo Haier
    • Lennox Internacional, Inc.
    • Fujitsu General Limited
    • Samsung Electronics Co., Ltd.
    • Grupo Hisense
    • Toshiba Carrier Corporation
    • Corporación Transportista
    • Grupo Midea Co., Ltd.
    • Industrias Daikin, Ltd.
    • Hitachi Ltd.
    • Aux Group Co., Ltd.

    Desarrollos de la industria del mercado de sistemas de flujo de refrigerante variable

    Se proyecta que el mercado de sistemas de flujo de refrigerante variable crecerá de 16,15 mil millones de dólares en 2023 a 24,2 mil millones de dólares en 2032, a una tasa compuesta anual del 4,59%. La creciente demanda de sistemas de calefacción y refrigeración energéticamente eficientes, el aumento de las actividades de construcción y la creciente adopción de tecnologías domésticas inteligentes están impulsando el crecimiento del mercado. Además, las regulaciones gubernamentales que promueven la eficiencia energética y la sostenibilidad ambiental están impulsando aún más la expansión del mercado. Los desarrollos clave de la industria incluyen el lanzamiento de nuevos productos con características avanzadas, asociaciones estratégicas y adquisiciones para ampliar el alcance del mercado. Los actores clave en el mercado incluyen Daikin Industries, Mitsubishi Electric y Gree Electric Appliances.

    Perspectivas de segmentación del mercado de sistemas de flujo de refrigerante variable

    • Perspectiva de capacidad del mercado del sistema de flujo de refrigerante variable
      • Por debajo de 18.000 BTU/h
      • 18 000 - 24 000 BTU/h
      • Más de 24.000 BTU/h

    • Perspectiva de la aplicación del mercado del sistema de flujo de refrigerante variable
      • Residencial
      • Comercial
      • Industrial

    • Perspectivas de configuración del mercado del sistema de flujo de refrigerante variable
      • Zona única
      • Multizona

    • Perspectiva tecnológica del mercado del sistema de flujo de refrigerante variable
      • Bomba de calor
      • Solo refrigeración

    • Perspectiva regional del mercado del sistema de flujo de refrigerante variable
      • América del Norte
      • Europa
      • América del Sur
      • Asia Pacífico
      • Medio Oriente y África
    ÍNDICE


    1. RESUMEN EJECUTIVO
    1.1. Descripción general del mercado
    1.2. Hallazgos clave
    1.3. Segmentación del mercado
    1.4. Panorama Competitivo
    1.5. Retos y Oportunidades
    1.6. Perspectivas futuras


    2. INTRODUCCIÓN AL MERCADO
    2.1. Definición
    2.2. Alcance del estudio
    2.2.1. Objetivo de la investigación
    2.2.2. Supuesto
    2.2.3. Limitaciones
    3. METODOLOGÍA DE LA INVESTIGACIÓN
    3.1. Descripción general
    3.2. Minería de datos
    3.3. Investigación Secundaria
    3.4. Investigación Primaria
    3.4.1. Entrevistas primarias y proceso de recopilación de información
    3.4.2. Desglose de los encuestados principales
    3.5. Modelo de previsión
    3.6. Estimación del tamaño del mercado
    3.6.1. Enfoque ascendente
    3.6.2. Enfoque de arriba hacia abajo
    3.7. Triangulación de datos
    3.8. Validación


    4. DINÁMICA DEL MERCADO
    4.1. Descripción general
    4.2. Conductores
    4.3. Restricciones
    4.4. Oportunidades
    5. ANÁLISIS DE FACTORES DE MERCADO
    5.1. Análisis de la cadena de valor
    5.2. Análisis de las cinco fuerzas de Porter
    5.2.1. Poder de negociación de los proveedores
    5.2.2. Poder de negociación de los compradores
    5.2.3. Amenaza de nuevos participantes
    5.2.4. Amenaza de sustitutos
    5.2.5. Intensidad de la rivalidad
    5.3. Análisis de impacto de COVID-19
    5.3.1. Análisis de Impacto en el Mercado
    5.3.2. Impacto Regional
    5.3.3. Análisis de oportunidades y amenazas


    6. MERCADO DE SISTEMA DE FLUJO DE REFRIGERANTE VARIABLE, POR CAPACIDAD (MILLONES DE USD)
    6.1. Por debajo de 18.000 BTU/h
    6.2. 18.000 - 24.000 BTU/h
    6.3. Más de 24.000 BTU/h
    7. MERCADO DE SISTEMA DE FLUJO DE REFRIGERANTE VARIABLE, POR APLICACIÓN (MILLONES DE USD)
    7.1. Residencial
    7.2. Comercial
    7.3. Industria
    8. MERCADO DE SISTEMA DE FLUJO DE REFRIGERANTE VARIABLE, POR CONFIGURACIÓN (MILLONES DE USD)
    8.1. Zona Única
    8.2. Multizona
    9. MERCADO DE SISTEMA DE FLUJO DE REFRIGERANTE VARIABLE, POR TECNOLOGÍA (MILLONES DE USD)
    9.1. Bomba de Calor
    9.2. Sólo refrigeración
    10. MERCADO DE SISTEMA DE FLUJO DE REFRIGERANTE VARIABLE, POR REGIONAL (MILLONES DE USD)
    10.1. América del Norte
    10.1.1. Estados Unidos
    10.1.2. Canadá
    10.2. Europa
    10.2.1. Alemania
    10.2.2. Reino Unido
    10.2.3. Francia
    10.2.4. Rusia
    10.2.5. Italia
    10.2.6. España
    10.2.7. Resto de Europa
    10.3. Asia Pacífico
    10.3.1. China
    10.3.2. India
    10.3.3. Japón
    10.3.4. Corea del Sur
    10.3.5. Malasia
    10.3.6. Tailandia
    10.3.7. Indonesia
    10.3.8. Resto de APAC
    10.4. América del Sur
    10.4.1. Brasil
    10.4.2. México
    10.4.3. Argentina
    10.4.4. Resto de Sudamérica
    10.5. AMUMA
    10.5.1. Países del CCG
    10.5.2. Sudáfrica
    10.5.3. Resto de MEA


    11. PANORAMA COMPETITIVO
    11.1. Descripción general
    11.2. Análisis Competitivo
    11.3. Análisis de cuota de mercado
    11.4. Importante estrategia de crecimiento en el mercado de sistemas de flujo de refrigerante variable
    11.5. Benchmarking competitivo
    11.6. Actores líderes en términos de número de desarrollos en el mercado de sistemas de flujo de refrigerante variable
    11.7. Desarrollos clave y estrategias de crecimiento
    11.7.1. Lanzamiento de nuevos productos/implementación de servicios
    11.7.2. Fusión y Adquisiciones
    11.7.3. Empresas conjuntas
    11.8. Matriz financiera de los principales actores
    11.8.1. Ventas e ingresos operativos
    11.8.2. Gasto en I+D de los principales actores. 2023
    12. PERFILES DE LA EMPRESA
    12.1. Gree Electric Appliances, Inc. de Zhuhai
    12.1.1. Panorama financiero
    12.1.2. Productos Ofrecidos
    12.1.3. Desarrollos clave
    12.1.4. Análisis FODA
    12.1.5. Estrategias clave
    12.2. LG Electronics Inc.
    12.2.1. Panorama financiero
    12.2.2. Productos Ofrecidos
    12.2.3. Desarrollos clave
    12.2.4. Análisis FODA
    12.2.5. Estrategias clave
    12.3. Corporación Mitsubishi Electric
    12.3.1. Panorama financiero
    12.3.2. Productos Ofrecidos
    12.3.3. Desarrollos clave
    12.3.4. Análisis FODA
    12.3.5. Estrategias clave
    12.4. Corporación Panasonic
    12.4.1. Panorama financiero
    12.4.2. Productos Ofrecidos
    12.4.3. Desarrollos clave
    12.4.4. Análisis FODA
    12.4.5. Estrategias clave
    12.5. Corporación del Grupo Haier
    12.5.1. Panorama financiero
    12.5.2. Productos ofrecidos
    12.5.3. Desarrollos clave
    12.5.4. Análisis FODA
    12.5.5. Estrategias clave
    12.6. Lennox Internacional, Inc.
    12.6.1. Panorama financiero
    12.6.2. Productos ofrecidos
    12.6.3. Desarrollos clave
    12.6.4. Análisis FODA
    12.6.5. Estrategias clave
    12.7. Fujitsu General Limited
    12.7.1. Panorama financiero
    12.7.2. Productos ofrecidos
    12.7.3. Desarrollos clave
    12.7.4. Análisis FODA
    12.7.5. Estrategias clave
    12.8. Samsung Electronics Co., Ltd.
    12.8.1. Panorama financiero
    12.8.2. Productos ofrecidos
    12.8.3. Desarrollos clave
    12.8.4. Análisis FODA
    12.8.5. Estrategias clave
    12.9. Grupo Hisense
    12.9.1. Panorama financiero
    12.9.2. Productos ofrecidos
    12.9.3. Desarrollos clave
    12.9.4. Análisis FODA
    12.9.5. Estrategias clave
    12.10. Toshiba Carrier Corporation
    12.10.1. Panorama financiero
    12.10.2. Productos Ofrecidos
    12.10.3. Desarrollos clave
    12.10.4. Análisis FODA
    12.10.5. Estrategias clave
    12.11. Corporación Transportista
    12.11.1. Panorama financiero
    12.11.2. Productos Ofrecidos
    12.11.3. Desarrollos clave
    12.11.4. Análisis FODA
    12.11.5. Estrategias clave
    12.12. Midea Group Co., Ltd.
    12.12.1. Panorama financiero
    12.12.2. Productos Ofrecidos
    12.12.3. Desarrollos clave
    12.12.4. Análisis FODA
    12.12.5. Estrategias clave
    12.13. Industrias Daikin, Ltd.
    12.13.1. Panorama financiero
    12.13.2. Productos Ofrecidos
    12.13.3. Desarrollos clave
    12.13.4. Análisis FODA
    12.13.5. Estrategias clave
    12.14. Hitachi Ltd.
    12.14.1. Panorama financiero
    12.14.2. Productos Ofrecidos
    12.14.3. Desarrollos clave
    12.14.4. Análisis FODA
    12.14.5. Estrategias clave
    12.15. Aux Group Co., Ltd.
    12.15.1. Panorama financiero
    12.15.2. Productos ofrecidos
    12.15.3. Desarrollos clave
    12.15.4. Análisis FODA
    12.15.5. Estrategias clave
    13. APÉNDICE
    13.1. Referencias
    13.2. Informes relacionados
    LISTA DE TABLAS

    TABLA 1. LISTA DE SUPUESTOS
    TABLA 2. ESTIMACIONES Y ESTIMACIONES DEL TAMAÑO DEL MERCADO DE SISTEMA DE FLUJO VARIABLE DE REFRIGERANTE EN AMÉRICA DEL NORTE. PRONÓSTICO, POR CAPACIDAD, 2019-2032 (MILES DE MILLONES DE USD)
    TABLA 3. ESTIMACIONES Y ESTIMACIONES DEL TAMAÑO DEL MERCADO DE SISTEMA DE FLUJO VARIABLE DE REFRIGERANTE EN AMÉRICA DEL NORTE. PRONÓSTICO, POR APLICACIÓN, 2019-2032 (MILES DE MILLONES DE USD)
    TABLA 4. ESTIMACIONES Y ESTIMACIONES DEL TAMAÑO DEL MERCADO DE SISTEMA DE FLUJO VARIABLE DE REFRIGERANTE EN AMÉRICA DEL NORTE. PRONÓSTICO, POR CONFIGURACIÓN, 2019-2032 (MILES DE MILLONES DE USD)
    TABLA 5. ESTIMACIONES Y ESTIMACIONES DEL TAMAÑO DEL MERCADO DE SISTEMA DE FLUJO DE REFRIGERANTE VARIABLE DE AMÉRICA DEL NORTE. PRONÓSTICO, POR TECNOLOGÍA, 2019-2032 (MILES DE MILLONES DE USD)
    TABLA 6. ESTIMACIONES Y ESTIMACIONES DEL TAMAÑO DEL MERCADO DE SISTEMA DE FLUJO VARIABLE DE REFRIGERANTE EN AMÉRICA DEL NORTE. PRONÓSTICO, POR REGIONAL, 2019-2032 (MILES DE MILLONES DE USD)
    TABLA 7. ESTIMACIONES Y ESTIMACIONES DEL TAMAÑO DEL MERCADO DE SISTEMA DE FLUJO VARIABLE DE REFRIGERANTE DE EE. UU. PRONÓSTICO, POR CAPACIDAD, 2019-2032 (MILES DE MILLONES DE USD)
    TABLA 8. ESTIMACIONES Y ESTIMACIONES DEL TAMAÑO DEL MERCADO DE SISTEMA DE FLUJO VARIABLE DE REFRIGERANTE DE EE. UU. PRONÓSTICO, POR APLICACIÓN, 2019-2032 (MILES DE MILLONES DE USD)
    TABLA 9. ESTIMACIONES Y ESTIMACIONES DEL TAMAÑO DEL MERCADO DE SISTEMA DE FLUJO VARIABLE DE REFRIGERANTE DE EE. UU. PRONÓSTICO, POR CONFIGURACIÓN, 2019-2032 (MILES DE MILLONES DE USD)
    TABLA 10. ESTIMACIONES Y ESTIMACIONES DEL TAMAÑO DEL MERCADO DE SISTEMA DE FLUJO VARIABLE DE REFRIGERANTE DE EE. UU. PRONÓSTICO, POR TECNOLOGÍA, 2019-2032 (MILES DE MILLONES DE USD)
    TABLA 11. ESTIMACIONES Y ESTIMACIONES DEL TAMAÑO DEL MERCADO DE SISTEMA DE FLUJO VARIABLE DE REFRIGERANTE DE EE. UU. PRONÓSTICO, POR REGIONAL, 2019-2032 (MILES DE MILLONES DE USD)
    TABLA 12. ESTIMACIONES Y ESTIMACIONES DEL TAMAÑO DEL MERCADO DE SISTEMA DE FLUJO VARIABLE DE REFRIGERANTE EN CANADÁ. PRONÓSTICO, POR CAPACIDAD, 2019-2032 (MILES DE MILLONES DE USD)
    TABLA 13. ESTIMACIONES Y ESTIMACIONES DEL TAMAÑO DEL MERCADO DE SISTEMA DE FLUJO VARIABLE DE REFRIGERANTE EN CANADÁ. PRONÓSTICO, POR APLICACIÓN, 2019-2032 (MILES DE MILLONES DE USD)
    TABLA 14. ESTIMACIONES Y ESTIMACIONES DEL TAMAÑO DEL MERCADO DE SISTEMA DE FLUJO VARIABLE DE REFRIGERANTE DE CANADÁ. PRONÓSTICO, POR CONFIGURACIÓN, 2019-2032 (MILES DE MILLONES DE USD)
    TABLA 15. ESTIMACIONES Y ESTIMACIONES DEL TAMAÑO DEL MERCADO DE SISTEMA DE FLUJO VARIABLE DE REFRIGERANTE DE CANADÁ. PRONÓSTICO, POR TECNOLOGÍA, 2019-2032 (MILES DE MILLONES DE USD)
    TABLA 16. ESTIMACIONES Y ESTIMACIONES DEL TAMAÑO DEL MERCADO DE SISTEMA DE FLUJO VARIABLE DE REFRIGERANTE EN CANADÁ. PRONÓSTICO, POR REGIONAL, 2019-2032 (MILES DE MILLONES DE USD)
    TABLA 17. ESTIMACIONES Y ESTIMACIONES DEL TAMAÑO DEL MERCADO DE SISTEMA DE FLUJO VARIABLE DE REFRIGERANTE EN EUROPA. PRONÓSTICO, POR CAPACIDAD, 2019-2032 (MILES DE MILLONES DE USD)
    TABLA 18. ESTIMACIONES Y ESTIMACIONES DEL TAMAÑO DEL MERCADO DE SISTEMA DE FLUJO VARIABLE DE REFRIGERANTE EN EUROPA. PRONÓSTICO, POR APLICACIÓN, 2019-2032 (MILES DE MILLONES DE USD)
    TABLA 19. ESTIMACIONES Y ESTIMACIONES DEL TAMAÑO DEL MERCADO DE SISTEMA DE FLUJO VARIABLE DE REFRIGERANTE EN EUROPA. PRONÓSTICO, POR CONFIGURACIÓN, 2019-2032 (MILES DE MILLONES DE USD)
    TABLA 20. ESTIMACIONES Y ESTIMACIONES DEL TAMAÑO DEL MERCADO DE SISTEMA DE FLUJO VARIABLE DE REFRIGERANTE EN EUROPA. PRONÓSTICO, POR TECNOLOGÍA, 2019-2032 (MILES DE MILLONES DE USD)
    TABLA 21. ESTIMACIONES Y ESTIMACIONES DEL TAMAÑO DEL MERCADO DE SISTEMA DE FLUJO VARIABLE DE REFRIGERANTE EN EUROPA. PRONÓSTICO, POR REGIONAL, 2019-2032 (MILES DE MILLONES DE USD)
    TABLA 22. ESTIMACIONES Y ESTIMACIONES DEL TAMAÑO DEL MERCADO DE SISTEMA DE FLUJO VARIABLE DE REFRIGERANTE EN ALEMANIA. PRONÓSTICO, POR CAPACIDAD, 2019-2032 (MILES DE MILLONES DE USD)
    TABLA 23. ESTIMACIONES Y ESTIMACIONES DEL TAMAÑO DEL MERCADO DE SISTEMA DE FLUJO VARIABLE DE REFRIGERANTE EN ALEMANIA. PRONÓSTICO, POR APLICACIÓN, 2019-2032 (MILES DE MILLONES DE USD)
    TABLA 24. ESTIMACIONES Y ESTIMACIONES DEL TAMAÑO DEL MERCADO DE SISTEMA DE FLUJO VARIABLE DE ALEMANIA. PRONÓSTICO, POR CONFIGURACIÓN, 2019-2032 (MILES DE MILLONES DE USD)
    TABLA 25. ESTIMACIONES Y ESTIMACIONES DEL TAMAÑO DEL MERCADO DE SISTEMA DE FLUJO VARIABLE DE REFRIGERANTE EN ALEMANIA. PRONÓSTICO, POR TECNOLOGÍA, 2019-2032 (MILES DE MILLONES DE USD)
    TABLA 26. ESTIMACIONES Y ESTIMACIONES DEL TAMAÑO DEL MERCADO DE SISTEMA DE FLUJO VARIABLE DE REFRIGERANTE EN ALEMANIA. PRONÓSTICO, POR REGIONAL, 2019-2032 (MILES DE MILLONES DE USD)
    TABLA 27. ESTIMACIONES Y ESTIMACIONES DEL TAMAÑO DEL MERCADO DE SISTEMA DE FLUJO VARIABLE DE REFRIGERANTE DEL REINO UNIDO. PRONÓSTICO, POR CAPACIDAD, 2019-2032 (MILES DE MILLONES DE USD)
    TABLA 28. ESTIMACIONES Y ESTIMACIONES DEL TAMAÑO DEL MERCADO DE SISTEMA DE FLUJO VARIABLE DE REFRIGERANTE DEL REINO UNIDO. PRONÓSTICO, POR APLICACIÓN, 2019-2032 (MILES DE MILLONES DE USD)
    TABLA 29. ESTIMACIONES Y ESTIMACIONES DEL TAMAÑO DEL MERCADO DE SISTEMA DE FLUJO DE REFRIGERANTE VARIABLE DEL REINO UNIDO. PRONÓSTICO, POR CONFIGURACIÓN, 2019-2032 (MILES DE MILLONES DE USD)
    TABLA 30. ESTIMACIONES Y ESTIMACIONES DEL TAMAÑO DEL MERCADO DE SISTEMA DE FLUJO DE REFRIGERANTE VARIABLE DEL REINO UNIDO. PRONÓSTICO, POR TECNOLOGÍA, 2019-2032 (MILES DE MILLONES DE USD)
    TABLA 31. ESTIMACIONES Y ESTIMACIONES DEL TAMAÑO DEL MERCADO DE SISTEMA DE FLUJO VARIABLE DE REFRIGERANTE DEL REINO UNIDO. PRONÓSTICO, POR REGIONAL, 2019-2032 (MILES DE MILLONES DE USD)
    TABLA 32. ESTIMACIONES Y ESTIMACIONES DEL TAMAÑO DEL MERCADO DE SISTEMA DE FLUJO VARIABLE DE FRANCIA. PRONÓSTICO, POR CAPACIDAD, 2019-2032 (MILES DE MILLONES DE USD)
    TABLA 33. ESTIMACIONES Y ESTIMACIONES DEL TAMAÑO DEL MERCADO DE SISTEMA DE FLUJO VARIABLE DE FRANCIA. PRONÓSTICO, POR APLICACIÓN, 2019-2032 (MILES DE MILLONES DE USD)
    TABLA 34. ESTIMACIONES Y ESTIMACIONES DEL TAMAÑO DEL MERCADO DE SISTEMA DE FLUJO DE REFRIGERANTE VARIABLE EN FRANCIA. PRONÓSTICO, POR CONFIGURACIÓN, 2019-2032 (MILES DE MILLONES DE USD)
    TABLA 35. ESTIMACIONES Y ESTIMACIONES DEL TAMAÑO DEL MERCADO DE SISTEMA DE FLUJO VARIABLE DE FRANCIA. PRONÓSTICO, POR TECNOLOGÍA, 2019-2032 (MILES DE MILLONES DE USD)
    TABLA 36. ESTIMACIONES Y ESTIMACIONES DEL TAMAÑO DEL MERCADO DE SISTEMA DE FLUJO VARIABLE DE FRANCIA. PRONÓSTICO, POR REGIONAL, 2019-2032 (MILES DE MILLONES DE USD)
    TABLA 37. ESTIMACIONES Y ESTIMACIONES DEL TAMAÑO DEL MERCADO DE SISTEMA DE FLUJO VARIABLE DE REFRIGERANTE DE RUSIA. PRONÓSTICO, POR CAPACIDAD, 2019-2032 (MILES DE MILLONES DE USD)
    TABLA 38. ESTIMACIONES Y ESTIMACIONES DEL TAMAÑO DEL MERCADO DE SISTEMA DE FLUJO VARIABLE DE REFRIGERANTE DE RUSIA. PRONÓSTICO, POR APLICACIÓN, 2019-2032 (MILES DE MILLONES DE USD)
    TABLA 39. ESTIMACIONES Y ESTIMACIONES DEL TAMAÑO DEL MERCADO DE SISTEMA DE FLUJO VARIABLE DE REFRIGERANTE DE RUSIA. PRONÓSTICO, POR CONFIGURACIÓN, 2019-2032 (MILES DE MILLONES DE USD)
    TABLA 40. ESTIMACIONES Y ESTIMACIONES DEL TAMAÑO DEL MERCADO DE SISTEMA DE FLUJO VARIABLE DE REFRIGERANTE DE RUSIA. PRONÓSTICO, POR TECNOLOGÍA, 2019-2032 (MILES DE MILLONES DE USD)
    TABLA 41. ESTIMACIONES Y ESTIMACIONES DEL TAMAÑO DEL MERCADO DE SISTEMA DE FLUJO DE REFRIGERANTE VARIABLE DE RUSIA. PRONÓSTICO, POR REGIONAL, 2019-2032 (MILES DE MILLONES DE USD)
    TABLA 42. ESTIMACIONES Y ESTIMACIONES DEL TAMAÑO DEL MERCADO DE SISTEMA DE FLUJO VARIABLE DE REFRIGERANTE EN ITALIA. PRONÓSTICO, POR CAPACIDAD, 2019-2032 (MILES DE MILLONES DE USD)
    TABLA 43. ESTIMACIONES Y POTENCIAS DEL TAMAÑO DEL MERCADO DE SISTEMA DE FLUJO VARIABLE DE ITALIA. PRONÓSTICO, POR APLICACIÓN, 2019-2032 (MILES DE MILLONES DE USD)
    TABLA 44. ESTIMACIONES Y ESTIMACIONES DEL TAMAÑO DEL MERCADO DE SISTEMA DE FLUJO VARIABLE DE ITALIA. PRONÓSTICO, POR CONFIGURACIÓN, 2019-2032 (MILES DE MILLONES DE USD)
    TABLA 45. ESTIMACIONES Y ESTIMACIONES DEL TAMAÑO DEL MERCADO DE SISTEMA DE FLUJO VARIABLE DE ITALIA. PRONÓSTICO, POR TECNOLOGÍA, 2019-2032 (MILES DE MILLONES DE USD)
    TABLA 46. ESTIMACIONES Y ESTIMACIONES DEL TAMAÑO DEL MERCADO DE SISTEMA DE FLUJO DE REFRIGERANTE VARIABLE DE ITALIA. PRONÓSTICO, POR REGIONAL, 2019-2032 (MILES DE MILLONES DE USD)
    TABLA 47. ESTIMACIONES Y ESTIMACIONES DEL TAMAÑO DEL MERCADO DE SISTEMA DE FLUJO VARIABLE DE REFRIGERANTE EN ESPAÑA. PRONÓSTICO, POR CAPACIDAD, 2019-2032 (MILES DE MILLONES DE USD)
    TABLA 48. ESTIMACIONES Y ESTIMACIONES DEL TAMAÑO DEL MERCADO DE SISTEMA DE FLUJO VARIABLE DE REFRIGERANTE EN ESPAÑA. PRONÓSTICO, POR APLICACIÓN, 2019-2032 (MILES DE MILLONES DE USD)
    TABLA 49. ESTIMACIONES Y ESTIMACIONES DEL TAMAÑO DEL MERCADO DE SISTEMA DE FLUJO VARIABLE DE REFRIGERANTE EN ESPAÑA. PRONÓSTICO, POR CONFIGURACIÓN, 2019-2032 (MILES DE MILLONES DE USD)
    TABLA 50. ESTIMACIONES Y ESTIMACIONES DEL TAMAÑO DEL MERCADO DE SISTEMA DE FLUJO VARIABLE DE REFRIGERANTE EN ESPAÑA. PRONÓSTICO, POR TECNOLOGÍA, 2019-2032 (MILES DE MILLONES DE USD)
    TABLA 51. ESTIMACIONES Y ESTIMACIONES DEL TAMAÑO DEL MERCADO DE SISTEMA DE FLUJO VARIABLE DE REFRIGERANTE EN ESPAÑA. PRONÓSTICO, POR REGIONAL, 2019-2032 (MILES DE MILLONES DE USD)
    TABLA 52. ESTIMACIONES Y ESTIMACIONES DEL TAMAÑO DEL MERCADO DE SISTEMA DE FLUJO DE REFRIGERANTE VARIABLE PARA EL RESTO DE EUROPA. PRONÓSTICO, POR CAPACIDAD, 2019-2032 (MILES DE MILLONES DE USD)
    TABLA 53. ESTIMACIONES Y ESTIMACIONES DEL TAMAÑO DEL MERCADO DE SISTEMA DE FLUJO DE REFRIGERANTE VARIABLE PARA EL RESTO DE EUROPA. PRONÓSTICO, POR APLICACIÓN, 2019-2032 (MILES DE MILLONES DE USD)
    TABLA 54. ESTIMACIONES Y ESTIMACIONES DEL TAMAÑO DEL MERCADO DE SISTEMA DE FLUJO DE REFRIGERANTE VARIABLE PARA EL RESTO DE EUROPA. PRONÓSTICO, POR CONFIGURACIÓN, 2019-2032 (MILES DE MILLONES DE USD)
    TABLA 55. ESTIMACIONES Y ESTIMACIONES DEL TAMAÑO DEL MERCADO DE SISTEMA DE FLUJO DE REFRIGERANTE VARIABLE PARA EL RESTO DE EUROPA. PRONÓSTICO, POR TECNOLOGÍA, 2019-2032 (MILES DE MILLONES DE USD)
    TABLA 56. ESTIMACIONES Y ESTIMACIONES DEL TAMAÑO DEL MERCADO DE SISTEMA DE FLUJO DE REFRIGERANTE VARIABLE PARA EL RESTO DE EUROPA. PRONÓSTICO, POR REGIONAL, 2019-2032 (MILES DE MILLONES DE USD)
    TABLA 57. ESTIMACIONES Y ESTIMACIONES DEL TAMAÑO DEL MERCADO DE SISTEMA DE FLUJO DE REFRIGERANTE VARIABLE DE APAC. PRONÓSTICO, POR CAPACIDAD, 2019-2032 (MILES DE MILLONES DE USD)
    TABLA 58. ESTIMACIONES Y ESTIMACIONES DEL TAMAÑO DEL MERCADO DE SISTEMA DE FLUJO DE REFRIGERANTE VARIABLE DE APAC. PRONÓSTICO, POR APLICACIÓN, 2019-2032 (MILES DE MILLONES DE USD)
    TABLA 59. ESTIMACIONES Y ESTIMACIONES DEL TAMAÑO DEL MERCADO DE SISTEMA DE FLUJO VARIABLE DE APAC APAC. PRONÓSTICO, POR CONFIGURACIÓN, 2019-2032 (MILES DE MILLONES DE USD)
    TABLA 60. ESTIMACIONES Y ESTIMACIONES DEL TAMAÑO DEL MERCADO DE SISTEMA DE FLUJO VARIABLE DE APAC APAC. PRONÓSTICO, POR TECNOLOGÍA, 2019-2032 (MILES DE MILLONES DE USD)
    TABLA 61. ESTIMACIONES Y ESTIMACIONES DEL TAMAÑO DEL MERCADO DE SISTEMA DE FLUJO VARIABLE DE APAC APAC. PRONÓSTICO, POR REGIONAL, 2019-2032 (MILES DE MILLONES DE USD)
    TABLA 62. ESTIMACIONES Y ESTIMACIONES DEL TAMAÑO DEL MERCADO DE SISTEMA DE FLUJO VARIABLE DE REFRIGERANTE DE CHINA. PRONÓSTICO, POR CAPACIDAD, 2019-2032 (MILES DE MILLONES DE USD)
    TABLA 63. ESTIMACIONES Y ESTIMACIONES DEL TAMAÑO DEL MERCADO DE SISTEMA DE FLUJO VARIABLE DE REFRIGERANTE DE CHINA. PRONÓSTICO, POR APLICACIÓN, 2019-2032 (MILES DE MILLONES DE USD)
    TABLA 64. ESTIMACIONES Y ESTIMACIONES DEL TAMAÑO DEL MERCADO DE SISTEMA DE FLUJO DE REFRIGERANTE VARIABLE DE CHINA. PRONÓSTICO, POR CONFIGURACIÓN, 2019-2032 (MILES DE MILLONES DE USD)
    TABLA 65. ESTIMACIONES Y PREVISIÓN DEL TAMAÑO DEL MERCADO DE SISTEMA DE FLUJO VARIABLE DE CHINA. PRONÓSTICO, POR TECNOLOGÍA, 2019-2032 (MILES DE MILLONES DE USD)
    TABLA 66. ESTIMACIONES Y ESTIMACIONES DEL TAMAÑO DEL MERCADO DE SISTEMA DE FLUJO VARIABLE DE REFRIGERANTE DE CHINA. PRONÓSTICO, POR REGIONAL, 2019-2032 (MILES DE MILLONES DE USD)
    TABLA 67. ESTIMACIONES Y ESTIMACIONES DEL TAMAÑO DEL MERCADO DE SISTEMA DE FLUJO VARIABLE DE REFRIGERANTE DE LA INDIA. PRONÓSTICO, POR CAPACIDAD, 2019-2032 (MILES DE MILLONES DE USD)
    TABLA 68. ESTIMACIONES Y ESTIMACIONES DEL TAMAÑO DEL MERCADO DE SISTEMA DE FLUJO VARIABLE DE REFRIGERANTE DE LA INDIA. PRONÓSTICO, POR APLICACIÓN, 2019-2032 (MILES DE MILLONES DE USD)
    TABLA 69. ESTIMACIONES Y ESTIMACIONES DEL TAMAÑO DEL MERCADO DE SISTEMA DE FLUJO VARIABLE DE REFRIGERANTE DE LA INDIA. PRONÓSTICO, POR CONFIGURACIÓN, 2019-2032 (MILES DE MILLONES DE USD)
    TABLA 70. ESTIMACIONES Y ESTIMACIONES DEL TAMAÑO DEL MERCADO DE SISTEMA DE FLUJO VARIABLE DE REFRIGERANTE DE LA INDIA. PRONÓSTICO, POR TECNOLOGÍA, 2019-2032 (MILES DE MILLONES DE USD)
    TABLA 71. ESTIMACIONES Y ESTIMACIONES DEL TAMAÑO DEL MERCADO DE SISTEMA DE FLUJO VARIABLE DE REFRIGERANTE DE LA INDIA. PRONÓSTICO, POR REGIONAL, 2019-2032 (MILES DE MILLONES DE USD)
    TABLA 72. ESTIMACIONES Y ESTIMACIONES DEL TAMAÑO DEL MERCADO DE SISTEMA DE FLUJO VARIABLE DE REFRIGERANTE EN JAPÓN. PRONÓSTICO, POR CAPACIDAD, 2019-2032 (MILES DE MILLONES DE USD)
    TABLA 73. ESTIMACIONES Y ESTIMACIONES DEL TAMAÑO DEL MERCADO DE SISTEMA DE FLUJO VARIABLE DE REFRIGERANTE EN JAPÓN. PRONÓSTICO, POR APLICACIÓN, 2019-2032 (MILES DE MILLONES DE USD)
    TABLA 74. ESTIMACIONES Y ESTIMACIONES DEL TAMAÑO DEL MERCADO DE SISTEMA DE FLUJO VARIABLE DE REFRIGERANTE DE JAPÓN. PRONÓSTICO, POR CONFIGURACIÓN, 2019-2032 (MILES DE MILLONES DE USD)
    TABLA 75. ESTIMACIONES Y ESTIMACIONES DEL TAMAÑO DEL MERCADO DE SISTEMA DE FLUJO VARIABLE DE REFRIGERANTE DE JAPÓN. PRONÓSTICO, POR TECNOLOGÍA, 2019-2032 (MILES DE MILLONES DE USD)
    TABLA 76. ESTIMACIONES Y ESTIMACIONES DEL TAMAÑO DEL MERCADO DE SISTEMA DE FLUJO VARIABLE DE REFRIGERANTE EN JAPÓN. PRONÓSTICO, POR REGIONAL, 2019-2032 (MILES DE MILLONES DE USD)
    TABLA 77. ESTIMACIONES Y ESTIMACIONES DEL TAMAÑO DEL MERCADO DE SISTEMA DE FLUJO VARIABLE DE REFRIGERANTE DE COREA DEL SUR. PRONÓSTICO, POR CAPACIDAD, 2019-2032 (MILES DE MILLONES DE USD)
    TABLA 78. ESTIMACIONES Y ESTIMACIONES DEL TAMAÑO DEL MERCADO DE SISTEMA DE FLUJO DE REFRIGERANTE VARIABLE DE COREA DEL SUR. PRONÓSTICO, POR APLICACIÓN, 2019-2032 (MILES DE MILLONES DE USD)
    TABLA 79. ESTIMACIONES Y ESTIMACIONES DEL TAMAÑO DEL MERCADO DE SISTEMA DE FLUJO DE REFRIGERANTE VARIABLE DE COREA DEL SUR. PRONÓSTICO, POR CONFIGURACIÓN, 2019-2032 (MILES DE MILLONES DE USD)
    TABLA 80. ESTIMACIONES Y ESTIMACIONES DEL TAMAÑO DEL MERCADO DE SISTEMA DE FLUJO DE REFRIGERANTE VARIABLE DE COREA DEL SUR. PRONÓSTICO, POR TECNOLOGÍA, 2019-2032 (MILES DE MILLONES DE USD)
    TABLA 81. ESTIMACIONES Y ESTIMACIONES DEL TAMAÑO DEL MERCADO DE SISTEMA DE FLUJO VARIABLE DE REFRIGERANTE DE COREA DEL SUR. PRONÓSTICO, POR REGIONAL, 2019-2032 (MILES DE MILLONES DE USD)
    TABLA 82. ESTIMACIONES Y ESTIMACIONES DEL TAMAÑO DEL MERCADO DE SISTEMA DE FLUJO VARIABLE DE MALASIA EN MALASIA. PRONÓSTICO, POR CAPACIDAD, 2019-2032 (MILES DE MILLONES DE USD)
    TABLA 83. ESTIMACIONES Y ESTIMACIONES DEL TAMAÑO DEL MERCADO DE SISTEMA DE FLUJO DE REFRIGERANTE VARIABLE DE MALASIA. PRONÓSTICO, POR APLICACIÓN, 2019-2032 (MILES DE MILLONES DE USD)
    TABLA 84. ESTIMACIONES Y ESTIMACIONES DEL TAMAÑO DEL MERCADO DE SISTEMA DE FLUJO DE REFRIGERANTE VARIABLE DE MALASIA. PRONÓSTICO, POR CONFIGURACIÓN, 2019-2032 (MILES DE MILLONES DE USD)
    TABLA 85. ESTIMACIONES Y ESTIMACIONES DEL TAMAÑO DEL MERCADO DE SISTEMA DE FLUJO DE REFRIGERANTE VARIABLE DE MALASIA. PRONÓSTICO, POR TECNOLOGÍA, 2019-2032 (MILES DE MILLONES DE USD)
    TABLA 86. ESTIMACIONES Y ESTIMACIONES DEL TAMAÑO DEL MERCADO DE SISTEMA DE FLUJO DE REFRIGERANTE VARIABLE DE MALASIA. PRONÓSTICO, POR REGIONAL, 2019-2032 (MILES DE MILLONES DE USD)
    TABLA 87. ESTIMACIONES Y ESTIMACIONES DEL TAMAÑO DEL MERCADO DE SISTEMA DE FLUJO VARIABLE DE REFRIGERANTE DE TAILANDIA. PRONÓSTICO, POR CAPACIDAD, 2019-2032 (MILES DE MILLONES DE USD)
    TABLA 88. ESTIMACIONES Y ESTIMACIONES DEL TAMAÑO DEL MERCADO DE SISTEMA DE FLUJO VARIABLE DE REFRIGERANTE DE TAILANDIA. PRONÓSTICO, POR APLICACIÓN, 2019-2032 (MILES DE MILLONES DE USD)
    TABLA 89. ESTIMACIONES Y ESTIMACIONES DEL TAMAÑO DEL MERCADO DE SISTEMA DE FLUJO VARIABLE DE REFRIGERANTE DE TAILANDIA. PRONÓSTICO, POR CONFIGURACIÓN, 2019-2032 (MILES DE MILLONES DE USD)
    TABLA 90. ESTIMACIONES Y ESTIMACIONES DEL TAMAÑO DEL MERCADO DE SISTEMA DE FLUJO DE REFRIGERANTE VARIABLE DE TAILANDIA. PRONÓSTICO, POR TECNOLOGÍA, 2019-2032 (MILES DE MILLONES DE USD)
    TABLA 91. ESTIMACIONES Y ESTIMACIONES DEL TAMAÑO DEL MERCADO DE SISTEMA DE FLUJO VARIABLE DE REFRIGERANTE DE TAILANDIA. PRONÓSTICO, POR REGIONAL, 2019-2032 (MILES DE MILLONES DE USD)
    TABLA 92. ESTIMACIONES Y ESTIMACIONES DEL TAMAÑO DEL MERCADO DE SISTEMA DE FLUJO VARIABLE DE REFRIGERANTE DE INDONESIA. PRONÓSTICO, POR CAPACIDAD, 2019-2032 (MILES DE MILLONES DE USD)
    TABLA 93. ESTIMACIONES Y ESTIMACIONES DEL TAMAÑO DEL MERCADO DE SISTEMA DE FLUJO VARIABLE DE REFRIGERANTE DE INDONESIA. PRONÓSTICO, POR APLICACIÓN, 2019-2032 (MILES DE MILLONES DE USD)
    TABLA 94. ESTIMACIONES Y ESTIMACIONES DEL TAMAÑO DEL MERCADO DE SISTEMA DE FLUJO VARIABLE DE REFRIGERANTE DE INDONESIA. PRONÓSTICO, POR CONFIGURACIÓN, 2019-2032 (MILES DE MILLONES DE USD)
    TABLA 95. ESTIMACIONES Y ESTIMACIONES DEL TAMAÑO DEL MERCADO DE SISTEMA DE FLUJO VARIABLE DE REFRIGERANTE DE INDONESIA. PRONÓSTICO, POR TECNOLOGÍA, 2019-2032 (MILES DE MILLONES DE USD)
    TABLA 96. ESTIMACIONES Y ESTIMACIONES DEL TAMAÑO DEL MERCADO DE SISTEMA DE FLUJO DE REFRIGERANTE VARIABLE DE INDONESIA. PRONÓSTICO, POR REGIONAL, 2019-2032 (MILES DE MILLONES DE USD)
    TABLA 97. ESTIMACIONES Y ESTIMACIONES DEL TAMAÑO DEL MERCADO DEL RESTO DE SISTEMA DE FLUJO DE REFRIGERANTE VARIABLE DE APAC. PRONÓSTICO, POR CAPACIDAD, 2019-2032 (MILES DE MILLONES DE USD)
    TABLA 98. ESTIMACIONES Y ESTIMACIONES DEL TAMAÑO DEL MERCADO DEL RESTO DE SISTEMA DE FLUJO DE REFRIGERANTE VARIABLE DE APAC. PRONÓSTICO, POR APLICACIÓN, 2019-2032 (MILES DE MILLONES DE USD)
    TABLA 99. ESTIMACIONES Y ESTIMACIONES DEL TAMAÑO DEL MERCADO DEL RESTO DE SISTEMA DE FLUJO DE REFRIGERANTE VARIABLE DE APAC. PRONÓSTICO, POR CONFIGURACIÓN, 2019-2032 (MILES DE MILLONES DE USD)
    TABLA 100. ESTIMACIONES Y ESTIMACIONES DEL TAMAÑO DEL MERCADO DEL RESTO DE SISTEMA DE FLUJO DE REFRIGERANTE VARIABLE DE APAC. PRONÓSTICO, POR TECNOLOGÍA, 2019-2032 (MILES DE MILLONES DE USD)
    TABLA 101. ESTIMACIONES Y ESTIMACIONES DEL TAMAÑO DEL MERCADO DEL RESTO DE SISTEMA DE FLUJO DE REFRIGERANTE VARIABLE DE APAC. PRONÓSTICO, POR REGIONAL, 2019-2032 (MILES DE MILLONES DE USD)
    TABLA 102. ESTIMACIONES Y ESTIMACIONES DEL TAMAÑO DEL MERCADO DE SISTEMA DE FLUJO VARIABLE DE REFRIGERANTE EN AMÉRICA DEL SUR. PRONÓSTICO, POR CAPACIDAD, 2019-2032 (MILES DE MILLONES DE USD)
    TABLA 103. ESTIMACIONES Y ESTIMACIONES DEL TAMAÑO DEL MERCADO DE SISTEMA DE FLUJO VARIABLE DE REFRIGERANTE EN AMÉRICA DEL SUR. PRONÓSTICO, POR APLICACIÓN, 2019-2032 (MILES DE MILLONES DE USD)
    TABLA 104. ESTIMACIONES Y ESTIMACIONES DEL TAMAÑO DEL MERCADO DE SISTEMA DE FLUJO VARIABLE DE REFRIGERANTE EN AMÉRICA DEL SUR. PRONÓSTICO, POR CONFIGURACIÓN, 2019-2032 (MILES DE MILLONES DE USD)
    TABLA 105. ESTIMACIONES Y ESTIMACIONES DEL TAMAÑO DEL MERCADO DE SISTEMA DE FLUJO VARIABLE DE REFRIGERANTE EN AMÉRICA DEL SUR. PRONÓSTICO, POR TECNOLOGÍA, 2019-2032 (MILES DE MILLONES DE USD)
    TABLA 106. ESTIMACIONES Y ESTIMACIONES DEL TAMAÑO DEL MERCADO DE SISTEMA DE FLUJO VARIABLE DE REFRIGERANTE EN AMÉRICA DEL SUR. PRONÓSTICO, POR REGIONAL, 2019-2032 (MILES DE MILLONES DE USD)
    TABLA 107. ESTIMACIONES Y ESTIMACIONES DEL TAMAÑO DEL MERCADO DE SISTEMA DE FLUJO VARIABLE DE REFRIGERANTE DE BRASIL. PRONÓSTICO, POR CAPACIDAD, 2019-2032 (MILES DE MILLONES DE USD)
    TABLA 108. ESTIMACIONES Y ESTIMACIONES DEL TAMAÑO DEL MERCADO DE SISTEMA DE FLUJO VARIABLE DE REFRIGERANTE EN BRASIL. PRONÓSTICO, POR APLICACIÓN, 2019-2032 (MILES DE MILLONES DE USD)
    TABLA 109. ESTIMACIONES Y ESTIMACIONES DEL TAMAÑO DEL MERCADO DE SISTEMA DE FLUJO VARIABLE DE REFRIGERANTE DE BRASIL. PRONÓSTICO, POR CONFIGURACIÓN, 2019-2032 (MILES DE MILLONES DE USD)
    TABLA 110. ESTIMACIONES Y ESTIMACIONES DEL TAMAÑO DEL MERCADO DE SISTEMA DE FLUJO VARIABLE DE REFRIGERANTE EN BRASIL. PRONÓSTICO, POR TECNOLOGÍA, 2019-2032 (MILES DE MILLONES DE USD)
    TABLA 111. ESTIMACIONES Y ESTIMACIONES DEL TAMAÑO DEL MERCADO DE SISTEMA DE FLUJO VARIABLE DE REFRIGERANTE EN BRASIL. PRONÓSTICO, POR REGIONAL, 2019-2032 (MILES DE MILLONES DE USD)
    TABLA 112. ESTIMACIONES Y ESTIMACIONES DEL TAMAÑO DEL MERCADO DE SISTEMA DE FLUJO VARIABLE DE REFRIGERANTE EN MÉXICO. PRONÓSTICO, POR CAPACIDAD, 2019-2032 (MILES DE MILLONES DE USD)
    TABLA 113. ESTIMACIONES Y ESTIMACIONES DEL TAMAÑO DEL MERCADO DE SISTEMA DE FLUJO VARIABLE DE REFRIGERANTE EN MÉXICO. PRONÓSTICO, POR APLICACIÓN, 2019-2032 (MILES DE MILLONES DE USD)
    TABLA 114. ESTIMACIONES Y ESTIMACIONES DEL TAMAÑO DEL MERCADO DE SISTEMA DE FLUJO VARIABLE DE REFRIGERANTE EN MÉXICO. PRONÓSTICO, POR CONFIGURACIÓN, 2019-2032 (MILES DE MILLONES DE USD)
    TABLA 115. ESTIMACIONES Y ESTIMACIONES DEL TAMAÑO DEL MERCADO DE SISTEMA DE FLUJO VARIABLE DE REFRIGERANTE EN MÉXICO. PRONÓSTICO, POR TECNOLOGÍA, 2019-2032 (MILES DE MILLONES DE USD)
    TABLA 116. ESTIMACIONES Y ESTIMACIONES DEL TAMAÑO DEL MERCADO DE SISTEMA DE FLUJO VARIABLE DE REFRIGERANTE EN MÉXICO. PRONÓSTICO, POR REGIONAL, 2019-2032 (MILES DE MILLONES DE USD)
    TABLA 117. ESTIMACIONES Y ESTIMACIONES DEL TAMAÑO DEL MERCADO DE SISTEMA DE FLUJO VARIABLE DE REFRIGERANTE EN ARGENTINA. PRONÓSTICO, POR CAPACIDAD, 2019-2032 (MILES DE MILLONES DE USD)
    TABLA 118. ESTIMACIONES Y ESTIMACIONES DEL TAMAÑO DEL MERCADO DE SISTEMA DE FLUJO VARIABLE DE REFRIGERANTE EN ARGENTINA. PRONÓSTICO, POR APLICACIÓN, 2019-2032 (MILES DE MILLONES DE USD)
    TABLA 119. ESTIMACIONES Y ESTIMACIONES DEL TAMAÑO DEL MERCADO DE SISTEMA DE FLUJO VARIABLE DE REFRIGERANTE EN ARGENTINA. PRONÓSTICO, POR CONFIGURACIÓN, 2019-2032 (MILES DE MILLONES DE USD)
    TABLA 120. ESTIMACIONES Y ESTIMACIONES DEL TAMAÑO DEL MERCADO DE SISTEMA DE FLUJO VARIABLE DE REFRIGERANTE EN ARGENTINA. PRONÓSTICO, POR TECNOLOGÍA, 2019-2032 (MILES DE MILLONES DE USD)
    TABLA 121. ESTIMACIONES Y ESTIMACIONES DEL TAMAÑO DEL MERCADO DE SISTEMA DE FLUJO VARIABLE DE REFRIGERANTE EN ARGENTINA. PRONÓSTICO, POR REGIONAL, 2019-2032 (MILES DE MILLONES DE USD)
    TABLA 122. ESTIMACIONES Y ESTIMACIONES DEL TAMAÑO DEL MERCADO DE SISTEMA DE FLUJO DE REFRIGERANTE VARIABLE PARA EL RESTO DE SUDAMÉRICA. PRONÓSTICO, POR CAPACIDAD, 2019-2032 (MILES DE MILLONES DE USD)
    TABLA 123. ESTIMACIONES Y ESTIMACIONES DEL TAMAÑO DEL MERCADO DE SISTEMA DE FLUJO DE REFRIGERANTE VARIABLE PARA EL RESTO DE SUDAMÉRICA. PRONÓSTICO, POR APLICACIÓN, 2019-2032 (MILES DE MILLONES DE USD)
    TABLA 124. ESTIMACIONES Y ESTIMACIONES DEL TAMAÑO DEL MERCADO DE SISTEMA DE FLUJO DE REFRIGERANTE VARIABLE PARA EL RESTO DE SUDAMÉRICA. PRONÓSTICO, POR CONFIGURACIÓN, 2019-2032 (MILES DE MILLONES DE USD)
    TABLA 125. ESTIMACIONES Y ESTIMACIONES DEL TAMAÑO DEL MERCADO DE SISTEMA DE FLUJO DE REFRIGERANTE VARIABLE PARA EL RESTO DE SUDAMÉRICA. PRONÓSTICO, POR TECNOLOGÍA, 2019-2032 (MILES DE MILLONES DE USD)
    TABLA 126. ESTIMACIONES Y ESTIMACIONES DEL TAMAÑO DEL MERCADO DE SISTEMA DE FLUJO DE REFRIGERANTE VARIABLE PARA EL RESTO DE SUDAMÉRICA. PRONÓSTICO, POR REGIONAL, 2019-2032 (MILES DE MILLONES DE USD)
    TABLA 127. ESTIMACIONES Y ESTIMACIONES DEL TAMAÑO DEL MERCADO DEL SISTEMA DE FLUJO DE REFRIGERANTE VARIABLE MEA. PRONÓSTICO, POR CAPACIDAD, 2019-2032 (MILES DE MILLONES DE USD)
    TABLA 128. ESTIMACIONES Y ESTIMACIONES DEL TAMAÑO DEL MERCADO DEL SISTEMA DE FLUJO DE REFRIGERANTE VARIABLE MEA. PRONÓSTICO, POR APLICACIÓN, 2019-2032 (MILES DE MILLONES DE USD)
    TABLA 129. ESTIMACIONES Y ESTIMACIONES DEL TAMAÑO DEL MERCADO DEL SISTEMA DE FLUJO DE REFRIGERANTE VARIABLE MEA. PRONÓSTICO, POR CONFIGURACIÓN, 2019-2032 (MILES DE MILLONES DE USD)
    TABLA 130. ESTIMACIONES Y ESTIMACIONES DEL TAMAÑO DEL MERCADO DEL SISTEMA DE FLUJO DE REFRIGERANTE VARIABLE MEA. PRONÓSTICO, POR TECNOLOGÍA, 2019-2032 (MILES DE MILLONES DE USD)
    TABLA 131. SISTEMA DE FLUJO DE REFRIGERANTE VARIABLE MEA MESTIMACIONES Y ESTIMACIONES DEL TAMAÑO DEL MERCADO PRONÓSTICO, POR REGIONAL, 2019-2032 (MILES DE MILLONES DE USD)
    TABLA 132. ESTIMACIONES Y ESTIMACIONES DEL TAMAÑO DEL MERCADO DE SISTEMA DE FLUJO DE REFRIGERANTE VARIABLE DE LOS PAÍSES DEL CCG. PRONÓSTICO, POR CAPACIDAD, 2019-2032 (MILES DE MILLONES DE USD)
    TABLA 133. ESTIMACIONES Y ESTIMACIONES DEL TAMAÑO DEL MERCADO DE SISTEMA DE FLUJO DE REFRIGERANTE VARIABLE DE LOS PAÍSES DEL CCG. PRONÓSTICO, POR APLICACIÓN, 2019-2032 (MILES DE MILLONES DE USD)
    TABLA 134. ESTIMACIONES Y ESTIMACIONES DEL TAMAÑO DEL MERCADO DE SISTEMA DE FLUJO DE REFRIGERANTE VARIABLE DE LOS PAÍSES DEL CCG. PRONÓSTICO, POR CONFIGURACIÓN, 2019-2032 (MILES DE MILLONES DE USD)
    TABLA 135. ESTIMACIONES Y ESTIMACIONES DEL TAMAÑO DEL MERCADO DE SISTEMA DE FLUJO DE REFRIGERANTE VARIABLE DE LOS PAÍSES DEL CCG. PRONÓSTICO, POR TECNOLOGÍA, 2019-2032 (MILES DE MILLONES DE USD)
    TABLA 136. ESTIMACIONES Y ESTIMACIONES DEL TAMAÑO DEL MERCADO DE SISTEMA DE FLUJO DE REFRIGERANTE VARIABLE DE LOS PAÍSES DEL CCG. PRONÓSTICO, POR REGIONAL, 2019-2032 (MILES DE MILLONES DE USD)
    TABLA 137. ESTIMACIONES Y ESTIMACIONES DEL TAMAÑO DEL MERCADO DE SISTEMA DE FLUJO VARIABLE DE REFRIGERANTE EN SUDÁFRICA. PRONÓSTICO, POR CAPACIDAD, 2019-2032 (MILES DE MILLONES DE USD)
    TABLA 138. ESTIMACIONES Y ESTIMACIONES DEL TAMAÑO DEL MERCADO DE SISTEMA DE FLUJO VARIABLE DE REFRIGERANTE EN SUDÁFRICA. PRONÓSTICO, POR APLICACIÓN, 2019-2032 (MILES DE MILLONES DE USD)
    TABLA 139. ESTIMACIONES Y ESTIMACIONES DEL TAMAÑO DEL MERCADO DE SISTEMA DE FLUJO VARIABLE DE REFRIGERANTE EN SUDÁFRICA. PRONÓSTICO, POR CONFIGURACIÓN, 2019-2032 (MILES DE MILLONES DE USD)
    TABLA 140. ESTIMACIONES Y ESTIMACIONES DEL TAMAÑO DEL MERCADO DE SISTEMA DE FLUJO VARIABLE DE REFRIGERANTE EN SUDÁFRICA. PRONÓSTICO, POR TECNOLOGÍA, 2019-2032 (MILES DE MILLONES DE USD)
    TABLA 141. ESTIMACIONES Y ESTIMACIONES DEL TAMAÑO DEL MERCADO DE SISTEMA DE FLUJO VARIABLE DE REFRIGERANTE EN SUDÁFRICA. PRONÓSTICO, POR REGIONAL, 2019-2032 (MILES DE MILLONES DE USD)
    TABLA 142. ESTIMACIONES Y ESTIMACIONES DEL TAMAÑO DEL MERCADO DEL RESTO DE SISTEMA DE FLUJO DE REFRIGERANTE VARIABLE DE MEA. PRONÓSTICO, POR CAPACIDAD, 2019-2032 (MILES DE MILLONES DE USD)
    TABLA 143. ESTIMACIONES Y ESTIMACIONES DEL TAMAÑO DEL MERCADO DEL RESTO DE SISTEMA DE FLUJO DE REFRIGERANTE VARIABLE DE MEA. PRONÓSTICO, POR APLICACIÓN, 2019-2032 (MILES DE MILLONES DE USD)
    TABLA 144. ESTIMACIONES Y ESTIMACIONES DEL TAMAÑO DEL MERCADO DEL RESTO DE SISTEMA DE FLUJO DE REFRIGERANTE VARIABLE DE MEA. PRONÓSTICO, POR CONFIGURACIÓN, 2019-2032 (MILES DE MILLONES DE USD)
    TABLA 145. ESTIMACIONES Y ESTIMACIONES DEL TAMAÑO DEL MERCADO DEL RESTO DE SISTEMA DE FLUJO DE REFRIGERANTE VARIABLE DE MEA. PRONÓSTICO, POR TECNOLOGÍA, 2019-2032 (MILES DE MILLONES DE USD)
    TABLA 146. ESTIMACIONES Y ESTIMACIONES DEL TAMAÑO DEL MERCADO DEL RESTO DE SISTEMA DE FLUJO DE REFRIGERANTE VARIABLE DE MEA. PRONÓSTICO, POR REGIONAL, 2019-2032 (MILES DE MILLONES DE USD)
    TABLA 147. LANZAMIENTO/DESARROLLO/APROBACIÓN DE PRODUCTOS
    TABLA 148. ADQUISICIÓN/ASOCIACIÓN


    LISTA DE CIFRAS

    FIGURA 1. SINOPSIS DEL MERCADO
    FIGURA 2. ANÁLISIS DEL MERCADO DE SISTEMA DE FLUJO DE REFRIGERANTE VARIABLE EN AMÉRICA DEL NORTE
    FIGURA 3. A NOSOTROS ANÁLISIS DEL MERCADO DE SISTEMA DE FLUJO DE REFRIGERANTE VARIABLE POR CAPACIDAD
    FIGURA 4. ANÁLISIS DEL MERCADO DE SISTEMA DE FLUJO DE REFRIGERANTE VARIABLE DE EE. UU. POR APLICACIÓN
    FIGURA 5. ANÁLISIS DEL MERCADO DE SISTEMA DE FLUJO DE REFRIGERANTE VARIABLE DE EE. UU. POR CONFIGURACIÓN
    FIGURA 6. REFRIGERANTE VARIABLE DE EE. UU. MERCADO DE SISTEMA DE FLUJO ANÁLISIS POR TECNOLOGÍA
    FIGURA 7. ANÁLISIS DEL MERCADO DE SISTEMA DE FLUJO DE REFRIGERANTE VARIABLE DE EE. UU. POR REGIONAL
    FIGURA 8. ANÁLISIS DEL MERCADO DE SISTEMA DE FLUJO DE REFRIGERANTE VARIABLE DE CANADÁ POR CAPACIDAD
    FIGURA 9. ANÁLISIS DEL MERCADO DE SISTEMA DE FLUJO DE REFRIGERANTE VARIABLE DE CANADÁ POR APLICACIÓN
    FIGURA 10. ANÁLISIS DEL MERCADO DE SISTEMA DE FLUJO DE REFRIGERANTE VARIABLE DE CANADÁ POR CONFIGURACIÓN
    FIGURA 11. ANÁLISIS DEL MERCADO DE SISTEMA DE FLUJO DE REFRIGERANTE VARIABLE DE CANADÁ POR TECNOLOGÍA
    FIGURA 12. ANÁLISIS DEL MERCADO DE SISTEMA DE FLUJO DE REFRIGERANTE VARIABLE DE CANADÁ POR REGIONAL
    FIGURA 13. VARIABLE EUROPA ANÁLISIS DEL MERCADO DE SISTEMA DE FLUJO DE REFRIGERANTE
    FIGURA 14. ANÁLISIS DEL MERCADO DE SISTEMA DE FLUJO DE REFRIGERANTE VARIABLE DE ALEMANIA POR CAPACIDAD
    FIGURA 15. ANÁLISIS DEL MERCADO DE SISTEMA DE FLUJO DE REFRIGERANTE VARIABLE DE ALEMANIA POR APLICACIÓN
    FIGURA 16. MERCADO DE SISTEMA DE FLUJO DE REFRIGERANTE VARIABLE DE ALEMANIA ANÁLISIS POR CONFIGURACIÓN
    FIGURA 17. ANÁLISIS DEL MERCADO DE SISTEMA DE FLUJO DE REFRIGERANTE VARIABLE DE ALEMANIA POR TECNOLOGÍA
    FIGURA 18. ANÁLISIS DEL MERCADO DE SISTEMA DE FLUJO DE REFRIGERANTE VARIABLE DE ALEMANIA POR REGIONAL
    FIGURA 19. ANÁLISIS DEL MERCADO DE SISTEMA DE FLUJO DE REFRIGERANTE VARIABLE DEL REINO UNIDO POR CAPACIDAD
    FIGURA 20. ANÁLISIS DEL MERCADO DE SISTEMA DE FLUJO DE REFRIGERANTE VARIABLE DEL REINO UNIDO POR APLICACIÓN
    FIGURA 21. ANÁLISIS DEL MERCADO DE SISTEMA DE FLUJO DE REFRIGERANTE VARIABLE DEL REINO UNIDO POR CONFIGURACIÓN
    FIGURA 22. ANÁLISIS DEL MERCADO DE SISTEMA DE FLUJO DE REFRIGERANTE VARIABLE DEL REINO UNIDO POR TECNOLOGÍA
    FIGURA 23. REINO UNIDO ANÁLISIS DEL MERCADO DE SISTEMA DE FLUJO DE REFRIGERANTE VARIABLE POR REGIONAL
    FIGURA 24. ANÁLISIS DEL MERCADO DE SISTEMA DE FLUJO DE REFRIGERANTE VARIABLE EN FRANCIA POR CAPACIDAD
    FIGURA 25. ANÁLISIS DEL MERCADO DE SISTEMA DE FLUJO DE REFRIGERANTE VARIABLE EN FRANCIA POR APLICACIÓN
    FIGURA 26. REFRIGERANTE VARIABLE DE FRANCIA SISTEMA DE FLUJO ANÁLISIS DEL MERCADO POR CONFIGURACIÓN
    FIGURA 27. FRANCIA ANÁLISIS DEL MERCADO DE SISTEMA DE FLUJO DE REFRIGERANTE VARIABLE POR TECNOLOGÍA
    FIGURA 28. ANÁLISIS DEL MERCADO DE FRANCIA SISTEMA DE FLUJO DE REFRIGERANTE VARIABLE POR REGIONAL
    FIGURA 29. ANÁLISIS DEL MERCADO DE RUSIA SISTEMA DE FLUJO DE REFRIGERANTE VARIABLE POR CAPACIDAD
    FIGURA 30. ANÁLISIS DEL MERCADO DE SISTEMA DE FLUJO DE REFRIGERANTE VARIABLE DE RUSIA POR APLICACIÓN
    FIGURA 31. ANÁLISIS DEL MERCADO DE SISTEMA DE FLUJO DE REFRIGERANTE VARIABLE DE RUSIA POR CONFIGURACIÓN
    FIGURA 32. ANÁLISIS DEL MERCADO DE SISTEMA DE FLUJO DE REFRIGERANTE VARIABLE DE RUSIA POR APLICACIÓN TECNOLOGÍA
    FIGURA 33. ANÁLISIS DEL MERCADO DE SISTEMA DE FLUJO DE REFRIGERANTE VARIABLE DE RUSIA POR REGIONAL
    FIGURA 34. ANÁLISIS DEL MERCADO DE SISTEMA DE FLUJO DE REFRIGERANTE VARIABLE DE ITALIA POR CAPACIDAD
    FIGURA 35. ANÁLISIS DEL MERCADO DE SISTEMA DE FLUJO DE REFRIGERANTE VARIABLE DE ITALIA POR APLICACIÓN < hermano />FIGURA 36. ANÁLISIS DEL MERCADO DE SISTEMA DE FLUJO DE REFRIGERANTE VARIABLE DE ITALIA POR CONFIGURACIÓN
    FIGURA 37. ANÁLISIS DEL MERCADO DE SISTEMA DE FLUJO DE REFRIGERANTE VARIABLE DE ITALIA POR TECNOLOGÍA
    FIGURA 38. ANÁLISIS DEL MERCADO DE SISTEMA DE FLUJO DE REFRIGERANTE VARIABLE DE ITALIA POR REGIONAL
    CIFRA 39. ANÁLISIS DEL MERCADO DE SISTEMA DE FLUJO DE REFRIGERANTE VARIABLE EN ESPAÑA POR CAPACIDAD
    FIGURA 40. ANÁLISIS DEL MERCADO DE SISTEMA DE FLUJO DE REFRIGERANTE VARIABLE EN ESPAÑA POR APLICACIÓN
    FIGURA 41. ANÁLISIS DEL MERCADO DE SISTEMA DE FLUJO DE REFRIGERANTE VARIABLE EN ESPAÑA POR CONFIGURACIÓN
    FIGURA 42. ESPAÑA VARIABLE ANÁLISIS DEL MERCADO DE SISTEMA DE FLUJO DE REFRIGERANTE POR TECNOLOGÍA
    FIGURA 43. ANÁLISIS DEL MERCADO DE SISTEMA DE FLUJO DE REFRIGERANTE EN ESPAÑA POR REGIONAL
    FIGURA 44. RESTO DE EUROPA ANÁLISIS DEL MERCADO DE SISTEMA DE FLUJO DE REFRIGERANTE POR CAPACIDAD
    FIGURA 45. RESTO DE REFRIGERANTE VARIABLE EUROPA ANÁLISIS DE MERCADO DE SISTEMA DE FLUJO POR APLICACIÓN
    FIGURA 46. RESTO DE EUROPA ANÁLISIS DE MERCADO DE SISTEMA DE FLUJO DE REFRIGERANTE VARIABLE POR CONFIGURACIÓN
    FIGURA 47. RESTO DE EUROPA ANÁLISIS DE MERCADO DE SISTEMA DE FLUJO DE REFRIGERANTE VARIABLE POR TECNOLOGÍA
    FIGURA 48. RESTO DE REFRIGERANTE VARIABLE DE EUROPA ANÁLISIS DEL MERCADO DE SISTEMAS DE FLUJO POR REGIONAL
    FIGURA 49. ANÁLISIS DEL MERCADO DE SISTEMA DE FLUJO DE REFRIGERANTE VARIABLE DE APAC
    FIGURA 50. ANÁLISIS DEL MERCADO DE SISTEMA DE FLUJO DE REFRIGERANTE VARIABLE DE CHINA POR CAPACIDAD
    FIGURA 51. ANÁLISIS DEL MERCADO DE SISTEMA DE FLUJO DE REFRIGERANTE VARIABLE DE CHINA POR CAPACIDAD POR APLICACIÓN
    FIGURA 52. ANÁLISIS DEL MERCADO DE SISTEMA DE FLUJO DE REFRIGERANTE VARIABLE DE CHINA POR CONFIGURACIÓN
    FIGURA 53. ANÁLISIS DEL MERCADO DE SISTEMA DE FLUJO DE REFRIGERANTE VARIABLE DE CHINA POR TECNOLOGÍA
    FIGURA 54. ANÁLISIS DEL MERCADO DE SISTEMA DE FLUJO DE REFRIGERANTE VARIABLE DE CHINA POR REGIONAL
    FIGURA 55. INDIA ANÁLISIS DEL MERCADO DE SISTEMA DE FLUJO DE REFRIGERANTE VARIABLE POR CAPACIDAD
    FIGURA 56. ANÁLISIS DEL MERCADO DE INDIA SISTEMA DE FLUJO DE REFRIGERANTE VARIABLE POR APLICACIÓN
    FIGURA 57. INDIA ANÁLISIS DEL MERCADO DE SISTEMA DE FLUJO DE REFRIGERANTE VARIABLE POR CONFIGURACIÓN
    FIGURA 58. INDIA VARIABLE REFRIGERANTE ANÁLISIS DEL MERCADO DE SISTEMA DE FLUJO POR TECNOLOGÍA
    FIGURA 59. ANÁLISIS DEL MERCADO DE SISTEMA DE FLUJO DE REFRIGERANTE VARIABLE DE LA INDIA POR REGIONAL
    FIGURA 60. ANÁLISIS DEL MERCADO DE SISTEMA DE FLUJO DE REFRIGERANTE VARIABLE DE JAPÓN POR CAPACIDAD
    FIGURA 61. SISTEMA DE FLUJO DE REFRIGERANTE VARIABLE DE JAPÓN ANÁLISIS DE MERCADO POR APLICACIÓN
    FIGURA 62. ANÁLISIS DEL MERCADO DE SISTEMA DE FLUJO DE REFRIGERANTE VARIABLE DE JAPÓN POR CONFIGURACIÓN
    FIGURA 63. ANÁLISIS DEL MERCADO DE SISTEMA DE FLUJO DE REFRIGERANTE VARIABLE DE JAPÓN POR TECNOLOGÍA
    FIGURA 64. ANÁLISIS DEL MERCADO DE SISTEMA DE FLUJO DE REFRIGERANTE VARIABLE DE JAPÓN POR REGIONAL < hermano />GRÁFICO 65. ANÁLISIS DEL MERCADO DE SISTEMA DE FLUJO DE REFRIGERANTE VARIABLE DE COREA DEL SUR POR CAPACIDAD
    GRÁFICO 66. ANÁLISIS DEL MERCADO DE SISTEMA DE FLUJO DE REFRIGERANTE VARIABLE DE COREA DEL SUR POR APLICACIÓN
    FIGURA 67. ANÁLISIS DEL MERCADO DE SISTEMA DE FLUJO DE REFRIGERANTE VARIABLE DE COREA DEL SUR POR CONFIGURACIÓN < hermano />GRÁFICO 68. ANÁLISIS DEL MERCADO DE SISTEMA DE FLUJO DE REFRIGERANTE VARIABLE DE COREA DEL SUR POR TECNOLOGÍA
    GRÁFICO 69. ANÁLISIS DEL MERCADO DE SISTEMA DE FLUJO DE REFRIGERANTE VARIABLE DE COREA DEL SUR POR REGIONAL
    GRÁFICO 70. ANÁLISIS DEL MERCADO DE SISTEMA DE FLUJO DE REFRIGERANTE VARIABLE DE MALASIA POR CAPACIDAD
    FIGURA 71. ANÁLISIS DEL MERCADO DE SISTEMA DE FLUJO DE REFRIGERANTE VARIABLE DE MALASIA POR APLICACIÓN
    FIGURA 72. ANÁLISIS DEL MERCADO DE SISTEMA DE FLUJO DE REFRIGERANTE VARIABLE DE MALASIA POR CONFIGURACIÓN
    FIGURA 73. ANÁLISIS DEL MERCADO DE SISTEMA DE FLUJO DE REFRIGERANTE VARIABLE DE MALASIA POR TECNOLOGÍA
    FIGURA 74. ANÁLISIS DEL MERCADO DE SISTEMA DE FLUJO DE REFRIGERANTE VARIABLE DE MALASIA POR REGIONAL
    FIGURA 75. ANÁLISIS DEL MERCADO DE SISTEMA DE FLUJO DE REFRIGERANTE VARIABLE DE TAILANDIA POR CAPACIDAD
    FIGURA 76. ANÁLISIS DEL MERCADO DE SISTEMA DE FLUJO DE REFRIGERANTE VARIABLE DE TAILANDIA POR APLICACIÓN
    FIGURA 77. ANÁLISIS DEL MERCADO DE SISTEMA DE FLUJO DE REFRIGERANTE VARIABLE DE TAILANDIA POR CONFIGURACIÓN
    FIGURA 78. ANÁLISIS DEL MERCADO DE SISTEMA DE FLUJO DE REFRIGERANTE VARIABLE DE TAILANDIA POR TECNOLOGÍA
    FIGURA 79. ANÁLISIS DEL MERCADO DE SISTEMA DE FLUJO DE REFRIGERANTE VARIABLE DE TAILANDIA POR REGIONAL
    FIGURA 80. INDONESIA ANÁLISIS DEL MERCADO DE SISTEMA DE FLUJO DE REFRIGERANTE VARIABLE POR CAPACIDAD
    FIGURA 81. ANÁLISIS DEL MERCADO DE SISTEMA DE FLUJO DE REFRIGERANTE VARIABLE DE INDONESIA POR APLICACIÓN
    FIGURA 82. ANÁLISIS DEL MERCADO DE SISTEMA DE FLUJO DE REFRIGERANTE VARIABLE DE INDONESIA POR CONFIGURACIÓN
    FIGURA 83. VARIABLE DE INDONESIA ANÁLISIS DEL MERCADO DE SISTEMA DE FLUJO DE REFRIGERANTE POR TECNOLOGÍA
    FIGURA 84. ANÁLISIS DEL MERCADO DE SISTEMA DE FLUJO DE REFRIGERANTE VARIABLE DE INDONESIA POR REGIONAL
    FIGURA 85. RESTO DE APAC ANÁLISIS DEL MERCADO DE SISTEMA DE FLUJO DE REFRIGERANTE VARIABLE POR CAPACIDAD
    FIGURA 86. RESTO DE VARIABLE APAC ANÁLISIS DEL MERCADO DE SISTEMA DE FLUJO DE REFRIGERANTE POR APLICACIÓN
    FIGURA 87. ANÁLISIS DEL MERCADO DEL RESTO DE SISTEMA DE FLUJO DE REFRIGERANTE VARIABLE DE APAC POR CONFIGURACIÓN
    FIGURA 88. ANÁLISIS DEL MERCADO DEL RESTO DE SISTEMA DE FLUJO DE REFRIGERANTE VARIABLE DE APAC POR TECNOLOGÍA
    FIGURA 89. RESTO DE VARIABLE APAC ANÁLISIS DEL MERCADO DE SISTEMA DE FLUJO DE REFRIGERANTE POR REGIONAL
    FIGURA 90. ANÁLISIS DEL MERCADO DE SISTEMA DE FLUJO DE REFRIGERANTE DE AMÉRICA DEL SUR
    FIGURA 91. ANÁLISIS DEL MERCADO DE SISTEMA DE FLUJO DE REFRIGERANTE DE BRASIL POR CAPACIDAD
    FIGURA 92. SISTEMA DE FLUJO DE REFRIGERANTE DE BRASIL MERCADO ANÁLISIS POR APLICACIÓN
    FIGURA 93. ANÁLISIS DEL MERCADO DE SISTEMA DE FLUJO DE REFRIGERANTE VARIABLE DE BRASIL POR CONFIGURACIÓN
    FIGURA 94. ANÁLISIS DEL MERCADO DE SISTEMA DE FLUJO DE REFRIGERANTE VARIABLE DE BRASIL POR TECNOLOGÍA
    FIGURA 95. ANÁLISIS DEL MERCADO DE SISTEMA DE FLUJO DE REFRIGERANTE VARIABLE DE BRASIL POR TECNOLOGÍA REGIONAL
    FIGURA 96. ANÁLISIS DEL MERCADO DE SISTEMA DE FLUJO DE REFRIGERANTE VARIABLE DE MÉXICO POR CAPACIDAD
    FIGURA 97. ANÁLISIS DEL MERCADO DE SISTEMA DE FLUJO DE REFRIGERANTE VARIABLE DE MÉXICO POR APLICACIÓN
    FIGURA 98. ANÁLISIS DEL MERCADO DE SISTEMA DE FLUJO DE REFRIGERANTE VARIABLE DE MÉXICO POR CONFIGURACIÓN < hermano />FIGURA 99. ANÁLISIS DEL MERCADO DE SISTEMA DE FLUJO DE REFRIGERANTE VARIABLE EN MÉXICO POR TECNOLOGÍA
    FIGURA 100. ANÁLISIS DEL MERCADO DE SISTEMA DE FLUJO DE REFRIGERANTE VARIABLE EN MÉXICO POR REGIONAL
    FIGURA 101. ANÁLISIS DEL MERCADO DE SISTEMA DE FLUJO DE REFRIGERANTE VARIABLE EN ARGENTINA POR CAPACIDAD
    CIFRA 102. ANÁLISIS DEL MERCADO DE SISTEMA DE FLUJO DE REFRIGERANTE VARIABLE DE ARGENTINA POR APLICACIÓN
    FIGURA 103. ANÁLISIS DEL MERCADO DE SISTEMA DE FLUJO DE REFRIGERANTE VARIABLE DE ARGENTINA POR CONFIGURACIÓN
    FIGURA 104. ANÁLISIS DEL MERCADO DE SISTEMA DE FLUJO DE REFRIGERANTE VARIABLE DE ARGENTINA POR TECNOLOGÍA
    FIGURA 105. ANÁLISIS DEL MERCADO DE SISTEMA DE FLUJO DE REFRIGERANTE VARIABLE DE ARGENTINA POR REGIONAL
    FIGURA 106. ANÁLISIS DEL MERCADO DE SISTEMA DE FLUJO DE REFRIGERANTE VARIABLE DEL RESTO DE AMÉRICA DEL SUR POR CAPACIDAD
    FIGURA 107. ANÁLISIS DEL MERCADO DE SISTEMA DE FLUJO DE REFRIGERANTE VARIABLE DEL RESTO DE AMÉRICA DEL SUR POR APLICACIÓN
    FIGURA 108. ANÁLISIS DEL MERCADO DEL SISTEMA DE FLUJO DE REFRIGERANTE VARIABLE DEL RESTO DE AMÉRICA DEL SUR POR CONFIGURACIÓN
    FIGURA 109. MARCA DEL SISTEMA DE FLUJO DE REFRIGERANTE VARIABLE DEL RESTO DE AMÉRICA DEL SURANÁLISIS DE ET POR TECNOLOGÍA
    FIGURA 110. RESTO DE AMÉRICA DEL SUR ANÁLISIS DEL MERCADO DE SISTEMA DE FLUJO DE REFRIGERANTE VARIABLE POR REGIONAL
    FIGURA 111. ANÁLISIS DEL MERCADO DE SISTEMA DE FLUJO DE REFRIGERANTE VARIABLE DE MEA
    FIGURA 112. SISTEMA DE FLUJO DE REFRIGERANTE VARIABLE DE LOS PAÍSES DEL CCG ANÁLISIS DE MERCADO POR CAPACIDAD
    FIGURA 113. SISTEMA DE FLUJO DE REFRIGERANTE VARIABLE DE LOS PAÍSES DEL CCG ANÁLISIS DE MERCADO POR APLICACIÓN
    FIGURA 114. SISTEMA DE FLUJO DE REFRIGERANTE VARIABLE DE LOS PAÍSES DEL CCG ANÁLISIS DE MERCADO POR CONFIGURACIÓN
    FIGURA 115. FLUJO DE REFRIGERANTE VARIABLE DE LOS PAÍSES DEL CCG ANÁLISIS DEL MERCADO DE SISTEMA POR TECNOLOGÍA
    FIGURA 116. PAÍSES DEL CCG ANÁLISIS DEL MERCADO DE SISTEMA DE FLUJO DE REFRIGERANTE VARIABLE POR REGIONAL
    FIGURA 117. ANÁLISIS DEL MERCADO DE SISTEMA DE FLUJO DE REFRIGERANTE VARIABLE DE SUDÁFRICA POR CAPACIDAD
    FIGURA 118. REFRIGERANTE VARIABLE DE SUDÁFRICA ANÁLISIS DEL MERCADO DE SISTEMA DE FLUJO POR APLICACIÓN
    FIGURA 119. ANÁLISIS DEL MERCADO DE SISTEMA DE FLUJO DE REFRIGERANTE VARIABLE DE SUDÁFRICA POR CONFIGURACIÓN
    FIGURA 120. ANÁLISIS DEL MERCADO DE SISTEMA DE FLUJO DE REFRIGERANTE VARIABLE DE SUDÁFRICA POR TECNOLOGÍA
    FIGURA 121. VARIABLE DE SUDÁFRICA ANÁLISIS DE MERCADO DE SISTEMA DE FLUJO DE REFRIGERANTE POR REGIONAL
    FIGURA 122. RESTO DE MEA ANÁLISIS DE MERCADO DE SISTEMA DE FLUJO DE REFRIGERANTE VARIABLE POR CAPACIDAD
    FIGURA 123. ANÁLISIS DE MERCADO DE RESTO DE SISTEMA DE FLUJO DE REFRIGERANTE VARIABLE DE MEA POR APLICACIÓN
    FIGURA 124. RESTO DE VARIABLE MEA ANÁLISIS DE MERCADO DE SISTEMA DE FLUJO DE REFRIGERANTE POR CONFIGURACIÓN
    FIGURA 125. RESTO DE MEA ANÁLISIS DE MERCADO DE SISTEMA DE FLUJO DE REFRIGERANTE VARIABLE POR TECNOLOGÍA
    FIGURA 126. RESTO DE MEA ANÁLISIS DE MERCADO DE SISTEMA DE FLUJO DE REFRIGERANTE VARIABLE POR REGIONAL
    FIGURA 127. COMPRA DE LLAVES CRITERIOS DEL MERCADO DE SISTEMA DE FLUJO DE REFRIGERANTE VARIABLE
    FIGURA 128. PROCESO DE INVESTIGACIÓN DE MRFR
    FIGURA 129. ANÁLISIS DRO DEL MERCADO DE SISTEMA DE FLUJO DE REFRIGERANTE VARIABLE
    FIGURA 130. ANÁLISIS DE IMPACTO DE LOS IMPULSORES: MERCADO DE SISTEMA DE FLUJO DE REFRIGERANTE VARIABLE
    br />FIGURA 131. ANÁLISIS DE IMPACTO DE LAS RESTRICCIONES: MERCADO DE SISTEMA DE FLUJO DE REFRIGERANTE VARIABLE
    FIGURA 132. CADENA DE SUMINISTRO / VALOR: MERCADO DE SISTEMA DE FLUJO DE REFRIGERANTE VARIABLE
    FIGURA 133. MERCADO DE SISTEMA DE FLUJO DE REFRIGERANTE VARIABLE, POR CAPACIDAD, 2024 (% DE PARTICIPACIÓN) < br />FIGURA 134. MERCADO DE SISTEMA DE FLUJO DE REFRIGERANTE VARIABLE, POR CAPACIDAD, 2019 A 2032 (Miles de millones de USD)
    FIGURA 135. MERCADO DE SISTEMA DE FLUJO DE REFRIGERANTE VARIABLE, POR APLICACIÓN, 2024 (% DE PARTICIPACIÓN)
    FIGURA 136. SISTEMA DE FLUJO DE REFRIGERANTE VARIABLE MERCADO, POR APLICACIÓN, 2019 A 2032 (Miles de millones de USD)
    FIGURA 137. MERCADO DE SISTEMA DE FLUJO DE REFRIGERANTE VARIABLE, POR CONFIGURACIÓN, 2024 (% DE PARTICIPACIÓN)
    FIGURA 138. MERCADO DE SISTEMAS DE FLUJO DE REFRIGERANTE VARIABLE, POR CONFIGURACIÓN, 2019 A 2032 (Miles de millones de USD) )
    FIGURA 139. MERCADO DE SISTEMA DE FLUJO DE REFRIGERANTE VARIABLE, POR TECNOLOGÍA, 2024 (% DE PARTICIPACIÓN)
    FIGURA 140. MERCADO DE SISTEMA DE FLUJO DE REFRIGERANTE VARIABLE, POR TECNOLOGÍA, 2019 A 2032 (Miles de millones de USD)
    FIGURA 141. SISTEMA DE FLUJO DE REFRIGERANTE VARIABLE MERCADO, POR REGIONAL, 2024 (% DE PARTICIPACIÓN)
    FIGURA 142. MERCADO DE SISTEMA DE FLUJO DE REFRIGERANTE VARIABLE, POR REGIONAL, 2019 A 2032 (Miles de millones de USD)
    FIGURA 143. EVALUACIÓN COMPARABLE DE LOS PRINCIPALES COMPETIDORES

    Segmentación del mercado de sistemas de flujo de refrigerante variable


    • Mercado de sistemas de flujo de refrigerante variable por capacidad (miles de millones de dólares, 2019-2032)
      • Por debajo de 18.000 BTU/h
      • 18.000 - 24.000 BTU/h
      • Más de 24.000 BTU/h


    • Mercado de sistemas de flujo de refrigerante variable por aplicación (miles de millones de dólares, 2019-2032)
      • Residencial
      • Comercial
      • Industrial


    • Mercado de sistemas de flujo de refrigerante variable por configuración (miles de millones de dólares, 2019-2032)
      • Zona única
      • Multizona


    • Mercado de sistemas de flujo de refrigerante variable por tecnología (miles de millones de dólares, 2019-2032)
      • Bomba de calor
      • Solo refrigeración


    • Mercado de sistemas de flujo de refrigerante variable por región (miles de millones de dólares, 2019-2032)
      • América del Norte
      • Europa
      • América del Sur
      • Asia Pacífico
      • Medio Oriente y África


    Perspectiva regional del mercado del sistema de flujo de refrigerante variable (miles de millones de dólares, 2019-2032)


    • Perspectivas de América del Norte (miles de millones de dólares, 2019-2032)
      • Mercado de sistemas de flujo de refrigerante variable de América del Norte por tipo de capacidad
        • Por debajo de 18.000 BTU/h
        • 18.000 - 24.000 BTU/h
        • Más de 24.000 BTU/h
      • Mercado de sistemas de flujo de refrigerante variable de América del Norte por tipo de aplicación
        • Residencial
        • Comercial
        • Industrial
      • Mercado de sistemas de flujo de refrigerante variable de América del Norte por tipo de configuración
        • Zona única
        • Multizona
      • Mercado de sistemas de flujo de refrigerante variable de América del Norte por tipo de tecnología
        • Bomba de calor
        • Solo refrigeración
      • Mercado de sistemas de flujo de refrigerante variable de América del Norte por tipo regional
        • EE.UU.
        • Canadá
      • Perspectivas de EE. UU. (miles de millones de dólares, 2019-2032)
      • Mercado de sistemas de flujo de refrigerante variable de EE. UU. por tipo de capacidad
        • Por debajo de 18.000 BTU/h
        • 18.000 - 24.000 BTU/h
        • Más de 24.000 BTU/h
      • Mercado de sistemas de flujo de refrigerante variable de EE. UU. por tipo de aplicación
        • Residencial
        • Comercial
        • Industrial
      • Mercado de sistemas de flujo de refrigerante variable de EE. UU. por tipo de configuración
        • Zona única
        • Multizona
      • Mercado de sistemas de flujo de refrigerante variable de EE. UU. por tipo de tecnología
        • Bomba de calor
        • Solo refrigeración
      • Perspectivas de CANADÁ (miles de millones de dólares, 2019-2032)
      • Mercado de sistemas de flujo de refrigerante variable de CANADÁ por tipo de capacidad
        • Por debajo de 18.000 BTU/h
        • 18.000 - 24.000 BTU/h
        • Más de 24.000 BTU/h
      • Mercado de sistemas de flujo de refrigerante variable de CANADÁ por tipo de aplicación
        • Residencial
        • Comercial
        • Industrial
      • Mercado de sistemas de flujo de refrigerante variable de CANADÁ por tipo de configuración
        • Zona única
        • Multizona
      • Mercado de sistemas de flujo de refrigerante variable de CANADÁ por tipo de tecnología
        • Bomba de calor
        • Solo refrigeración
      • Perspectivas de Europa (miles de millones de dólares, 2019-2032)
        • Mercado europeo de sistemas de flujo de refrigerante variable por tipo de capacidad
          • Por debajo de 18.000 BTU/h
          • 18.000 - 24.000 BTU/h
          • Más de 24.000 BTU/h
        • Mercado europeo de sistemas de flujo de refrigerante variable por tipo de aplicación
          • Residencial
          • Comercial
          • Industrial
        • Mercado europeo de sistemas de flujo de refrigerante variable por tipo de configuración
          • Zona única
          • Multizona
        • Mercado europeo de sistemas de flujo de refrigerante variable por tipo de tecnología
          • Bomba de calor
          • Solo refrigeración
        • Mercado europeo de sistemas de flujo de refrigerante variable por tipo regional
          • Alemania
          • Reino Unido
          • Francia
          • Rusia
          • Italia
          • España
          • Resto de Europa
        • Perspectivas de ALEMANIA (miles de millones de dólares, 2019-2032)
        • Mercado de sistemas de flujo de refrigerante variable de ALEMANIA por tipo de capacidad
          • Por debajo de 18.000 BTU/h
          • 18.000 - 24.000 BTU/h
          • Más de 24.000 BTU/h
        • Mercado de sistemas de flujo de refrigerante variable de ALEMANIA por tipo de aplicación
          • Residencial
          • Comercial
          • Industrial
        • Mercado de sistemas de flujo de refrigerante variable de ALEMANIA por tipo de configuración
          • Zona única
          • Multizona
        • Mercado de sistemas de flujo de refrigerante variable en ALEMANIA por tipo de tecnología
          • Bomba de calor
          • Solo refrigeración
        • Perspectivas del Reino Unido (miles de millones de dólares, 2019-2032)
        • Mercado de sistemas de flujo de refrigerante variable del Reino Unido por tipo de capacidad
          • Por debajo de 18.000 BTU/h
          • 18.000 - 24.000 BTU/h
          • Más de 24.000 BTU/h
        • Mercado del Reino Unido de sistemas de flujo de refrigerante variable por tipo de aplicación
          • Residencial
          • Comercial
          • Industrial
        • Mercado del Reino Unido de sistemas de flujo de refrigerante variable por tipo de configuración
          • Zona única
          • Multizona
        • Mercado de sistemas de flujo de refrigerante variable del Reino Unido por tipo de tecnología
          • Bomba de calor
          • Solo refrigeración
        • Perspectivas de FRANCIA (miles de millones de dólares, 2019-2032)
        • Mercado de sistemas de flujo de refrigerante variable de FRANCIA por tipo de capacidad
          • Por debajo de 18.000 BTU/h
          • 18.000 - 24.000 BTU/h
          • Más de 24.000 BTU/h
        • Mercado de sistemas de flujo de refrigerante variable de FRANCIA por tipo de aplicación
          • Residencial
          • Comercial
          • Industrial
        • Mercado de sistemas de flujo de refrigerante variable de FRANCIA por tipo de configuración
          • Zona única
          • Multizona
        • Mercado de sistemas de flujo de refrigerante variable de FRANCIA por tipo de tecnología
          • Bomba de calor
          • Solo refrigeración
        • Perspectivas de RUSIA (miles de millones de dólares, 2019-2032)
        • Mercado de sistemas de flujo de refrigerante variable de RUSIA por tipo de capacidad
          • Por debajo de 18.000 BTU/h
          • 18.000 - 24.000 BTU/h
          • Más de 24.000 BTU/h
        • Mercado de sistemas de flujo de refrigerante variable de RUSIA por tipo de aplicación
          • Residencial
          • Comercial
          • Industrial
        • Mercado de sistemas de flujo de refrigerante variable de RUSIA por tipo de configuración
          • Zona única
          • Multizona
        • Mercado de sistemas de flujo de refrigerante variable de RUSIA por tipo de tecnología
          • Bomba de calor
          • Solo refrigeración
        • Perspectivas de ITALIA (miles de millones de dólares, 2019-2032)
        • Mercado de sistemas de flujo de refrigerante variable de ITALIA por tipo de capacidad
          • Por debajo de 18.000 BTU/h
          • 18.000 - 24.000 BTU/h
          • Más de 24.000 BTU/h
        • Mercado de sistemas de flujo de refrigerante variable de ITALIA por tipo de aplicación
          • Residencial
          • Comercial
          • Industrial
        • Mercado de sistemas de flujo de refrigerante variable de ITALIA por tipo de configuración
          • Zona única
          • Multizona
        • Mercado de sistemas de flujo de refrigerante variable de ITALIA por tipo de tecnología
          • Bomba de calor
          • Solo refrigeración
        • Perspectivas de ESPAÑA (miles de millones de dólares, 2019-2032)
        • Mercado de sistemas de flujo de refrigerante variable en ESPAÑA por tipo de capacidad
          • Por debajo de 18.000 BTU/h
          • 18.000 - 24.000 BTU/h
          • Más de 24.000 BTU/h
        • Mercado de sistemas de flujo de refrigerante variable en ESPAÑA por tipo de aplicación
          • Residencial
          • Comercial
          • Industrial
        • Mercado de sistemas de flujo de refrigerante variable en ESPAÑA por tipo de configuración
          • Zona única
          • Multizona
        • Mercado de sistemas de flujo de refrigerante variable en ESPAÑA por tipo de tecnología
          • Bomba de calor
          • Solo refrigeración
        • Perspectivas DEL RESTO DE EUROPA (Miles de millones de dólares, 2019-2032)
        • RESTO DE EUROPA Mercado de sistemas de flujo de refrigerante variable por tipo de capacidad
          • Por debajo de 18.000 BTU/h
          • 18.000 - 24.000 BTU/h
          • Más de 24.000 BTU/h
        • RESTO DE EUROPA Mercado de sistemas de flujo de refrigerante variable por tipo de aplicación
          • Residencial
          • Comercial
          • Industrial
        • RESTO DE EUROPA Mercado de sistemas de flujo de refrigerante variable por tipo de configuración
          • Zona única
          • Multizona
        • RESTO DE EUROPA Mercado de sistemas de flujo de refrigerante variable por tipo de tecnología
          • Bomba de calor
          • Solo refrigeración
        • Perspectivas de Asia Pacífico (miles de millones de dólares, 2019-2032)
          • Mercado de sistemas de flujo de refrigerante variable de APAC por tipo de capacidad
            • Por debajo de 18.000 BTU/h
            • 18.000 - 24.000 BTU/h
            • Más de 24.000 BTU/h
          • Mercado de sistemas de flujo de refrigerante variable de APAC por tipo de aplicación
            • Residencial
            • Comercial
            • Industrial
          • Mercado de sistemas de flujo de refrigerante variable de APAC por tipo de configuración
            • Zona única
            • Multizona
          • Mercado de sistemas de flujo de refrigerante variable de APAC por tipo de tecnología
            • Bomba de calor
            • Solo refrigeración
          • Mercado de sistemas de flujo de refrigerante variable de APAC por tipo regional
            • China
            • India
            • Japón
            • Corea del Sur
            • Malasia
            • Tailandia
            • Indonesia
            • Resto de APAC
          • Perspectivas de CHINA (miles de millones de dólares, 2019-2032)
          • Mercado de sistemas de flujo de refrigerante variable de CHINA por tipo de capacidad
            • Por debajo de 18.000 BTU/h
            • 18.000 - 24.000 BTU/h
            • Más de 24.000 BTU/h
          • Mercado de sistemas de flujo de refrigerante variable de CHINA por tipo de aplicación
            • Residencial
            • Comercial
            • Industrial
          • Mercado de sistemas de flujo de refrigerante variable de CHINA por tipo de configuración
            • Zona única
            • Multizona
          • Mercado de sistemas de flujo de refrigerante variable de CHINA por tipo de tecnología
            • Bomba de calor
            • Solo refrigeración
          • Perspectivas de la INDIA (miles de millones de dólares, 2019-2032)
          • Mercado de sistemas de flujo de refrigerante variable de INDIA por tipo de capacidad
            • Por debajo de 18.000 BTU/h
            • 18.000 - 24.000 BTU/h
            • Más de 24.000 BTU/h
          • Mercado de sistemas de flujo de refrigerante variable de INDIA por tipo de aplicación
            • Residencial
            • Comercial
            • Industrial
          • Mercado de sistemas de flujo de refrigerante variable de INDIA por tipo de configuración
            • Zona única
            • Multizona
          • Mercado de sistemas de flujo de refrigerante variable de INDIA por tipo de tecnología
            • Bomba de calor
            • Solo refrigeración
          • Perspectivas de JAPÓN (miles de millones de dólares, 2019-2032)
          • Mercado de sistemas de flujo de refrigerante variable en Japón por tipo de capacidad
            • Por debajo de 18.000 BTU/h
            • 18.000 - 24.000 BTU/h
            • Más de 24.000 BTU/h
          • Mercado de sistemas de flujo de refrigerante variable en Japón por tipo de aplicación
            • Residencial
            • Comercial
            • Industrial
          • Mercado de sistemas de flujo de refrigerante variable de Japón por tipo de configuración
            • Zona única
            • Multizona
          • Mercado de sistemas de flujo de refrigerante variable en Japón por tipo de tecnología
            • Bomba de calor
            • Solo refrigeración
          • Perspectivas de COREA DEL SUR (miles de millones de dólares, 2019-2032)
          • Mercado de sistemas de flujo de refrigerante variable de COREA DEL SUR por tipo de capacidad
            • Por debajo de 18.000 BTU/h
            • 18.000 - 24.000 BTU/h
            • Más de 24.000 BTU/h
          • SMercado de sistemas de flujo de refrigerante variable de COREA DEL SUR por tipo de aplicación
            • Residencial
            • Comercial
            • Industrial
          • Mercado de sistemas de flujo de refrigerante variable de COREA DEL SUR por tipo de configuración
            • Zona única
            • Multizona
          • Mercado de sistemas de flujo de refrigerante variable de COREA DEL SUR por tipo de tecnología
            • Bomba de calor
            • Solo refrigeración
          • Perspectivas de MALASIA (miles de millones de dólares, 2019-2032)
          • Mercado de sistemas de flujo de refrigerante variable de MALASIA por tipo de capacidad
            • Por debajo de 18.000 BTU/h
            • 18.000 - 24.000 BTU/h
            • Más de 24.000 BTU/h
          • Mercado de sistemas de flujo de refrigerante variable de MALASIA por tipo de aplicación
            • Residencial
            • Comercial
            • Industrial
          • Mercado de sistemas de flujo de refrigerante variable de MALASIA por tipo de configuración
            • Zona única
            • Multizona
          • Mercado de sistemas de flujo de refrigerante variable de MALASIA por tipo de tecnología
            • Bomba de calor
            • Solo refrigeración
          • Perspectivas de TAILANDIA (miles de millones de dólares, 2019-2032)
          • Mercado de Sistemas de flujo de refrigerante variable de TAILANDIA por tipo de capacidad
            • Por debajo de 18.000 BTU/h
            • 18.000 - 24.000 BTU/h
            • Más de 24.000 BTU/h
          • Mercado de Sistemas de flujo de refrigerante variable de TAILANDIA por tipo de aplicación
            • Residencial
            • Comercial
            • Industrial
          • Mercado de TAILANDIA Sistema de flujo de refrigerante variable por tipo de configuración
            • Zona única
            • Multizona
          • Mercado de sistemas de flujo de refrigerante variable de TAILANDIA por tipo de tecnología
            • Bomba de calor
            • Solo refrigeración
          • Perspectivas de INDONESIA (miles de millones de dólares, 2019-2032)
          • Mercado de sistemas de flujo de refrigerante variable de INDONESIA por tipo de capacidad
            • Por debajo de 18.000 BTU/h
            • 18.000 - 24.000 BTU/h
            • Más de 24.000 BTU/h
          • Mercado de sistemas de flujo de refrigerante variable de INDONESIA por tipo de aplicación
            • Residencial
            • Comercial
            • Industrial
          • Mercado de sistemas de flujo de refrigerante variable de INDONESIA por tipo de configuración
            • Zona única
            • Multizona
          • Mercado de sistemas de flujo de refrigerante variable de INDONESIA por tipo de tecnología
            • Bomba de calor
            • Solo refrigeración
          • Perspectivas del RESTO DE APAC (miles de millones de dólares, 2019-2032)
          • RESTO DEL Mercado de sistemas de flujo de refrigerante variable de APAC por tipo de capacidad
            • Por debajo de 18.000 BTU/h
            • 18.000 - 24.000 BTU/h
            • Más de 24.000 BTU/h
          • RESTO DEL Mercado de sistemas de flujo de refrigerante variable de APAC por tipo de aplicación
            • Residencial
            • Comercial
            • Industrial
          • RESTO DEL Mercado de sistemas de flujo de refrigerante variable de APAC por tipo de configuración
            • Zona única
            • Multizona
          • RESTO DEL Mercado de sistemas de flujo de refrigerante variable de APAC por tipo de tecnología
            • Bomba de calor
            • Solo refrigeración
          • Perspectivas de América del Sur (miles de millones de dólares, 2019-2032)
            • Mercado de sistemas de flujo de refrigerante variable en América del Sur por tipo de capacidad
              • Por debajo de 18.000 BTU/h
              • 18.000 - 24.000 BTU/h
              • Más de 24.000 BTU/h
            • Mercado de Sistemas de flujo de refrigerante variable en América del Sur por tipo de aplicación
              • Residencial
              • Comercial
              • Industrial
            • Mercado de sistemas de flujo de refrigerante variable de América del Sur por tipo de configuración
              • Zona única
              • Multizona
            • Mercado de sistemas de flujo de refrigerante variable en América del Sur por tipo de tecnología
              • Bomba de calor
              • Solo refrigeración
            • Mercado de sistemas de flujo de refrigerante variable de América del Sur por tipo regional
              • Brasil
              • México
              • Argentina
              • Resto de Sudamérica
            • Perspectivas de BRASIL (miles de millones de dólares, 2019-2032)
            • Mercado de sistemas de flujo de refrigerante variable de BRASIL por tipo de capacidad
              • Por debajo de 18.000 BTU/h
              • 18.000 - 24.000 BTU/h
              • Más de 24.000 BTU/h
            • Mercado de sistemas de flujo de refrigerante variable de BRASIL por tipo de aplicación
              • Residencial
              • Comercial
              • Industrial
            • Mercado de sistemas de flujo de refrigerante variable de BRASIL por tipo de configuración
              • Zona única
              • Multizona
            • Mercado de sistemas de flujo de refrigerante variable en BRASIL por tipo de tecnología
              • Bomba de calor
              • Solo refrigeración
            • Perspectivas de MÉXICO (Miles de millones de dólares, 2019-2032)
            • Mercado de sistemas de flujo de refrigerante variable en MÉXICO por tipo de capacidad
              • Por debajo de 18.000 BTU/h
              • 18.000 - 24.000 BTU/h
              • Más de 24.000 BTU/h
            • Mercado de sistemas de flujo de refrigerante variable en MÉXICO por tipo de aplicación
              • Residencial
              • Comercial
              • Industrial
            • Mercado de sistemas de flujo de refrigerante variable en MÉXICO por tipo de configuración
              • Zona única
              • Multizona
            • Mercado de sistemas de flujo de refrigerante variable en MÉXICO por tipo de tecnología
              • Bomba de calor
              • Solo refrigeración
            • Perspectivas de ARGENTINA (miles de millones de dólares, 2019-2032)
            • Mercado de sistemas de flujo de refrigerante variable en ARGENTINA por tipo de capacidad
              • Por debajo de 18.000 BTU/h
              • 18.000 - 24.000 BTU/h
              • Más de 24.000 BTU/h
            • Mercado de sistemas de flujo de refrigerante variable en ARGENTINA por tipo de aplicación
              • Residencial
              • Comercial
              • Industrial
            • Mercado de sistemas de flujo de refrigerante variable en ARGENTINA por tipo de configuración
              • Zona única
              • Multizona
            • Mercado de sistemas de flujo de refrigerante variable en ARGENTINA por tipo de tecnología
              • Bomba de calor
              • Solo refrigeración
            • Perspectivas DEL RESTO DE AMÉRICA DEL SUR (Miles de millones de dólares, 2019-2032)
            • RESTO DE AMÉRICA DEL SUR Mercado de sistemas de flujo de refrigerante variable por tipo de capacidad
              • Por debajo de 18.000 BTU/h
              • 18.000 - 24.000 BTU/h
              • Más de 24.000 BTU/h
            • RESTO DE AMÉRICA DEL SUR Mercado de sistemas de flujo de refrigerante variable por tipo de aplicación
              • Residencial
              • Comercial
              • Industrial
            • RESTO DE AMÉRICA DEL SUR Mercado de sistemas de flujo de refrigerante variable por tipo de configuración
              • Zona única
              • Multizona
            • RESTO DE AMÉRICA DEL SUR Mercado de sistemas de flujo de refrigerante variable por tipo de tecnología
              • Bomba de calor
              • Solo refrigeración
            • Perspectivas de los MEA (miles de millones de dólares, 2019-2032)
              • Mercado de sistemas de flujo de refrigerante variable MEA por tipo de capacidad
                • Por debajo de 18.000 BTU/h
                • 18.000 - 24.000 BTU/h
                • Más de 24.000 BTU/h
              • Mercado de sistemas de flujo de refrigerante variable MEA por tipo de aplicación
                • Residencial
                • Comercial
                • Industrial
              • Mercado de sistemas de flujo de refrigerante variable MEA por tipo de configuración
                • Zona única
                • Multizona
              • Mercado de sistemas de flujo de refrigerante variable MEA por tipo de tecnología
                • Bomba de calor
                • Solo refrigeración
              • Mercado de sistemas de flujo de refrigerante variable MEA por tipo regional
                • Países del CCG
                • Sudáfrica
                • Resto de MEA
              • Perspectivas de los PAÍSES del CCG (miles de millones de dólares, 2019-2032)
              • Mercado de sistemas de flujo de refrigerante variable de los países del CCG por tipo de capacidad
                • Por debajo de 18.000 BTU/h
                • 18.000 - 24.000 BTU/h
                • Más de 24.000 BTU/h
              • Mercado de sistemas de flujo de refrigerante variable de los países del CCG por tipo de aplicación
                • Residencial
                • Comercial
                • Industrial
              • Países del CCG Mercado de sistemas de flujo de refrigerante variable por tipo de configuración
                • Zona única
                • Multizona
              • Países del CCG Mercado de sistemas de flujo de refrigerante variable por tipo de tecnología
                • Bomba de calor
                • Solo refrigeración
              • Perspectivas de SUDÁFRICA (miles de millones de dólares, 2019-2032)
              • Mercado de sistemas de flujo de refrigerante variable de SUDÁFRICA por tipo de capacidad
                • Por debajo de 18.000 BTU/h
                • 18.000 - 24.000 BTU/h
                • Más de 24.000 BTU/h
              • Mercado de Sistemas de flujo de refrigerante variable de SUDÁFRICA por tipo de aplicación
                • Residencial
                • Comercial
                • Industrial
              • Mercado de sistemas de flujo de refrigerante variable de SUDÁFRICA por tipo de configuración
                • Zona única
                • Multizona
              • Mercado de sistemas de flujo de refrigerante variable de SUDÁFRICA por tipo de tecnología
                • Bomba de calor
                • Solo refrigeración
              • Perspectivas del RESTO DE MEA (miles de millones de dólares, 2019-2032)
              • RESTO DEL Mercado de sistemas de flujo de refrigerante variable de MEA por tipo de capacidad
                • Por debajo de 18.000 BTU/h
                • 18.000 - 24.000 BTU/h
                • Más de 24.000 BTU/h
              • RESTO DEL Mercado de sistemas de flujo de refrigerante variable de MEA por tipo de aplicación
                • Residencial
                • Comercial
                • Industrial
              • RESTO DEL Mercado de sistemas de flujo de refrigerante variable de MEA por tipo de configuración
                • Zona única
                • Multizona
              • RESTO DE MEA Mercado de sistemas de flujo de refrigerante variable por tipo de tecnología
                • Bomba de calor
                • Solo refrigeración
    Report Infographic
    Free Sample Request

    Kindly complete the form below to receive a free sample of this Report

    Customer Strories

    “I am very pleased with how market segments have been defined in a relevant way for my purposes (such as "Portable Freezers & refrigerators" and "last-mile"). In general the report is well structured. Thanks very much for your efforts.”

    Victoria Milne Founder
    Case Study

    Chemicals and Materials