• Cat-intel
  • MedIntelliX
  • Resources
  • About Us
  • Request Free Sample ×

    Kindly complete the form below to receive a free sample of this Report

    Leading companies partner with us for data-driven Insights

    clients tt-cursor

    Single Phase Recloser Market

    ID: MRFR/E&P/27364-HCR
    100 Pages
    Chitranshi Jaiswal
    September 2025

    Informe de investigación de mercado de reconectadores monofásicos por clasificación de voltaje (12 kV, 15 kV, 27 kV, 38 kV), por función (protección, control, monitoreo), por tipo de instalación (aérea, subterránea, montada en pedestal) y por región (América del Norte, Europa, América del Sur, Asia Pacífico, Medio Oriente y África): pronóstico para 2034

    Share:
    Download PDF ×

    We do not share your information with anyone. However, we may send you emails based on your report interest from time to time. You may contact us at any time to opt-out.

    Single Phase Recloser Market Research Report — Global Forecast till 2034 Infographic
    Purchase Options
    $ 4.950,0
    $ 5.950,0
    $ 7.250,0
    Table of Contents

    Descripción general del mercado global de reconectadores monofásicos

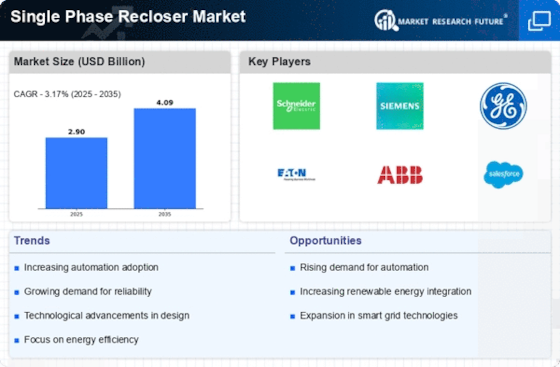
    Según el análisis de MRFR, el tamaño del mercado de reconectadores monofásicos se estimó en 2,64 (miles de millones de USD) en 2022. Se espera que la industria del mercado de reconectadores monofásicos crezca de 2,72 (miles de millones de USD) en 2023 a 3,6 (miles de millones de USD) en 2032. Se espera que la CAGR (tasa de crecimiento) del mercado de reconectadores monofásicos sea de alrededor del 3,17% durante el período de pronóstico (2024 - 2032).

    Se destacan las tendencias clave del mercado de reconectadores monofásicos

    Hay varios cambios en marcha dentro del mercado de reconectadores monofásicos que han sido influenciados por aspectos clave. En primer lugar, la creciente demanda de sistemas de distribución de energía robustos y confiables para Ci las emergencias de las industrias está aumentando el mercado de reconectadores modernos y eficientes. En segundo lugar, el aumento en el uso de sistemas de generación distribuida, por ejemplo, sistemas de energía solar y eólica, plantea problemas de estabilidad y protección de la red, en los que se utilizan reconectadores monofásicos para eliminar a los cuidadores y promover el avance de la industria. Por último, pero no menos importante, el enfoque en la modernización de la red, incluidos los programas de redes inteligentes, ayuda a la adopción de reconectadores inteligentes de alto rendimiento con monitoreo y control avanzados. Estas tendencias están cambiando la dinámica del mercado y presentando oportunidades para que las partes interesadas propongan e implementen soluciones avanzadas.

    Descripción general del mercado de reconectadores monofásicos

    Fuente: investigación primaria, investigación secundaria, base de datos MRFR y revisión de analistas

    Impulsores del mercado de reconectadores monofásicos

    Creciente demanda de redes inteligentes y automatización de la distribución

    La creciente adopción de redes inteligentes y sistemas de automatización de distribución está impulsando el crecimiento del mercado de reconectadores monofásicos. Las redes inteligentes permiten el monitoreo, control y optimización en tiempo real de la red eléctrica, mientras que los sistemas de automatización de la distribución automatizan el funcionamiento de las redes de distribución. Los reconectadores monofásicos desempeñan un papel crucial en estos sistemas al proporcionar protección y control confiable y eficiente de los circuitos de distribución. Se utilizan para aislar fallas, restaurar la energía rápidamente y mejorar la confiabilidad y eficiencia general de la red. El creciente énfasis en la modernización de la red y la necesidad de mejorar la resiliencia y confiabilidad de las redes de distribución de energía están contribuyendo al aumento de la demanda de reconectadores monofásicos en la industria del mercado de reconectadores monofásicos.

    Creciente penetración de fuentes de energía renovables

    La creciente penetración de fuentes de energía renovables, como la energía solar y eólica, también está impulsando el crecimiento del mercado de reconectadores monofásicos. Las fuentes de energía renovables suelen estar dispersas e intermitentes, lo que puede crear desafíos para la estabilidad y confiabilidad de la red. Los reconectadores monofásicos ayudan a mitigar estos desafíos al proporcionar un aislamiento y restauración de fallas rápidos y confiables, asegurando la integración eficiente y confiable de fuentes de energía renovables en la red. Se espera que la creciente adopción de fuentes de energía renovables continúe impulsando la demanda de energía única. Reconectadores monofásicos en la industria del mercado de reconectadores monofásicos.

    Infraestructura eléctrica envejecida y necesidad de reemplazo

    El envejecimiento de la infraestructura eléctrica en muchas partes del mundo es otro factor clave que impulsa el crecimiento del mercado de reconectadores monofásicos. Muchas redes de distribución están envejeciendo y llegando al final de su vida útil, lo que aumenta la necesidad de reemplazo y actualización. Los reconectadores monofásicos son una solución rentable y eficiente para reemplazar equipos antiguos y mejorar la confiabilidad y eficiencia de las redes de distribución. Se espera que la creciente necesidad de reemplazo y mejoras de infraestructura continúe impulsando la demanda de reconectadores monofásicos en la industria del mercado de reconectadores monofásicos.

    Perspectivas del segmento de mercado de reconectadores monofásicos

    Perspectivas sobre la clasificación de voltaje del mercado de reconectadores monofásicos

    El mercado de reconectadores monofásicos está segmentado por voltaje nominal, con voltajes nominales clave que incluyen 12 kV, 15 kV, 27 kV y 38 kV. Entre ellos, el segmento de clasificación de voltaje de 12 kV tuvo la mayor participación de mercado en 2023, representando más del 35% de los ingresos del mercado global. Este predominio se atribuye a la adopción generalizada de redes de distribución de 12 kV tanto en regiones desarrolladas como en desarrollo. Se espera que el segmento de clasificación de voltaje de 15 kV experimente un crecimiento constante durante el período previsto, debido al aumento de las inversiones en proyectos de modernización y expansión de la red en los mercados emergentes. Se proyecta que los segmentos de clasificación de voltaje de 27 kV y 38 kV crezcan a un ritmo moderado, impulsado por la creciente demanda de distribución de energía confiable y eficiente en aplicaciones industriales y comerciales. En términos de tamaño del mercado, se estima que el segmento de clasificación de voltaje de 12 kV estará valorado en aproximadamente 0,93 mil millones de dólares en 2023 y se proyecta que alcance los 1,24 mil millones de dólares en 2032, exhibiendo una tasa compuesta anual del 3,2%. Se espera que el segmento de clasificación de voltaje de 15 kV crezca de 680 millones de dólares en 2023 a 910 millones de dólares en 2032, con una tasa compuesta anual del 3,4%. Se proyecta que el segmento de clasificación de voltaje de 27 kV aumentará de 720 millones de dólares en 2023 a 960 millones de dólares en 2032, con una tasa compuesta anual del 3,3%. Se espera que el segmento de clasificación de voltaje de 38 kV crezca de 390 millones de dólares en 2023 a 530 millones de dólares. para 2032, a una tasa compuesta anual del 3,5%. En general, se espera que el mercado de reconectadores monofásicos continúe expandiéndose en los próximos años, impulsado por la creciente demanda de electricidad, el aumento de las inversiones en infraestructura de red y la necesidad de sistemas de distribución de energía confiables y eficientes.

    Perspectivas sobre la clasificación de voltaje del mercado de reconectadores monofásicos

    Fuente: investigación primaria, investigación secundaria, base de datos MRFR y revisión de analistas

    Perspectivas sobre la función del mercado de reconectadores monofásicos

    La segmentación del mercado de reconectadores monofásicos por función comprende protección, control y monitoreo. El segmento de Protección tuvo la mayor cuota de mercado en 2023 y se espera que continúe su dominio durante todo el período previsto. El crecimiento de este segmento se puede atribuir a la creciente demanda de sistemas de protección confiables y eficientes para salvaguardar las redes de distribución eléctrica de fallas y perturbaciones. Se prevé que el segmento de Control será testigo de un crecimiento significativo durante el período previsto debido a la creciente adopción de tecnologías de redes inteligentes y la necesidad de monitoreo y control remotos de las redes de distribución. También se espera que el segmento de Monitoreo experimente un crecimiento constante a medida que las empresas de servicios públicos busquen mejorar su visibilidad y control sobre sus redes de distribución.

    Información sobre el tipo de instalación del mercado de reconectadores monofásicos

    El mercado de reconectadores monofásicos está segmentado según el tipo de instalación en aéreo, subterráneo y montado en plataforma. En 2023, el segmento de gastos generales tenía la mayor cuota de mercado, alrededor del 60%. El crecimiento de este segmento se puede atribuir a la creciente adopción de sistemas de distribución aérea en áreas remotas y rurales. Se espera que el segmento subterráneo experimente un crecimiento significativo durante el período previsto debido a la creciente demanda de sistemas de distribución de energía confiables y eficientes en áreas urbanas y densamente pobladas. También se espera que el segmento de los dispositivos tipo pedestal crezca de manera constante, impulsado por la creciente adopción de tecnologías de redes inteligentes y la necesidad de soluciones compactas y que ahorren espacio en entornos urbanos.

    Perspectivas regionales del mercado de reconectadores monofásicos

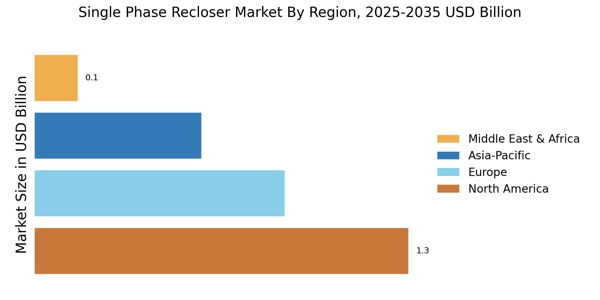
    El mercado de reconectadores monofásicos está segmentado en América del Norte, Europa, Asia Pacífico, América del Sur, Oriente Medio y África. América del Norte es el mercado regional más grande para reconectadores monofásicos y representa más del 30% de la participación del mercado global. La región tiene una infraestructura de red eléctrica bien desarrollada y una demanda creciente de tecnologías de redes inteligentes. Europa es el segundo mercado regional más grande, con una cuota de mercado superior al 25%. La región tiene un fuerte enfoque en la energía renovable y está invirtiendo fuertemente en proyectos de modernización de la red. Asia Pacífico es el mercado regional de más rápido crecimiento, con una participación de mercado de más del 20%. La región está experimentando un rápido crecimiento económico y una creciente urbanización, lo que está impulsando la demanda de electricidad y de infraestructura de red. América del Sur, Medio Oriente y África son mercados regionales relativamente más pequeños, con cuotas de mercado superiores al 15% y el 10%, respectivamente. Estas regiones tienen una necesidad creciente de sistemas de distribución de energía confiables y eficientes, lo que está impulsando la demanda de reconectadores monofásicos.

    Perspectivas regionales del mercado de reconectadores monofásicos

    Fuente: investigación primaria, investigación secundaria, base de datos MRFR y revisión de analistas

    Jugadores clave del mercado de reconectador monofásico e información competitiva

    Los principales actores del mercado de reconectadores monofásicos desarrollan y lanzan constantemente nuevos productos para obtener una ventaja competitiva. También se están centrando en ampliar su alcance global y establecer asociaciones estratégicas para aumentar su participación de mercado. Los principales actores del mercado de reconectadores monofásicos están invirtiendo fuertemente en investigación y desarrollo para introducir productos y tecnologías innovadores. Se espera que la industria del mercado de reconectadores monofásicos experimente un crecimiento significativo en los próximos años, impulsado por la creciente demanda de los países en desarrollo y las crecientes inversiones en infraestructura de red inteligente. Los principales actores en el mercado de reconectadores monofásicos incluyen Eaton, Schneider Electric, Siemens y ABB. . Estas empresas ofrecen una amplia gama de reconectadores monofásicos con funciones y capacidades avanzadas. Por ejemplo, Eaton ofrece una cartera completa de reconectadores monofásicos, incluida la serie Cooper Power, que ofrece una amplia gama de clasificaciones de corriente y capacidades de interrupción. Los reconectadores monofásicos de Schneider Electric están diseñados para proporcionar una protección confiable para las redes de distribución y están equipados con capacidades avanzadas de medición y comunicación. Siemens es otro actor importante en el mercado de reconectadores monofásicos y ofrece una gama de reconectadores monofásicos para diversas aplicaciones. Los reconectadores monofásicos de la empresa son conocidos por su alta confiabilidad y durabilidad y se utilizan ampliamente en redes de distribución de todo el mundo. ABB también es un actor líder en el mercado de reconectadores monofásicos y ofrece una amplia gama de reconectadores monofásicos para diferentes aplicaciones. Los reconectadores monofásicos de la empresa están diseñados para brindar protección confiable contra sobrecargas, cortocircuitos y otras fallas.

    Las empresas clave en el mercado de reconectadores monofásicos incluyen

    • Siemens AG
    • Hitachi Ltd.
    • Sistemas de energía Hubbell
    • Sistemas de energía Cooper
    • Compañía Eléctrica S
    • Crompton Greaves impulsa soluciones industriales
    • Itron, Inc.
    • Compañía General Electric
    • ABB Ltd.
    • Corporación Eléctrica Mitsubishi
    • Corporación Toshiba
    • Corporación Eaton
    • Soluciones industriales y de energía de CG
    • Poder de Noja
    • Schneider Electric

    Desarrollos de la industria del mercado de reconectadores monofásicos

    Se espera que el mercado mundial de reconectadores monofásicos alcance los 3.600 millones de dólares estadounidenses para 2032, exhibiendo una tasa compuesta anual del 3,17% durante el período previsto (2024-2032). La creciente demanda de redes de distribución de energía confiables y eficientes, junto con iniciativas gubernamentales para modernizar el envejecimientoinfraestructura, está impulsando el crecimiento del mercado. Además, la creciente adopción de tecnologías de redes inteligentes y la integración de fuentes de energía renovables están creando oportunidades para los reconectadores monofásicos. Los participantes clave de la industria incluyen ABB, Siemens, Eaton y Schneider Electric. Los desarrollos recientes incluyen el lanzamiento de modelos avanzados de reconectadores con capacidades mejoradas de comunicación y monitoreo, así como la adopción de tecnologías digitales para operación y mantenimiento remotos. Los esfuerzos continuos de investigación y desarrollo se centran en mejorar el rendimiento y la rentabilidad de los reconectadores monofásicos, apoyando aún más la expansión del mercado.

    Perspectivas de segmentación del mercado de reconectadores monofásicos

    • Perspectiva de calificación de voltaje del mercado de reconectadores monofásicos
      • 12 kV
      • 15 kV
      • 27 kV
      • 38kV

    • Perspectiva de la función de mercado del reconectador monofásico
      • Protección
      • Controlar
      • Monitoreo

    • Perspectiva del tipo de instalación del mercado de reconectadores monofásicos
      • Arriba
      • Subterráneo
      • Montado en plataforma
    • Perspectiva regional del mercado de reconectadores monofásicos
      • América del Norte
      • Europa
      • América del Sur
      • Asia Pacífico
      • Medio Oriente y África
    ÍNDICE


    1. RESUMEN EJECUTIVO
    1.1. Descripción general del mercado
    1.2. Hallazgos clave
    1.3. Segmentación del mercado
    1.4. Panorama Competitivo
    1.5. Retos y Oportunidades
    1.6. Perspectivas futuras


    2. INTRODUCCIÓN AL MERCADO
    2.1. Definición
    2.2. Alcance del estudio
    2.2.1. Objetivo de la investigación
    2.2.2. Supuesto
    2.2.3. Limitaciones
    3. METODOLOGÍA DE LA INVESTIGACIÓN
    3.1. Descripción general
    3.2. Minería de datos
    3.3. Investigación Secundaria
    3.4. Investigación Primaria
    3.4.1. Entrevistas primarias y proceso de recopilación de información
    3.4.2. Desglose de los encuestados principales
    3.5. Modelo de previsión
    3.6. Estimación del tamaño del mercado
    3.6.1. Enfoque ascendente
    3.6.2. Enfoque de arriba hacia abajo
    3.7. Triangulación de datos
    3.8. Validación


    4. DINÁMICA DEL MERCADO
    4.1. Descripción general
    4.2. Conductores
    4.3. Restricciones
    4.4. Oportunidades
    5. ANÁLISIS DE FACTORES DE MERCADO
    5.1. Análisis de la cadena de valor
    5.2. Análisis de las cinco fuerzas de Porter
    5.2.1. Poder de negociación de los proveedores
    5.2.2. Poder de negociación de los compradores
    5.2.3. Amenaza de nuevos participantes
    5.2.4. Amenaza de sustitutos
    5.2.5. Intensidad de la rivalidad
    5.3. Análisis de impacto de COVID-19
    5.3.1. Análisis de Impacto en el Mercado
    5.3.2. Impacto Regional
    5.3.3. Análisis de oportunidades y amenazas


    6. MERCADO DE RECONECTADORES MONOFÁSICOS, POR TENSIÓN NOMINAL (MILLONES DE USD)
    6.1. 12kV
    6.2. 15kV
    6.3. 27kV
    6.4. 38kV
    7. MERCADO DE RECONECTADORES MONOFÁSICOS, POR FUNCIÓN (MILLONES DE USD)
    7.1. Protección
    7.2. Control
    7.3. Monitoreo
    8. MERCADO DE RECONECTADORES MONOFÁSICOS, POR TIPO DE INSTALACIÓN (MILLONES DE USD)
    8.1. Gastos generales
    8.2. Subterráneo
    8.3. Montado en plataforma
    9. MERCADO DE RECONECTADORES MONOFÁSICOS, POR REGIONAL (MILLONES DE USD)
    9.1. América del Norte
    9.1.1. Estados Unidos
    9.1.2. Canadá
    9.2. Europa
    9.2.1. Alemania
    9.2.2. Reino Unido
    9.2.3. Francia
    9.2.4. Rusia
    9.2.5. Italia
    9.2.6. España
    9.2.7. Resto de Europa
    9.3. Asia Pacífico
    9.3.1. China
    9.3.2. India
    9.3.3. Japón
    9.3.4. Corea del Sur
    9.3.5. Malasia
    9.3.6. Tailandia
    9.3.7. Indonesia
    9.3.8. Resto de APAC
    9.4. América del Sur
    9.4.1. Brasil
    9.4.2. México
    9.4.3. Argentina
    9.4.4. Resto de Sudamérica
    9.5. AMUMA
    9.5.1. Países del CCG
    9.5.2. Sudáfrica
    9.5.3. Resto de MEA


    10. PANORAMA COMPETITIVO
    10.1. Descripción general
    10.2. Análisis competitivo
    10.3. Análisis de cuota de mercado
    10.4. Importante estrategia de crecimiento en el mercado de reconectadores monofásicos
    10.5. Benchmarking competitivo
    10.6. Actores líderes en términos de número de desarrollos en el mercado de reconectadores monofásicos
    10.7. Desarrollos clave y estrategias de crecimiento
    10.7.1. Lanzamiento de nuevos productos/implementación de servicios
    10.7.2. Fusión y Adquisiciones
    10.7.3. Empresas conjuntas
    10.8. Matriz financiera de los principales actores
    10.8.1. Ventas e ingresos operativos
    10.8.2. Gasto en I+D de los principales actores. 2023
    11. PERFILES DE LA EMPRESA
    11.1. Siemens AG
    11.1.1. Panorama financiero
    11.1.2. Productos Ofrecidos
    11.1.3. Desarrollos clave
    11.1.4. Análisis FODA
    11.1.5. Estrategias clave
    11.2. Hitachi Ltd.
    11.2.1. Panorama financiero
    11.2.2. Productos Ofrecidos
    11.2.3. Desarrollos clave
    11.2.4. Análisis FODA
    11.2.5. Estrategias clave
    11.3. Sistemas de energía Hubbell
    11.3.1. Panorama financiero
    11.3.2. Productos ofrecidos
    11.3.3. Desarrollos clave
    11.3.4. Análisis FODA
    11.3.5. Estrategias clave
    11.4. Cooper Power Systems
    11.4.1. Panorama financiero
    11.4.2. Productos ofrecidos
    11.4.3. Desarrollos clave
    11.4.4. Análisis FODA
    11.4.5. Estrategias clave
    11.5. S Compañía Eléctrica
    11.5.1. Panorama financiero
    11.5.2. Productos ofrecidos
    11.5.3. Desarrollos clave
    11.5.4. Análisis FODA
    11.5.5. Estrategias clave
    11.6. Crompton Greaves impulsa soluciones industriales
    11.6.1. Panorama financiero
    11.6.2. Productos ofrecidos
    11.6.3. Desarrollos clave
    11.6.4. Análisis FODA
    11.6.5. Estrategias clave
    11.7. Itron, Inc.
    11.7.1. Panorama financiero
    11.7.2. Productos ofrecidos
    11.7.3. Desarrollos clave
    11.7.4. Análisis FODA
    11.7.5. Estrategias clave
    11.8. Compañía General Electric
    11.8.1. Panorama financiero
    11.8.2. Productos ofrecidos
    11.8.3. Desarrollos clave
    11.8.4. Análisis FODA
    11.8.5. Estrategias clave
    11.9. ABB
    11.9.1. Panorama financiero
    11.9.2. Productos ofrecidos
    11.9.3. Desarrollos clave
    11.9.4. Análisis FODA
    11.9.5. Estrategias clave
    11.10. Corporación Mitsubishi Electric
    11.10.1. Panorama financiero
    11.10.2. Productos ofrecidos
    11.10.3. Desarrollos clave
    11.10.4. Análisis FODA
    11.10.5. Estrategias clave
    11.11. Corporación Toshiba
    11.11.1. Panorama financiero
    11.11.2. Productos Ofrecidos
    11.11.3. Desarrollos clave
    11.11.4. Análisis FODA
    11.11.5. Estrategias clave
    11.12. Corporación Eaton
    11.12.1. Panorama financiero
    11.12.2. Productos ofrecidos
    11.12.3. Desarrollos clave
    11.12.4. Análisis FODA
    11.12.5. Estrategias clave
    11.13. CG Energía y Soluciones Industriales
    11.13.1. Panorama financiero
    11.13.2. Productos ofrecidos
    11.13.3. Desarrollos clave
    11.13.4. Análisis FODA
    11.13.5. Estrategias clave
    11.14. Noja Power
    11.14.1. Panorama financiero
    11.14.2. Productos ofrecidos
    11.14.3. Desarrollos clave
    11.14.4. Análisis FODA
    11.14.5. Estrategias clave
    11.15. Schneider Electric
    11.15.1. Panorama financiero
    11.15.2. Productos ofrecidos
    11.15.3. Desarrollos clave
    11.15.4. Análisis FODA
    11.15.5. Estrategias clave
    12. APÉNDICE
    12.1. Referencias
    12.2. Informes relacionados
    LISTA DE TABLAS

    TABLA 1. LISTA DE SUPUESTOS
    TABLA 2. ESTIMACIONES Y ESTIMACIONES DEL TAMAÑO DEL MERCADO DE RECLOSER MONOFÁSICOS DE AMÉRICA DEL NORTE. PRONÓSTICO, POR CLASIFICACIÓN DE TENSIÓN, 2019-2032 (MILES DE MILLONES DE USD)
    TABLA 3. ESTIMACIONES Y ESTIMACIONES DEL TAMAÑO DEL MERCADO DE RECLOSER MONOFÁSICOS DE AMÉRICA DEL NORTE. PRONÓSTICO, POR FUNCIÓN, 2019-2032 (MILES DE MILLONES DE USD)
    TABLA 4. ESTIMACIONES Y ESTIMACIONES DEL TAMAÑO DEL MERCADO DE RECLOSER MONOFÁSICOS DE AMÉRICA DEL NORTE. PRONÓSTICO, POR TIPO DE INSTALACIÓN, 2019-2032 (MILES DE MILLONES DE USD)
    TABLA 5. ESTIMACIONES Y ESTIMACIONES DEL TAMAÑO DEL MERCADO DE RECLOSER MONOFÁSICOS DE AMÉRICA DEL NORTE. PRONÓSTICO, POR REGIONAL, 2019-2032 (MILES DE MILLONES DE USD)
    TABLA 6. ESTIMACIONES Y PRESIONES DEL TAMAÑO DEL MERCADO DE RECLOSER MONOFÁSICOS DE EE. UU. PRONÓSTICO, POR CLASIFICACIÓN DE TENSIÓN, 2019-2032 (MILES DE MILLONES DE USD)
    TABLA 7. ESTIMACIONES Y PRESIONES DEL TAMAÑO DEL MERCADO DE RECLOSER MONOFÁSICOS DE EE. UU. PRONÓSTICO, POR FUNCIÓN, 2019-2032 (MILES DE MILLONES DE USD)
    TABLA 8. ESTIMACIONES Y PRESIONES DEL TAMAÑO DEL MERCADO DE RECLOSER MONOFÁSICOS DE EE. UU. PRONÓSTICO, POR TIPO DE INSTALACIÓN, 2019-2032 (MILES DE MILLONES DE USD)
    TABLA 9. ESTIMACIONES Y PRESIONES DEL TAMAÑO DEL MERCADO DE RECLOSER MONOFÁSICOS DE EE. UU. PRONÓSTICO, POR REGIONAL, 2019-2032 (MILES DE MILLONES DE USD)
    TABLA 10. ESTIMACIONES Y PRESIONES DEL TAMAÑO DEL MERCADO DE RECLOSER MONOFÁSICO DE CANADÁ. PRONÓSTICO, POR CLASIFICACIÓN DE TENSIÓN, 2019-2032 (MILES DE MILLONES DE USD)
    TABLA 11. ESTIMACIONES Y POTENCIA DEL TAMAÑO DEL MERCADO DE RECLOSER MONOFÁSICOS DE CANADÁ. PRONÓSTICO, POR FUNCIÓN, 2019-2032 (MILES DE MILLONES DE USD)
    TABLA 12. ESTIMACIONES Y POTENCIAS DEL TAMAÑO DEL MERCADO DE RECLOSER MONOFÁSICO DE CANADÁ. PRONÓSTICO, POR TIPO DE INSTALACIÓN, 2019-2032 (MILES DE MILLONES DE USD)
    TABLA 13. ESTIMACIONES Y PRESIONES DEL TAMAÑO DEL MERCADO DE RECLOSER MONOFÁSICO DE CANADÁ. PRONÓSTICO, POR REGIONAL, 2019-2032 (MILES DE MILLONES DE USD)
    TABLA 14. ESTIMACIONES Y PRESIÓN DEL TAMAÑO DEL MERCADO DE RECLOSER MONOFÁSICOS EN EUROPA. PRONÓSTICO, POR CLASIFICACIÓN DE TENSIÓN, 2019-2032 (MILES DE MILLONES DE USD)
    TABLA 15. ESTIMACIONES Y POTENCIA DEL TAMAÑO DEL MERCADO DE RECLOSER MONOFÁSICOS EN EUROPA. PRONÓSTICO, POR FUNCIÓN, 2019-2032 (MILES DE MILLONES DE USD)
    TABLA 16. ESTIMACIONES Y POTENCIA DEL TAMAÑO DEL MERCADO DE RECLOSER MONOFÁSICOS EN EUROPA. PRONÓSTICO, POR TIPO DE INSTALACIÓN, 2019-2032 (MILES DE MILLONES DE USD)
    TABLA 17. ESTIMACIONES Y POTENCIA DEL TAMAÑO DEL MERCADO DE RECLOSER MONOFÁSICOS EN EUROPA. PRONÓSTICO, POR REGIONAL, 2019-2032 (MILES DE MILLONES DE USD)
    TABLA 18. ESTIMACIONES Y ESTIMACIONES DEL TAMAÑO DEL MERCADO DE RECLOSER MONOFÁSICOS EN ALEMANIA. PRONÓSTICO, POR CLASIFICACIÓN DE TENSIÓN, 2019-2032 (MILES DE MILLONES DE USD)
    TABLA 19. ESTIMACIONES Y POTENCIA DEL TAMAÑO DEL MERCADO DE RECLOSER MONOFÁSICOS DE ALEMANIA. PRONÓSTICO, POR FUNCIÓN, 2019-2032 (MILES DE MILLONES DE USD)
    TABLA 20. ESTIMACIONES Y POTENCIA DEL TAMAÑO DEL MERCADO DE RECLOSER MONOFÁSICOS DE ALEMANIA. PRONÓSTICO, POR TIPO DE INSTALACIÓN, 2019-2032 (MILES DE MILLONES DE USD)
    TABLA 21. ESTIMACIONES Y POTENCIA DEL TAMAÑO DEL MERCADO DE RECLOSER MONOFÁSICOS DE ALEMANIA. PRONÓSTICO, POR REGIONAL, 2019-2032 (MILES DE MILLONES DE USD)
    TABLA 22. ESTIMACIONES Y PRESIONES DEL TAMAÑO DEL MERCADO DE RECLOSER MONOFÁSICOS DEL REINO UNIDO. PRONÓSTICO, POR CLASIFICACIÓN DE TENSIÓN, 2019-2032 (MILES DE MILLONES DE USD)
    TABLA 23. ESTIMACIONES Y PREVISIÓN DEL TAMAÑO DEL MERCADO DE RECLOSER MONOFÁSICOS DEL REINO UNIDO. PRONÓSTICO, POR FUNCIÓN, 2019-2032 (MILES DE MILLONES DE USD)
    TABLA 24. ESTIMACIONES Y PRESIÓN DEL TAMAÑO DEL MERCADO DE RECLOSER MONOFÁSICOS DEL REINO UNIDO. PRONÓSTICO, POR TIPO DE INSTALACIÓN, 2019-2032 (MILES DE MILLONES DE USD)
    TABLA 25. ESTIMACIONES Y PREVISIÓN DEL TAMAÑO DEL MERCADO DE RECLOSER MONOFÁSICOS DEL REINO UNIDO. PRONÓSTICO, POR REGIONAL, 2019-2032 (MILES DE MILLONES DE USD)
    TABLA 26. ESTIMACIONES Y POTENCIAS DEL TAMAÑO DEL MERCADO DE RECLOSER MONOFÁSICOS EN FRANCIA. PRONÓSTICO, POR CLASIFICACIÓN DE TENSIÓN, 2019-2032 (MILES DE MILLONES DE USD)
    TABLA 27. ESTIMACIONES Y POTENCIA DEL TAMAÑO DEL MERCADO DE RECLOSER MONOFÁSICOS EN FRANCIA. PRONÓSTICO, POR FUNCIÓN, 2019-2032 (MILES DE MILLONES DE USD)
    TABLA 28. ESTIMACIONES Y POTENCIA DEL TAMAÑO DEL MERCADO DE RECLOSER MONOFÁSICOS EN FRANCIA. PRONÓSTICO, POR TIPO DE INSTALACIÓN, 2019-2032 (MILES DE MILLONES DE USD)
    TABLA 29. ESTIMACIONES Y POTENCIA DEL TAMAÑO DEL MERCADO DE RECLOSER MONOFÁSICOS EN FRANCIA. PRONÓSTICO, POR REGIONAL, 2019-2032 (MILES DE MILLONES DE USD)
    TABLA 30. ESTIMACIONES Y PRESIONES DEL TAMAÑO DEL MERCADO DE RECLOSER MONOFÁSICOS DE RUSIA. PRONÓSTICO, POR CLASIFICACIÓN DE TENSIÓN, 2019-2032 (MILES DE MILLONES DE USD)
    TABLA 31. ESTIMACIONES Y POTENCIAS DEL TAMAÑO DEL MERCADO DE RECLOSER MONOFÁSICOS DE RUSIA. PRONÓSTICO, POR FUNCIÓN, 2019-2032 (MILES DE MILLONES DE USD)
    TABLA 32. ESTIMACIONES Y POTENCIAS DEL TAMAÑO DEL MERCADO DE RECLOSER MONOFÁSICOS DE RUSIA. PRONÓSTICO, POR TIPO DE INSTALACIÓN, 2019-2032 (MILES DE MILLONES DE USD)
    TABLA 33. ESTIMACIONES Y PREVISIÓN DEL TAMAÑO DEL MERCADO DE RECLOSER MONOFÁSICOS DE RUSIA. PRONÓSTICO, POR REGIONAL, 2019-2032 (MILES DE MILLONES DE USD)
    TABLA 34. ESTIMACIONES Y POTENCIA DEL TAMAÑO DEL MERCADO DE RECLOSER MONOFÁSICOS EN ITALIA. PRONÓSTICO, POR CLASIFICACIÓN DE TENSIÓN, 2019-2032 (MILES DE MILLONES DE USD)
    TABLA 35. ESTIMACIONES Y ESTIMACIONES DEL TAMAÑO DEL MERCADO DE RECLOSER MONOFÁSICOS EN ITALIA. PRONÓSTICO, POR FUNCIÓN, 2019-2032 (MILES DE MILLONES DE USD)
    TABLA 36. ESTIMACIONES Y POTENCIA DEL TAMAÑO DEL MERCADO DE RECLOSER MONOFÁSICOS EN ITALIA. PRONÓSTICO, POR TIPO DE INSTALACIÓN, 2019-2032 (MILES DE MILLONES DE USD)
    TABLA 37. ESTIMACIONES Y POTENCIA DEL TAMAÑO DEL MERCADO DE RECLOSER MONOFÁSICOS EN ITALIA. PREVISIÓN, POR REGIONAL, 2019-2032 (MILES DE MILLONES DE USD)
    TABLA 38. ESTIMACIONES Y POTENCIAS DEL TAMAÑO DEL MERCADO DE RECLOSER MONOFÁSICOS EN ESPAÑA. PRONÓSTICO, POR CLASIFICACIÓN DE TENSIÓN, 2019-2032 (MILES DE MILLONES DE USD)
    TABLA 39. ESTIMACIONES Y ESTIMACIONES DEL TAMAÑO DEL MERCADO DE RECLOSER MONOFÁSICOS EN ESPAÑA. PREVISIÓN, POR FUNCIÓN, 2019-2032 (MILES DE MILLONES DE USD)
    TABLA 40. ESTIMACIONES DEL TAMAÑO DEL MERCADO DE RECONECTADORES MONOFÁSICOS EN ESPAÑA & PRONÓSTICO, POR TIPO DE INSTALACIÓN, 2019-2032 (MILES DE MILLONES DE USD)
    TABLA 41. ESTIMACIONES Y ESTIMACIONES DEL TAMAÑO DEL MERCADO DE RECONECTADORES MONOFÁSICOS EN ESPAÑA. PRONÓSTICO, POR REGIONAL, 2019-2032 (MILES DE MILLONES DE USD)
    TABLA 42. ESTIMACIONES Y ESTIMACIONES DEL TAMAÑO DEL MERCADO DE RECLOSER MONOFÁSICOS PARA EL RESTO DE EUROPA. PRONÓSTICO, POR CLASIFICACIÓN DE TENSIÓN, 2019-2032 (MILES DE MILLONES DE USD)
    TABLA 43. ESTIMACIONES Y ESTIMACIONES DEL TAMAÑO DEL MERCADO DE RECLOSER MONOFÁSICOS PARA EL RESTO DE EUROPA. PRONÓSTICO, POR FUNCIÓN, 2019-2032 (MILES DE MILLONES DE USD)
    TABLA 44. ESTIMACIONES Y POTENCIAS DEL TAMAÑO DEL MERCADO DE RECLOSER MONOFÁSICOS PARA EL RESTO DE EUROPA. PRONÓSTICO, POR TIPO DE INSTALACIÓN, 2019-2032 (MILES DE MILLONES DE USD)
    TABLA 45. ESTIMACIONES Y ESTIMACIONES DEL TAMAÑO DEL MERCADO DE RECLOSER MONOFÁSICOS PARA EL RESTO DE EUROPA. PRONÓSTICO, POR REGIONAL, 2019-2032 (MILES DE MILLONES DE USD)
    TABLA 46. ESTIMACIONES Y PRESIONES DEL TAMAÑO DEL MERCADO DE RECLOSER MONOFÁSICOS DE APAC. PRONÓSTICO, POR CLASIFICACIÓN DE TENSIÓN, 2019-2032 (MILES DE MILLONES DE USD)
    TABLA 47. ESTIMACIONES Y POTENCIA DEL TAMAÑO DEL MERCADO DE RECLOSER MONOFÁSICOS DE APAC. PRONÓSTICO, POR FUNCIÓN, 2019-2032 (MILES DE MILLONES DE USD)
    TABLA 48. ESTIMACIONES Y ESTIMACIONES DEL TAMAÑO DEL MERCADO DE RECLOSER MONOFÁSICOS DE APAC. PREVISIÓN, POR INSTALACIÓNTIPO, 2019-2032 (MILES DE MILLONES DE USD)
    TABLA 49. ESTIMACIONES Y ESTIMACIONES DEL TAMAÑO DEL MERCADO DE RECLOSER MONOFÁSICOS DE APAC. PRONÓSTICO, POR REGIONAL, 2019-2032 (MILES DE MILLONES DE USD)
    TABLA 50. ESTIMACIONES Y PRESIÓN DEL TAMAÑO DEL MERCADO DE RECLOSER MONOFÁSICO DE CHINA. PRONÓSTICO, POR CLASIFICACIÓN DE TENSIÓN, 2019-2032 (MILES DE MILLONES DE USD)
    TABLA 51. ESTIMACIONES Y ESTIMACIONES DEL TAMAÑO DEL MERCADO DE RECLOSER MONOFÁSICO DE CHINA. PRONÓSTICO, POR FUNCIÓN, 2019-2032 (MILES DE MILLONES DE USD)
    TABLA 52. ESTIMACIONES Y PRESIÓN DEL TAMAÑO DEL MERCADO DE RECLOSER MONOFÁSICO DE CHINA. PRONÓSTICO, POR TIPO DE INSTALACIÓN, 2019-2032 (MILES DE MILLONES DE USD)
    TABLA 53. ESTIMACIONES Y POTENCIA DEL TAMAÑO DEL MERCADO DE RECLOSER MONOFÁSICO DE CHINA. PRONÓSTICO, POR REGIONAL, 2019-2032 (MILES DE MILLONES DE USD)
    TABLA 54. ESTIMACIONES Y ESTIMACIONES DEL TAMAÑO DEL MERCADO DE RECLOSER MONOFÁSICO DE LA INDIA. PRONÓSTICO, POR CLASIFICACIÓN DE TENSIÓN, 2019-2032 (MILES DE MILLONES DE USD)
    TABLA 55. ESTIMACIONES Y POTENCIA DEL TAMAÑO DEL MERCADO DE RECLOSER MONOFÁSICOS DE LA INDIA. PRONÓSTICO, POR FUNCIÓN, 2019-2032 (MILES DE MILLONES DE USD)
    TABLA 56. ESTIMACIONES Y ESTIMACIONES DEL TAMAÑO DEL MERCADO DE RECLOSER MONOFÁSICOS DE LA INDIA. PRONÓSTICO, POR TIPO DE INSTALACIÓN, 2019-2032 (MILES DE MILLONES DE USD)
    TABLA 57. ESTIMACIONES Y POTENCIA DEL TAMAÑO DEL MERCADO DE RECLOSER MONOFÁSICOS DE LA INDIA. PRONÓSTICO, POR REGIONAL, 2019-2032 (MILES DE MILLONES DE USD)
    TABLA 58. ESTIMACIONES Y ESTIMACIONES DEL TAMAÑO DEL MERCADO DE RECLOSER MONOFÁSICO DE JAPÓN. PRONÓSTICO, POR CLASIFICACIÓN DE TENSIÓN, 2019-2032 (MILES DE MILLONES DE USD)
    TABLA 59. ESTIMACIONES Y POTENCIA DEL TAMAÑO DEL MERCADO DE RECLOSER MONOFÁSICO DE JAPÓN. PRONÓSTICO, POR FUNCIÓN, 2019-2032 (MILES DE MILLONES DE USD)
    TABLA 60. ESTIMACIONES Y ESTIMACIONES DEL TAMAÑO DEL MERCADO DE RECLOSER MONOFÁSICO DE JAPÓN. PRONÓSTICO, POR TIPO DE INSTALACIÓN, 2019-2032 (MILES DE MILLONES DE USD)
    TABLA 61. ESTIMACIONES Y POTENCIA DEL TAMAÑO DEL MERCADO DE RECLOSER MONOFÁSICOS DE JAPÓN. PRONÓSTICO, POR REGIONAL, 2019-2032 (MILES DE MILLONES DE USD)
    TABLA 62. ESTIMACIONES Y ESTIMACIONES DEL TAMAÑO DEL MERCADO DE RECLOSER MONOFÁSICOS DE COREA DEL SUR. PRONÓSTICO, POR CLASIFICACIÓN DE TENSIÓN, 2019-2032 (MILES DE MILLONES DE USD)
    TABLA 63. ESTIMACIONES Y ESTIMACIONES DEL TAMAÑO DEL MERCADO DE RECLOSER MONOFÁSICOS DE COREA DEL SUR. PRONÓSTICO, POR FUNCIÓN, 2019-2032 (MILES DE MILLONES DE USD)
    TABLA 64. ESTIMACIONES Y ESTIMACIONES DEL TAMAÑO DEL MERCADO DE RECLOSER MONOFÁSICOS DE COREA DEL SUR. PRONÓSTICO, POR TIPO DE INSTALACIÓN, 2019-2032 (MILES DE MILLONES DE USD)
    TABLA 65. ESTIMACIONES Y ESTIMACIONES DEL TAMAÑO DEL MERCADO DE RECLOSER MONOFÁSICOS DE COREA DEL SUR. PRONÓSTICO, POR REGIONAL, 2019-2032 (MILES DE MILLONES DE USD)
    TABLA 66. ESTIMACIONES Y ESTIMACIONES DEL TAMAÑO DEL MERCADO DE RECLOSER MONOFÁSICOS DE MALASIA. PRONÓSTICO, POR CLASIFICACIÓN DE TENSIÓN, 2019-2032 (MILES DE MILLONES DE USD)
    TABLA 67. ESTIMACIONES Y ESTIMACIONES DEL TAMAÑO DEL MERCADO DE RECLOSER MONOFÁSICOS DE MALASIA. PRONÓSTICO, POR FUNCIÓN, 2019-2032 (MILES DE MILLONES DE USD)
    TABLA 68. ESTIMACIONES Y ESTIMACIONES DEL TAMAÑO DEL MERCADO DE RECLOSER MONOFÁSICOS DE MALASIA. PRONÓSTICO, POR TIPO DE INSTALACIÓN, 2019-2032 (MILES DE MILLONES DE USD)
    TABLA 69. ESTIMACIONES Y PREVISIÓN DEL TAMAÑO DEL MERCADO DE RECLOSER MONOFÁSICOS DE MALASIA. PRONÓSTICO, POR REGIONAL, 2019-2032 (MILES DE MILLONES DE USD)
    TABLA 70. ESTIMACIONES Y POTENCIA DEL TAMAÑO DEL MERCADO DE RECLOSER MONOFÁSICOS DE TAILANDIA. PRONÓSTICO, POR CLASIFICACIÓN DE TENSIÓN, 2019-2032 (MILES DE MILLONES DE USD)
    TABLA 71. ESTIMACIONES Y POTENCIA DEL TAMAÑO DEL MERCADO DE RECLOSER MONOFÁSICOS DE TAILANDIA. PRONÓSTICO, POR FUNCIÓN, 2019-2032 (MILES DE MILLONES DE USD)
    TABLA 72. ESTIMACIONES Y POTENCIA DEL TAMAÑO DEL MERCADO DE RECLOSER MONOFÁSICOS DE TAILANDIA. PRONÓSTICO, POR TIPO DE INSTALACIÓN, 2019-2032 (MILES DE MILLONES DE USD)
    TABLA 73. ESTIMACIONES Y POTENCIA DEL TAMAÑO DEL MERCADO DE RECLOSER MONOFÁSICOS DE TAILANDIA. PRONÓSTICO, POR REGIONAL, 2019-2032 (MILES DE MILLONES DE USD)
    TABLA 74. ESTIMACIONES Y ESTIMACIONES DEL TAMAÑO DEL MERCADO DE RECLOSER MONOFÁSICOS DE INDONESIA. PRONÓSTICO, POR CLASIFICACIÓN DE TENSIÓN, 2019-2032 (MILES DE MILLONES DE USD)
    TABLA 75. ESTIMACIONES Y POTENCIA DEL TAMAÑO DEL MERCADO DE RECLOSER MONOFÁSICOS DE INDONESIA. PRONÓSTICO, POR FUNCIÓN, 2019-2032 (MILES DE MILLONES DE USD)
    TABLA 76. ESTIMACIONES Y ESTIMACIONES DEL TAMAÑO DEL MERCADO DE RECLOSER MONOFÁSICOS DE INDONESIA. PRONÓSTICO, POR TIPO DE INSTALACIÓN, 2019-2032 (MILES DE MILLONES DE USD)
    TABLA 77. ESTIMACIONES Y POTENCIA DEL TAMAÑO DEL MERCADO DE RECLOSER MONOFÁSICOS DE INDONESIA. PRONÓSTICO, POR REGIONAL, 2019-2032 (MILES DE MILLONES DE USD)
    TABLA 78. ESTIMACIONES Y ESTIMACIONES DEL TAMAÑO DEL MERCADO DE RECLOSER MONOFÁSICOS DEL RESTO DE APAC. PRONÓSTICO, POR CLASIFICACIÓN DE TENSIÓN, 2019-2032 (MILES DE MILLONES DE USD)
    TABLA 79. ESTIMACIONES Y ESTIMACIONES DEL TAMAÑO DEL MERCADO DE RECLOSER MONOFÁSICOS DEL RESTO DE APAC. PRONÓSTICO, POR FUNCIÓN, 2019-2032 (MILES DE MILLONES DE USD)
    TABLA 80. ESTIMACIONES Y ESTIMACIONES DEL TAMAÑO DEL MERCADO DE RECLOSER MONOFÁSICOS DEL RESTO DE APAC. PRONÓSTICO, POR TIPO DE INSTALACIÓN, 2019-2032 (MILES DE MILLONES DE USD)
    TABLA 81. ESTIMACIONES Y ESTIMACIONES DEL TAMAÑO DEL MERCADO DE RECLOSER MONOFÁSICOS DEL RESTO DE APAC. PRONÓSTICO, POR REGIONAL, 2019-2032 (MILES DE MILLONES DE USD)
    TABLA 82. ESTIMACIONES Y ESTIMACIONES DEL TAMAÑO DEL MERCADO DE RECLOSER MONOFÁSICOS EN AMÉRICA DEL SUR. PRONÓSTICO, POR CLASIFICACIÓN DE TENSIÓN, 2019-2032 (MILES DE MILLONES DE USD)
    TABLA 83. ESTIMACIONES Y ESTIMACIONES DEL TAMAÑO DEL MERCADO DE RECLOSER MONOFÁSICOS DE AMÉRICA DEL SUR. PRONÓSTICO, POR FUNCIÓN, 2019-2032 (MILES DE MILLONES DE USD)
    TABLA 84. ESTIMACIONES Y ESTIMACIONES DEL TAMAÑO DEL MERCADO DE RECLOSER MONOFÁSICOS DE AMÉRICA DEL SUR. PRONÓSTICO, POR TIPO DE INSTALACIÓN, 2019-2032 (MILES DE MILLONES DE USD)
    TABLA 85. ESTIMACIONES Y ESTIMACIONES DEL TAMAÑO DEL MERCADO DE RECLOSER MONOFÁSICOS EN AMÉRICA DEL SUR. PRONÓSTICO, POR REGIONAL, 2019-2032 (MILES DE MILLONES DE USD)
    TABLA 86. ESTIMACIONES Y POTENCIAS DEL TAMAÑO DEL MERCADO DE RECLOSER MONOFÁSICOS DE BRASIL. PRONÓSTICO, POR CLASIFICACIÓN DE TENSIÓN, 2019-2032 (MILES DE MILLONES DE USD)
    TABLA 87. ESTIMACIONES Y ESTIMACIONES DEL TAMAÑO DEL MERCADO DE RECLOSER MONOFÁSICOS EN BRASIL. PRONÓSTICO, POR FUNCIÓN, 2019-2032 (MILES DE MILLONES DE USD)
    TABLA 88. ESTIMACIONES Y POTENCIAS DEL TAMAÑO DEL MERCADO DE RECLOSER MONOFÁSICOS DE BRASIL. PRONÓSTICO, POR TIPO DE INSTALACIÓN, 2019-2032 (MILES DE MILLONES DE USD)
    TABLA 89. ESTIMACIONES Y POTENCIAS DEL TAMAÑO DEL MERCADO DE RECLOSER MONOFÁSICOS DE BRASIL. PRONÓSTICO, POR REGIONAL, 2019-2032 (MILES DE MILLONES DE USD)
    TABLA 90. ESTIMACIONES Y POTENCIA DEL TAMAÑO DEL MERCADO DE RECLOSER MONOFÁSICOS EN MÉXICO. PRONÓSTICO, POR CLASIFICACIÓN DE TENSIÓN, 2019-2032 (MILES DE MILLONES DE USD)
    TABLA 91. ESTIMACIONES Y POTENCIA DEL TAMAÑO DEL MERCADO DE RECLOSER MONOFÁSICOS EN MÉXICO. PRONÓSTICO, POR FUNCIÓN, 2019-2032 (MILES DE MILLONES DE USD)
    TABLA 92. ESTIMACIONES Y POTENCIA DEL TAMAÑO DEL MERCADO DE RECLOSER MONOFÁSICOS EN MÉXICO. PRONÓSTICO, POR TIPO DE INSTALACIÓN, 2019-2032 (MILES DE MILLONES DE USD)
    TABLA 93. ESTIMACIONES Y POTENCIA DEL TAMAÑO DEL MERCADO DE RECLOSER MONOFÁSICOS EN MÉXICO. PRONÓSTICO, POR REGIONAL, 2019-2032 (MILES DE MILLONES DE USD)
    TABLA 94. ESTIMACIONES Y POTENCIA DEL TAMAÑO DEL MERCADO DE RECLOSER MONOFÁSICOS DE ARGENTINA. PRONÓSTICO, POR CLASIFICACIÓN DE TENSIÓN, 2019-2032 (MILES DE MILLONES DE USD)
    TABLA 95. ESTIMACIONES Y ESTIMACIONES DEL TAMAÑO DEL MERCADO DE RECLOSER MONOFÁSICOS DE ARGENTINA. PRONÓSTICO, POR FUNCIÓN, 2019-2032 (MILES DE MILLONES DE USD)
    TABLA 96. ESTIMACIONES Y POTENCIA DEL TAMAÑO DEL MERCADO DE RECLOSER MONOFÁSICOS EN ARGENTINA. PRONÓSTICO, POR TIPO DE INSTALACIÓN, 2019-2032 (MILES DE MILLONES DE USD)
    TABLA 97. ESTIMACIONES Y POTENCIA DEL TAMAÑO DEL MERCADO DE RECLOSER MONOFÁSICOS DE ARGENTINA. PRONÓSTICO, POR REGIONAL, 2019-2032 (MILES DE MILLONES DE USD)
    TABLA 98. ESTIMACIONES Y ESTIMACIONES DEL TAMAÑO DEL MERCADO DE RECLOSER MONOFÁSICOS PARA EL RESTO DE SUDAMÉRICA. PRONÓSTICO, POR CLASIFICACIÓN DE TENSIÓN, 2019-2032 (MILES DE MILLONES DE USD)
    TABLA 99. ESTIMACIONES Y ESTIMACIONES DEL TAMAÑO DEL MERCADO DE RECLOSER MONOFÁSICOS PARA EL RESTO DE SUDAMÉRICA. PRONÓSTICO, POR FUNCIÓN, 2019-2032 (MILES DE MILLONES DE USD)
    TABLA 100. ESTIMACIONES Y ESTIMACIONES DEL TAMAÑO DEL MERCADO DE RECLOSER MONOFÁSICOS PARA EL RESTO DE SUDAMÉRICA. PRONÓSTICO, POR TIPO DE INSTALACIÓN, 2019-2032 (MILES DE MILLONES DE USD)
    TABLA 101. ESTIMACIONES Y ESTIMACIONES DEL TAMAÑO DEL MERCADO DE RECLOSER MONOFÁSICOS PARA EL RESTO DE SUDAMÉRICA. PRONÓSTICO, POR REGIONAL, 2019-2032 (MILES DE MILLONES DE USD)
    TABLA 102. ESTIMACIONES Y POTENCIA DEL TAMAÑO DEL MERCADO DE RECLOSER MONOFÁSICO MEA. PRONÓSTICO, POR CLASIFICACIÓN DE TENSIÓN, 2019-2032 (MILES DE MILLONES DE USD)
    TABLA 103. ESTIMACIONES Y POTENCIA DEL TAMAÑO DEL MERCADO DE RECLOSER MONOFÁSICO MEA. PRONÓSTICO, POR FUNCIÓN, 2019-2032 (MILES DE MILLONES DE USD)
    TABLA 104. ESTIMACIONES Y POTENCIA DEL TAMAÑO DEL MERCADO DE RECLOSER MONOFÁSICO MEA. PRONÓSTICO, POR TIPO DE INSTALACIÓN, 2019-2032 (MILES DE MILLONES DE USD)
    TABLA 105. ESTIMACIONES Y POTENCIA DEL TAMAÑO DEL MERCADO DE RECLOSER MONOFÁSICO MEA. PRONÓSTICO, POR REGIONAL, 2019-2032 (MILES DE MILLONES DE USD)
    TABLA 106. ESTIMACIONES Y ESTIMACIONES DEL TAMAÑO DEL MERCADO DE RECLOSER MONOFÁSICOS DE LOS PAÍSES DEL CCG. PRONÓSTICO, POR CLASIFICACIÓN DE TENSIÓN, 2019-2032 (MILES DE MILLONES DE USD)
    TABLA 107. ESTIMACIONES Y ESTIMACIONES DEL TAMAÑO DEL MERCADO DE RECLOSER MONOFÁSICOS DE LOS PAÍSES DEL CCG. PRONÓSTICO, POR FUNCIÓN, 2019-2032 (MILES DE MILLONES DE USD)
    TABLA 108. ESTIMACIONES Y ESTIMACIONES DEL TAMAÑO DEL MERCADO DE RECLOSER MONOFÁSICOS DE LOS PAÍSES DEL CCG. PRONÓSTICO, POR TIPO DE INSTALACIÓN, 2019-2032 (MILES DE MILLONES DE USD)
    TABLA 109. ESTIMACIONES Y ESTIMACIONES DEL TAMAÑO DEL MERCADO DE RECLOSER MONOFÁSICO DE LOS PAÍSES DEL CCG. PRONÓSTICO, POR REGIONAL, 2019-2032 (MILES DE MILLONES DE USD)
    TABLA 110. ESTIMACIONES Y ESTIMACIONES DEL TAMAÑO DEL MERCADO DE RECLOSER MONOFÁSICOS DE SUDÁFRICA. PRONÓSTICO, POR CLASIFICACIÓN DE TENSIÓN, 2019-2032 (MILES DE MILLONES DE USD)
    TABLA 111. ESTIMACIONES Y ESTIMACIONES DEL TAMAÑO DEL MERCADO DE RECLOSER MONOFÁSICOS DE SUDÁFRICA. PRONÓSTICO, POR FUNCIÓN, 2019-2032 (MILES DE MILLONES DE USD)
    TABLA 112. ESTIMACIONES Y ESTIMACIONES DEL TAMAÑO DEL MERCADO DE RECLOSER MONOFÁSICOS DE SUDÁFRICA. PRONÓSTICO, POR TIPO DE INSTALACIÓN, 2019-2032 (MILES DE MILLONES DE USD)
    TABLA 113. ESTIMACIONES Y ESTIMACIONES DEL TAMAÑO DEL MERCADO DE RECLOSER MONOFÁSICOS DE SUDÁFRICA. PRONÓSTICO, POR REGIONAL, 2019-2032 (MILES DE MILLONES DE USD)
    TABLA 114. ESTIMACIONES Y PRESIONES DEL TAMAÑO DEL MERCADO DE RECLOSER MONOFÁSICOS DEL RESTO DE MEA. PRONÓSTICO, POR CLASIFICACIÓN DE TENSIÓN, 2019-2032 (MILES DE MILLONES DE USD)
    TABLA 115. ESTIMACIONES Y ESTIMACIONES DEL TAMAÑO DEL MERCADO DE RECLOSER MONOFÁSICOS DEL RESTO DE MEA. PRONÓSTICO, POR FUNCIÓN, 2019-2032 (MILES DE MILLONES DE USD)
    TABLA 116. ESTIMACIONES Y PROYECTOS DEL TAMAÑO DEL MERCADO DE RECLOSER MONOFÁSICOS DEL RESTO DE MEA. PRONÓSTICO, POR TIPO DE INSTALACIÓN, 2019-2032 (MILES DE MILLONES DE USD)
    TABLA 117. ESTIMACIONES Y PROYECTOS DEL TAMAÑO DEL MERCADO DE RECLOSER MONOFÁSICOS DEL RESTO DE MEA. PRONÓSTICO, POR REGIONAL, 2019-2032 (MILES DE MILLONES DE USD)
    TABLA 118. LANZAMIENTO/DESARROLLO/APROBACIÓN DE PRODUCTOS
    TABLA 119. ADQUISICIÓN/ASOCIACIÓN

    LISTA DE CIFRAS

    FIGURA 1. SINOPSIS DEL MERCADO
    FIGURA 2. ANÁLISIS DEL MERCADO DE RECLOSEADORES MONOFÁSICOS DE AMÉRICA DEL NORTE
    FIGURA 3. ANÁLISIS DEL MERCADO DE RECLOSERS MONOFÁSICOS DE EE.UU. POR CLASIFICACIÓN DE TENSIÓN
    FIGURA 4. ANÁLISIS DEL MERCADO DE RECLOSEADORES MONOFÁSICOS DE EE.UU. POR FUNCIÓN
    FIGURA 5. MERCADO DE RECLOSERS MONOFÁSICOS DE EE.UU. ANÁLISIS POR TIPO DE INSTALACIÓN
    FIGURA 6. ANÁLISIS DEL MERCADO DE RECLOSEADORES MONOFÁSICOS DE EE. UU. POR REGIONAL
    FIGURA 7. ANÁLISIS DEL MERCADO DE RECLOSEADORES MONOFÁSICOS DE CANADÁ POR CLASIFICACIÓN DE TENSIÓN
    FIGURA 8. ANÁLISIS DEL MERCADO DE RECLOSEADORES MONOFÁSICOS DE CANADÁ POR FUNCIÓN
    FIGURA 9. MERCADO DE RECLOSER MONOFÁSICO DE CANADÁ ANÁLISIS POR TIPO DE INSTALACIÓN
    FIGURA 10. ANÁLISIS DEL MERCADO DE RECLOSER MONOFÁSICO DE CANADÁ POR REGIONAL
    FIGURA 11. ANÁLISIS DEL MERCADO DE RECLOSER MONOFÁSICO DE EUROPA
    FIGURA 12. ANÁLISIS DEL MERCADO DE RECLOSER MONOFÁSICO DE ALEMANIA POR CLASIFICACIÓN DE TENSIÓN
    FIGURA 13. ANÁLISIS DEL MERCADO DE RECLOSEADORES MONOFÁSICOS EN ALEMANIA POR FUNCIÓN
    FIGURA 14. ANÁLISIS DEL MERCADO DE RECLOSEADORES MONOFÁSICOS EN ALEMANIA POR TIPO DE INSTALACIÓN
    FIGURA 15. ANÁLISIS DEL MERCADO DE RECLOSEADORES MONOFÁSICOS EN ALEMANIA POR REGIONAL
    FIGURA 16. RECLOSEADORES MONOFÁSICOS DEL REINO UNIDO MERCADO ANÁLISIS POR CLASIFICACIÓN DE TENSIÓN
    FIGURA 17. ANÁLISIS DEL MERCADO DE RECLOSEADORES MONOFÁSICOS DEL REINO UNIDO POR FUNCIÓN
    FIGURA 18. ANÁLISIS DEL MERCADO DE RECLOSEADORES MONOFÁSICOS DEL REINO UNIDO POR TIPO DE INSTALACIÓN
    FIGURA 19. ANÁLISIS DEL MERCADO DE RECLOSEADORES MONOFÁSICOS DEL REINO UNIDO POR REGIONAL
    FIGURA 20. ANÁLISIS DEL MERCADO DE RECLOSER MONOFÁSICO DE FRANCIA POR CLASIFICACIÓN DE TENSIÓN
    FIGURA 21. ANÁLISIS DEL MERCADO DE RECLOSEADORES MONOFÁSICOS DE FRANCIA POR FUNCIÓN
    FIGURA 22. ANÁLISIS DEL MERCADO DE RECLOSER MONOFÁSICO DE FRANCIA POR TIPO DE INSTALACIÓN
    FIGURA 23. MONOFÁSICO DE FRANCIA MERCADO DE RECLOSER ANÁLISIS POR REGIONAL
    FIGURA 24. ANÁLISIS DEL MERCADO DE RECLOSEADORES MONOFÁSICOS DE RUSIA POR CLASIFICACIÓN DE TENSIÓN
    FIGURA 25. ANÁLISIS DEL MERCADO DE RECLOSERS MONOFÁSICOS DE RUSIA POR FUNCIÓN
    FIGURA 26. ANÁLISIS DEL MERCADO DE RECLOSERS MONOFÁSICOS DE RUSIA POR TIPO DE INSTALACIÓN
    />FIGURA 27. ANÁLISIS DEL MERCADO DE RECLOSEADORES MONOFÁSICOS DE RUSIA POR REGIONAL
    FIGURA 28. ANÁLISIS DEL MERCADO DE RECLOSEADORES MONOFÁSICOS DE ITALIA POR CLASIFICACIÓN DE TENSIÓN
    FIGURA 29. ANÁLISIS DEL MERCADO DE RECLOSEADORES MONOFÁSICOS DE ITALIA POR FUNCIÓN
    FIGURA 30 ITALIA SOLTERA ANÁLISIS DEL MERCADO DE RECLOSERS MONOFÁSICOS POR TIPO DE INSTALACIÓN
    FIGURA 31. ANÁLISIS DEL MERCADO DE RECLOSERS MONOFÁSICOS DE ITALIA POR REGIONAL
    FIGURA 32. ANÁLISIS DEL MERCADO DE RECLOSERS MONOFÁSICOS DE ESPAÑA POR TENSIÓN
    FIGURA 33. MERCADO DE RECLOSERS MONOFÁSICOS DE ESPAÑA ANÁLISIS POR FUNCIÓN
    FIGURA 34. ANÁLISIS DEL MERCADO DE RECLOSEADORES MONOFÁSICOS EN ESPAÑA POR TIPO DE INSTALACIÓN
    FIGURA 35. ANÁLISIS DEL MERCADO DE RECLOSEADORES MONOFÁSICOS EN ESPAÑA POR REGIONAL
    FIGURA 36. ANÁLISIS DEL MERCADO DE RECLOSEADORES MONOFÁSICOS DEL RESTO DE EUROPA POR TENSIÓN
    FIGURA 37. RESTO DE EUROPA ANÁLISIS DEL MERCADO DE RECLOSEADORES MONOFÁSICOS POR FUNCIÓN
    FIGURA 38. RESTO DE EUROPA ANÁLISIS DEL MERCADO DE RECLOSEADORES MONOFÁSICOS POR TIPO DE INSTALACIÓN
    FIGURA 39. RESTO DE EUROPA ANÁLISIS DEL MERCADO DE RECLOSERS MONOFÁSICOS POR REGIONAL
    FIGURA 40. APAC ÚNICO RECIERRE DE FASEANÁLISIS DE MERCADO
    FIGURA 41. ANÁLISIS DEL MERCADO DE RECLOSEADORES MONOFÁSICOS DE CHINA POR CLASIFICACIÓN DE TENSIÓN
    FIGURA 42. ANÁLISIS DEL MERCADO DE RECLOSEADORES MONOFÁSICOS DE CHINA POR FUNCIÓN
    FIGURA 43. ANÁLISIS DEL MERCADO DE RECLOSEADORES MONOFÁSICOS DE CHINA POR TIPO DE INSTALACIÓN < br />FIGURA 44. ANÁLISIS DEL MERCADO DE RECLOSERS MONOFÁSICOS DE CHINA POR REGIONAL
    FIGURA 45. ANÁLISIS DEL MERCADO DE RECLOSERS MONOFÁSICOS DE INDIA POR CLASIFICACIÓN DE TENSIÓN
    FIGURA 46. ANÁLISIS DEL MERCADO DE RECLOSERS MONOFÁSICOS DE INDIA POR FUNCIÓN
    FIGURA 47. INDIA ÚNICO MERCADO DE RECLOSER DE FASE ANÁLISIS POR TIPO DE INSTALACIÓN
    FIGURA 48. ANÁLISIS DEL MERCADO DE RECLOSEADORES MONOFÁSICOS DE LA INDIA POR REGIONAL
    FIGURA 49. ANÁLISIS DEL MERCADO DE RECLOSERS MONOFÁSICOS DE JAPÓN POR CLASIFICACIÓN DE TENSIÓN
    FIGURA 50. ANÁLISIS DEL MERCADO DE RECLOSERS MONOFÁSICOS DE JAPÓN POR FUNCIÓN
    FIGURA 51. ANÁLISIS DEL MERCADO DE RECLOSERS MONOFÁSICOS DE JAPÓN POR TIPO DE INSTALACIÓN
    FIGURA 52. ANÁLISIS DEL MERCADO DE RECLOSERS MONOFÁSICOS DE JAPÓN POR REGIONAL
    FIGURA 53. ANÁLISIS DEL MERCADO DE RECLOSERS MONOFÁSICOS DE COREA DEL SUR POR CLASIFICACIÓN DE TENSIÓN
    FIGURA 54. COREA DEL SUR SOLTERA ANÁLISIS DEL MERCADO DE RECLOSER MONOFÁSICO POR FUNCIÓN
    FIGURA 55. ANÁLISIS DEL MERCADO DE RECLOSEADORES MONOFÁSICOS DE COREA DEL SUR POR TIPO DE INSTALACIÓN
    FIGURA 56. ANÁLISIS DEL MERCADO DE RECLOSERS MONOFÁSICOS DE COREA DEL SUR POR REGIONAL
    FIGURA 57. RECLOSER MONOFÁSICO DE MALASIA MERCADO ANÁLISIS POR CLASIFICACIÓN DE TENSIÓN
    FIGURA 58. ANÁLISIS DEL MERCADO DE RECLOSEADORES MONOFÁSICOS DE MALASIA POR FUNCIÓN
    FIGURA 59. ANÁLISIS DEL MERCADO DE RECLOSEADORES MONOFÁSICOS DE MALASIA POR TIPO DE INSTALACIÓN
    FIGURA 60. ANÁLISIS DEL MERCADO DE RECLOSEADORES MONOFÁSICOS DE MALASIA POR REGIONAL
    />FIGURA 61. ANÁLISIS DEL MERCADO DE RECLOSEADORES MONOFÁSICOS DE TAILANDIA POR CLASIFICACIÓN DE TENSIÓN
    FIGURA 62. ANÁLISIS DEL MERCADO DE RECLOSEADORES MONOFÁSICOS DE TAILANDIA POR FUNCIÓN
    FIGURA 63. ANÁLISIS DEL MERCADO DE RECLOSEADORES MONOFÁSICOS DE TAILANDIA POR TIPO DE INSTALACIÓN
    FIGURA 64. TAILANDIA ANÁLISIS DEL MERCADO DE RECLOSERS MONOFÁSICOS POR REGIONAL
    FIGURA 65. ANÁLISIS DEL MERCADO DE RECLOSERS MONOFÁSICOS DE INDONESIA POR CLASIFICACIÓN DE TENSIÓN
    FIGURA 66. ANÁLISIS DEL MERCADO DE RECLOSERS MONOFÁSICOS DE INDONESIA POR FUNCIÓN
    FIGURA 67. MERCADO DE RECLOSERS MONOFÁSICOS DE INDONESIA ANÁLISIS POR TIPO DE INSTALACIÓN
    FIGURA 68. MERCADO DE RECLOSEADORES MONOFÁSICOS DE INDONESIA ANÁLISIS POR REGIONAL
    FIGURA 69. RESTO DEL MERCADO DE RECLOSEADORES MONOFÁSICOS DE APAC ANÁLISIS POR CLASIFICACIÓN DE TENSIÓN
    FIGURA 70. RESTO DE RECLOSEADORES MONOFÁSICOS DE APAC ANÁLISIS DE MERCADO POR FUNCIÓN
    FIGURA 71. ANÁLISIS DEL MERCADO DE RECLOSERS MONOFÁSICOS DEL RESTO DE APAC POR TIPO DE INSTALACIÓN
    FIGURA 72. ANÁLISIS DEL MERCADO DE RECLOSERS MONOFÁSICOS DEL RESTO DE APAC POR REGIONAL
    FIGURA 73. ANÁLISIS DEL MERCADO DE RECLOSERS MONOFÁSICOS DE AMÉRICA DEL SUR < br />FIGURA 74. ANÁLISIS DEL MERCADO DE RECLOSEADORES MONOFÁSICOS DE BRASIL POR TENSIÓN NOMINAL
    FIGURA 75. ANÁLISIS DEL MERCADO DE RECLOSEADORES MONOFÁSICOS DE BRASIL POR FUNCIÓN
    FIGURA 76. ANÁLISIS DEL MERCADO DE RECLOSEADORES MONOFÁSICOS DE BRASIL POR TIPO DE INSTALACIÓN
    FIGURA 77. BRASIL MONOFÁSICO RECIERRE ANÁLISIS DE MERCADO POR REGIONAL
    FIGURA 78. ANÁLISIS DEL MERCADO DE RECLOSEADORES MONOFÁSICOS EN MÉXICO POR TENSIÓN
    FIGURA 79. ANÁLISIS DEL MERCADO DE RECLOSEADORES MONOFÁSICOS EN MÉXICO POR FUNCIÓN
    FIGURA 80. ANÁLISIS DEL MERCADO DE RECLOSEADORES MONOFÁSICOS EN MÉXICO POR INSTALACIÓN TIPO
    />FIGURA 81. ANÁLISIS DEL MERCADO DE RECLOSEADORES MONOFÁSICOS EN MÉXICO POR REGIONAL
    FIGURA 82. ANÁLISIS DEL MERCADO DE RECLOSEADORES MONOFÁSICOS EN ARGENTINA POR CLASIFICACIÓN DE TENSIÓN
    FIGURA 83. ANÁLISIS DEL MERCADO DE RECLOSEADORES MONOFÁSICOS EN ARGENTINA POR FUNCIÓN
    FIGURA 84 . ANÁLISIS DEL MERCADO DE RECLOSEADORES MONOFÁSICOS POR TIPO DE INSTALACIÓN
    FIGURA 85. ANÁLISIS DEL MERCADO DE RECLOSEADORES MONOFÁSICOS POR REGIONAL
    FIGURA 86. RESTO DE SUDAMÉRICA ANÁLISIS DEL MERCADO DE RECLOSEADORES MONOFÁSICOS POR TENSIÓN
    FIGURA 87. RESTO DE SUDAMERICA ANÁLISIS DEL MERCADO DE RECLOSEADORES MONOFÁSICOS POR FUNCIÓN
    FIGURA 88. RESTO DE SUDAMÉRICA ANÁLISIS DEL MERCADO DE RECLOSERS MONOFÁSICOS POR TIPO DE INSTALACIÓN
    FIGURA 89. RESTO DE SUDAMÉRICA ANÁLISIS DEL MERCADO DE RECLOSERS MONOFÁSICOS POR REGIONAL
    FIGURA 90 .MEA SOLTERO ANÁLISIS DEL MERCADO DE RECLOSEADORES FASE
    FIGURA 91. ANÁLISIS DEL MERCADO DE RECLOSEADORES MONOFÁSICOS DE LOS PAÍSES DEL CCG POR CLASIFICACIÓN DE TENSIÓN
    FIGURA 92. ANÁLISIS DEL MERCADO DE RECLOSEADORES MONOFÁSICOS DE LOS PAÍSES DEL CCG POR FUNCIÓN
    FIGURA 93. MERCADO DE RECLOSEADORES MONOFÁSICOS DE LOS PAÍSES DEL CCG ANÁLISIS POR TIPO DE INSTALACIÓN
    FIGURA 94. ANÁLISIS DEL MERCADO DE RECLOSERS MONOFÁSICOS DE LOS PAÍSES DEL CCG POR REGIONAL
    FIGURA 95. ANÁLISIS DEL MERCADO DE RECLOSERS MONOFÁSICOS DE SUDÁFRICA POR CLASIFICACIÓN DE TENSIÓN
    FIGURA 96. ANÁLISIS DEL MERCADO DE RECLOSERS MONOFÁSICOS DE SUDÁFRICA POR FUNCIÓN
    />FIGURA 97. ANÁLISIS DEL MERCADO DE RECLOSEADORES MONOFÁSICOS EN SUDÁFRICA POR TIPO DE INSTALACIÓN
    FIGURA 98. ANÁLISIS DEL MERCADO DE RECLOSEADORES MONOFÁSICOS EN SUDÁFRICA POR REGIONAL
    FIGURA 99. RESTO DE MEA ANÁLISIS DEL MERCADO DE RECLOSEADORES MONOFÁSICOS POR TENSIÓN < br />FIGURA 100. RESTO DE MEA ANÁLISIS DE MERCADO DE RECONECTADORES MONOFÁSICOS POR FUNCIÓN
    FIGURA 101. RESTO DE MEA ANÁLISIS DE MERCADO DE RECONECTADORES MONOFÁSICOS POR TIPO DE INSTALACIÓN
    FIGURA 102. RESTO DE MEA ANÁLISIS DE MERCADO DE RECONECTADORES MONOFÁSICOS POR REGIONAL
    FIGURA 103. CRITERIOS CLAVE DE COMPRA DEL MERCADO DE RECIERRE MONOFÁSICO
    FIGURA 104. PROCESO DE INVESTIGACIÓN DE MRFR
    FIGURA 105. ANÁLISIS DRO DEL MERCADO DE RECIERRE MONOFÁSICO
    FIGURA 106. ANÁLISIS DE IMPACTO DE LOS IMPULSORES: MERCADO DE RECIERRE MONOFÁSICO
    FIGURA 107. ANÁLISIS DE IMPACTO DE LAS RESTRICCIONES: MERCADO DE RECLOSEADORES MONOFÁSICOS
    FIGURA 108. CADENA DE SUMINISTRO / VALOR: MERCADO DE RECLOSERS MONOFÁSICOS
    FIGURA 109. MERCADO DE RECLOSERS MONOFÁSICOS, POR CLASIFICACIÓN DE TENSIÓN, 2024 (% DE PARTICIPACIÓN)
    FIGURA 110. RECIERRE MONOFÁSICO MERCADO, POR CLASIFICACIÓN DE TENSIÓN, 2019 A 2032 (Miles de millones de USD)
    FIGURA 111. MERCADO DE RECIERRES MONOFÁSICOS, POR FUNCIÓN, 2024 (% DE PARTICIPACIÓN)
    FIGURA 112. MERCADO DE RECIERRES MONOFÁSICOS, POR FUNCIÓN, 2019 A 2032 (Miles de millones de dólares)
    FIGURA 113. MERCADO DE RECONECTADORES MONOFÁSICOS, POR TIPO DE INSTALACIÓN, 2024 (% DE PARTICIPACIÓN)
    FIGURA 114. MERCADO DE RECONECTADORES MONOFÁSICOS, POR TIPO DE INSTALACIÓN, 2019 A 2032 (Miles de millones de USD)
    FIGURA 115. MERCADO DE RECONECTADORES MONOFÁSICOS , POR REGIONALES, 2024 (% DE PARTICIPACIÓN)
    GRÁFICO 116. MERCADO DE RECLOSEADORES MONOFÁSICOS, POR REGIONAL, 2019 A 2032 (Miles de millones de USD)
    GRÁFICO 117. COMPARACIÓN DE LOS PRINCIPALES COMPETIDORES

    Segmentación del mercado de reconectadores monofásicos

    • Mercado de reconectadores monofásicos por clasificación de voltaje (miles de millones de dólares, 2019-2032)

      • 12kV

      • 15kV

      • 27kV

      • 38kV


    • Mercado de reconectadores monofásicos por función (miles de millones de dólares, 2019-2032)

      • Protección

      • Controlar

      • Monitoreo


    • Mercado de reconectadores monofásicos por tipo de instalación (miles de millones de dólares, 2019-2032)

      • Gastos generales

      • Subterráneo

      • Montado en pedestal


    • Mercado de reconectadores monofásicos por región (miles de millones de dólares, 2019-2032)

      • América del Norte

      • Europa

      • América del Sur

      • Asia Pacífico

      • Oriente Medio y África


    Perspectiva regional del mercado de reconectadores monofásicos (miles de millones de dólares, 2019-2032)


    • Perspectivas de América del Norte (miles de millones de dólares, 2019-2032)

      • Mercado de reconectadores monofásicos de América del Norte por tipo de clasificación de voltaje

        • 12kV

        • 15kV

        • 27kV

        • 38kV

      • Mercado de reconectadores monofásicos de América del Norte por tipo de función

        • Protección

        • Controlar

        • Monitoreo

      • Mercado de reconectadores monofásicos de América del Norte por tipo de instalación

        • Gastos generales

        • Subterráneo

        • Montado en pedestal

      • Mercado de reconectadores monofásicos de América del Norte por tipo regional

        • EE.UU.

        • Canadá

      • Perspectivas de EE. UU. (miles de millones de dólares, 2019-2032)

      • Mercado de reconectadores monofásicos de EE. UU. por tipo de tensión nominal

        • 12kV

        • 15kV

        • 27kV

        • 38kV

      • Mercado de reconectadores monofásicos de EE. UU. por tipo de función

        • Protección

        • Controlar

        • Monitoreo

      • Mercado de reconectadores monofásicos de EE. UU. por tipo de instalación

        • Gastos generales

        • Subterráneo

        • Montado en pedestal

      • Perspectivas de CANADÁ (miles de millones de dólares, 2019-2032)

      • Mercado de reconectadores monofásicos de CANADÁ por tipo de clasificación de voltaje

        • 12kV

        • 15kV

        • 27kV

        • 38kV

      • Mercado de reconectadores monofásicos de CANADÁ por tipo de función

        • Protección

        • Controlar

        • Monitoreo

      • Mercado de reconectadores monofásicos de CANADÁ por tipo de instalación

        • Gastos generales

        • Subterráneo

        • Montado en pedestal

    • Perspectivas de Europa (miles de millones de dólares, 2019-2032)

      • Mercado europeo de reconectadores monofásicos por tipo de tensión nominal

        • 12kV

        • 15kV

        • 27kV

        • 38kV

      • Mercado europeo de reconectadores monofásicos por tipo de función

        • Protección

        • Controlar

        • Monitoreo

      • Mercado europeo de reconectadores monofásicos por tipo de instalación

        • Gastos generales

        • Subterráneo

        • Montado en pedestal

      • Mercado europeo de reconectadores monofásicos por tipo regional

        • Alemania

        • Reino Unido

        • Francia

        • Rusia

        • Italia

        • España

        • Resto de Europa

      • Perspectivas de ALEMANIA (miles de millones de dólares, 2019-2032)

      • Mercado de reconectadores monofásicos en ALEMANIA por tipo de tensión nominal

        • 12kV

        • 15kV

        • 27kV

        • 38kV

      • Mercado de reconectadores monofásicos en ALEMANIA por tipo de función

        • Protección

        • Controlar

        • Monitoreo

      • Mercado de reconectadores monofásicos en ALEMANIA por tipo de instalación

        • Gastos generales

        • Subterráneo

        • Montado en pedestal

      • Perspectivas del Reino Unido (miles de millones de dólares, 2019-2032)

      • Mercado de reconectadores monofásicos del Reino Unido por tipo de tensión nominal

        • 12kV

        • 15kV

        • 27kV

        • 38kV

      • Mercado de reconectadores monofásicos del Reino Unido por tipo de función

        • Protección

        • Controlar

        • Monitoreo

      • Mercado de reconectadores monofásicos del Reino Unido por tipo de instalación

        • Gastos generales

        • Subterráneo

        • Montado en pedestal

      • Perspectivas de FRANCIA (miles de millones de dólares, 2019-2032)

      • Mercado de reconectadores monofásicos en FRANCIA por tipo de tensión nominal

        • 12kV

        • 15kV

        • 27kV

        • 38kV

      • Mercado de reconectadores monofásicos en FRANCIA por tipo de función

        • Protección

        • Controlar

        • Monitoreo

      • Mercado de reconectadores monofásicos en FRANCIA por tipo de instalación

        • Gastos generales

        • Subterráneo

        • Montado en pedestal

      • Perspectivas de RUSIA (miles de millones de dólares, 2019-2032)

      • Mercado de reconectadores monofásicos de Rusia por tipo de clasificación de voltaje

        • 12kV

        • 15kV

        • 27kV

        • 38kV

      • Mercado de reconectadores monofásicos de RUSIA por tipo de función

        • Protección

        • Controlar

        • Monitoreo

      • Mercado de reconectadores monofásicos de Rusia por tipo de instalación

        • Gastos generales

        • Subterráneo

        • Montado en pedestal

      • Perspectivas de ITALIA (miles de millones de dólares, 2019-2032)

      • Mercado de reconectadores monofásicos de ITALIA por tipo de clasificación de voltaje

        • 12kV

        • 15kV

        • 27kV

        • 38kV

      • Mercado de reconectadores monofásicos de ITALIA por tipo de función

        • Protección

        • Controlar

        • Monitoreo

      • Mercado de reconectadores monofásicos de ITALIA por tipo de instalación

        • Gastos generales

        • Subterráneo

        • Montado en pedestal

      • Perspectivas de ESPAÑA (Miles de millones de dólares, 2019-2032)

      • Mercado de reconectadores monofásicos en ESPAÑA por tipo de tensión nominal

        • 12kV

        • 15kV

        • 27kV

        • 38kV

      • Mercado de reconectadores monofásicos en ESPAÑA por tipo de función

        • Protección

        • Controlar

        • Monitoreo

      • Mercado de reconectadores monofásicos en ESPAÑA por tipo de instalación

        • Gastos generales

        • Subterráneo

        • Montado en pedestal

      • Perspectivas DEL RESTO DE EUROPA (Miles de millones de dólares, 2019-2032)

      • Mercado de reconectadores monofásicos del RESTO DE EUROPA por tipo de tensión nominal

        • 12kV

        • 15kV

        • 27kV

        • 38kV

      • RESTO DE EUROPA Mercado de reconectadores monofásicos por tipo de función

        • Protección

        • Controlar

        • Monitoreo

      • Mercado de reconectadores monofásicos del RESTO DE EUROPA por tipo de instalación

        • Gastos generales

        • Subterráneo

        • Montado en pedestal

    • Perspectivas de Asia Pacífico (miles de millones de dólares, 2019-2032)

      • Mercado de reconectadores monofásicos de APAC por tipo de clasificación de voltaje

        • 12kV

        • 15kV

        • 27kV

        • 38kV

      • Mercado de reconectadores monofásicos de APAC por tipo de función

        • Protección

        • Controlar

        • Monitoreo

      • Mercado de reconectadores monofásicos de APAC por tipo de instalación

        • Gastos generales

        • Subterráneo

        • Montado en pedestal

      • Mercado de reconectadores monofásicos de APAC por tipo regional

        • China

        • India

        • Japón

        • Corea del Sur

        • Malasia

        • Tailandia

        • Indonesia

        • Resto de APAC

      • Perspectivas de CHINA (miles de millones de dólares, 2019-2032)

      • Mercado de reconectadores monofásicos de CHINA por tipo de clasificación de voltaje

        • 12kV

        • 15kV

        • 27kV

        • 38kV

      • Mercado de reconectadores monofásicos de CHINA por tipo de función

        • Protección

        • Controlar

        • Monitoreo

      • Mercado de reconectadores monofásicos de CHINA por tipo de instalación

        • Gastos generales

        • Subterráneo

        • Montado en pedestal

      • Perspectivas de la INDIA (miles de millones de dólares, 2019-2032)

      • Mercado de reconectadores monofásicos de INDIA por tipo de clasificación de voltaje

        • 12kV

        • 15kV

        • 27kV

        • 38kV

      • Mercado de reconectadores monofásicos de INDIA por tipo de función

        • Protección

        • Controlar

        • Monitoreo

      • Mercado de reconectadores monofásicos de INDIA por tipo de instalación

        • Gastos generales

        • Subterráneo

        • Montado en pedestal

      • Perspectivas de JAPÓN (miles de millones de dólares, 2019-2032)

      • Mercado de reconectadores monofásicos de Japón por tipo de clasificación de voltaje

        • 12kV

        • 15kV

        • 27kV

        • 38kV

      • Mercado de reconectadores monofásicos de Japón por tipo de función

        • Protección

        • Controlar

        • Monitoreo

      • Mercado de reconectadores monofásicos de Japón por tipo de instalación

        • Gastos generales

        • Subterráneo

        • Montado en pedestal

      • Perspectivas de COREA DEL SUR (miles de millones de dólares, 2019-2032)

      • Mercado de reconectadores monofásicos de COREA DEL SUR por tipo de clasificación de voltaje

        • 12kV

        • 15kV

        • 27kV

        • 38kV

      • Mercado de reconectadores monofásicos de COREA DEL SUR por tipo de función

        • Protección

        • Controlar

        • Monitoreo

      • Marca de reconectador monofásico de COREA DEL SURy por tipo de instalación

        • Gastos generales

        • Subterráneo

        • Montado en pedestal

      • Perspectivas de MALASIA (miles de millones de dólares, 2019-2032)

      • Mercado de reconectadores monofásicos de MALASIA por tipo de clasificación de voltaje

        • 12kV

        • 15kV

        • 27kV

        • 38kV

      • Mercado de reconectadores monofásicos de MALASIA por tipo de función

        • Protección

        • Controlar

        • Monitoreo

      • Mercado de reconectadores monofásicos de MALASIA por tipo de instalación

        • Gastos generales

        • Subterráneo

        • Montado en pedestal

      • Perspectivas de TAILANDIA (miles de millones de dólares, 2019-2032)

      • Mercado de reconectadores monofásicos de TAILANDIA por tipo de clasificación de voltaje

        • 12kV

        • 15kV

        • 27kV

        • 38kV

      • Mercado de reconectadores monofásicos de TAILANDIA por tipo de función

        • Protección

        • Controlar

        • Monitoreo

      • Mercado de reconectadores monofásicos de TAILANDIA por tipo de instalación

        • Gastos generales

        • Subterráneo

        • Montado en pedestal

      • Perspectivas de INDONESIA (miles de millones de dólares, 2019-2032)

      • Mercado de reconectadores monofásicos de INDONESIA por tipo de clasificación de voltaje

        • 12kV

        • 15kV

        • 27kV

        • 38kV

      • Mercado de reconectadores monofásicos de INDONESIA por tipo de función

        • Protección

        • Controlar

        • Monitoreo

      • Mercado de reconectadores monofásicos de INDONESIA por tipo de instalación

        • Gastos generales

        • Subterráneo

        • Montado en pedestal

      • Perspectivas del RESTO DE APAC (miles de millones de dólares, 2019-2032)

      • RESTO DEL Mercado de reconectadores monofásicos de APAC por tipo de clasificación de voltaje

        • 12kV

        • 15kV

        • 27kV

        • 38kV

      • RESTO DEL Mercado de reconectadores monofásicos de APAC por tipo de función

        • Protección

        • Controlar

        • Monitoreo

      • RESTO DEL Mercado de reconectadores monofásicos de APAC por tipo de instalación

        • Gastos generales

        • Subterráneo

        • Montado en pedestal

    • Perspectivas de América del Sur (miles de millones de dólares, 2019-2032)

      • Mercado de reconectadores monofásicos de América del Sur por tipo de clasificación de voltaje

        • 12kV

        • 15kV

        • 27kV

        • 38kV

      • Mercado de reconectadores monofásicos de América del Sur por tipo de función

        • Protección

        • Controlar

        • Monitoreo

      • Mercado de reconectadores monofásicos de América del Sur por tipo de instalación

        • Gastos generales

        • Subterráneo

        • Montado en pedestal

      • Mercado de reconectadores monofásicos de América del Sur por tipo regional

        • Brasil

        • México

        • Argentina

        • Resto de Sudamérica

      • Perspectivas de BRASIL (miles de millones de dólares, 2019-2032)

      • Mercado de reconectadores monofásicos de BRASIL por tipo de clasificación de voltaje

        • 12kV

        • 15kV

        • 27kV

        • 38kV

      • Mercado de reconectadores monofásicos en BRASIL por tipo de función

        • Protección

        • Controlar

        • Monitoreo

      • Mercado de reconectadores monofásicos en BRASIL por tipo de instalación

        • Gastos generales

        • Subterráneo

        • Montado en pedestal

      • Perspectivas de MÉXICO (Miles de millones de dólares, 2019-2032)

      • Mercado de Reconectadores Monofásicos en MÉXICO por Tipo de Clasificación de Voltaje

        • 12kV

        • 15kV

        • 27kV

        • 38kV

      • Mercado de reconectadores monofásicos en MÉXICO por tipo de función

        • Protección

        • Controlar

        • Monitoreo

      • Mercado de Reconectadores Monofásicos en MÉXICO por Tipo de Instalación

        • Gastos generales

        • Subterráneo

        • Montado en pedestal

      • Perspectivas de ARGENTINA (Miles de millones de dólares, 2019-2032)

      • Mercado ARGENTINA de reconectadores monofásicos por tipo de tensión nominal

        • 12kV

        • 15kV

        • 27kV

        • 38kV

      • Mercado de reconectadores monofásicos en ARGENTINA por tipo de función

        • Protección

        • Controlar

        • Monitoreo

      • Mercado ARGENTINA de reconectadores monofásicos por tipo de instalación

        • Gastos generales

        • Subterráneo

        • Montado en pedestal

      • Perspectivas RESTO DE AMÉRICA DEL SUR (Miles de millones de dólares, 2019-2032)

      • RESTO DE AMÉRICA DEL SUR Mercado de reconectadores monofásicos por tipo de clasificación de voltaje

        • 12kV

        • 15kV

        • 27kV

        • 38kV

      • RESTO DE AMÉRICA DEL SUR Mercado de reconectadores monofásicos por tipo de función

        • Protección

        • Controlar

        • Monitoreo

      • RESTO DE AMÉRICA DEL SUR Mercado de reconectadores monofásicos por tipo de instalación

        • Gastos generales

        • Subterráneo

        • Montado en pedestal

    • Perspectivas MEA (miles de millones de dólares, 2019-2032)

      • Mercado de reconectadores monofásicos MEA por tipo de clasificación de voltaje

        • 12kV

        • 15kV

        • 27kV

        • 38kV

      • Mercado de reconectadores monofásicos MEA por tipo de función

        • Protección

        • Controlar

        • Monitoreo

      • Mercado de reconectadores monofásicos MEA por tipo de instalación

        • Gastos generales

        • Subterráneo

        • Montado en pedestal

      • Mercado de reconectadores monofásicos MEA por tipo regional

        • Países del CCG

        • Sudáfrica

        • Resto de MEA

      • Perspectivas de los PAÍSES del CCG (miles de millones de dólares, 2019-2032)

      • Mercado de reconectadores monofásicos de los países del CCG por tipo de clasificación de voltaje

        • 12kV

        • 15kV

        • 27kV

        • 38kV

      • Mercado de reconectadores monofásicos de los países del CCG por tipo de función

        • Protección

        • Controlar

        • Monitoreo

      • Mercado de reconectadores monofásicos de los países del CCG por tipo de instalación

        • Gastos generales

        • Subterráneo

        • Montado en pedestal

      • Perspectivas de SUDÁFRICA (miles de millones de dólares, 2019-2032)

      • Mercado de reconectadores monofásicos de SUDÁFRICA por tipo de clasificación de voltaje

        • 12kV

        • 15kV

        • 27kV

        • 38kV

      • Mercado de reconectadores monofásicos de SUDÁFRICA por tipo de función

        • Protección

        • Controlar

        • Monitoreo

      • Mercado de reconectadores monofásicos de SUDÁFRICA por tipo de instalación

        • Gastos generales

        • Subterráneo

        • Montado en pedestal

      • Perspectivas del RESTO DE MEA (miles de millones de dólares, 2019-2032)

      • RESTO DEL Mercado de reconectadores monofásicos de MEA por tipo de clasificación de voltaje

        • 12kV

        • 15kV

        • 27kV

        • 38kV

      • RESTO DEL Mercado de reconectadores monofásicos de MEA por tipo de función

        • Protección

        • Controlar

        • Monitoreo

      • Mercado del RESTO DE Reconectadores monofásicos de MEA por tipo de instalación

        • Gastos generales

        • Subterráneo

        • Montado en pedestal

    Report Infographic
    Free Sample Request

    Kindly complete the form below to receive a free sample of this Report

    Customer Strories

    “I am very pleased with how market segments have been defined in a relevant way for my purposes (such as "Portable Freezers & refrigerators" and "last-mile"). In general the report is well structured. Thanks very much for your efforts.”

    Victoria Milne Founder
    Case Study

    Chemicals and Materials