• Cat-intel
  • MedIntelliX
  • Resources
  • About Us
  • Request Free Sample ×

    Kindly complete the form below to receive a free sample of this Report

    Leading companies partner with us for data-driven Insights

    clients tt-cursor

    Fire Tube Chemical Boiler Market

    ID: MRFR/E&P/29942-HCR
    128 Pages
    Priya Nagrale
    September 2025

    Informe de investigación de mercado de calderas pirotubulares químicas por tipo de caldera (calderas pirotubulares de baja presión, calderas pirotubulares de alta presión, calderas pirotubulares modulares), por tipo de combustible (gas natural, petróleo, biomasa, carbón, electricidad), por aplicación industrial (Fabricación de productos químicos, procesamiento de alimentos, industria textil, papel y pulpa, productos farmacéuticos), por sistema de control (control manual, control semiautomático, control totalmente automático), por tipo de ins...

    Share:
    Download PDF ×

    We do not share your information with anyone. However, we may send you emails based on your report interest from time to time. You may contact us at any time to opt-out.

    Fire Tube Chemical Boiler Market Research Report — Global Forecast till 2032 Infographic
    Purchase Options
    $ 4.950,0
    $ 5.950,0
    $ 7.250,0
    Table of Contents

    Descripción general del mercado de calderas químicas de tubo de fuego:

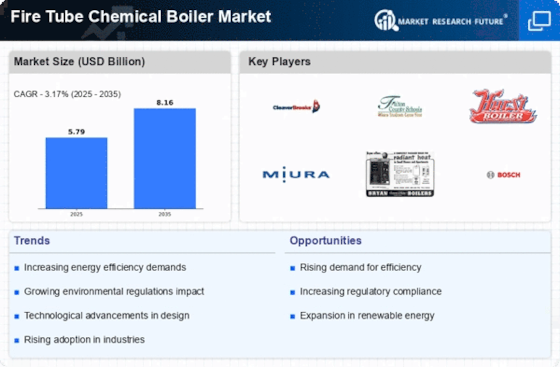
    Según el análisis de MRFR, el tamaño del mercado de calderas químicas de tubos de fuego se estimó en 5,27 (mil millones de dólares) en 2022. Se espera que la industria del mercado de calderas químicas de tubos de fuego crezca de 5,44 (mil millones de dólares) en 2023 a 7,2 (mil millones de dólares). ) para 2032. Se espera que la CAGR (tasa de crecimiento) del mercado de calderas químicas de tubos de fuego sea de alrededor del 3,17% durante el pronóstico. período (2024 - 2032).

    Se destacan las tendencias clave del mercado de calderas químicas pirotubulares

    El Mercado Global de Calderas Químicas de Tubos de Fuego está significativamente influenciado por varios impulsores clave del mercado que dan forma a su trayectoria de crecimiento. La creciente demanda de soluciones de calefacción energéticamente eficientes y respetuosas con el medio ambiente es un factor principal a medida que las empresas y las industrias de todo el mundo impulsan iniciativas de sostenibilidad. Además, la expansión de sectores industriales como el químico, el farmacéutico y el de procesamiento de alimentos ha creado una mayor necesidad de sistemas de calderas confiables, particularmente en regiones donde estándares regulatorios estrictos rigen las emisiones y el consumo de energía. Los avances tecnológicos también han impulsado el mercado, ya que los fabricantes se están centrando en el diseño de calderas que ofrecen mayor eficiencia y costos operativos reducidos, mejorando aún más su atractivo para los usuarios finales. Las oportunidades en el mercado global de calderas químicas pirotubulares están aumentando, particularmente a medida que las empresas buscan modernizar la infraestructura existente para cumplir con las nuevas regulaciones ambientales. El cambio hacia fuentes de energía renovables presenta una oportunidad para que los fabricantes innoven e incorporen sistemas híbridos que puedan utilizar tanto combustibles tradicionales como biocombustibles, atrayendo así una base de clientes más amplia. Además, los mercados en expansión en las regiones en desarrollo presentan vías lucrativas para el crecimiento, ya que estas áreas requieren cada vez más soluciones de calefacción industrial para respaldar sus economías en evolución.

    Las tendencias recientes indican un claro movimiento hacia tecnologías inteligentes, con la integración de IoT y la automatización impulsando la evolución del mercado. Este cambio permite un mejor monitoreo y control de los sistemas de calderas, mejorando la eficiencia operativa y reduciendo el tiempo de inactividad. Además, el creciente énfasis en el mantenimiento predictivo a través del análisis de datos significa un punto de inflexión que permite a los operadores reducir los costos asociados con fallas inesperadas. A medida que el mercado continúa evolucionando, la adaptabilidad y la innovación serán primordiales para las partes interesadas que buscan capitalizar el panorama dinámico del Mercado Global de Calderas Químicas de Tubos de Fuego.

    Descripción general del mercado de calderas químicas pirotubulares

    Fuente: investigación primaria, investigación secundaria, base de datos MRFR y revisión de analistas

    Impulsores del mercado de calderas químicas pirotubulares

    Creciente demanda de soluciones energéticas eficientes

    La industria del mercado mundial de calderas químicas de tubos pirotubulares está experimentando un crecimiento significativo debido a la creciente demanda de soluciones energéticas eficientes en varios sectores, incluida la fabricación, la generación de energía y el procesamiento químico. A medida que las industrias continúan buscando formas de reducir su huella de carbono y sus costos operativos, las calderas pirotubulares se han convertido en una opción preferida. Estos sistemas son reconocidos por su capacidad para proporcionar alta eficiencia térmica y confiabilidad, lo que los hace ideales para aplicaciones que requieren vapor y calor constantes. Esta tendencia se ve respaldada aún más por el creciente enfoque en la sostenibilidad y la necesidad de regulaciones estrictas sobre emisiones, lo que impulsa la adopción de Tecnologías avanzadas de calderas. La continua evolución de los procesos de fabricación para cumplir con estándares innovadores requiere la utilización de sistemas de calderas de última generación, lo que contribuye a la expansión del mercado. Además, a medida que las empresas se esfuerzan por alcanzar sus objetivos de eficiencia energética, se espera que aumente la demanda de soluciones del mercado global de calderas químicas pirotubulares. Las empresas invierten cada vez más en mejorar sus instalaciones, pasando de sistemas obsoletos a calderas pirotubulares de alto rendimiento que ofrecen características y capacidades avanzadas. La creciente competencia en diversas industrias también obliga a las organizaciones a optimizar su uso de energía, impulsando así el crecimiento del mercado. En general, el creciente enfoque en la eficiencia energética y la búsqueda de prácticas sostenibles marcan este impulsor como un factor fundamental que contribuye a la trayectoria ascendente del mercado global de calderas químicas pirotubulares.

    Aumento de la industrialización y la urbanización

    La rápida industrialización y urbanización presenciadas a nivel mundial han contribuido significativamente al crecimiento de la industria del mercado global de calderas químicas de tubos de fuego. A medida que las economías en desarrollo continúan expandiéndose, existe una necesidad cada vez mayor de soluciones eficientes de calefacción y generación de vapor. Industrias como la textil, la de procesamiento de alimentos y la farmacéutica requieren sistemas de calderas confiables para respaldar sus procesos de producción. Con la expansión de los centros urbanos, la demanda de industrias con uso intensivo de energía está avanzando, lo que lleva a una mayor utilización de calderas pirotubulares. Esta demanda se ve agravada por el aumento de la población y los habitantes urbanos que requieren un acceso constante a la energía y al calor. A medida que las industrias evolucionan, la necesidad de sistemas de calderas robustos adaptados a requisitos operativos específicos se vuelve más pronunciada, fomentando la expansión continua del mercado.

    Avances tecnológicos en el diseño de calderas

    Los avances tecnológicos en el diseño y la fabricación de calderas están sirviendo como un impulsor crucial para la industria del mercado global de calderas químicas pirotubulares. Las innovaciones en sistemas de control, materiales y tecnologías de combustión mejoran la eficiencia y confiabilidad de las calderas pirotubulares. Los diseños modernos incorporan características fáciles de usar, como sistemas de control automatizados que facilitan la operación y el monitoreo sin problemas. A medida que las industrias priorizan la adopción de tecnologías de vanguardia para una operación sustentable, se amplifica la importancia de las calderas de alto rendimiento que cumplen con las regulaciones ambientales. Este impulso hacia tecnologías más inteligentes y eficientes está preparado para mejorar el posicionamiento competitivo de las calderas pirotubulares, convirtiéndolas en las opción preferida en varios sectores.

    Perspectivas del segmento de mercado de calderas químicas de tubo de fuego:

    Perspectivas sobre el tipo de caldera del mercado de calderas químicas de tubos pirotubulares

    El mercado mundial de calderas químicas pirotubulares ha experimentado un crecimiento significativo dentro de su segmento de tipo de caldera, y se espera que alcance una valoración de mercado total de 5,44 mil millones de dólares en 2023. La segmentación revela tres categorías destacadas: calderas pirotubulares de baja presión, calderas pirotubulares de alta presión. Calderas pirotubulares a presión y calderas pirotubulares modulares, cada una de las cuales contribuye de forma única al panorama general del mercado. Destaca el segmento de calderas pirotubulares de baja presión con un valor de 2,2 mil millones de dólares en 2023, lo que indica su participación mayoritaria en el mercado. Este segmento es vital debido a sus aplicaciones versátiles en diversas industrias, proporcionando instalaciones más simples y costos operativos más bajos, lo que atrae a muchas empresas.

    En comparación, el segmento de calderas pirotubulares de alta presión está valorado en 2000 millones de dólares en 2023. Este segmento es importante ya que atiende a industrias que requieren capacidades de calefacción más sólidas, como la generación de energía y la fabricación pesada. La demanda de calderas eficientes y de alta capacidad en estos sectores ayuda a este segmento a mantener una fuerte relevancia en el mercado y una viabilidad competitiva.

    Por último, el segmento de calderas pirotubulares modulares, valorado en 1,24 mil millones de dólares en 2023, está ganando terreno debido a su flexibilidad y diseños que ahorran espacio, lo que permite una rápida implementación y ajuste según las necesidades operativas. Aunque ocupa la posición menos dominante entre los tres, su creciente adopción tanto en aplicaciones industriales como comerciales indica una tendencia positiva dentro del mercado, lo que la convierte en un área de oportunidad a medida que las empresas buscan optimizar su uso de energía.

    En general, el segmento de tipo de caldera dentro del mercado global de calderas químicas de tubos de fuego se caracteriza por su diversidad y adaptabilidad. La combinación de estos segmentos refleja las tendencias actuales de eficiencia, ahorro de energía y personalización para satisfacer las diversas necesidades de las industrias en todo el mundo. Si bien las calderas pirotubulares de baja presión dominan actualmente el mercado con sus ingresos sustanciales, el crecimiento continuo de las calderas pirotubulares modulares y de alta presión indica un panorama en evolución con importantes oportunidades por delante, respaldado por la expansión proyectada del mercado hasta 2032. Los impulsores del crecimiento incluyen avances tecnológicos , el aumento de las regulaciones sobre eficiencia energética y un creciente énfasis en la sostenibilidad, mientras que pueden surgir desafíos debido a las fluctuaciones en los costos de las materias primas y la competencia de tecnologías de calderas alternativas. En general, estas dinámicas proporcionan una instantánea completa del segmento de tipo de caldera del mercado global de calderas químicas de tubos de fuego y su potencial futuro.

    Perspectivas sobre el tipo de caldera del mercado de calderas químicas pirotubulares

    Fuente: investigación primaria, investigación secundaria, base de datos MRFR y revisión de analistas

    Información sobre el tipo de combustible del mercado de calderas químicas pirotubulares

    El Mercado Global de Calderas Químicas de Tubos de Fuego está fundamentalmente influenciado por su segmento de Tipo de Combustible, que abarca varias fuentes de energía integrales para su operación. En 2023, el mercado total estaba valorado en 5.440 millones de dólares, lo que refleja una demanda constante impulsada por la necesidad de soluciones eficientes de energía térmica. El segmento se caracteriza por el uso significativo de Gas Natural, que a menudo lidera la participación mayoritaria debido a sus propiedades de combustión más limpia y menores emisiones en comparación con otros combustibles. El petróleo sigue siendo una alternativa crucial, particularmente en regiones donde la infraestructura de gas natural es limitada. La biomasa está ganando terreno como solución sostenible, lo que refleja el cambio global hacia fuentes de energía renovables. Mientras tanto, el carbón sigue desempeñando un papel en muchas aplicaciones industriales, impulsado por su disponibilidad y menor costo, aunque enfrenta desafíos derivados de estrictas regulaciones ambientales. La electricidad como tipo de combustible presenta oportunidades en aplicaciones específicas, especialmente en instalaciones que priorizan las bajas emisiones. Cada tipo de combustible presenta ventajas y desafíos únicos, lo que contribuye a la diversa dinámica del mercado mundial de calderas químicas pirotubulares, que se prevé que alcance los 7200 millones de dólares en 2032. El crecimiento continuo de este mercado está respaldado por la creciente necesidad de combustibles eficientes desde el punto de vista energético. sistemas y al mismo tiempo equilibrar las preocupaciones sobre sostenibilidad y las presiones regulatorias.

    Información sobre aplicaciones industriales del mercado de calderas químicas de tubos de fuego

    Se prevé que el mercado mundial de calderas químicas pirotubulares tendrá un valor de 5,44 mil millones de dólares en 2023, lo que muestra una actividad significativa en diversas aplicaciones industriales. Sectores clave como la fabricación de productos químicos, el procesamiento de alimentos, la industria textil, el papel y la pulpa y los productos farmacéuticos contribuyen de manera destacada a la dinámica general del mercado. El sector de fabricación de productos químicos desempeña un papel vital debido a su necesidad de soluciones de calefacción eficientes para facilitar las reacciones químicas, mientras que la industria de procesamiento de alimentos requiere fuentes de calor confiables para los procesos de esterilización y cocción. La industria textil depende en gran medida de las calderas para la generación de vapor, lo cual es esencial. en teñido y procesamiento de telas. Asimismo, el sector del papel y la celulosa demuestra una demanda sustancial de un suministro constante de vapor durante la producción. Por último, el sector farmacéutico pone énfasis en un estricto control de la temperatura, donde las calderas pirotubulares se vuelven fundamentales para garantizar la seguridad y eficacia del producto. como la marcaSi continúa evolucionando, comprender los ingresos del mercado global de calderas químicas de tubos de fuego y su segmentación se vuelve crucial para las partes interesadas que buscan capitalizar las oportunidades de crecimiento que presentan estas industrias. Los datos indican que segmentos particulares tienen una participación de mercado significativa e impulsan innovaciones, mejorando la eficiencia operativa general. en los procesos productivos.

    Perspectivas del sistema de control del mercado de calderas químicas de tubos de fuego

    El segmento de sistemas de control del mercado global de calderas químicas pirotubulares desempeña un papel crucial en la mejora de la eficiencia operativa y la seguridad. Con un mercado valorado en 5.440 millones de dólares en 2023, este segmento es vital para gestionar eficazmente el funcionamiento de las calderas pirotubulares. El mercado se caracteriza por la presencia de diversas metodologías de control, incluido el control manual, el control semiautomático y el control totalmente automático. Los sistemas de Control Manual permiten a los operadores la intervención directa, lo que resulta beneficioso en entornos que requieren ajustes constantes; sin embargo, exigen una participación significativa del operador. Por otro lado, los sistemas de control semiautomático brindan un enfoque equilibrado, que permite a los operadores administrar las operaciones de la caldera con un grado de automatización, mejorando así la productividad y al mismo tiempo requiriendo cierto nivel de supervisión manual. Los sistemas de control totalmente automático son cada vez más importantes ya que minimizan el error humano y optimizan el rendimiento a través de tecnologías avanzadas de monitoreo y control, impulsando el crecimiento del mercado. Cada una de estas funcionalidades aborda diferentes necesidades operativas y, a medida que el mercado global de calderas químicas pirotubulares continúa evolucionando, es probable que la tendencia hacia la automatización gane impulso, presentando oportunidades de innovación y mayor eficiencia en toda la industria.

    Información sobre el tipo de instalación del mercado de calderas químicas de tubos pirotubulares

    El mercado global de calderas químicas pirotubulares abarca varios tipos de instalación que desempeñan un papel crucial en el panorama de la industria, centrándose tanto en la instalación en interiores como en exteriores. El mercado general estaba valorado en 5,44 mil millones de dólares en 2023 y se proyecta que crecerá significativamente para 2032. La instalación en interiores generalmente se beneficia de una mayor eficiencia energética y optimización del espacio, lo que la convierte en la opción preferida en entornos urbanos donde el espacio es escaso. Este segmento domina debido a su adaptabilidad a una amplia gama de aplicaciones, desde industrias de pequeña escala hasta plantas de fabricación más grandes. Mientras tanto, la instalación en exteriores atiende a instalaciones que requieren soluciones sólidas a factores ambientales, ampliando así las capacidades operativas sin el obstáculo de las limitaciones del espacio interior. La diversidad de tipos de instalaciones impulsa la innovación en la tecnología de calderas, lo que conduce a una mayor confiabilidad y reducción de emisiones. A medida que las empresas buscan cada vez más soluciones térmicas sostenibles y eficientes, estos segmentos contribuyen a la expansión general de los ingresos y el crecimiento del mercado del mercado global de calderas químicas de tubos de fuego. La combinación de estos factores resalta cuán crítico es el segmento de Tipo de instalación dentro de las estadísticas más amplias del Mercado Global de Calderas Químicas de Tubos de Fuego y el análisis de segmentación, lo que revela oportunidades clave para las partes interesadas e inversores por igual.

    Perspectivas regionales del mercado de calderas químicas de tubos pirotubulares

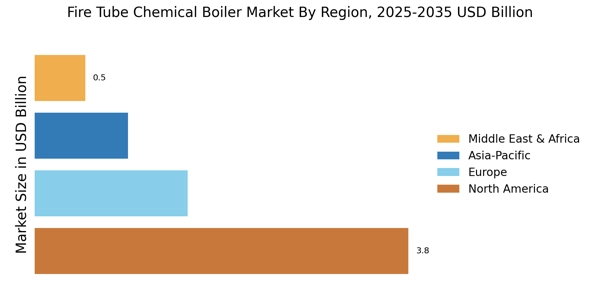
    Se espera que los ingresos del mercado mundial de calderas químicas pirotubulares reflejen un crecimiento significativo en varios segmentos regionales de 2023 a 2032. En 2023, el mercado estaba valorado en 5,44 mil millones de dólares, América del Norte representaba 1,65 mil millones de dólares y Europa 1,55 mil millones. Miles de millones de dólares, indicando su mayor participación. Asia-Pacífico ocupa una posición destacada con una valoración de 1,8 mil millones de dólares, lo que demuestra su importancia debido a la alta actividad industrial y la demanda de eficiencia energética. El subsegmento de Medio Oriente y África reportó una valoración más pequeña pero creciente de 0,19 mil millones de dólares, destacando oportunidades emergentes, mientras que América del Sur contribuyó con 0,25 mil millones de dólares, lo que indica una presencia de mercado significativa pero menor. Para 2032, se prevé que América del Norte crezca a 2,1 Miles de millones de dólares, dominando debido a la tecnología avanzada y el desarrollo de infraestructura. Se espera que Europa alcance los 1,9 mil millones de dólares, impulsada por estrictas regulaciones energéticas y tendencias de sostenibilidad. El sólido crecimiento en la región de Asia y el Pacífico con 2,25 mil millones de dólares muestra su demanda en sectores industriales en rápida expansión. En general, la segmentación del mercado global de calderas químicas de tubos de fuego ilustra distintos niveles de potencial de crecimiento influenciados por los desarrollos regionales y las demandas industriales, presentando desafíos y oportunidades para las partes interesadas.

    Perspectivas regionales del mercado de calderas químicas pirotubulares

    Fuente: investigación primaria, investigación secundaria, base de datos MRFR y revisión de analistas

    Caldera química de tubo de fuego Jugadores clave del mercado e información competitiva:

    Los conocimientos competitivos del mercado mundial de calderas químicas pirotubulares revelan un panorama dinámico impulsado por avances tecnológicos, cambios regulatorios y un enfoque cada vez mayor en la eficiencia energética y la sostenibilidad. A medida que las industrias continúan expandiéndose y evolucionando, ha aumentado la demanda de soluciones de calefacción eficientes, incluidas las calderas químicas pirotubulares. El campo competitivo presenta fabricantes que varían en tamaño y especialización, cada uno de los cuales se esfuerza por innovar y capturar una participación de mercado considerable. El mercado se caracteriza por una competencia rigurosa, impulsada por la necesidad de calificaciones de eficiencia más altas, mejor desempeño y cumplimiento de estándares ambientales. Factores como la diferenciación de productos, la presencia geográfica, las estrategias de precios y las relaciones con los clientes desempeñan un papel importante en la configuración de la dinámica competitiva. Raypak ha establecido una presencia significativa en el mercado global de calderas químicas pirotubulares, reconocido por su compromiso con la calidad y la confiabilidad. La empresa se ha ganado la reputación de producir calderas pirotubulares de alta eficiencia diseñadas para un rendimiento óptimo en diversas aplicaciones, incluidos los sectores comercial e industrial. A través de una inversión continua en investigación y desarrollo, Raypak ha introducido características innovadoras que mejoran la eficiencia del sistema, reducen las emisiones y mejoran la facilidad de mantenimiento, estableciendo un punto de referencia para los competidores. La fortaleza de Raypak radica en su extensa red de distribución y sólidas relaciones con los clientes, lo que le permite satisfacer las demandas de los clientes en diversos mercados de manera efectiva. Al centrarse en soluciones centradas en el cliente, Raypak mantiene una ventaja competitiva y contribuye significativamente al crecimiento del segmento de calderas pirotubulares. Lattner Boiler es otro actor formidable dentro del mercado global de calderas químicas pirotubulares, conocido por su legado de excelencia en ingeniería y solidez. actuación. La empresa se destaca por ofrecer soluciones confiables de calderas pirotubulares que cumplen con una amplia gama de requisitos de calefacción industrial. Lattner Boiler enfatiza la importancia de la personalización, asegurando que sus productos puedan adaptarse para satisfacer necesidades operativas específicas, lo que mejora su atractivo para los clientes potenciales. Con un fuerte énfasis en la garantía de calidad y el cumplimiento de los estándares de seguridad, Lattner Boiler se ha ganado una sólida reputación entre los profesionales de la industria. La larga experiencia de la empresa en el mercado, junto con un enfoque en tecnología duradera y atención al cliente, ilustra su posicionamiento estratégico dentro del panorama competitivo de las calderas químicas pirotubulares.

    Las empresas clave en el mercado de calderas químicas de tubos de fuego incluyen:

    • Raypack
    • Caldera Lattner
    • Caldera superior
    • Caldera Parker
    • CleaverBrooks
    • Industrias Pesadas Kangrim
    • Termodinámico
    • Caldera Hurst
    • Bryan vapor
    • Termotecnología Bosch
    • Caldera Miura
    • Corporación IHI
    • Babcock Wilcox
    • Fultón

    Desarrollos de la industria del mercado de calderas químicas de tubos de fuego

    Los acontecimientos recientes en el mercado mundial de calderas químicas pirotubulares indican una trayectoria de crecimiento constante, con una valoración esperada de 5,44 mil millones de dólares en 2024 y un aumento proyectado a 7,2 mil millones de dólares para 2032, lo que refleja una tasa de crecimiento anual compuesta ( CAGR) del 3,17%. El mercado está experimentando innovaciones en tecnología, particularmente en lo que respecta a la eficiencia energética y la reducción de emisiones, a medida que los marcos regulatorios se endurecen a nivel mundial. Los actores clave están invirtiendo en investigación y desarrollo para mejorar su oferta de productos, centrándose en la automatización y la integración de tecnología inteligente. Además, hay un énfasis cada vez mayor en las prácticas sostenibles dentro de la industria química, lo que está impulsando a los fabricantes a adoptar materiales ecológicos y mejorar la seguridad operativa. Geográficamente, regiones como América del Norte y Asia-Pacífico están experimentando una demanda significativa debido a la expansión del sector de procesamiento químico. Además, la transición en curso hacia fuentes de energía renovables está cambiando la dinámica del mercado, empujando a las partes interesadas a adaptar sus estrategias para satisfacer las cambiantes preferencias de los consumidores y los requisitos regulatorios. Este panorama en evolución presenta desafíos y oportunidades para los participantes del mercado, lo que requiere agilidad en las operaciones y un enfoque con visión de futuro para el desarrollo de productos.

    Perspectivas de segmentación del mercado de calderas químicas de tubos de fuego

    • Perspectivas del tipo de caldera del mercado de calderas químicas de tubos pirotubulares
    • Calderas pirotubulares de baja presión
    • Calderas pirotubulares de alta presión
    • Calderas pirotubulares modulares
    • Perspectiva del tipo de combustible del mercado de calderas químicas de tubos de fuego
    • Gas natural
    • Aceite
    • Biomasa
    • Carbón
    • Electricidad
    • Perspectivas de aplicación de la industria del mercado de calderas químicas de tubos de fuego
    • Fabricación de productos químicos
    • Procesamiento de alimentos
    • Industria textil
    • Papel y pulpa
    • Productos farmacéuticos
    • Perspectivas del sistema de control del mercado de calderas químicas de tubos de fuego
    • Control manual
    • Control semiautomático
    • Control totalmente automático
    • Perspectiva del tipo de instalación del mercado de calderas químicas de tubos de fuego
    • Instalación en interiores
    • Instalación en exteriores
    • Perspectiva regional del mercado de calderas químicas de tubos pirotubulares
    • América del Norte
    • Europa
    • América del Sur
    • Asia-Pacífico
    • Medio Oriente y África
    ÍNDICE


    1. RESUMEN EJECUTIVO
    1.1. Descripción general del mercado
    1.2. Hallazgos clave
    1.3. Segmentación del mercado
    1.4. Panorama Competitivo
    1.5. Retos y Oportunidades
    1.6. Perspectivas futuras


    2. INTRODUCCIÓN AL MERCADO
    2.1. Definición
    2.2. Alcance del estudio
    2.2.1. Objetivo de la investigación
    2.2.2. Supuesto
    2.2.3. Limitaciones
    3. METODOLOGÍA DE LA INVESTIGACIÓN
    3.1. Descripción general
    3.2. Minería de datos
    3.3. Investigación Secundaria
    3.4. Investigación Primaria
    3.4.1. Entrevistas primarias y proceso de recopilación de información
    3.4.2. Desglose de los encuestados principales
    3.5. Modelo de previsión
    3.6. Estimación del tamaño del mercado
    3.6.1. Enfoque ascendente
    3.6.2. Enfoque de arriba hacia abajo
    3.7. Triangulación de datos
    3.8. Validación


    4. DINÁMICA DEL MERCADO
    4.1. Descripción general
    4.2. Conductores
    4.3. Restricciones
    4.4. Oportunidades
    5. ANÁLISIS DE FACTORES DE MERCADO
    5.1. Análisis de la cadena de valor
    5.2. Análisis de las cinco fuerzas de Porter
    5.2.1. Poder de negociación de los proveedores
    5.2.2. Poder de negociación de los compradores
    5.2.3. Amenaza de nuevos participantes
    5.2.4. Amenaza de sustitutos
    5.2.5. Intensidad de la rivalidad
    5.3. Análisis de impacto de COVID-19
    5.3.1. Análisis de Impacto en el Mercado
    5.3.2. Impacto Regional
    5.3.3. Análisis de oportunidades y amenazas


    6. MERCADO DE CALDERAS QUÍMICAS DE TUBO DE FUEGO, POR TIPO DE CALDERA (MILLONES DE USD)
    6.1. Calderas pirotubulares de baja presión
    6.2. Calderas pirotubulares de alta presión
    6.3. Calderas pirotubulares modulares
    7. MERCADO DE CALDERAS QUÍMICAS FURGOBULARES, POR TIPO DE COMBUSTIBLE (MILLONES DE USD)
    7.1. Gas Natural
    7.2. Petróleo
    7.3. Biomasa
    7.4. Carbón
    7.5. Electricidad
    8. MERCADO DE CALDERAS QUÍMICAS FURGOBULARES, POR APLICACIÓN INDUSTRIA (MILLONES DE USD)
    8.1. Fabricación de productos químicos
    8.2. Procesamiento de alimentos
    8.3. Industria Textil
    8.4. Papel y Pasta
    8.5. Productos farmacéuticos
    9. MERCADO DE CALDERAS QUÍMICAS FURGOBULARES, POR SISTEMA DE CONTROL (MILLONES DE USD)
    9.1. Control manual
    9.2. Control Semiautomático
    9.3. Control completamente automático
    10. MERCADO DE CALDERAS QUÍMICAS FURGOBULARES, POR TIPO DE INSTALACIÓN (MILLONES DE USD)
    10.1. Instalación interior
    10.2. Instalación en exteriores
    11. MERCADO DE CALDERAS QUÍMICAS FURGOBULARES, POR REGIONAL (MILLONES DE USD)
    11.1. América del Norte
    11.1.1. Estados Unidos
    11.1.2. Canadá
    11.2. Europa
    11.2.1. Alemania
    11.2.2. Reino Unido
    11.2.3. Francia
    11.2.4. Rusia
    11.2.5. Italia
    11.2.6. España
    11.2.7. Resto de Europa
    11.3. Asia Pacífico
    11.3.1. China
    11.3.2. India
    11.3.3. Japón
    11.3.4. Corea del Sur
    11.3.5. Malasia
    11.3.6. Tailandia
    11.3.7. Indonesia
    11.3.8. Resto de APAC
    11.4. América del Sur
    11.4.1. Brasil
    11.4.2. México
    11.4.3. Argentina
    11.4.4. Resto de Sudamérica
    11.5. AMUMA
    11.5.1. Países del CCG
    11.5.2. Sudáfrica
    11.5.3. Resto de MEA


    12. PANORAMA COMPETITIVO
    12.1. Descripción general
    12.2. Análisis competitivo
    12.3. Análisis de cuota de mercado
    12.4. Importante estrategia de crecimiento en el mercado de calderas químicas de tubos pirotubulares
    12.5. Benchmarking Competitivo
    12.6. Principales actores en términos de número de desarrollos en el mercado de calderas químicas de tubos de fuego
    12.7. Desarrollos clave y estrategias de crecimiento
    12.7.1. Lanzamiento de nuevos productos/implementación de servicios
    12.7.2. Fusión y Adquisiciones
    12.7.3. Empresas conjuntas
    12.8. Matriz financiera de los principales actores
    12.8.1. Ventas e ingresos operativos
    12.8.2. Gasto en I+D de los principales actores. 2023
    13. PERFILES DE LA EMPRESA
    13.1. Raypak
    13.1.1. Panorama financiero
    13.1.2. Productos Ofrecidos
    13.1.3. Desarrollos clave
    13.1.4. Análisis FODA
    13.1.5. Estrategias clave
    13.2. Caldera Lattner
    13.2.1. Panorama financiero
    13.2.2. Productos Ofrecidos
    13.2.3. Desarrollos clave
    13.2.4. Análisis FODA
    13.2.5. Estrategias clave
    13.3. Caldera Superior
    13.3.1. Panorama financiero
    13.3.2. Productos Ofrecidos
    13.3.3. Desarrollos clave
    13.3.4. Análisis FODA
    13.3.5. Estrategias clave
    13.4. Caldera Parker
    13.4.1. Panorama financiero
    13.4.2. Productos Ofrecidos
    13.4.3. Desarrollos clave
    13.4.4. Análisis FODA
    13.4.5. Estrategias clave
    13.5. CleaverBrooks
    13.5.1. Panorama financiero
    13.5.2. Productos ofrecidos
    13.5.3. Desarrollos clave
    13.5.4. Análisis FODA
    13.5.5. Estrategias clave
    13.6. Industrias Pesadas Kangrim
    13.6.1. Panorama financiero
    13.6.2. Productos ofrecidos
    13.6.3. Desarrollos clave
    13.6.4. Análisis FODA
    13.6.5. Estrategias clave
    13.7. Termodinámico
    13.7.1. Panorama financiero
    13.7.2. Productos ofrecidos
    13.7.3. Desarrollos clave
    13.7.4. Análisis FODA
    13.7.5. Estrategias clave
    13.8. Caldera Hurst
    13.8.1. Panorama financiero
    13.8.2. Productos ofrecidos
    13.8.3. Desarrollos clave
    13.8.4. Análisis FODA
    13.8.5. Estrategias clave
    13.9. Bryan Steam
    13.9.1. Panorama financiero
    13.9.2. Productos Ofrecidos
    13.9.3. Desarrollos clave
    13.9.4. Análisis FODA
    13.9.5. Estrategias clave
    13.10. Termotecnología Bosch
    13.10.1. Panorama financiero
    13.10.2. Productos Ofrecidos
    13.10.3. Desarrollos clave
    13.10.4. Análisis FODA
    13.10.5. Estrategias clave
    13.11. Caldera Miura
    13.11.1. Panorama financiero
    13.11.2. Productos Ofrecidos
    13.11.3. Desarrollos clave
    13.11.4. Análisis FODA
    13.11.5. Estrategias clave
    13.12. Corporación IHI
    13.12.1. Panorama financiero
    13.12.2. Productos Ofrecidos
    13.12.3. Desarrollos clave
    13.12.4. Análisis FODA
    13.12.5. Estrategias clave
    13.13. Babcock Wilcox
    13.13.1. Panorama financiero
    13.13.2. Productos Ofrecidos
    13.13.3. Desarrollos clave
    13.13.4. Análisis FODA
    13.13.5. Estrategias clave
    13.14. Fulton
    13.14.1. Panorama financiero
    13.14.2. Productos Ofrecidos
    13.14.3. Desarrollos clave
    13.14.4. Análisis FODA
    13.14.5. Estrategias clave
    14. APÉNDICE
    14.1. Referencias
    14.2. Informes relacionados
    LISTA DE TABLAS

    TABLA 1. LISTA DE SUPUESTOS
    TABLA 2. ESTIMACIONES Y ESTIMACIONES DEL TAMAÑO DEL MERCADO DE CALDERAS QUÍMICAS DE TUBO DE FUEGO EN AMÉRICA DEL NORTE. PRONÓSTICO, POR TIPO DE CALDERA, 2019-2032 (MILES DE MILLONES DE USD)
    TABLA 3. ESTIMACIONES Y ESTIMACIONES DEL TAMAÑO DEL MERCADO DE CALDERAS QUÍMICAS DE TUBO DE FUEGO EN AMÉRICA DEL NORTE. PRONÓSTICO, POR TIPO DE COMBUSTIBLE, 2019-2032 (MILES DE MILLONES DE USD)
    TABLA 4. ESTIMACIONES Y ESTIMACIONES DEL TAMAÑO DEL MERCADO DE CALDERAS QUÍMICAS DE TUBO DE AMÉRICA DEL NORTE. PRONÓSTICO, POR APLICACIÓN INDUSTRIA, 2019-2032 (MILES DE MILLONES DE USD)
    TABLA 5. ESTIMACIONES Y ESTIMACIONES DEL TAMAÑO DEL MERCADO DE CALDERAS QUÍMICAS DE TUBO DE AMÉRICA DEL NORTE. PRONÓSTICO, POR SISTEMA DE CONTROL, 2019-2032 (MILES DE MILLONES DE USD)
    TABLA 6. ESTIMACIONES Y ESTIMACIONES DEL TAMAÑO DEL MERCADO DE CALDERAS QUÍMICAS FURGOBULARES EN AMÉRICA DEL NORTE. PRONÓSTICO, POR TIPO DE INSTALACIÓN, 2019-2032 (MILES DE MILLONES DE USD)
    TABLA 7. ESTIMACIONES Y ESTIMACIONES DEL TAMAÑO DEL MERCADO DE CALDERAS QUÍMICAS DE TUBO DE AMÉRICA DEL NORTE. PRONÓSTICO, POR REGIONAL, 2019-2032 (MILES DE MILLONES DE USD)
    TABLA 8. ESTIMACIONES Y ESTIMACIONES DEL TAMAÑO DEL MERCADO DE CALDERAS QUÍMICAS DE TUBO DE FUEGO DE EE. UU. PRONÓSTICO, POR TIPO DE CALDERA, 2019-2032 (MILES DE MILLONES DE USD)
    TABLA 9. ESTIMACIONES Y ESTIMACIONES DEL TAMAÑO DEL MERCADO DE CALDERAS QUÍMICAS DE TUBO DE FUEGO DE EE. UU. PRONÓSTICO, POR TIPO DE COMBUSTIBLE, 2019-2032 (MILES DE MILLONES DE USD)
    TABLA 10. ESTIMACIONES Y ESTIMACIONES DEL TAMAÑO DEL MERCADO DE CALDERAS QUÍMICAS DE TUBO DE FUEGO DE EE. UU. PRONÓSTICO, POR APLICACIÓN INDUSTRIA, 2019-2032 (MILES DE MILLONES DE USD)
    TABLA 11. ESTIMACIONES Y ESTIMACIONES DEL TAMAÑO DEL MERCADO DE CALDERAS QUÍMICAS DE TUBO DE FUEGO DE EE. UU. PRONÓSTICO, POR SISTEMA DE CONTROL, 2019-2032 (MILES DE MILLONES DE USD)
    TABLA 12. ESTIMACIONES Y ESTIMACIONES DEL TAMAÑO DEL MERCADO DE CALDERAS QUÍMICAS DE TUBO DE FUEGO DE EE. UU. PRONÓSTICO, POR TIPO DE INSTALACIÓN, 2019-2032 (MILES DE MILLONES DE USD)
    TABLA 13. ESTIMACIONES Y ESTIMACIONES DEL TAMAÑO DEL MERCADO DE CALDERAS QUÍMICAS DE TUBO DE FUEGO DE EE. UU. PRONÓSTICO, POR REGIONAL, 2019-2032 (MILES DE MILLONES DE USD)
    TABLA 14. ESTIMACIONES Y ESTIMACIONES DEL TAMAÑO DEL MERCADO DE CALDERAS QUÍMICAS DE TUBO DE FUEGO EN CANADÁ. PRONÓSTICO, POR TIPO DE CALDERA, 2019-2032 (MILES DE MILLONES DE USD)
    TABLA 15. ESTIMACIONES Y ESTIMACIONES DEL TAMAÑO DEL MERCADO DE CALDERAS QUÍMICAS DE TUBO DE FUEGO EN CANADÁ. PRONÓSTICO, POR TIPO DE COMBUSTIBLE, 2019-2032 (MILES DE MILLONES DE USD)
    TABLA 16. ESTIMACIONES Y ESTIMACIONES DEL TAMAÑO DEL MERCADO DE CALDERAS QUÍMICAS DE TUBO DE FUEGO EN CANADÁ. PRONÓSTICO, POR APLICACIÓN INDUSTRIA, 2019-2032 (MILES DE MILLONES DE USD)
    TABLA 17. ESTIMACIONES Y ESTIMACIONES DEL TAMAÑO DEL MERCADO DE CALDERAS QUÍMICAS DE TUBO DE FUEGO EN CANADÁ. PRONÓSTICO, POR SISTEMA DE CONTROL, 2019-2032 (MILES DE MILLONES DE USD)
    TABLA 18. ESTIMACIONES Y ESTIMACIONES DEL TAMAÑO DEL MERCADO DE CALDERAS QUÍMICAS DE TUBO DE FUEGO DE CANADÁ. PRONÓSTICO, POR TIPO DE INSTALACIÓN, 2019-2032 (MILES DE MILLONES DE USD)
    TABLA 19. ESTIMACIONES Y ESTIMACIONES DEL TAMAÑO DEL MERCADO DE CALDERAS QUÍMICAS DE TUBO DE FUEGO EN CANADÁ. PRONÓSTICO, POR REGIONAL, 2019-2032 (MILES DE MILLONES DE USD)
    TABLA 20. ESTIMACIONES Y ESTIMACIONES DEL TAMAÑO DEL MERCADO QUÍMICO DE CALDERAS QUÍMICAS DE TUBO DE FUEGO EN EUROPA. PRONÓSTICO, POR TIPO DE CALDERA, 2019-2032 (MILES DE MILLONES DE USD)
    TABLA 21. ESTIMACIONES Y ESTIMACIONES DEL TAMAÑO DEL MERCADO QUÍMICO DE CALDERAS DE TUBO DE FUEGO EN EUROPA. PRONÓSTICO, POR TIPO DE COMBUSTIBLE, 2019-2032 (MILES DE MILLONES DE USD)
    TABLA 22. ESTIMACIONES Y ESTIMACIONES DEL TAMAÑO DEL MERCADO QUÍMICO DE CALDERAS QUÍMICAS DE TUBERÍAS EN EUROPA. PRONÓSTICO, POR APLICACIÓN INDUSTRIA, 2019-2032 (MILES DE MILLONES DE USD)
    TABLA 23. ESTIMACIONES Y ESTIMACIONES DEL TAMAÑO DEL MERCADO QUÍMICO DE CALDERAS QUÍMICAS DE TUBO DE FUEGO EN EUROPA. PRONÓSTICO, POR SISTEMA DE CONTROL, 2019-2032 (MILES DE MILLONES DE USD)
    TABLA 24. ESTIMACIONES Y ESTIMACIONES DEL TAMAÑO DEL MERCADO QUÍMICO DE CALDERAS QUÍMICAS DE TUBO DE FUEGO EN EUROPA. PRONÓSTICO, POR TIPO DE INSTALACIÓN, 2019-2032 (MILES DE MILLONES DE USD)
    TABLA 25. ESTIMACIONES Y ESTIMACIONES DEL TAMAÑO DEL MERCADO QUÍMICO DE CALDERAS QUÍMICAS DE TUBO EN EUROPA. PRONÓSTICO, POR REGIONAL, 2019-2032 (MILES DE MILLONES DE USD)
    TABLA 26. ESTIMACIONES Y ESTIMACIONES DEL TAMAÑO DEL MERCADO DE CALDERAS QUÍMICAS DE TUBO DE ALEMANIA. PRONÓSTICO, POR TIPO DE CALDERA, 2019-2032 (MILES DE MILLONES DE USD)
    TABLA 27. ESTIMACIONES Y ESTIMACIONES DEL TAMAÑO DEL MERCADO DE CALDERAS QUÍMICAS DE TUBO DE ALEMANIA. PRONÓSTICO, POR TIPO DE COMBUSTIBLE, 2019-2032 (MILES DE MILLONES DE USD)
    TABLA 28. ESTIMACIONES Y ESTIMACIONES DEL TAMAÑO DEL MERCADO DE CALDERAS QUÍMICAS DE TUBO DE ALEMANIA. PRONÓSTICO, POR APLICACIÓN INDUSTRIA, 2019-2032 (MILES DE MILLONES DE USD)
    TABLA 29. ESTIMACIONES Y ESTIMACIONES DEL TAMAÑO DEL MERCADO DE CALDERAS QUÍMICAS DE TUBO DE FUEGO EN ALEMANIA. PRONÓSTICO, POR SISTEMA DE CONTROL, 2019-2032 (MILES DE MILLONES DE USD)
    TABLA 30. ESTIMACIONES Y ESTIMACIONES DEL TAMAÑO DEL MERCADO DE CALDERAS QUÍMICAS DE TUBO DE FUEGO EN ALEMANIA. PRONÓSTICO, POR TIPO DE INSTALACIÓN, 2019-2032 (MILES DE MILLONES DE USD)
    TABLA 31. ESTIMACIONES Y ESTIMACIONES DEL TAMAÑO DEL MERCADO DE CALDERAS QUÍMICAS DE TUBO DE ALEMANIA. PRONÓSTICO, POR REGIONAL, 2019-2032 (MILES DE MILLONES DE USD)
    TABLA 32. ESTIMACIONES Y ESTIMACIONES DEL TAMAÑO DEL MERCADO DE CALDERAS QUÍMICAS DE TUBO DE FUEGO DEL REINO UNIDO. PRONÓSTICO, POR TIPO DE CALDERA, 2019-2032 (MILES DE MILLONES DE USD)
    TABLA 33. ESTIMACIONES Y ESTIMACIONES DEL TAMAÑO DEL MERCADO DE CALDERAS QUÍMICAS DE TUBO DE FUEGO DEL REINO UNIDO. PRONÓSTICO, POR TIPO DE COMBUSTIBLE, 2019-2032 (MILES DE MILLONES DE USD)
    TABLA 34. ESTIMACIONES Y ESTIMACIONES DEL TAMAÑO DEL MERCADO DE CALDERAS QUÍMICAS DE TUBO DE FUEGO DEL REINO UNIDO. PRONÓSTICO, POR APLICACIÓN INDUSTRIA, 2019-2032 (MILES DE MILLONES DE USD)
    TABLA 35. ESTIMACIONES Y ESTIMACIONES DEL TAMAÑO DEL MERCADO DE CALDERAS QUÍMICAS DE TUBO DE FUEGO DEL REINO UNIDO. PRONÓSTICO, POR SISTEMA DE CONTROL, 2019-2032 (MILES DE MILLONES DE USD)
    TABLA 36. ESTIMACIONES Y ESTIMACIONES DEL TAMAÑO DEL MERCADO DE CALDERAS QUÍMICAS DE TUBO DE FUEGO DEL REINO UNIDO. PRONÓSTICO, POR TIPO DE INSTALACIÓN, 2019-2032 (MILES DE MILLONES DE USD)
    TABLA 37. ESTIMACIONES Y ESTIMACIONES DEL TAMAÑO DEL MERCADO DE CALDERAS QUÍMICAS DE TUBO DE FUEGO DEL REINO UNIDO. PRONÓSTICO, POR REGIONAL, 2019-2032 (MILES DE MILLONES DE USD)
    TABLA 38. ESTIMACIONES Y ESTIMACIONES DEL TAMAÑO DEL MERCADO QUÍMICO DE CALDERAS FURGÓBICAS DE FRANCIA. PRONÓSTICO, POR TIPO DE CALDERA, 2019-2032 (MILES DE MILLONES DE USD)
    TABLA 39. ESTIMACIONES Y PREVISIÓN DEL TAMAÑO DEL MERCADO QUÍMICO DE CALDERAS FURGÓBICAS EN FRANCIA. PRONÓSTICO, POR TIPO DE COMBUSTIBLE, 2019-2032 (MILES DE MILLONES DE USD)
    TABLA 40. ESTIMACIONES Y ESTIMACIONES DEL TAMAÑO DEL MERCADO QUÍMICO DE CALDERAS QUÍMICAS DE FRANCIA. PRONÓSTICO, POR APLICACIÓN INDUSTRIA, 2019-2032 (MILES DE MILLONES DE USD)
    TABLA 41. ESTIMACIONES Y ESTIMACIONES DEL TAMAÑO DEL MERCADO QUÍMICO DE CALDERAS QUÍMICAS DE FRANCIA. PRONÓSTICO, POR SISTEMA DE CONTROL, 2019-2032 (MILES DE MILLONES DE USD)
    TABLA 42. ESTIMACIONES Y ESTIMACIONES DEL TAMAÑO DEL MERCADO QUÍMICO DE CALDERAS QUÍMICAS DE FRANCIA. PRONÓSTICO, POR TIPO DE INSTALACIÓN, 2019-2032 (MILES DE MILLONES DE USD)
    TABLA 43. ESTIMACIONES Y ESTIMACIONES DEL TAMAÑO DEL MERCADO QUÍMICO DE CALDERAS FURGÓBICAS EN FRANCIA. PRONÓSTICO, POR REGIONAL, 2019-2032 (MILES DE MILLONES DE USD)
    TABLA 44. ESTIMACIONES Y ESTIMACIONES DEL TAMAÑO DEL MERCADO DE CALDERAS QUÍMICAS DE TUBO FURGÓTICO DE RUSIA. PRONÓSTICO, POR TIPO DE CALDERA, 2019-2032 (MILES DE MILLONES DE USD)
    TABLA 45. ESTIMACIONES Y ESTIMACIONES DEL TAMAÑO DEL MERCADO DE CALDERAS QUÍMICAS DE TUBO FURGÓTICO DE RUSIA. PRONÓSTICO, POR TIPO DE COMBUSTIBLE, 2019-2032 (MILES DE MILLONES DE USD)
    TABLA 46. ESTIMACIONES Y ESTIMACIONES DEL TAMAÑO DEL MERCADO DE CALDERAS QUÍMICAS DE TUBO DE FUEGO EN RUSIA. PRONÓSTICO, POR APLICACIÓN INDUSTRIA, 2019-2032 (MILES DE MILLONES DE USD)
    TABLA 47. ESTIMACIONES Y ESTIMACIONES DEL TAMAÑO DEL MERCADO DE CALDERAS QUÍMICAS DE TUBO DE FUEGO EN RUSIA. PRONÓSTICO, POR SISTEMA DE CONTROL, 2019-2032 (MILES DE MILLONES DE USD)
    TABLA 48. ESTIMACIONES Y ESTIMACIONES DEL TAMAÑO DEL MERCADO DE CALDERAS QUÍMICAS DE TUBO DE FUEGO DE RUSIA. PRONÓSTICO, POR TIPO DE INSTALACIÓN, 2019-2032 (MILES DE MILLONES DE USD)
    TABLA 49. ESTIMACIONES Y ESTIMACIONES DEL TAMAÑO DEL MERCADO DE CALDERAS QUÍMICAS DE TUBO DE FUEGO EN RUSIA. PRONÓSTICO, POR REGIONAL, 2019-2032 (MILES DE MILLONES DE USD)
    TABLA 50. ESTIMACIONES Y ESTIMACIONES DEL TAMAÑO DEL MERCADO DE CALDERAS QUÍMICAS DE TUBO DE FUEGO EN ITALIA. PRONÓSTICO, POR TIPO DE CALDERA, 2019-2032 (MILES DE MILLONES DE USD)
    TABLA 51. ESTIMACIONES Y ESTIMACIONES DEL TAMAÑO DEL MERCADO DE CALDERAS QUÍMICAS FURGOBULARES EN ITALIA. PRONÓSTICO, POR TIPO DE COMBUSTIBLE, 2019-2032 (MILES DE MILLONES DE USD)
    TABLA 52. ESTIMACIONES Y ESTIMACIONES DEL TAMAÑO DEL MERCADO DE CALDERAS QUÍMICAS DE TUBO DE FUEGO EN ITALIA. PRONÓSTICO, POR APLICACIÓN INDUSTRIA, 2019-2032 (MILES DE MILLONES DE USD)
    TABLA 53. ESTIMACIONES Y ESTIMACIONES DEL TAMAÑO DEL MERCADO DE CALDERAS QUÍMICAS DE TUBO DE FUEGO EN ITALIA. PRONÓSTICO, POR SISTEMA DE CONTROL, 2019-2032 (MILES DE MILLONES DE USD)
    TABLA 54. ESTIMACIONES Y ESTIMACIONES DEL TAMAÑO DEL MERCADO DE CALDERAS QUÍMICAS DE TUBO DE FUEGO EN ITALIA. PRONÓSTICO, POR TIPO DE INSTALACIÓN, 2019-2032 (MILES DE MILLONES DE USD)
    TABLA 55. ESTIMACIONES Y ESTIMACIONES DEL TAMAÑO DEL MERCADO DE CALDERAS QUÍMICAS DE TUBO DE FUEGO EN ITALIA. PRONÓSTICO, POR REGIONAL, 2019-2032 (MILES DE MILLONES DE USD)
    TABLA 56. ESTIMACIONES Y ESTIMACIONES DEL TAMAÑO DEL MERCADO DE CALDERAS QUÍMICAS FURGOBULARES EN ESPAÑA. PRONÓSTICO, POR TIPO DE CALDERA, 2019-2032 (MILES DE MILLONES DE USD)
    TABLA 57. ESTIMACIONES Y ESTIMACIONES DEL TAMAÑO DEL MERCADO DE CALDERAS QUÍMICAS FURGOBULARES EN ESPAÑA. PRONÓSTICO, POR TIPO DE COMBUSTIBLE, 2019-2032 (MILES DE MILLONES DE USD)
    TABLA 58. ESTIMACIONES Y ESTIMACIONES DEL TAMAÑO DEL MERCADO QUÍMICO DE CALDERAS FURGÓBICAS EN ESPAÑA. PRONÓSTICO, POR APLICACIÓN INDUSTRIA, 2019-2032 (MILES DE MILLONES DE USD)
    TABLA 59. ESTIMACIONES Y ESTIMACIONES DEL TAMAÑO DEL MERCADO QUÍMICO DE CALDERAS FURGOBULARES EN ESPAÑA. PRONÓSTICO, POR SISTEMA DE CONTROL, 2019-2032 (MILES DE MILLONES DE USD)
    TABLA 60. ESTIMACIONES Y ESTIMACIONES DEL TAMAÑO DEL MERCADO DE CALDERAS QUÍMICAS FURGOBULARES EN ESPAÑA. PRONÓSTICO, POR TIPO DE INSTALACIÓN, 2019-2032 (MILES DE MILLONES DE USD)
    TABLA 61. ESTIMACIONES Y ESTIMACIONES DEL TAMAÑO DEL MERCADO DE CALDERAS QUÍMICAS FURGOBULARES EN ESPAÑA. PRONÓSTICO, POR REGIONAL, 2019-2032 (MILES DE MILLONES DE USD)
    TABLA 62. ESTIMACIONES Y ESTIMACIONES DEL TAMAÑO DEL MERCADO DE CALDERAS QUÍMICAS FURGOBULARES PARA EL RESTO DE EUROPA. PRONÓSTICO, POR TIPO DE CALDERA, 2019-2032 (MILES DE MILLONES DE USD)
    TABLA 63. ESTIMACIONES Y ESTIMACIONES DEL TAMAÑO DEL MERCADO DE CALDERAS QUÍMICAS DE TUBO FUEGO PARA EL RESTO DE EUROPA. PRONÓSTICO, POR TIPO DE COMBUSTIBLE, 2019-2032 (MILES DE MILLONES DE USD)
    TABLA 64. ESTIMACIONES Y ESTIMACIONES DEL TAMAÑO DEL MERCADO DE CALDERAS QUÍMICAS DE TUBO DE FUEGO PARA EL RESTO DE EUROPA. PRONÓSTICO, POR APLICACIÓN INDUSTRIA, 2019-2032 (MILES DE MILLONES DE USD)
    TABLA 65. ESTIMACIONES Y ESTIMACIONES DEL TAMAÑO DEL MERCADO DE CALDERAS QUÍMICAS FURGOBULARES PARA EL RESTO DE EUROPA. PRONÓSTICO, POR SISTEMA DE CONTROL, 2019-2032 (MILES DE MILLONES DE USD)
    TABLA 66. ESTIMACIONES Y ESTIMACIONES DEL TAMAÑO DEL MERCADO DE CALDERAS QUÍMICAS FURGOBULARES PARA EL RESTO DE EUROPA. PRONÓSTICO, POR TIPO DE INSTALACIÓN, 2019-2032 (MILES DE MILLONES DE USD)
    TABLA 67. ESTIMACIONES Y ESTIMACIONES DEL TAMAÑO DEL MERCADO DE CALDERAS QUÍMICAS FURGOBULARES PARA EL RESTO DE EUROPA. PRONÓSTICO, POR REGIONAL, 2019-2032 (MILES DE MILLONES DE USD)
    TABLA 68. ESTIMACIONES Y ESTIMACIONES DEL TAMAÑO DEL MERCADO DE CALDERAS QUÍMICAS DE TUBO DE APAC APAC. PRONÓSTICO, POR TIPO DE CALDERA, 2019-2032 (MILES DE MILLONES DE USD)
    TABLA 69. ESTIMACIONES Y ESTIMACIONES DEL TAMAÑO DEL MERCADO DE CALDERAS QUÍMICAS DE TUBO FURGÓTICO APAC. PRONÓSTICO, POR TIPO DE COMBUSTIBLE, 2019-2032 (MILES DE MILLONES DE USD)
    TABLA 70. ESTIMACIONES Y ESTIMACIONES DEL TAMAÑO DEL MERCADO DE CALDERAS QUÍMICAS DE TUBO DE APAC APAC. PRONÓSTICO, POR APLICACIÓN INDUSTRIA, 2019-2032 (MILES DE MILLONES DE USD)
    TABLA 71. ESTIMACIONES Y ESTIMACIONES DEL TAMAÑO DEL MERCADO DE CALDERAS QUÍMICAS DE TUBO DE APAC APAC. PRONÓSTICO, POR SISTEMA DE CONTROL, 2019-2032 (MILES DE MILLONES DE USD)
    TABLA 72. ESTIMACIONES Y ESTIMACIONES DEL TAMAÑO DEL MERCADO DE CALDERAS QUÍMICAS DE TUBO DE APAC APAC. PRONÓSTICO, POR TIPO DE INSTALACIÓN, 2019-2032 (MILES DE MILLONES DE USD)
    TABLA 73. ESTIMACIONES Y ESTIMACIONES DEL TAMAÑO DEL MERCADO DE CALDERAS QUÍMICAS DE TUBO DE APAC APAC. PRONÓSTICO, POR REGIONAL, 2019-2032 (MILES DE MILLONES DE USD)
    TABLA 74. ESTIMACIONES Y ESTIMACIONES DEL TAMAÑO DEL MERCADO QUÍMICO DE CALDERAS QUÍMICAS DE TUBO DE FUEGO DE CHINA. PRONÓSTICO, POR TIPO DE CALDERA, 2019-2032 (MILES DE MILLONES DE USD)
    TABLA 75. ESTIMACIONES Y ESTIMACIONES DEL TAMAÑO DEL MERCADO QUÍMICO DE CALDERAS QUÍMICAS DE TUBO DE CHINA EN CHINA. PRONÓSTICO, POR TIPO DE COMBUSTIBLE, 2019-2032 (MILES DE MILLONES DE USD)
    TABLA 76. ESTIMACIONES Y ESTIMACIONES DEL TAMAÑO DEL MERCADO QUÍMICO DE CALDERAS QUÍMICAS DE TUBO DE FUEGO DE CHINA. PRONÓSTICO, POR APLICACIÓN INDUSTRIA, 2019-2032 (MILES DE MILLONES DE USD)
    TABLA 77. ESTIMACIONES Y ESTIMACIONES DEL TAMAÑO DEL MERCADO QUÍMICO DE CALDERAS QUÍMICAS DE TUBO DE FUEGO DE CHINA. PRONÓSTICO, POR SISTEMA DE CONTROL, 2019-2032 (MILES DE MILLONES DE USD)
    TABLA 78. ESTIMACIONES Y ESTIMACIONES DEL TAMAÑO DEL MERCADO QUÍMICO DE CALDERAS QUÍMICAS DE TUBO DE FUEGO DE CHINA. PRONÓSTICO, POR TIPO DE INSTALACIÓN, 2019-2032 (MILES DE MILLONES DE USD)
    TABLA 79. ESTIMACIONES Y ESTIMACIONES DEL TAMAÑO DEL MERCADO QUÍMICO DE CALDERAS QUÍMICAS DE TUBO DE FUEGO DE CHINA. PRONÓSTICO, POR REGIONAL, 2019-2032 (MILES DE MILLONES DE USD)
    TABLA 80. ESTIMACIONES Y ESTIMACIONES DEL TAMAÑO DEL MERCADO DE CALDERAS QUÍMICAS DE TUBO DE FUEGO DE LA INDIA. PRONÓSTICO, POR TIPO DE CALDERA, 2019-2032 (MILES DE MILLONES DE USD)
    TABLA 81. ESTIMACIONES Y ESTIMACIONES DEL TAMAÑO DEL MERCADO DE CALDERAS QUÍMICAS DE TUBO DE FUEGO DE LA INDIA. PRONÓSTICO, POR TIPO DE COMBUSTIBLE, 2019-2032 (MILES DE MILLONES DE USD)
    TABLA 82. ESTIMACIONES Y ESTIMACIONES DEL TAMAÑO DEL MERCADO DE CALDERAS QUÍMICAS DE TUBO DE FUEGO DE LA INDIA. PRONÓSTICO, POR APLICACIÓN INDUSTRIA, 2019-2032 (MILES DE MILLONES DE USD)
    TABLA 83. ESTIMACIONES Y ESTIMACIONES DEL TAMAÑO DEL MERCADO DE CALDERAS QUÍMICAS DE TUBO DE FUEGO DE LA INDIA. PRONÓSTICO, POR SISTEMA DE CONTROL, 2019-2032 (MILES DE MILLONES DE USD)
    TABLA 84. ESTIMACIONES Y ESTIMACIONES DEL TAMAÑO DEL MERCADO DE CALDERAS QUÍMICAS DE TUBO DE FUEGO DE LA INDIA. PRONÓSTICO, POR TIPO DE INSTALACIÓN, 2019-2032 (MILES DE MILLONES DE USD)
    TABLA 85. ESTIMACIONES Y ESTIMACIONES DEL TAMAÑO DEL MERCADO DE CALDERAS QUÍMICAS DE TUBO DE FUEGO DE LA INDIA. PRONÓSTICO, POR REGIONAL, 2019-2032 (MILES DE MILLONES DE USD)
    TABLA 86. ESTIMACIONES Y ESTIMACIONES DEL TAMAÑO DEL MERCADO QUÍMICO DE CALDERAS QUÍMICAS DE TUBO DE JAPÓN. PRONÓSTICO, POR TIPO DE CALDERA, 2019-2032 (MILES DE MILLONES DE USD)
    TABLA 87. ESTIMACIONES Y ESTIMACIONES DEL TAMAÑO DEL MERCADO QUÍMICO DE CALDERAS FURGÓBICAS DE JAPÓN. PRONÓSTICO, POR TIPO DE COMBUSTIBLE, 2019-2032 (MILES DE MILLONES DE USD)
    TABLA 88. ESTIMACIONES Y ESTIMACIONES DEL TAMAÑO DEL MERCADO QUÍMICO DE CALDERAS QUÍMICAS DE JAPÓN PRONÓSTICO, POR APLICACIÓN INDUSTRIA, 2019-2032 (MILES DE MILLONES DE USD)
    TABLA 89. ESTIMACIONES Y ESTIMACIONES DEL TAMAÑO DEL MERCADO QUÍMICO DE CALDERAS QUÍMICAS DE TUBO DE JAPÓN. PRONÓSTICO, POR SISTEMA DE CONTROL, 2019-2032 (MILES DE MILLONES DE USD)
    TABLA 90. ESTIMACIONES Y ESTIMACIONES DEL TAMAÑO DEL MERCADO QUÍMICO DE CALDERAS QUÍMICAS DE TUBO DE JAPÓN PRONÓSTICO, POR TIPO DE INSTALACIÓN, 2019-2032 (MILES DE MILLONES DE USD)
    TABLA 91. ESTIMACIONES Y ESTIMACIONES DEL TAMAÑO DEL MERCADO QUÍMICO DE CALDERAS QUÍMICAS DE TUBO DE JAPÓN. PRONÓSTICO, POR REGIONAL, 2019-2032 (MILES DE MILLONES DE USD)
    TABLA 92. ESTIMACIONES Y ESTIMACIONES DEL TAMAÑO DEL MERCADO DE CALDERAS QUÍMICAS DE TUBO FURGÓTICO DE COREA DEL SUR. PRONÓSTICO, POR TIPO DE CALDERA, 2019-2032 (MILES DE MILLONES DE USD)
    TABLA 93. ESTIMACIONES Y ESTIMACIONES DEL TAMAÑO DEL MERCADO DE CALDERAS QUÍMICAS DE TUBO FURGÓTICO DE COREA DEL SUR. PRONÓSTICO, POR TIPO DE COMBUSTIBLE, 2019-2032 (MILES DE MILLONES DE USD)
    TABLA 94. ESTIMACIONES Y ESTIMACIONES DEL TAMAÑO DEL MERCADO DE CALDERAS QUÍMICAS DE TUBO FURGÓTICO DE COREA DEL SUR. PRONÓSTICO, POR APLICACIÓN INDUSTRIA, 2019-2032 (MILES DE MILLONES DE USD)
    TABLA 95. ESTIMACIONES Y ESTIMACIONES DEL TAMAÑO DEL MERCADO DE CALDERAS QUÍMICAS DE TUBO FURGÓTICO DE COREA DEL SUR. PRONÓSTICO, POR SISTEMA DE CONTROL, 2019-2032 (MILES DE MILLONES DE USD)
    TABLA 96. ESTIMACIONES Y ESTIMACIONES DEL TAMAÑO DEL MERCADO DE CALDERAS QUÍMICAS DE TUBO FURGÓTICO DE COREA DEL SUR. PRONÓSTICO, POR TIPO DE INSTALACIÓN, 2019-2032 (MILES DE MILLONES DE USD)
    TABLA 97. ESTIMACIONES Y ESTIMACIONES DEL TAMAÑO DEL MERCADO DE CALDERAS QUÍMICAS DE TUBO FURGÓTICO DE COREA DEL SUR. PRONÓSTICO, POR REGIONAL, 2019-2032 (MILES DE MILLONES DE USD)
    TABLA 98. ESTIMACIONES Y ESTIMACIONES DEL TAMAÑO DEL MERCADO DE CALDERAS QUÍMICAS DE TUBO DE FUEGO DE MALASIA. PRONÓSTICO, POR TIPO DE CALDERA, 2019-2032 (MILES DE MILLONES DE USD)
    TABLA 99. ESTIMACIONES Y ESTIMACIONES DEL TAMAÑO DEL MERCADO DE CALDERAS QUÍMICAS DE TUBO DE FUEGO DE MALASIA. PRONÓSTICO, POR TIPO DE COMBUSTIBLE, 2019-2032 (MILES DE MILLONES DE USD)
    TABLA 100. ESTIMACIONES Y ESTIMACIONES DEL TAMAÑO DEL MERCADO DE CALDERAS QUÍMICAS DE TUBO DE FUEGO DE MALASIA. PRONÓSTICO, POR APLICACIÓN INDUSTRIA, 2019-2032 (MILES DE MILLONES DE USD)
    TABLA 101. ESTIMACIONES Y ESTIMACIONES DEL TAMAÑO DEL MERCADO DE CALDERAS QUÍMICAS DE TUBO DE FUEGO DE MALASIA. PRONÓSTICO, POR SISTEMA DE CONTROL, 2019-2032 (MILES DE MILLONES DE USD)
    TABLA 102. ESTIMACIONES Y ESTIMACIONES DEL TAMAÑO DEL MERCADO DE CALDERAS QUÍMICAS DE TUBO DE FUEGO DE MALASIA. PRONÓSTICO, POR TIPO DE INSTALACIÓN, 2019-2032 (MILES DE MILLONES DE USD)
    TABLA 103. ESTIMACIONES Y PREVISIÓN DEL TAMAÑO DEL MERCADO DE CALDERAS QUÍMICAS DE TUBO DE FUEGO DE MALASIA. PRONÓSTICO, POR REGIONAL, 2019-2032 (MILES DE MILLONES DE USD)
    TABLA 104. ESTIMACIONES Y ESTIMACIONES DEL TAMAÑO DEL MERCADO DE CALDERAS QUÍMICAS DE TAILANDIA PRONÓSTICO, POR TIPO DE CALDERA, 2019-2032 (MILES DE MILLONES DE USD)
    TABLA 105. ESTIMACIONES Y ESTIMACIONES DEL TAMAÑO DEL MERCADO DE CALDERAS QUÍMICAS DE TAILANDIA PRONÓSTICO, POR TIPO DE COMBUSTIBLE, 2019-2032 (MILES DE MILLONES DE USD)
    TABLA 106. ESTIMACIONES Y ESTIMACIONES DEL TAMAÑO DEL MERCADO DE CALDERAS QUÍMICAS DE TAILANDIA PRONÓSTICO, POR APLICACIÓN INDUSTRIA, 2019-2032 (MILES DE MILLONES DE USD)
    TABLA 107. ESTIMACIONES Y PROYECCIÓN DEL TAMAÑO DEL MERCADO DE CALDERAS QUÍMICAS DE TAILANDIA PRONÓSTICO, POR SISTEMA DE CONTROL, 2019-2032 (MILES DE MILLONES DE USD)
    TABLA 108. ESTIMACIONES Y POTENCIA DEL TAMAÑO DEL MERCADO DE CALDERAS QUÍMICAS DE TAILANDIA PRONÓSTICO, POR TIPO DE INSTALACIÓN, 2019-2032 (MILES DE MILLONES DE USD)
    TABLA 109. ESTIMACIONES Y ESTIMACIONES DEL TAMAÑO DEL MERCADO DE CALDERAS QUÍMICAS DE TAILANDIA PRONÓSTICO, POR REGIONAL, 2019-2032 (MILES DE MILLONES DE USD)
    TABLA 110. ESTIMACIONES Y ESTIMACIONES DEL TAMAÑO DEL MERCADO DE CALDERAS QUÍMICAS DE TUBO DE FUEGO DE INDONESIA. PRONÓSTICO, POR TIPO DE CALDERA, 2019-2032 (MILES DE MILLONES DE USD)
    TABLA 111. ESTIMACIONES Y ESTIMACIONES DEL TAMAÑO DEL MERCADO DE CALDERAS QUÍMICAS DE TUBO DE FUEGO DE INDONESIA. PRONÓSTICO, POR TIPO DE COMBUSTIBLE, 2019-2032 (MILES DE MILLONES DE USD)
    TABLA 112. ESTIMACIONES Y ESTIMACIONES DEL TAMAÑO DEL MERCADO DE CALDERAS QUÍMICAS DE TUBO DE FUEGO DE INDONESIA. PRONÓSTICO, POR APLICACIÓN INDUSTRIA, 2019-2032 (MILES DE MILLONES DE USD)
    TABLA 113. ESTIMACIONES Y ESTIMACIONES DEL TAMAÑO DEL MERCADO DE CALDERAS QUÍMICAS DE TUBO DE FUEGO DE INDONESIA. PRONÓSTICO, POR SISTEMA DE CONTROL, 2019-2032 (MILES DE MILLONES DE USD)
    TABLA 114. ESTIMACIONES Y ESTIMACIONES DEL TAMAÑO DEL MERCADO DE CALDERAS QUÍMICAS DE TUBO DE FUEGO DE INDONESIA. PRONÓSTICO, POR TIPO DE INSTALACIÓN, 2019-2032 (MILES DE MILLONES DE USD)
    TABLA 115. ESTIMACIONES Y ESTIMACIONES DEL TAMAÑO DEL MERCADO DE CALDERAS QUÍMICAS DE TUBO DE FUEGO DE INDONESIA. PRONÓSTICO, POR REGIONAL, 2019-2032 (MILES DE MILLONES DE USD)
    TABLA 116. ESTIMACIONES Y ESTIMACIONES DEL TAMAÑO DEL RESTO DEL MERCADO DE CALDERAS QUÍMICAS DE TUBO DE APAC APAC. PRONÓSTICO, POR TIPO DE CALDERA, 2019-2032 (MILES DE MILLONES DE USD)
    TABLA 117. ESTIMACIONES Y ESTIMACIONES DEL TAMAÑO DEL RESTO DEL MERCADO DE CALDERAS QUÍMICAS DE TUBO FUEGO DE APAC. PRONÓSTICO, POR TIPO DE COMBUSTIBLE, 2019-2032 (MILES DE MILLONES DE USD)
    TABLA 118. ESTIMACIONES Y ESTIMACIONES DEL TAMAÑO DEL RESTO DEL MERCADO DE CALDERAS QUÍMICAS DE TUBO DE APAC APAC. PRONÓSTICO, POR APLICACIÓN INDUSTRIA, 2019-2032 (MILES DE MILLONES DE USD)
    TABLA 119. ESTIMACIONES Y ESTIMACIONES DEL TAMAÑO DEL RESTO DEL MERCADO DE CALDERAS QUÍMICAS DE TUBO DE APAC DE APAC. PRONÓSTICO, POR SISTEMA DE CONTROL, 2019-2032 (MILES DE MILLONES DE USD)
    TABLA 120. ESTIMACIONES Y ESTIMACIONES DEL TAMAÑO DEL RESTO DEL MERCADO DE CALDERAS QUÍMICAS DE TUBO DE APAC APAC. PRONÓSTICO, POR TIPO DE INSTALACIÓN, 2019-2032 (MILES DE MILLONES DE USD)
    TABLA 121. ESTIMACIONES Y ESTIMACIONES DEL TAMAÑO DEL RESTO DEL MERCADO DE CALDERAS QUÍMICAS DE TUBO DE APAC DE APAC. PRONÓSTICO, POR REGIONAL, 2019-2032 (MILES DE MILLONES DE USD)
    TABLA 122. ESTIMACIONES Y ESTIMACIONES DEL TAMAÑO DEL MERCADO DE CALDERAS QUÍMICAS FURGOBULARES EN AMÉRICA DEL SUR. PRONÓSTICO, POR TIPO DE CALDERA, 2019-2032 (MILES DE MILLONES DE USD)
    TABLA 123. ESTIMACIONES Y ESTIMACIONES DEL TAMAÑO DEL MERCADO DE CALDERAS QUÍMICAS FURGOBULARES EN AMÉRICA DEL SUR. PRONÓSTICO, POR TIPO DE COMBUSTIBLE, 2019-2032 (MILES DE MILLONES DE USD)
    TABLA 124. ESTIMACIONES Y ESTIMACIONES DEL TAMAÑO DEL MERCADO DE CALDERAS QUÍMICAS DE TUBO DE FUEGO EN AMÉRICA DEL SUR. PRONÓSTICO, POR APLICACIÓN INDUSTRIA, 2019-2032 (MILES DE MILLONES DE USD)
    TABLA 125. ESTIMACIONES Y ESTIMACIONES DEL TAMAÑO DEL MERCADO DE CALDERAS QUÍMICAS DE TUBO FURGÓTICO EN AMÉRICA DEL SUR. PRONÓSTICO, POR SISTEMA DE CONTROL, 2019-2032 (MILES DE MILLONES DE USD)
    TABLA 126. ESTIMACIONES Y ESTIMACIONES DEL TAMAÑO DEL MERCADO DE CALDERAS QUÍMICAS FURGOBULARES EN AMÉRICA DEL SUR. PRONÓSTICO, POR TIPO DE INSTALACIÓN, 2019-2032 (MILES DE MILLONES DE USD)
    TABLA 127. ESTIMACIONES Y ESTIMACIONES DEL TAMAÑO DEL MERCADO DE CALDERAS QUÍMICAS DE TUBO DE FUEGO EN AMÉRICA DEL SUR. PRONÓSTICO, POR REGIONAL, 2019-2032 (MILES DE MILLONES DE USD)
    TABLA 128. ESTIMACIONES Y ESTIMACIONES DEL TAMAÑO DEL MERCADO DE CALDERAS QUÍMICAS FURGÓBICAS EN BRASIL. PRONÓSTICO, POR TIPO DE CALDERA, 2019-2032 (MILES DE MILLONES DE USD)
    TABLA 129. ESTIMACIONES Y PREVISIÓN DEL TAMAÑO DEL MERCADO DE CALDERAS QUÍMICAS FURGOBULARES EN BRASIL. PRONÓSTICO, POR TIPO DE COMBUSTIBLE, 2019-2032 (MILES DE MILLONES DE USD)
    TABLA 130. ESTIMACIONES Y ESTIMACIONES DEL TAMAÑO DEL MERCADO DE CALDERAS QUÍMICAS DE TUBO DE FUEGO EN BRASIL. PRONÓSTICO, POR APLICACIÓN DE LA INDUSTRIA, 2019-2032 (MILES DE MILLONES DE USD)
    TABLA 131. ESTIMACIONES Y ESTIMACIONES DEL TAMAÑO DEL MERCADO DE CALDERAS QUÍMICAS DE TUBO DE FUEGO EN BRASIL. PRONÓSTICO, POR SISTEMA DE CONTROL, 2019-2032 (MILES DE MILLONES DE USD)
    TABLA 132. ESTIMACIONES Y ESTIMACIONES DEL TAMAÑO DEL MERCADO DE CALDERAS QUÍMICAS FURGÓBICAS EN BRASIL. PRONÓSTICO, POR TIPO DE INSTALACIÓN, 2019-2032 (MILES DE MILLONES DE USD)
    TABLA 133. ESTIMACIONES Y ESTIMACIONES DEL TAMAÑO DEL MERCADO DE CALDERAS QUÍMICAS DE TUBO DE FUEGO EN BRASIL. PRONÓSTICO, POR REGIONAL, 2019-2032 (MILES DE MILLONES DE USD)
    TABLA 134. ESTIMACIONES Y ESTIMACIONES DEL TAMAÑO DEL MERCADO DE CALDERAS QUÍMICAS DE TUBO DE FUEGO EN MÉXICO. PRONÓSTICO, POR TIPO DE CALDERA, 2019-2032 (MILES DE MILLONES DE USD)
    TABLA 135. ESTIMACIONES Y POTENCIA DEL TAMAÑO DEL MERCADO DE CALDERAS QUÍMICAS FURGOBULARES EN MÉXICO. PRONÓSTICO, POR COMBUSTIBLETIPO, 2019-2032 (MILES DE MILLONES DE USD)
    TABLA 136. ESTIMACIONES Y ESTIMACIONES DEL TAMAÑO DEL MERCADO DE CALDERAS QUÍMICAS DE TUBO DE FUEGO EN MÉXICO. PRONÓSTICO, POR APLICACIÓN INDUSTRIA, 2019-2032 (MILES DE MILLONES DE USD)
    TABLA 137. ESTIMACIONES Y PROYECTOS DEL TAMAÑO DEL MERCADO DE CALDERAS QUÍMICAS DE TUBO DE FUEGO EN MÉXICO. PRONÓSTICO, POR SISTEMA DE CONTROL, 2019-2032 (MILES DE MILLONES DE USD)
    TABLA 138. ESTIMACIONES Y POTENCIA DEL TAMAÑO DEL MERCADO DE CALDERAS QUÍMICAS FURGOBULARES EN MÉXICO. PRONÓSTICO, POR TIPO DE INSTALACIÓN, 2019-2032 (MILES DE MILLONES DE USD)
    TABLA 139. ESTIMACIONES Y PROYECCIÓN DEL TAMAÑO DEL MERCADO DE CALDERAS QUÍMICAS FURGOBULARES EN MÉXICO. PRONÓSTICO, POR REGIONAL, 2019-2032 (MILES DE MILLONES DE USD)
    TABLA 140. ESTIMACIONES Y ESTIMACIONES DEL TAMAÑO DEL MERCADO DE CALDERAS QUÍMICAS DE TUBO DE ARGENTINA EN ARGENTINA. PRONÓSTICO, POR TIPO DE CALDERA, 2019-2032 (MILES DE MILLONES DE USD)
    TABLA 141. ESTIMACIONES Y ESTIMACIONES DEL TAMAÑO DEL MERCADO QUÍMICO DE CALDERAS FURGOBULARES EN ARGENTINA. PRONÓSTICO, POR TIPO DE COMBUSTIBLE, 2019-2032 (MILES DE MILLONES DE USD)
    TABLA 142. ESTIMACIONES Y ESTIMACIONES DEL TAMAÑO DEL MERCADO DE CALDERAS QUÍMICAS DE TUBO DE ARGENTINA EN ARGENTINA. PRONÓSTICO, POR APLICACIÓN INDUSTRIA, 2019-2032 (MILES DE MILLONES DE USD)
    TABLA 143. ESTIMACIONES Y ESTIMACIONES DEL TAMAÑO DEL MERCADO DE CALDERAS QUÍMICAS DE TUBO DE ARGENTINA EN ARGENTINA. PRONÓSTICO, POR SISTEMA DE CONTROL, 2019-2032 (MILES DE MILLONES DE USD)
    TABLA 144. ESTIMACIONES Y ESTIMACIONES DEL TAMAÑO DEL MERCADO DE CALDERAS QUÍMICAS FURGOBULARES EN ARGENTINA. PRONÓSTICO, POR TIPO DE INSTALACIÓN, 2019-2032 (MILES DE MILLONES DE USD)
    TABLA 145. ESTIMACIONES Y ESTIMACIONES DEL TAMAÑO DEL MERCADO DE CALDERAS QUÍMICAS DE TUBO DE ARGENTINA EN ARGENTINA. PRONÓSTICO, POR REGIONAL, 2019-2032 (MILES DE MILLONES DE USD)
    TABLA 146. ESTIMACIONES Y ESTIMACIONES DEL TAMAÑO DEL MERCADO DE CALDERAS QUÍMICAS FURGOBULARES PARA EL RESTO DE SUDAMÉRICA. PRONÓSTICO, POR TIPO DE CALDERA, 2019-2032 (MILES DE MILLONES DE USD)
    TABLA 147. ESTIMACIONES Y ESTIMACIONES DEL TAMAÑO DEL MERCADO DE CALDERAS QUÍMICAS FURGOBULARES PARA EL RESTO DE SUDAMÉRICA. PRONÓSTICO, POR TIPO DE COMBUSTIBLE, 2019-2032 (MILES DE MILLONES DE USD)
    TABLA 148. ESTIMACIONES Y ESTIMACIONES DEL TAMAÑO DEL MERCADO DE CALDERAS QUÍMICAS FURGOBULARES PARA EL RESTO DE SUDAMÉRICA. PRONÓSTICO, POR APLICACIÓN INDUSTRIA, 2019-2032 (MILES DE MILLONES DE USD)
    TABLA 149. ESTIMACIONES Y ESTIMACIONES DEL TAMAÑO DEL MERCADO DE CALDERAS QUÍMICAS FURGOBULARES PARA EL RESTO DE SUDAMÉRICA. PRONÓSTICO, POR SISTEMA DE CONTROL, 2019-2032 (MILES DE MILLONES DE USD)
    TABLA 150. ESTIMACIONES Y ESTIMACIONES DEL TAMAÑO DEL MERCADO DE CALDERAS QUÍMICAS FURGOBULARES PARA EL RESTO DE SUDAMÉRICA. PRONÓSTICO, POR TIPO DE INSTALACIÓN, 2019-2032 (MILES DE MILLONES DE USD)
    TABLA 151. ESTIMACIONES Y ESTIMACIONES DEL TAMAÑO DEL MERCADO DE CALDERAS QUÍMICAS FURGOBULARES PARA EL RESTO DE SUDAMÉRICA. PRONÓSTICO, POR REGIONAL, 2019-2032 (MILES DE MILLONES DE USD)
    TABLA 152. ESTIMACIONES Y ESTIMACIONES DEL TAMAÑO DEL MERCADO DE CALDERAS QUÍMICAS DE TUBO DE FUEGO MEA. PRONÓSTICO, POR TIPO DE CALDERA, 2019-2032 (MILES DE MILLONES DE USD)
    TABLA 153. ESTIMACIONES Y ESTIMACIONES DEL TAMAÑO DEL MERCADO DE CALDERAS QUÍMICAS DE TUBO DE FUEGO MEA. PRONÓSTICO, POR TIPO DE COMBUSTIBLE, 2019-2032 (MILES DE MILLONES DE USD)
    TABLA 154. ESTIMACIONES Y ESTIMACIONES DEL TAMAÑO DEL MERCADO DE CALDERAS QUÍMICAS DE TUBO DE FUEGO MEA. PRONÓSTICO, POR APLICACIÓN INDUSTRIA, 2019-2032 (MILES DE MILLONES DE USD)
    TABLA 155. ESTIMACIONES Y ESTIMACIONES DEL TAMAÑO DEL MERCADO DE CALDERAS QUÍMICAS DE TUBO DE FUEGO MEA. PRONÓSTICO, POR SISTEMA DE CONTROL, 2019-2032 (MILES DE MILLONES DE USD)
    TABLA 156. ESTIMACIONES Y ESTIMACIONES DEL TAMAÑO DEL MERCADO DE CALDERAS QUÍMICAS DE TUBO DE FUEGO MEA. PRONÓSTICO, POR TIPO DE INSTALACIÓN, 2019-2032 (MILES DE MILLONES DE USD)
    TABLA 157. ESTIMACIONES Y ESTIMACIONES DEL TAMAÑO DEL MERCADO DE CALDERAS QUÍMICAS DE TUBO DE FUEGO MEA. PRONÓSTICO, POR REGIONAL, 2019-2032 (MILES DE MILLONES DE USD)
    TABLA 158. ESTIMACIONES Y ESTIMACIONES DEL TAMAÑO DEL MERCADO DE CALDERAS QUÍMICAS TUBOBICAS DE LOS PAÍSES DEL CCG. PRONÓSTICO, POR TIPO DE CALDERA, 2019-2032 (MILES DE MILLONES DE USD)
    TABLA 159. ESTIMACIONES Y ESTIMACIONES DEL TAMAÑO DEL MERCADO DE CALDERAS QUÍMICAS FURGOBULARES DE LOS PAÍSES DEL CCG. PRONÓSTICO, POR TIPO DE COMBUSTIBLE, 2019-2032 (MILES DE MILLONES DE USD)
    TABLA 160. ESTIMACIONES Y ESTIMACIONES DEL TAMAÑO DEL MERCADO DE CALDERAS QUÍMICAS FURGOBULARES DE LOS PAÍSES DEL CCG. PRONÓSTICO, POR APLICACIÓN INDUSTRIA, 2019-2032 (MILES DE MILLONES DE USD)
    TABLA 161. ESTIMACIONES Y ESTIMACIONES DEL TAMAÑO DEL MERCADO DE CALDERAS QUÍMICAS FURGOBULARES DE LOS PAÍSES DEL CCG. PRONÓSTICO, POR SISTEMA DE CONTROL, 2019-2032 (MILES DE MILLONES DE USD)
    TABLA 162. ESTIMACIONES Y ESTIMACIONES DEL TAMAÑO DEL MERCADO DE CALDERAS QUÍMICAS FURGOBULARES DE LOS PAÍSES DEL CCG. PRONÓSTICO, POR TIPO DE INSTALACIÓN, 2019-2032 (MILES DE MILLONES DE USD)
    TABLA 163. ESTIMACIONES Y ESTIMACIONES DEL TAMAÑO DEL MERCADO DE CALDERAS QUÍMICAS FURGOBULARES DE LOS PAÍSES DEL CCG. PRONÓSTICO, POR REGIONAL, 2019-2032 (MILES DE MILLONES DE USD)
    TABLA 164. ESTIMACIONES Y ESTIMACIONES DEL TAMAÑO DEL MERCADO DE CALDERAS QUÍMICAS DE TUBO DE FUEGO EN SUDÁFRICA. PRONÓSTICO, POR TIPO DE CALDERA, 2019-2032 (MILES DE MILLONES DE USD)
    TABLA 165. ESTIMACIONES Y ESTIMACIONES DEL TAMAÑO DEL MERCADO DE CALDERAS QUÍMICAS DE TUBO DE FUEGO EN SUDÁFRICA. PRONÓSTICO, POR TIPO DE COMBUSTIBLE, 2019-2032 (MILES DE MILLONES DE USD)
    TABLA 166. ESTIMACIONES Y ESTIMACIONES DEL TAMAÑO DEL MERCADO DE CALDERAS QUÍMICAS DE TUBO DE FUEGO EN SUDÁFRICA. PRONÓSTICO, POR APLICACIÓN INDUSTRIA, 2019-2032 (MILES DE MILLONES DE USD)
    TABLA 167. ESTIMACIONES Y ESTIMACIONES DEL TAMAÑO DEL MERCADO DE CALDERAS QUÍMICAS DE TUBO DE FUEGO EN SUDÁFRICA. PRONÓSTICO, POR SISTEMA DE CONTROL, 2019-2032 (MILES DE MILLONES DE USD)
    TABLA 168. ESTIMACIONES Y ESTIMACIONES DEL TAMAÑO DEL MERCADO DE CALDERAS QUÍMICAS DE TUBO DE FUEGO EN SUDÁFRICA. PRONÓSTICO, POR TIPO DE INSTALACIÓN, 2019-2032 (MILES DE MILLONES DE USD)
    TABLA 169. ESTIMACIONES Y ESTIMACIONES DEL TAMAÑO DEL MERCADO DE CALDERAS QUÍMICAS DE TUBO DE FUEGO EN SUDÁFRICA. PRONÓSTICO, POR REGIONAL, 2019-2032 (MILES DE MILLONES DE USD)
    TABLA 170. ESTIMACIONES Y ESTIMACIONES DEL TAMAÑO DEL MERCADO DE CALDERAS QUÍMICAS DE TUBO DE FUEGO RESTO DE MEA. PRONÓSTICO, POR TIPO DE CALDERA, 2019-2032 (MILES DE MILLONES DE USD)
    TABLA 171. ESTIMACIONES Y ESTIMACIONES DEL TAMAÑO DEL MERCADO DE CALDERAS QUÍMICAS DE TUBO DE FUEGO RESTO DE MEA. PRONÓSTICO, POR TIPO DE COMBUSTIBLE, 2019-2032 (MILES DE MILLONES DE USD)
    TABLA 172. ESTIMACIONES Y ESTIMACIONES DEL TAMAÑO DEL MERCADO DE CALDERAS QUÍMICAS DE TUBO DE FUEGO RESTO DE MEA. PRONÓSTICO, POR APLICACIÓN INDUSTRIA, 2019-2032 (MILES DE MILLONES DE USD)
    TABLA 173. ESTIMACIONES Y ESTIMACIONES DEL TAMAÑO DEL MERCADO DE CALDERAS QUÍMICAS DE TUBO DE FUEGO RESTO DE MEA. PRONÓSTICO, POR SISTEMA DE CONTROL, 2019-2032 (MILES DE MILLONES DE USD)
    TABLA 174. ESTIMACIONES Y ESTIMACIONES DEL TAMAÑO DEL MERCADO DE CALDERAS QUÍMICAS DE TUBO DE FUEGO RESTO DE MEA. PRONÓSTICO, POR TIPO DE INSTALACIÓN, 2019-2032 (MILES DE MILLONES DE USD)
    TABLA 175. ESTIMACIONES Y ESTIMACIONES DEL TAMAÑO DEL MERCADO DE CALDERAS QUÍMICAS DE TUBO DE FUEGO RESTO DE MEA. PRONÓSTICO, POR REGIONAL, 2019-2032 (MILES DE MILLONES DE USD)
    TABLA 176. LANZAMIENTO/DESARROLLO/APROBACIÓN DE PRODUCTOS
    TABLA 177. ADQUISICIÓN/ASOCIACIÓN


    LISTA DE CIFRAS

    FIGURA 1. SINOPSIS DEL MERCADO
    FIGURA 2. ANÁLISIS DEL MERCADO DE CALDERAS QUÍMICAS FURGOBULARES EN AMÉRICA DEL NORTE
    FIGURA 3. A NOSOTROS ANÁLISIS DEL MERCADO DE CALDERAS QUÍMICAS DE FUEGO POR TIPO DE CALDERA
    FIGURA 4. ANÁLISIS DEL MERCADO DE CALDERAS QUÍMICAS DE FUEGO DE EE. UU. POR TIPO DE COMBUSTIBLE
    FIGURA 5. ANÁLISIS DEL MERCADO DE CALDERAS QUÍMICAS DE FUEGO DE EE. UU. POR APLICACIÓN INDUSTRIA
    FIGURA 6. MERCADO DE CALDERAS QUÍMICAS DE TUBO DE FUEGO DE EE. UU. ANÁLISIS POR SISTEMA DE CONTROL
    FIGURA 7. MERCADO DE CALDERAS QUÍMICAS TUBULARES DE FUEGO DE EE. UU. ANÁLISIS POR TIPO DE INSTALACIÓN
    FIGURA 8. ANÁLISIS DEL MERCADO DE CALDERAS QUÍMICAS TUBULARES DE FUEGO DE EE. UU. POR REGIONAL
    FIGURA 9. MERCADO DE CALDERAS QUÍMICAS DE TUBO FUEGO DE CANADÁ ANÁLISIS POR TIPO DE CALDERA
    FIGURA 10. ANÁLISIS DEL MERCADO DE CALDERAS QUÍMICAS DE TUBO DE FUEGO DE CANADÁ POR TIPO DE COMBUSTIBLE
    FIGURA 11. ANÁLISIS DEL MERCADO DE CALDERAS QUÍMICAS DE TUBO DE FUEGO DE CANADÁ POR APLICACIÓN DE LA INDUSTRIA
    FIGURA 12. ANÁLISIS DEL MERCADO DE CALDERAS QUÍMICAS DE TUBO DE FUEGO DE CANADÁ POR SISTEMA DE CONTROL
    FIGURA 13. TUBO DE FUEGO DE CANADÁ ANÁLISIS DEL MERCADO DE CALDERAS QUÍMICAS POR TIPO DE INSTALACIÓN
    FIGURA 14. ANÁLISIS DEL MERCADO DE CALDERAS QUÍMICAS FURGOBULARES EN CANADÁ POR REGIONAL
    FIGURA 15. ANÁLISIS DEL MERCADO DE CALDERAS QUÍMICAS FURGOBULARES EN EUROPA
    FIGURA 16. MERCADO DE CALDERAS QUÍMICAS FURGOBULARES EN ALEMANIA ANÁLISIS POR TIPO DE CALDERA
    FIGURA 17. ANÁLISIS DEL MERCADO DE CALDERAS QUÍMICAS TUBULARES DE FUEGO EN ALEMANIA POR TIPO DE COMBUSTIBLE
    FIGURA 18. ANÁLISIS DEL MERCADO DE CALDERAS QUÍMICAS TUBULARES DE FUEGO EN ALEMANIA POR APLICACIÓN INDUSTRIAL
    FIGURA 19. ANÁLISIS DEL MERCADO DE CALDERAS QUÍMICAS TUBULARES DE FUEGO EN ALEMANIA POR SISTEMA DE CONTROL
    FIGURA 20. ANÁLISIS DEL MERCADO DE CALDERAS QUÍMICAS DE FUEGO EN ALEMANIA POR TIPO DE INSTALACIÓN
    FIGURA 21. ANÁLISIS DEL MERCADO DE CALDERAS QUÍMICAS DE FUEGO EN ALEMANIA POR REGIONAL
    FIGURA 22. ANÁLISIS DEL MERCADO DE CALDERAS QUÍMICAS DE FUEGO EN EL REINO UNIDO POR TIPO DE CALDERA
    FIGURA 23. ANÁLISIS DEL MERCADO DE CALDERAS QUÍMICAS DE FUEGO DEL REINO UNIDO POR TIPO DE COMBUSTIBLE
    FIGURA 24. ANÁLISIS DEL MERCADO DE CALDERAS QUÍMICAS DE FUEGO DEL REINO UNIDO POR APLICACIÓN INDUSTRIA
    FIGURA 25. ANÁLISIS DEL MERCADO DE CALDERAS QUÍMICAS DE FUEGO DEL REINO UNIDO POR SISTEMA DE CONTROL
    FIGURA 26. QUÍMICO PARA TUBO DE FUEGO DEL REINO UNIDO ANÁLISIS DEL MERCADO DE CALDERAS POR TIPO DE INSTALACIÓN
    FIGURA 27. ANÁLISIS DEL MERCADO DE CALDERAS QUÍMICAS FURGOBULARES DEL REINO UNIDO POR REGIONAL
    FIGURA 28. ANÁLISIS DEL MERCADO DE CALDERAS QUÍMICAS FURGOBULARES DE FRANCIA POR TIPO DE CALDERA
    FIGURA 29. FRANCIA QUÍMICA FURGOBULAR ANÁLISIS DEL MERCADO DE CALDERAS POR TIPO DE COMBUSTIBLE
    FIGURA 30. ANÁLISIS DEL MERCADO DE CALDERAS QUÍMICAS DE FUEGO EN FRANCIA POR APLICACIÓN INDUSTRIA
    FIGURA 31. ANÁLISIS DEL MERCADO DE CALDERAS QUÍMICAS DE FUEGO EN FRANCIA POR SISTEMA DE CONTROL
    FIGURA 32. MERCADO DE CALDERAS QUÍMICAS DE FUEGO EN FRANCIA ANÁLISIS POR TIPO DE INSTALACIÓN
    FIGURA 33. ANÁLISIS DEL MERCADO DE CALDERAS QUÍMICAS DE FUEGO EN FRANCIA POR TIPO DE CALDERA
    FIGURA 34. ANÁLISIS DEL MERCADO DE CALDERAS QUÍMICAS DE FUEGO DE RUSIA POR TIPO DE CALDERA
    FIGURA 35. ANÁLISIS DEL MERCADO DE CALDERAS QUÍMICAS DE FUEGO DE RUSIA POR TIPO DE COMBUSTIBLE
    FIGURA 36. ANÁLISIS DEL MERCADO DE CALDERAS QUÍMICAS DE TUBO DE FUEGO DE RUSIA POR APLICACIÓN INDUSTRIA
    FIGURA 37. ANÁLISIS DEL MERCADO DE CALDERAS QUÍMICAS DE TUBO DE FUEGO DE RUSIA POR SISTEMA DE CONTROL
    FIGURA 38. ANÁLISIS DEL MERCADO DE CALDERAS QUÍMICAS DE TUBO DE FUEGO DE RUSIA POR TIPO DE INSTALACIÓN
    CIFRA 39. ANÁLISIS DEL MERCADO DE CALDERAS QUÍMICAS TUBULARES DE RUSIA POR REGIONAL
    FIGURA 40. ANÁLISIS DEL MERCADO DE CALDERAS QUÍMICAS TUBULARES DE FUEGO EN ITALIA POR TIPO DE CALDERA
    FIGURA 41. ANÁLISIS DEL MERCADO DE CALDERAS QUÍMICAS TUBULARES DE FUEGO EN ITALIA POR TIPO DE COMBUSTIBLE
    FIGURA 42. ITALIA ANÁLISIS DEL MERCADO DE CALDERAS QUÍMICAS DE FUEGO POR APLICACIÓN INDUSTRIA
    FIGURA 43. ANÁLISIS DEL MERCADO DE CALDERAS QUÍMICAS DE FUEGO EN ITALIA POR SISTEMA DE CONTROL
    FIGURA 44. ANÁLISIS DEL MERCADO DE CALDERAS QUÍMICAS DE FUEGO EN ITALIA POR TIPO DE INSTALACIÓN
    FIGURA 45. TUBO DE FUEGO ITALIA ANÁLISIS DEL MERCADO DE CALDERAS QUÍMICAS POR REGIONAL
    GRÁFICO 46. ANÁLISIS DEL MERCADO DE CALDERAS QUÍMICAS FURGOBULARES EN ESPAÑA POR TIPO DE CALDERA
    FIGURA 47. ANÁLISIS DEL MERCADO DE CALDERAS QUÍMICAS FURGOBULARES EN ESPAÑA POR TIPO DE COMBUSTIBLE
    FIGURA 48. ESPAÑA MERCADO DE CALDERAS QUÍMICAS ANÁLISIS POR APLICACIÓN INDUSTRIA
    FIGURA 49. MERCADO DE CALDERAS QUÍMICAS FURGOBULARES EN ESPAÑA ANÁLISIS POR SISTEMA DE CONTROL
    FIGURA 50. ANÁLISIS DEL MERCADO DE CALDERAS QUÍMICAS FURGOBULARES EN ESPAÑA POR TIPO DE INSTALACIÓN
    FIGURA 51. CALDERAS QUÍMICAS FURGOBULARES EN ESPAÑA ANÁLISIS DE MERCADO POR REGIONALES
    FIGURA 52. RESTO DE EUROPA ANÁLISIS DEL MERCADO DE CALDERAS QUÍMICAS FUEGO POR TIPO DE CALDERA
    FIGURA 53. RESTO DE EUROPA ANÁLISIS DEL MERCADO DE CALDERAS QUÍMICAS FUEGO POR TIPO DE COMBUSTIBLE
    FIGURA 54. RESTO DE EUROPA FUEGO TUBO ANÁLISIS DEL MERCADO DE CALDERAS QUÍMICAS POR INDUSTRIA APLICACIÓN
    FIGURA 55. RESTO DE EUROPA ANÁLISIS DEL MERCADO DE CALDERAS QUÍMICAS FUEGO POR SISTEMA DE CONTROL
    FIGURA 56. RESTO DE EUROPA ANÁLISIS DEL MERCADO DE CALDERAS QUÍMICAS FUEGO POR TIPO DE INSTALACIÓN
    FIGURA 57. RESTO DE EUROPA FUEGO ANÁLISIS DEL MERCADO DE CALDERAS QUÍMICAS DE TUBO POR REGIONALES
    FIGURA 58. ANÁLISIS DEL MERCADO DE CALDERAS QUÍMICAS DE TUBO DE FUEGO DE APAC
    FIGURA 59. ANÁLISIS DEL MERCADO DE CALDERAS QUÍMICAS DE TUBO DE FUEGO DE CHINA POR TIPO DE CALDERA
    FIGURA 60. ANÁLISIS DEL MERCADO DE CALDERAS QUÍMICAS DE TUBO DE FUEGO DE CHINA POR TIPO DE COMBUSTIBLE
    FIGURA 61. INCENDIO EN CHINA ANÁLISIS DEL MERCADO DE CALDERAS QUÍMICAS DE TUBO DE FUEGO POR APLICACIÓN INDUSTRIA
    FIGURA 62. ANÁLISIS DEL MERCADO DE CALDERAS QUÍMICAS DE TUBO DE FUEGO DE CHINA POR SISTEMA DE CONTROL
    FIGURA 63. ANÁLISIS DEL MERCADO DE CALDERAS QUÍMICAS DE TUBO DE FUEGO DE CHINA POR TIPO DE INSTALACIÓN
    FIGURA 64. CHINA CALDERA QUÍMICA DE TUBO DE FUEGO ANÁLISIS DE MERCADO POR REGIONAL
    FIGURA 65. INDIA ANÁLISIS DEL MERCADO DE CALDERAS QUÍMICAS DE TUBO DE FUEGO POR TIPO DE CALDERA
    FIGURA 66. ANÁLISIS DEL MERCADO DE CALDERAS DE QUÍMICO DE TUBO DE FUEGO DE INDIA POR TIPO DE COMBUSTIBLE
    FIGURA 67. CALDERA DE QUÍMICO DE TUBO DE FUEGO DE INDIA ANÁLISIS DE MERCADO POR APLICACIÓN DE LA INDUSTRIA
    FIGURA 68. ANÁLISIS DEL MERCADO DE CALDERAS QUÍMICAS DE TUBO DE FUEGO DE LA INDIA POR SISTEMA DE CONTROL
    FIGURA 69. ANÁLISIS DEL MERCADO DE CALDERAS QUÍMICAS DE TUBO DE FUEGO DE LA INDIA POR TIPO DE INSTALACIÓN
    FIGURA 70. ANÁLISIS DEL MERCADO DE CALDERAS QUÍMICAS DE TUBO DE FUEGO DE LA INDIA POR REGIONAL
    FIGURA 71. ANÁLISIS DEL MERCADO DE CALDERAS QUÍMICAS DE TUBO DE FUEGO DE JAPÓN POR TIPO DE CALDERA
    FIGURA 72. ANÁLISIS DEL MERCADO DE CALDERAS QUÍMICAS DE TUBO DE FUEGO DE JAPÓN POR TIPO DE COMBUSTIBLE
    FIGURA 73. ANÁLISIS DEL MERCADO DE CALDERAS QUÍMICAS DE TUBO DE FUEGO DE JAPÓN POR APLICACIÓN INDUSTRIA < br />FIGURA 74. ANÁLISIS DEL MERCADO DE CALDERAS QUÍMICAS DE TUBO DE FUEGO DE JAPÓN POR SISTEMA DE CONTROL
    FIGURA 75. ANÁLISIS DEL MERCADO DE CALDERAS QUÍMICAS DE TUBO DE FUEGO DE JAPÓN POR TIPO DE INSTALACIÓN
    FIGURA 76. ANÁLISIS DEL MERCADO DE CALDERAS QUÍMICAS DE TUBO DE FUEGO DE JAPÓN POR REGIONAL
    FIGURA 77. SURANÁLISIS DEL MERCADO DE CALDERAS QUÍMICAS DE FUEGO DE COREA POR TIPO DE CALDERA
    FIGURA 78. ANÁLISIS DEL MERCADO DE CALDERAS QUÍMICAS DE FUEGO DE COREA DEL SUR POR TIPO DE COMBUSTIBLE
    FIGURA 79. ANÁLISIS DEL MERCADO DE CALDERAS QUÍMICAS DE FUEGO DE COREA DEL SUR POR APLICACIÓN INDUSTRIA
    FIGURA 80. ANÁLISIS DEL MERCADO DE CALDERAS QUÍMICAS FURGOBULARES DE COREA DEL SUR POR SISTEMA DE CONTROL
    FIGURA 81. ANÁLISIS DEL MERCADO DE CALDERAS QUÍMICAS FURGOBULARES DE COREA DEL SUR POR TIPO DE INSTALACIÓN
    FIGURA 82. ANÁLISIS DEL MERCADO DE CALDERAS QUÍMICAS FURGOBULARES DE COREA DEL SUR POR REGIONAL
    GRÁFICO 83. MALASIA ANÁLISIS DEL MERCADO DE CALDERAS QUÍMICAS DE FUEGO POR TIPO DE CALDERA
    FIGURA 84. ANÁLISIS DEL MERCADO DE CALDERAS QUÍMICAS DE FUEGO DE MALASIA POR TIPO DE COMBUSTIBLE
    FIGURA 85. ANÁLISIS DEL MERCADO DE CALDERAS QUÍMICAS DE FUEGO DE MALASIA POR APLICACIÓN INDUSTRIA
    FIGURA 86. MALASIA ANÁLISIS DEL MERCADO DE CALDERAS QUÍMICAS DE FUEGO POR SISTEMA DE CONTROL
    FIGURA 87. ANÁLISIS DEL MERCADO DE CALDERAS QUÍMICAS DE FUEGO POR TIPO DE INSTALACIÓN
    FIGURA 88. ANÁLISIS DEL MERCADO DE CALDERAS QUÍMICAS DE FUEGO POR TIPO REGIONAL
    FIGURA 89. TAILANDIA TUBO DE FUEGO QUÍMICO ANÁLISIS DEL MERCADO DE CALDERAS POR TIPO DE CALDERA
    FIGURA 90. ANÁLISIS DEL MERCADO DE CALDERAS QUÍMICAS DE TUBO DE FUEGO DE TAILANDIA POR TIPO DE COMBUSTIBLE
    FIGURA 91. ANÁLISIS DEL MERCADO DE CALDERAS QUÍMICAS DE TUBO DE FUEGO DE TAILANDIA POR APLICACIÓN INDUSTRIA
    FIGURA 92. TUBO DE FUEGO DE TAILANDIA CALDERA QUÍMICA ANÁLISIS DE MERCADO POR SISTEMA DE CONTROL
    FIGURA 93. TAILANDIA ANÁLISIS DEL MERCADO DE CALDERAS QUÍMICAS DE TUBO DE FUEGO POR TIPO DE INSTALACIÓN
    FIGURA 94. ANÁLISIS DEL MERCADO DE CALDERAS DE QUÍMICO DE TUBO DE FUEGO DE TAILANDIA POR REGIONAL
    FIGURA 95. CALDERAS DE QUÍMICO DE TUBO DE FUEGO DE INDONESIA ANÁLISIS DE MERCADO POR TIPO DE CALDERA
    FIGURA 96. ANÁLISIS DEL MERCADO DE CALDERAS QUÍMICAS DE FUEGO DE INDONESIA POR TIPO DE COMBUSTIBLE
    FIGURA 97. ANÁLISIS DEL MERCADO DE CALDERAS QUÍMICAS DE FUEGO DE INDONESIA POR APLICACIÓN INDUSTRIA
    FIGURA 98. ANÁLISIS DEL MERCADO DE CALDERAS QUÍMICAS DE FUEGO DE INDONESIA POR CONTROL SISTEMA
    FIGURA 99. ANÁLISIS DEL MERCADO DE CALDERAS QUÍMICAS DE TUBOS DE FUEGO DE INDONESIA POR TIPO DE INSTALACIÓN
    FIGURA 100. ANÁLISIS DEL MERCADO DE CALDERAS QUÍMICAS DE TUBOS DE FUEGO DE INDONESIA POR REGIONAL
    FIGURA 101. ANÁLISIS DEL MERCADO DE CALDERAS QUÍMICAS DE TUBOS DE FUEGO DEL RESTO DE APAC POR CALDERA TIPO
    FIGURA 102. ANÁLISIS DEL MERCADO DE CALDERAS QUÍMICAS DE FUEGO RESTO DE APAC POR TIPO DE COMBUSTIBLE
    FIGURA 103. ANÁLISIS DEL MERCADO DE CALDERAS QUÍMICAS DE FUEGO DE APAC RESTO POR APLICACIÓN INDUSTRIA
    FIGURA 104. RESTO DE FUEGO DE APAC MERCADO DE CALDERAS QUÍMICAS DE TUBO ANÁLISIS POR SISTEMA DE CONTROL
    FIGURA 105. RESTO DEL MERCADO DE CALDERAS QUÍMICAS FUGATUBICAS DE APAC ANÁLISIS POR TIPO DE INSTALACIÓN
    FIGURA 106. RESTO DEL MERCADO DE CALDERAS QUÍMICAS FUGATUBICAS DE APAC ANÁLISIS POR REGIONAL
    FIGURA 107. AMÉRICA DEL SUR MERCADO DE CALDERAS QUÍMICAS DE TUBO DE FUEGO ANÁLISIS
    FIGURA 108. ANÁLISIS DEL MERCADO DE CALDERAS QUÍMICAS TUBULARES DE FUEGO EN BRASIL POR TIPO DE CALDERA
    FIGURA 109. ANÁLISIS DEL MERCADO DE CALDERAS QUÍMICAS TUBULARES DE FUEGO EN BRASIL POR TIPO DE COMBUSTIBLE
    FIGURA 110. ANÁLISIS DEL MERCADO DE CALDERAS QUÍMICAS TUBULARES DE FUEGO EN BRASIL POR INDUSTRIA APLICACIÓN
    FIGURA 111. ANÁLISIS DEL MERCADO DE CALDERAS QUÍMICAS TUBULARES DE FUEGO EN BRASIL POR SISTEMA DE CONTROL
    FIGURA 112. ANÁLISIS DEL MERCADO DE CALDERAS QUÍMICAS TUBULARES DE FUEGO EN BRASIL POR TIPO DE INSTALACIÓN
    FIGURA 113. ANÁLISIS DEL MERCADO DE CALDERAS QUÍMICAS TUBULARES DE FUEGO EN BRASIL POR REGIONALES
    />FIGURA 114. ANÁLISIS DEL MERCADO DE CALDERAS QUÍMICAS FURGOBULARES EN MÉXICO POR TIPO DE CALDERA
    FIGURA 115. ANÁLISIS DEL MERCADO DE CALDERAS QUÍMICAS FURGOBULARES EN MÉXICO POR TIPO DE COMBUSTIBLE
    FIGURA 116. ANÁLISIS DEL MERCADO DE CALDERAS QUÍMICAS FURGOBULARES EN MÉXICO POR APLICACIÓN DE INDUSTRIA < hermano />FIGURA 117. ANÁLISIS DEL MERCADO DE CALDERAS QUÍMICAS FURGOBULARES EN MÉXICO POR SISTEMA DE CONTROL
    FIGURA 118. ANÁLISIS DEL MERCADO DE CALDERAS QUÍMICAS FURGOBUBULARES EN MÉXICO POR TIPO DE INSTALACIÓN
    FIGURA 119. ANÁLISIS DEL MERCADO DE CALDERAS QUÍMICAS FURGOBULARES EN MÉXICO POR REGIONAL
    FIGURA 120. ANÁLISIS DEL MERCADO DE CALDERAS QUÍMICAS FURGOBULARES EN ARGENTINA POR TIPO DE CALDERA
    FIGURA 121. ANÁLISIS DEL MERCADO DE CALDERAS QUÍMICAS FURGOBULARES EN ARGENTINA POR TIPO DE COMBUSTIBLE
    FIGURA 122. ANÁLISIS DEL MERCADO DE CALDERAS QUÍMICAS FURGOBULARES EN ARGENTINA POR APLICACIÓN INDUSTRIA
    FIGURA 123. ANÁLISIS DEL MERCADO DE CALDERAS QUÍMICAS FURGOBULARES EN ARGENTINA POR TIPO DE INSTALACIÓN
    FIGURA 125. ANÁLISIS DEL MERCADO DE CALDERAS QUÍMICAS FURGOBUBULARES EN ARGENTINA POR TIPO DE INSTALACIÓN
    FIGURA 125. ANÁLISIS DEL MERCADO DE CALDERAS QUÍMICAS FURGOBUBULARES EN ARGENTINA POR REGIONAL
    FIGURA 126. RESTO DE SUDAMÉRICA ANÁLISIS DEL MERCADO DE CALDERAS QUÍMICAS FUEGO POR TIPO DE CALDERA
    FIGURA 127. RESTO DE SUDAMÉRICA ANÁLISIS DEL MERCADO DE CALDERAS QUÍMICAS FUEGO POR TIPO DE COMBUSTIBLE
    FIGURA 128. RESTO DE SUDAMÉRICA FUEGO CALDERA QUÍMICA DE TUBO ANÁLISIS DE MERCADO POR APLICACIÓN INDUSTRIA
    FIGURA 129. RESTO DE SUR AMÉRICA ANÁLISIS DE MERCADO DE CALDERAS QUÍMICAS FUEGO POR SISTEMA DE CONTROL
    FIGURA 130. RESTO DE SUR AMÉRICA ANÁLISIS DEL MERCADO DE CALDERAS QUÍMICAS FUEGO POR TIPO DE INSTALACIÓN
    FIGURA 131. RESTO DE ANÁLISIS DEL MERCADO DE CALDERAS QUÍMICAS TUBULARES DE SUDAMÉRICA POR REGIONAL
    FIGURA 132. ANÁLISIS DEL MERCADO DE CALDERAS QUÍMICAS TUBULARES DE MEA
    FIGURA 133. PAÍSES DEL CCG ANÁLISIS DEL MERCADO DE CALDERAS QUÍMICAS TUBULARES DE FUEGO POR TIPO DE CALDERA
    FIGURA 134. CCG PAÍSES FUEGO ANÁLISIS DEL MERCADO DE CALDERAS QUÍMICAS DE TUBO POR TIPO DE COMBUSTIBLE
    FIGURA 135. PAÍSES DEL CCG ANÁLISIS DEL MERCADO DE CALDERAS QUÍMICAS DE TUBO POR APLICACIÓN INDUSTRIA
    FIGURA 136. ANÁLISIS DEL MERCADO DE CALDERAS DE TUBO QUÍMICO DE LOS PAÍSES DEL CCG POR SISTEMA DE CONTROL
    FIGURA 137 PAÍSES DEL CCG ANÁLISIS DEL MERCADO DE CALDERAS QUÍMICAS FURGOBULARES POR TIPO DE INSTALACIÓN
    FIGURA 138. ANÁLISIS DEL MERCADO DE CALDERAS QUÍMICAS FURGOBULARES DE LOS PAÍSES DEL CCG POR REGIONAL
    FIGURA 139. ANÁLISIS DEL MERCADO DE CALDERAS QUÍMICAS FURGOBULARES DE SUDÁFRICA POR TIPO DE CALDERA
    FIGURA 140 . ANÁLISIS DEL MERCADO DE CALDERAS QUÍMICAS DE TUBO DE FUEGO EN SUDÁFRICA POR TIPO DE COMBUSTIBLE
    FIGURA 141. ANÁLISIS DEL MERCADO DE CALDERAS QUÍMICAS DE TUBO DE FUEGO EN SUDÁFRICA POR APLICACIÓN INDUSTRIA
    FIGURA 142. ANÁLISIS DEL MERCADO DE CALDERAS QUÍMICAS DE TUBO DE FUEGO EN SUDÁFRICA POR SISTEMA DE CONTROL
    FIGURA 143. ANÁLISIS DEL MERCADO DE CALDERAS QUÍMICAS DE TUBO DE FUEGO EN SUDÁFRICA POR TIPO DE INSTALACIÓN
    FIGURA 144. ANÁLISIS DEL MERCADO DE CALDERAS QUÍMICAS DE TUBO DE FUEGO EN SUDÁFRICA POR REGIONAL
    FIGURA 145. ANÁLISIS DEL MERCADO DE CALDERAS QUÍMICAS DE TUBO DE FUEGO DEL RESTO DE MEA POR TIPO DE CALDERA < hermano />FIGURA 146. ANÁLISIS DEL MERCADO DE CALDERAS QUÍMICAS RESTO DE MEA POR TIPO DE COMBUSTIBLE
    FIGURA 147. ANÁLISIS DEL MERCADO DE CALDERAS QUÍMICAS RESTO DE MEA POR APLICACIÓN INDUSTRIA
    FIGURA 148. RESTO DE CALDERAS QUÍMICAS DE FUEGO MEA ANÁLISIS DE MERCADO POR SISTEMA DE CONTROL
    FIGURA 149. ANÁLISIS DEL MERCADO DE CALDERAS QUÍMICAS RESTO DE MEA POR TIPO DE INSTALACIÓN
    FIGURA 150. ANÁLISIS DEL MERCADO DE CALDERAS QUÍMICAS RESTO DE MEA POR REGIONAL
    FIGURA 151. CRITERIOS CLAVE DE COMPRA DE TUBO DE FUEGO MERCADO DE CALDERAS QUÍMICAS
    FIGURA 152. PROCESO DE INVESTIGACIÓN DE MRFR
    FIGURA 153. ANÁLISIS DRO DEL MERCADO DE CALDERAS QUÍMICAS DE TUBO DE FUEGO
    FIGURA 154. ANÁLISIS DE IMPACTO DE LOS IMPULSORES: MERCADO DE CALDERAS QUÍMICAS DE TUBO DE FUEGO
    FIGURA 155. ANÁLISIS DE IMPACTO DE LAS RESTRICCIONES : TUBO DE FUEGO QUÍMICO MERCADO DE CALDERAS
    FIGURA 156. CADENA DE SUMINISTRO / VALOR: MERCADO DE CALDERAS QUÍMICAS DE TUBO DE FUEGO
    FIGURA 157. MERCADO DE CALDERAS QUÍMICAS DE TUBO DE FUEGO, POR TIPO DE CALDERA, 2024 (% DE PARTICIPACIÓN)
    FIGURA 158. TUBO DE FUEGO MERCADO DE CALDERAS QUÍMICAS, POR TIPO DE CALDERA, 2019 A 2032 (Miles de millones de USD)
    FIGURA 159. MERCADO DE CALDERAS QUÍMICAS DE TUBO DE FUEGO, POR TIPO DE COMBUSTIBLE, 2024 (% DE PARTICIPACIÓN)
    FIGURA 160. MERCADO DE CALDERAS QUÍMICAS DE TUBO DE FUEGO, POR TIPO DE COMBUSTIBLE, 2019 A 2032 ( Miles de millones de dólares)
    FIGURA 161. MERCADO DE CALDERAS QUÍMICAS DE TUBO DE FUEGO, POR APLICACIÓN INDUSTRIA, 2024 (% DE PARTICIPACIÓN)
    FIGURA 162. MERCADO DE CALDERAS QUÍMICAS DE TUBO DE FUEGO, POR APLICACIÓN INDUSTRIA, 2019 A 2032 (Miles de millones de USD)
    FIGURA 163. TUBO DE FUEGO MERCADO DE CALDERAS QUÍMICAS, POR CONTROL SISTEMA, 2024 (% DE PARTICIPACIÓN)
    FIGURA 164. MERCADO DE CALDERAS QUÍMICAS DE TUBO DE FUEGO, POR SISTEMA DE CONTROL, 2019 A 2032 (Miles de millones de USD)
    FIGURA 165. MERCADO DE CALDERAS QUÍMICAS DE TUBO DE FUEGO, POR TIPO DE INSTALACIÓN, 2024 ( % PARTICIPACIÓN)
    FIGURA 166. FUEGO MERCADO DE CALDERAS QUÍMICAS DE TUBO, POR TIPO DE INSTALACIÓN, 2019 A 2032 (Miles de millones de USD)
    FIGURA 167. MERCADO DE CALDERAS QUÍMICAS DE TUBO, POR REGIONAL, 2024 (% DE PARTICIPACIÓN)
    FIGURA 168. MERCADO DE CALDERAS QUÍMICAS DE TUBO, POR REGIONALES, 2019 A 2032 (Miles de millones de dólares)
    GRÁFICO 169. EVALUACIÓN COMPARABLE DE LOS PRINCIPALES COMPETIDORES

    Mercado de calderas químicas de tubos de fuegoSegmentación del mercado


    • Mercado de calderas químicas pirotubulares por tipo de caldera (miles de millones de dólares, 2019-2032)

      • Calderas pirotubulares de baja presión

      • Calderas pirotubulares de alta presión

      • Calderas pirotubulares modulares


    • Mercado de calderas químicas pirotubulares por tipo de combustible (miles de millones de dólares, 2019-2032)

      • Gas Natural

      • Aceite

      • Biomasa

      • Carbón

      • Electricidad


    • Mercado de calderas químicas de tubos pirotubulares por aplicación industrial (miles de millones de dólares, 2019-2032)

      • Fabricación de productos químicos

      • Procesamiento de alimentos

      • Industria Textil

      • Papel y Pulpa

      • Productos farmacéuticos


    • Mercado de calderas químicas pirotubulares por sistema de control (miles de millones de dólares, 2019-2032)

      • Control manual

      • Control semiautomático

      • Control totalmente automático


    • Mercado de calderas químicas pirotubulares por tipo de instalación (miles de millones de dólares, 2019-2032)

      • Instalación en interiores

      • Instalación en exteriores


    • Mercado de calderas químicas pirotubulares por región (miles de millones de dólares, 2019-2032)

      • América del Norte

      • Europa

      • América del Sur

      • Asia Pacífico

      • Medio Oriente y África


    Perspectivas regionales del mercado de calderas químicas de tubos pirotubulares (miles de millones de dólares, 2019-2032)< /span>


    • Perspectivas de América del Norte (miles de millones de dólares, 2019-2032)

      • Mercado de calderas químicas pirotubulares de América del Norte por tipo de caldera

        • Calderas Pirotubulares de Baja Presión

        • Calderas pirotubulares de alta presión

        • Calderas pirotubulares modulares

      • Mercado de calderas químicas pirotubulares de América del Norte por tipo de combustible

        • Gas natural

        • Aceite

        • Biomasa

        • Carbón

        • Electricidad

      • Mercado de calderas químicas pirotubulares de América del Norte por tipo de aplicación industrial

        • Fabricación de productos químicos

        • Procesamiento de alimentos

        • Industria Textil

        • Papel y Pulpa

        • Productos farmacéuticos

      • Mercado de calderas químicas pirotubulares de América del Norte por tipo de sistema de control

        • Control manual

        • Control semiautomático

        • Control totalmente automático

      • Mercado de calderas químicas pirotubulares de América del Norte por tipo de instalación

        • Instalación interior

        • Instalación en exteriores

      • Mercado de calderas químicas pirotubulares de América del Norte por tipo regional

        • EE.UU.

        • Canadá

      • Perspectivas de EE. UU. (miles de millones de dólares, 2019-2032)

      • Mercado de calderas químicas pirotubulares de EE. UU. por tipo de caldera

        • Calderas Pirotubulares de Baja Presión

        • Calderas pirotubulares de alta presión

        • Calderas pirotubulares modulares

      • Mercado de calderas químicas pirotubulares de EE. UU. por tipo de combustible

        • Gas natural

        • Aceite

        • Biomasa

        • Carbón

        • Electricidad

      • Mercado de calderas químicas pirotubulares de EE. UU. por tipo de aplicación industrial

        • Fabricación de productos químicos

        • Procesamiento de alimentos

        • Industria Textil

        • Papel y Pulpa

        • Productos farmacéuticos

      • Mercado de calderas químicas pirotubulares de EE. UU. por tipo de sistema de control

        • Control manual

        • Control semiautomático

        • Control totalmente automático

      • Mercado de calderas químicas pirotubulares de EE. UU. por tipo de instalación

        • Instalación interior

        • Instalación en exteriores

      • Perspectivas de CANADÁ (miles de millones de dólares, 2019-2032)

      • Mercado de calderas químicas pirotubulares de CANADÁ por tipo de caldera

        • Calderas Pirotubulares de Baja Presión

        • Calderas pirotubulares de alta presión

        • Calderas pirotubulares modulares

      • Mercado de calderas químicas pirotubulares de CANADÁ por tipo de combustible

        • Gas natural

        • Aceite

        • Biomasa

        • Carbón

        • Electricidad

      • Mercado de calderas químicas pirotubulares de CANADÁ por tipo de aplicación industrial

        • Fabricación de productos químicos

        • Procesamiento de alimentos

        • Industria Textil

        • Papel y Pulpa

        • Productos farmacéuticos

      • Mercado de calderas químicas pirotubulares de CANADÁ por tipo de sistema de control

        • Control manual

        • Control semiautomático

        • Control totalmente automático

      • Mercado de calderas químicas pirotubulares de CANADÁ por tipo de instalación

        • Instalación interior

        • Instalación en exteriores

    • Perspectivas de Europa (miles de millones de dólares, 2019-2032)

      • Mercado europeo de calderas químicas pirotubulares por tipo de caldera

        • Calderas Pirotubulares de Baja Presión

        • Calderas pirotubulares de alta presión

        • Calderas pirotubulares modulares

      • Mercado europeo de calderas químicas pirotubulares por tipo de combustible

        • Gas natural

        • Aceite

        • Biomasa

        • Carbón

        • Electricidad

      • Mercado europeo de calderas químicas pirotubulares por tipo de aplicación industrial

        • Fabricación de productos químicos

        • Procesamiento de alimentos

        • Industria Textil

        • Papel y Pulpa

        • Productos farmacéuticos

      • Mercado europeo de calderas químicas pirotubulares por tipo de sistema de control

        • Control manual

        • Control semiautomático

        • Control totalmente automático

      • Mercado europeo de calderas químicas pirotubulares por tipo de instalación

        • Instalación interior

        • Instalación en exteriores

      • Mercado europeo de calderas químicas pirotubulares por tipo regional

        • Alemania

        • Reino Unido

        • Francia

        • Rusia

        • Italia

        • España

        • Resto de Europa

      • Perspectivas de ALEMANIA (miles de millones de dólares, 2019-2032)

      • Mercado de calderas químicas pirotubulares en ALEMANIA por tipo de caldera

        • Calderas Pirotubulares de Baja Presión

        • Calderas pirotubulares de alta presión

        • Calderas pirotubulares modulares

      • Mercado de calderas químicas pirotubulares en ALEMANIA por tipo de combustible

        • Gas natural

        • Aceite

        • Biomasa

        • Carbón

        • Electricidad

      • Mercado de calderas químicas pirotubulares en ALEMANIA por tipo de aplicación industrial

        • Fabricación de productos químicos

        • Procesamiento de alimentos

        • Industria Textil

        • Papel y Pulpa

        • Productos farmacéuticos

      • Mercado de calderas químicas pirotubulares en ALEMANIA por tipo de sistema de control

        • Control manual

        • Control semiautomático

        • Control totalmente automático

      • Mercado de calderas químicas pirotubulares en ALEMANIA por tipo de instalación

        • Instalación interior

        • Instalación en exteriores

      • Perspectivas del Reino Unido (miles de millones de dólares, 2019-2032)

      • Mercado de calderas químicas pirotubulares del Reino Unido por tipo de caldera

        • Calderas Pirotubulares de Baja Presión

        • Calderas pirotubulares de alta presión

        • Calderas pirotubulares modulares

      • Mercado de calderas químicas pirotubulares del Reino Unido por tipo de combustible

        • Gas natural

        • Aceite

        • Biomasa

        • Carbón

        • Electricidad

      • Mercado de calderas químicas pirotubulares del Reino Unido por tipo de aplicación industrial

        • Fabricación de productos químicos

        • Procesamiento de alimentos

        • Industria Textil

        • Papel y Pulpa

        • Productos farmacéuticos

      • Mercado de calderas químicas pirotubulares del Reino Unido por tipo de sistema de control

        • Control manual

        • Control semiautomático

        • Control totalmente automático

      • Mercado de calderas químicas pirotubulares del Reino Unido por tipo de instalación

        • Instalación interior

        • Instalación en exteriores

      • Perspectivas de FRANCIA (miles de millones de dólares, 2019-2032)

      • Mercado de calderas químicas pirotubulares en FRANCIA por tipo de caldera

        • Calderas Pirotubulares de Baja Presión

        • Calderas pirotubulares de alta presión

        • Calderas pirotubulares modulares

      • Mercado de calderas químicas pirotubulares en FRANCIA por tipo de combustible

        • Gas natural

        • Aceite

        • Biomasa

        • Carbón

        • Electricidad

      • Mercado de calderas químicas pirotubulares en FRANCIA por tipo de aplicación industrial

        • Fabricación de productos químicos

        • Procesamiento de alimentos

        • Industria Textil

        • Papel y Pulpa

        • Productos farmacéuticos

      • Mercado de calderas químicas pirotubulares en FRANCIA por tipo de sistema de control

        • Control manual

        • Control semiautomático

        • Control totalmente automático

      • Mercado de calderas químicas pirotubulares en FRANCIA por tipo de instalación

        • Instalación interior

        • Instalación en exteriores

      • Perspectivas de RUSIA (miles de millones de dólares, 2019-2032)

      • Mercado de calderas químicas pirotubulares de RUSIA por tipo de caldera

        • Calderas Pirotubulares de Baja Presión

        • Calderas pirotubulares de alta presión

        • Calderas pirotubulares modulares

      • Abeto de RusiaMercado de calderas químicas de tubos electrónicos por tipo de combustible

        • Gas natural

        • Aceite

        • Biomasa

        • Carbón

        • Electricidad

      • Mercado de calderas químicas pirotubulares de Rusia por tipo de aplicación industrial

        • Fabricación de productos químicos

        • Procesamiento de alimentos

        • Industria Textil

        • Papel y Pulpa

        • Productos farmacéuticos

      • Mercado de calderas químicas pirotubulares de RUSIA por tipo de sistema de control

        • Control manual

        • Control semiautomático

        • Control totalmente automático

      • Mercado de calderas químicas pirotubulares de RUSIA por tipo de instalación

        • Instalación interior

        • Instalación en exteriores

      • Perspectivas de ITALIA (miles de millones de dólares, 2019-2032)

      • Mercado de calderas químicas pirotubulares de ITALIA por tipo de caldera

        • Calderas Pirotubulares de Baja Presión

        • Calderas pirotubulares de alta presión

        • Calderas pirotubulares modulares

      • Mercado de calderas químicas pirotubulares de ITALIA por tipo de combustible

        • Gas natural

        • Aceite

        • Biomasa

        • Carbón

        • Electricidad

      • Mercado de calderas químicas pirotubulares de ITALIA por tipo de aplicación industrial

        • Fabricación de productos químicos

        • Procesamiento de alimentos

        • Industria Textil

        • Papel y Pulpa

        • Productos farmacéuticos

      • Mercado de calderas químicas pirotubulares de ITALIA por tipo de sistema de control

        • Control manual

        • Control semiautomático

        • Control totalmente automático

      • Mercado de calderas químicas pirotubulares de ITALIA por tipo de instalación

        • Instalación interior

        • Instalación en exteriores

      • Perspectivas de ESPAÑA (Miles de millones de dólares, 2019-2032)

      • Mercado de calderas químicas pirotubulares en ESPAÑA por tipo de caldera

        • Calderas Pirotubulares de Baja Presión

        • Calderas pirotubulares de alta presión

        • Calderas pirotubulares modulares

      • Mercado de calderas químicas pirotubulares en ESPAÑA por tipo de combustible

        • Gas natural

        • Aceite

        • Biomasa

        • Carbón

        • Electricidad

      • Mercado de calderas químicas pirotubulares en ESPAÑA por tipo de aplicación industrial

        • Fabricación de productos químicos

        • Procesamiento de alimentos

        • Industria Textil

        • Papel y Pulpa

        • Productos farmacéuticos

      • Mercado de calderas químicas pirotubulares en ESPAÑA por tipo de sistema de control

        • Control manual

        • Control semiautomático

        • Control totalmente automático

      • Mercado de calderas químicas pirotubulares en ESPAÑA por tipo de instalación

        • Instalación interior

        • Instalación en exteriores

      • Perspectivas DEL RESTO DE EUROPA (Miles de millones de dólares, 2019-2032)

      • Mercado de calderas químicas pirotubulares del RESTO DE EUROPA por tipo de caldera

        • Calderas Pirotubulares de Baja Presión

        • Calderas pirotubulares de alta presión

        • Calderas pirotubulares modulares

      • Mercado de calderas químicas pirotubulares del RESTO DE EUROPA por tipo de combustible

        • Gas natural

        • Aceite

        • Biomasa

        • Carbón

        • Electricidad

      • Mercado de calderas químicas pirotubulares del RESTO DE EUROPA por tipo de aplicación industrial

        • Fabricación de productos químicos

        • Procesamiento de alimentos

        • Industria Textil

        • Papel y Pulpa

        • Productos farmacéuticos

      • Mercado de calderas químicas pirotubulares del RESTO DE EUROPA por tipo de sistema de control

        • Control manual

        • Control semiautomático

        • Control totalmente automático

      • Mercado de calderas químicas pirotubulares del RESTO DE EUROPA por tipo de instalación

        • Instalación interior

        • Instalación en exteriores

    • Perspectivas de Asia Pacífico (miles de millones de dólares, 2019-2032)

      • Mercado de calderas químicas pirotubulares de APAC por tipo de caldera

        • Calderas Pirotubulares de Baja Presión

        • Calderas pirotubulares de alta presión

        • Calderas pirotubulares modulares

      • Mercado de calderas químicas pirotubulares de APAC por tipo de combustible

        • Gas natural

        • Aceite

        • Biomasa

        • Carbón

        • Electricidad

      • Mercado de calderas químicas pirotubulares de APAC por tipo de aplicación industrial

        • Fabricación de productos químicos

        • Procesamiento de alimentos

        • Industria Textil

        • Papel y Pulpa

        • Productos farmacéuticos

      • Mercado de calderas químicas pirotubulares de APAC por tipo de sistema de control

        • Control manual

        • Control semiautomático

        • Control totalmente automático

      • Mercado de calderas químicas pirotubulares de APAC por tipo de instalación

        • Instalación interior

        • Instalación en exteriores

      • Mercado de calderas químicas pirotubulares de APAC por tipo regional

        • China

        • India

        • Japón

        • Corea del Sur

        • Malasia

        • Tailandia

        • Indonesia

        • Resto de APAC

      • Perspectivas de CHINA (miles de millones de dólares, 2019-2032)

      • Mercado de calderas químicas pirotubulares de CHINA por tipo de caldera

        • Calderas Pirotubulares de Baja Presión

        • Calderas pirotubulares de alta presión

        • Calderas pirotubulares modulares

      • Mercado de calderas químicas pirotubulares de CHINA por tipo de combustible

        • Gas natural

        • Aceite

        • Biomasa

        • Carbón

        • Electricidad

      • Mercado de calderas químicas pirotubulares de CHINA por tipo de aplicación industrial

        • Fabricación de productos químicos

        • Procesamiento de alimentos

        • Industria Textil

        • Papel y Pulpa

        • Productos farmacéuticos

      • Mercado de calderas químicas pirotubulares de CHINA por tipo de sistema de control

        • Control manual

        • Control semiautomático

        • Control totalmente automático

      • Mercado de calderas químicas pirotubulares de CHINA por tipo de instalación

        • Instalación interior

        • Instalación en exteriores

      • Perspectivas de la INDIA (miles de millones de dólares, 2019-2032)

      • Mercado de calderas químicas pirotubulares de INDIA por tipo de caldera

        • Calderas Pirotubulares de Baja Presión

        • Calderas pirotubulares de alta presión

        • Calderas pirotubulares modulares

      • Mercado de calderas químicas pirotubulares de INDIA por tipo de combustible

        • Gas natural

        • Aceite

        • Biomasa

        • Carbón

        • Electricidad

      • Mercado de calderas químicas pirotubulares de INDIA por tipo de aplicación industrial

        • Fabricación de productos químicos

        • Procesamiento de alimentos

        • Industria Textil

        • Papel y Pulpa

        • Productos farmacéuticos

      • Mercado de calderas químicas pirotubulares de INDIA por tipo de sistema de control

        • Control manual

        • Control semiautomático

        • Control totalmente automático

      • Mercado de calderas químicas pirotubulares de INDIA por tipo de instalación

        • Instalación interior

        • Instalación en exteriores

      • Perspectivas de JAPÓN (miles de millones de dólares, 2019-2032)

      • Mercado japonés de calderas químicas pirotubulares por tipo de caldera

        • Calderas Pirotubulares de Baja Presión

        • Calderas pirotubulares de alta presión

        • Calderas pirotubulares modulares

      • Mercado japonés de calderas químicas pirotubulares por tipo de combustible

        • Gas natural

        • Aceite

        • Biomasa

        • Carbón

        • Electricidad

      • Mercado japonés de calderas químicas pirotubulares por tipo de aplicación industrial

        • Fabricación de productos químicos

        • Procesamiento de alimentos

        • Industria Textil

        • Papel y Pulpa

        • Productos farmacéuticos

      • Mercado japonés de calderas químicas pirotubulares por tipo de sistema de control

        • Control manual

        • Control semiautomático

        • Control totalmente automático

      • Mercado japonés de calderas químicas pirotubulares por tipo de instalación

        • Instalación interior

        • Instalación en exteriores

      • Perspectivas de COREA DEL SUR (miles de millones de dólares, 2019-2032)

      • Mercado de calderas químicas pirotubulares de COREA DEL SUR por tipo de caldera

        • Calderas Pirotubulares de Baja Presión

        • Calderas pirotubulares de alta presión

        • Calderas pirotubulares modulares

      • Mercado de calderas químicas pirotubulares de COREA DEL SUR por tipo de combustible

        • Gas natural

        • Aceite

        • Biomasa

        • Carbón

        • Electricidad

      • Mercado de calderas químicas pirotubulares de COREA DEL SUR por tipo de aplicación industrial

        • Fabricación de productos químicos

        • Procesamiento de alimentos

        • Industria Textil

        • Papel y Pulpa

        • Productos farmacéuticos

      • Mercado de calderas químicas pirotubulares de COREA DEL SUR por tipo de sistema de control

        • Control manual

        • Control semiautomático

        • Control totalmente automático

      • Mercado de calderas químicas pirotubulares de COREA DEL SUR por tipo de instalación

        • Instalación interior

        • Instalación en exteriores

      • Perspectivas de MALASIA (miles de millones de dólares, 2019-2032)

      • Mercado de calderas químicas pirotubulares de MALASIA por tipo de caldera

        • Calderas Pirotubulares de Baja Presión

        • Calderas pirotubulares de alta presión

        • Calderas pirotubulares modulares

      • Mercado de calderas químicas pirotubulares de MALASIA por tipo de combustible

        • Gas natural

        • Aceite

        • Biomasa

        • Carbón

        • Electricidad

      • Mercado de calderas químicas pirotubulares de MALASIA por tipo de aplicación industrial

        • Fabricación de productos químicos

        • Procesamiento de alimentos

        • Industria Textil

        • Papel y Pulpa

        • Productos farmacéuticos

      • MALASIA Productos químicos para tubos de fuegoMercado de calderas por tipo de sistema de control

        • Control manual

        • Control semiautomático

        • Control totalmente automático

      • Mercado de calderas químicas pirotubulares de MALASIA por tipo de instalación

        • Instalación interior

        • Instalación en exteriores

      • Perspectivas de TAILANDIA (miles de millones de dólares, 2019-2032)

      • Mercado de calderas químicas pirotubulares de TAILANDIA por tipo de caldera

        • Calderas pirotubulares de baja presión

        • Calderas pirotubulares de alta presión

        • Calderas pirotubulares modulares

      • Mercado de calderas químicas pirotubulares de TAILANDIA por tipo de combustible

        • Gas natural

        • Aceite

        • Biomasa

        • Carbón

        • Electricidad

      • Mercado de calderas químicas pirotubulares de TAILANDIA por tipo de aplicación industrial

        • Fabricación de productos químicos

        • Procesamiento de alimentos

        • Industria Textil

        • Papel y Pulpa

        • Productos farmacéuticos

      • Mercado de calderas químicas pirotubulares de TAILANDIA por tipo de sistema de control

        • Control manual

        • Control semiautomático

        • Control totalmente automático

      • Mercado de calderas químicas pirotubulares de TAILANDIA por tipo de instalación

        • Instalación interior

        • Instalación en exteriores

      • Perspectivas de INDONESIA (miles de millones de dólares, 2019-2032)

      • Mercado de calderas químicas pirotubulares de INDONESIA por tipo de caldera

        • Calderas Pirotubulares de Baja Presión

        • Calderas pirotubulares de alta presión

        • Calderas pirotubulares modulares

      • Mercado de calderas químicas pirotubulares de INDONESIA por tipo de combustible

        • Gas natural

        • Aceite

        • Biomasa

        • Carbón

        • Electricidad

      • Mercado de calderas químicas de tubos pirotubulares de INDONESIA por tipo de aplicación industrial

        • Fabricación de productos químicos

        • Procesamiento de alimentos

        • Industria Textil

        • Papel y Pulpa

        • Productos farmacéuticos

      • Mercado de calderas químicas pirotubulares de INDONESIA por tipo de sistema de control

        • Control manual

        • Control semiautomático

        • Control totalmente automático

      • Mercado de calderas químicas pirotubulares de INDONESIA por tipo de instalación

        • Instalación interior

        • Instalación en exteriores

      • Perspectivas del RESTO DE APAC (miles de millones de dólares, 2019-2032)

      • RESTO DEL Mercado de calderas químicas pirotubulares de APAC por tipo de caldera

        • Calderas Pirotubulares de Baja Presión

        • Calderas pirotubulares de alta presión

        • Calderas pirotubulares modulares

      • RESTO DEL Mercado de calderas químicas pirotubulares de APAC por tipo de combustible

        • Gas natural

        • Aceite

        • Biomasa

        • Carbón

        • Electricidad

      • RESTO DEL Mercado de calderas químicas pirotubulares de APAC por tipo de aplicación industrial

        • Fabricación de productos químicos

        • Procesamiento de alimentos

        • Industria Textil

        • Papel y Pulpa

        • Productos farmacéuticos

      • RESTO DEL Mercado de calderas químicas pirotubulares de APAC por tipo de sistema de control

        • Control manual

        • Control semiautomático

        • Control totalmente automático

      • RESTO DEL Mercado de calderas químicas pirotubulares de APAC por tipo de instalación

        • Instalación interior

        • Instalación en exteriores

    • Perspectivas de América del Sur (miles de millones de dólares, 2019-2032)

      • Mercado de calderas químicas pirotubulares en América del Sur por tipo de caldera

        • Calderas Pirotubulares de Baja Presión

        • Calderas pirotubulares de alta presión

        • Calderas pirotubulares modulares

      • Mercado de calderas químicas pirotubulares de América del Sur por tipo de combustible

        • Gas natural

        • Aceite

        • Biomasa

        • Carbón

        • Electricidad

      • Mercado de calderas químicas de tubos pirotubulares en América del Sur por tipo de aplicación industrial

        • Fabricación de productos químicos

        • Procesamiento de alimentos

        • Industria Textil

        • Papel y Pulpa

        • Productos farmacéuticos

      • Mercado de calderas químicas pirotubulares de América del Sur por tipo de sistema de control

        • Control manual

        • Control semiautomático

        • Control totalmente automático

      • Mercado de calderas químicas pirotubulares de América del Sur por tipo de instalación

        • Instalación interior

        • Instalación en exteriores

      • Mercado de calderas químicas pirotubulares de América del Sur por tipo regional

        • Brasil

        • México

        • Argentina

        • Resto de Sudamérica

      • Perspectivas de BRASIL (miles de millones de dólares, 2019-2032)

      • Mercado de calderas químicas pirotubulares de BRASIL por tipo de caldera

        • Calderas pirotubulares de baja presión

        • Calderas pirotubulares de alta presión

        • Calderas pirotubulares modulares

      • Mercado de calderas químicas pirotubulares de BRASIL por tipo de combustible

        • Gas natural

        • Aceite

        • Biomasa

        • Carbón

        • Electricidad

      • Mercado de calderas químicas pirotubulares de BRASIL por tipo de aplicación industrial

        • Fabricación de productos químicos

        • Procesamiento de alimentos

        • Industria Textil

        • Papel y Pulpa

        • Productos farmacéuticos

      • Mercado de calderas químicas pirotubulares de BRASIL por tipo de sistema de control

        • Control manual

        • Control semiautomático

        • Control totalmente automático

      • Mercado de calderas químicas pirotubulares de BRASIL por tipo de instalación

        • Instalación interior

        • Instalación en exteriores

      • Perspectivas de MÉXICO (Miles de millones de dólares, 2019-2032)

      • Mercado de calderas químicas pirotubulares en MÉXICO por tipo de caldera

        • Calderas Pirotubulares de Baja Presión

        • Calderas pirotubulares de alta presión

        • Calderas pirotubulares modulares

      • Mercado de calderas químicas pirotubulares en MÉXICO por tipo de combustible

        • Gas natural

        • Aceite

        • Biomasa

        • Carbón

        • Electricidad

      • Mercado de calderas químicas pirotubulares en MÉXICO por tipo de aplicación industrial

        • Fabricación de productos químicos

        • Procesamiento de alimentos

        • Industria Textil

        • Papel y Pulpa

        • Productos farmacéuticos

      • MÉXICO Mercado de calderas químicas pirotubulares por tipo de sistema de control

        • Control manual

        • Control semiautomático

        • Control totalmente automático

      • Mercado de calderas químicas pirotubulares en MÉXICO por tipo de instalación

        • Instalación interior

        • Instalación en exteriores

      • Perspectivas de ARGENTINA (Miles de millones de dólares, 2019-2032)

      • Mercado ARGENTINA de calderas químicas pirotubulares por tipo de caldera

        • Calderas Pirotubulares de Baja Presión

        • Calderas pirotubulares de alta presión

        • Calderas pirotubulares modulares

      • Mercado ARGENTINA de calderas químicas pirotubulares por tipo de combustible

        • Gas natural

        • Aceite

        • Biomasa

        • Carbón

        • Electricidad

      • Mercado ARGENTINA de calderas químicas pirotubulares por tipo de aplicación industrial

        • Fabricación de productos químicos

        • Procesamiento de alimentos

        • Industria Textil

        • Papel y Pulpa

        • Productos farmacéuticos

      • Mercado ARGENTINA de calderas químicas pirotubulares por tipo de sistema de control

        • Control manual

        • Control semiautomático

        • Control totalmente automático

      • Mercado ARGENTINA de calderas químicas pirotubulares por tipo de instalación

        • Instalación interior

        • Instalación en exteriores

      • Perspectivas RESTO DE AMÉRICA DEL SUR (Miles de millones de dólares, 2019-2032)

      • RESTO DE AMÉRICA DEL SUR Mercado de calderas químicas pirotubulares por tipo de caldera

        • Calderas pirotubulares de baja presión

        • Calderas pirotubulares de alta presión

        • Calderas pirotubulares modulares

      • RESTO DE AMÉRICA DEL SUR Mercado de calderas químicas pirotubulares por tipo de combustible

        • Gas natural

        • Aceite

        • Biomasa

        • Carbón

        • Electricidad

      • RESTO DE AMÉRICA DEL SUR Mercado de calderas químicas pirotubulares por tipo de aplicación industrial

        • Fabricación de productos químicos

        • Procesamiento de alimentos

        • Industria Textil

        • Papel y Pulpa

        • Productos farmacéuticos

      • RESTO DE AMÉRICA DEL SUR Mercado de calderas químicas pirotubulares por tipo de sistema de control

        • Control manual

        • Control semiautomático

        • Control totalmente automático

      • RESTO DE AMÉRICA DEL SUR Mercado de calderas químicas pirotubulares por tipo de instalación

        • Instalación interior

        • Instalación en exteriores

    • Perspectivas MEA (miles de millones de dólares, 2019-2032)

      • Mercado de calderas químicas pirotubulares MEA por tipo de caldera

        • Calderas Pirotubulares de Baja Presión

        • Calderas pirotubulares de alta presión

        • Calderas pirotubulares modulares

      • Mercado de calderas químicas pirotubulares MEA por tipo de combustible

        • Gas natural

        • Aceite

        • Biomasa

        • Carbón

        • Electricidad

      • Mercado de calderas químicas de tubo pirotubular MEA por tipo de aplicación industrial

        • Fabricación de productos químicos

        • Procesamiento de alimentos

        • Industria Textil

        • Papel y Pulpa

        • Productos farmacéuticos

      • Mercado de calderas químicas de tubo pirotubular MEA por tipo de sistema de control

        • Control manual

        • Control semiautomático

        • Control totalmente automático

      • Mercado de calderas químicas pirotubulares MEA por tipo de instalación

        • Instalación interior

        • Instalación en exteriores

      • Mercado de calderas químicas pirotubulares MEA por tipo regional

        • Países del CCG

        • Sudáfrica

        • Resto de MEA

      • Perspectivas de los PAÍSES del CCG (miles de millones de dólares, 2019-2032)

      • Países del CCG Mercado de calderas químicas pirotubulares por tipo de caldera

        • Calderas Pirotubulares de Baja Presión

        • Calderas pirotubulares de alta presión

        • Calderas pirotubulares modulares

      • Mercado de calderas químicas pirotubulares de los países del CCG por tipo de combustible

        • Gas natural

        • Aceite

        • Biomasa

        • Carbón

        • Electricidad

      • Países del CCG Mercado de calderas químicas pirotubulares por tipo de aplicación industrial

        • Fabricación de productos químicos

        • Procesamiento de alimentos

        • Industria Textil

        • Papel y Pulpa

        • Productos farmacéuticos

      • Mercado de calderas químicas pirotubulares de los países del CCG por tipo de sistema de control

        • Control manual

        • Control semiautomático

        • Control totalmente automático

      • Mercado de calderas químicas pirotubulares de los países del CCG por tipo de instalación

        • Instalación interior

        • Instalación en exteriores

      • Perspectivas de SUDÁFRICA (miles de millones de dólares, 2019-2032)

      • Mercado de calderas químicas pirotubulares de SUDÁFRICA por tipo de caldera

        • Calderas Pirotubulares de Baja Presión

        • Calderas pirotubulares de alta presión

        • Calderas pirotubulares modulares

      • Mercado de calderas químicas pirotubulares de SUDÁFRICA por tipo de combustible

        • Gas natural

        • Aceite

        • Biomasa

        • Carbón

        • Electricidad

      • Mercado de calderas químicas pirotubulares de SUDÁFRICA por tipo de aplicación industrial

        • Fabricación de productos químicos

        • Procesamiento de alimentos

        • Industria Textil

        • Papel y Pulpa

        • Productos farmacéuticos

      • Mercado de calderas químicas pirotubulares de SUDÁFRICA por tipo de sistema de control

        • Control manual

        • Control semiautomático

        • Control totalmente automático

      • Mercado de calderas químicas pirotubulares de SUDÁFRICA por tipo de instalación

        • Instalación interior

        • Instalación en exteriores

      • Perspectivas del RESTO DE MEA (miles de millones de dólares, 2019-2032)

      • Mercado de calderas químicas pirotubulares del RESTO DE MEA por tipo de caldera

        • Calderas Pirotubulares de Baja Presión

        • Calderas pirotubulares de alta presión

        • Calderas pirotubulares modulares

      • RESTO DEL MEA Mercado de calderas químicas pirotubulares por tipo de combustible

        • Gas natural

        • Aceite

        • Biomasa

        • Carbón

        • Electricidad

      • RESTO DEL MEA Mercado de calderas químicas pirotubulares por tipo de aplicación industrial

        • Fabricación de productos químicos

        • Procesamiento de alimentos

        • Industria Textil

        • Papel y Pulpa

        • Productos farmacéuticos

      • RESTO DEL MEA Mercado de calderas químicas pirotubulares por tipo de sistema de control

        • Control manual

        • Control semiautomático

        • Control totalmente automático

      • RESTO DEL MEA Mercado de calderas químicas pirotubulares por tipo de instalación

        • Instalación interior

        • Instalación en exteriores


    Report Infographic
    Free Sample Request

    Kindly complete the form below to receive a free sample of this Report

    Customer Strories

    “I am very pleased with how market segments have been defined in a relevant way for my purposes (such as "Portable Freezers & refrigerators" and "last-mile"). In general the report is well structured. Thanks very much for your efforts.”

    Victoria Milne Founder
    Case Study

    Chemicals and Materials