• Cat-intel
  • MedIntelliX
  • Resources
  • About Us
  • Hero Background
    English
    Chinese
    French
    Japanese
    Korean
    German
    Spanish

    Mobility Technology Market Trends

    ID: MRFR/AM/14683-HCR
    128 Pages
    Swapnil Palwe
    October 2025

    Mobility Technology Market Research Report Information By Type (Bluetooth, Wearable Technology, Mobile Augmented Reality, and Wireless Gigabit), By Application (Electronic Products, Car, Medical Equipment, and Other), By Region (North America, Europe, Asia-Pacific, And Rest Of The World) –Market Forecast Till 2035

    Share:
    Download PDF ×

    We do not share your information with anyone. However, we may send you emails based on your report interest from time to time. You may contact us at any time to opt-out.

    Mobility Technology Market Infographic
    $ 4,950.0
    $ 5,950.0
    $ 7,250.0

    Market Trends

    Key Emerging Trends in the Mobility Technology Market

    In the dynamic landscape of the Mobility Technology Market, companies deploy various market share positioning strategies to establish a competitive edge and capitalize on emerging trends. One prevalent approach involves differentiation, wherein companies seek to distinguish their products or services from competitors. This can be achieved through technological advancements, unique features, or superior user experiences. For instance, companies might focus on developing cutting-edge electric vehicles, incorporating advanced safety features, or enhancing connectivity options to appeal to a broader consumer base.

    Another key strategy revolves around cost leadership, where companies strive to become the low-cost providers in the market. Achieving economies of scale through efficient production processes, resource optimization, and strategic partnerships enables companies to offer competitive prices. Cost leadership is particularly vital in the Mobility Technology Market as it can influence consumer decisions in a price-sensitive environment. Companies embracing this strategy often prioritize operational efficiency and cost-effective innovations to maintain a competitive pricing advantage.

    Market segmentation is a strategic tool that allows companies to target specific customer segments with tailored products or services. In the Mobility Technology Market, segmentation can be based on factors such as demographic profiles, geographical locations, or specific mobility needs. By understanding the unique preferences and requirements of different consumer groups, companies can design targeted marketing campaigns and develop products that resonate with the specific needs of each segment. This approach enables companies to capture a significant market share within niche markets, fostering brand loyalty and customer satisfaction.

    Strategic alliances and partnerships play a pivotal role in shaping market share within the Mobility Technology Market. Collaborations between companies can lead to shared resources, joint research and development efforts, and expanded market reach. For example, a technology company might partner with an automotive manufacturer to integrate their software into the vehicles, creating a mutually beneficial relationship that enhances the overall value proposition. Strategic alliances enable companies to leverage complementary strengths, access new markets, and jointly invest in innovation, ultimately influencing market share dynamics.

    Innovation is a cornerstone of success in the Mobility Technology Market, and companies often adopt a first-mover strategy to gain a competitive advantage. Being the first to introduce groundbreaking technologies or disruptive solutions positions a company as an industry leader, attracting early adopters and establishing brand recognition. This strategy requires a commitment to continuous research and development, staying ahead of technological trends, and having the agility to adapt to evolving market demands. Companies that successfully implement a first-mover strategy can not only capture significant market share but also shape the trajectory of the industry.

    In conclusion, the Mobility Technology Market is highly competitive, and companies employ diverse strategies to position themselves favorably and secure a substantial market share. Whether through differentiation, cost leadership, market segmentation, strategic alliances, or a focus on innovation, each approach reflects a nuanced understanding of market dynamics and consumer preferences. Successful companies often integrate a combination of these strategies, adapting to the ever-changing landscape of mobility technology to meet the demands of an evolving market.

    Market Summary

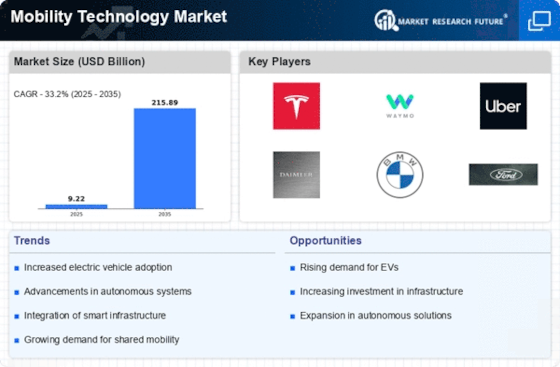
    The Global Mobility Technology Market is projected to experience substantial growth from 9.22 USD Billion in 2024 to 215.89 USD Billion by 2035.

    Key Market Trends & Highlights

    Mobility Technology Key Trends and Highlights

    • The market is expected to grow at a compound annual growth rate (CAGR) of 30.22% from 2025 to 2035. By 2035, the market valuation is anticipated to reach 162.3 USD Billion, indicating a robust expansion. in 2024, the market is valued at 9.22 USD Billion, highlighting its current scale and potential for growth. Growing adoption of mobility technology due to increasing demand for efficient transportation solutions is a major market driver.

    Market Size & Forecast

    2024 Market Size 9.22 (USD Billion)
    2035 Market Size 215.89 (USD Billion)
    CAGR (2025-2035) 33.20%
    Largest Regional Market Share in 2024 latin_america)

    Major Players

    <p>Qualcomm, Sierra Wireless, Samsung Electronics, Apple, Nuance Communication, Stmicroelectronics, Motorola Solutions, Texas Instruments, Atmel, Autotalks, Intel, Harris, Daifuku, Dematic</p>

    Market Trends

    Advent of advanced technologies like Bluetooth and wearables is driving the market growth

    The mobility technology market has undergone major changes and developments due to the advent of novel technologies like Bluetooth and wearables. Wearable technology has become essential to daily life, from fitness trackers to smartwatches. In addition to keeping track of fitness and health, these gadgets easily interact with other smart devices to offer a comprehensive and linked user experience. However, Bluetooth has become a key component of wireless communication in the context of mobility. Its influence is felt in a number of areas, including hands-free communication, in-car networking, and smartphone and other gadget integration.

    With hands-free calling and music streaming, Bluetooth is essential to the car industry, providing safer and more comfortable driving experiences.

    The market for mobility technology is being driven by key factors: the increasing urbanization of the world and the growing demand for sustainable transportation choices. In order to solve issues like traffic congestion and pollution, there is an increasing demand for economical and ecologically friendly transportation options in metropolitan areas due to population expansion. Smart mobility solutions such as electric scooters, bike-sharing programs, and ride-sharing services have become more and more popular as a result of urbanization. Mobility technology enables these services to operate and coordinate seamlessly, providing individuals with convenient and environmentally beneficial alternatives to traditional modes of transportation.

    Moreover, growing environmental consciousness has led to a need for environmentally friendly transportation. Eco-friendly products are becoming more and more important as both governments and consumers work to decrease carbon footprints and combat climate change. The creation and uptake of electric cars (EVs) and other green transportation solutions are motivated by this shift towards sustainability. In addition, the market for mobility technology is expanding as a result of measures that support the construction of EV infrastructure, public transit systems, and traffic management technology integration. Thus, driving the mobility technology market revenue.

    <p>The ongoing advancements in mobility technology are reshaping urban landscapes, enhancing connectivity and efficiency while addressing sustainability challenges.</p>

    U.S. Department of Transportation

    Mobility Technology Market Market Drivers

    Market Growth Projections

    The Global Mobility Technology Market Industry is projected to experience substantial growth in the coming years. With a market value of 8.89 USD Billion anticipated in 2024, the industry is on a trajectory towards reaching 162.3 USD Billion by 2035. This growth is indicative of the increasing adoption of innovative mobility solutions, driven by factors such as urbanization, technological advancements, and government support. The projected compound annual growth rate (CAGR) of 30.22% from 2025 to 2035 further underscores the dynamic nature of the market, suggesting a robust future for mobility technologies.

    Urbanization and Population Growth

    Urbanization and population growth are key drivers of the Global Mobility Technology Market Industry. As more individuals migrate to urban areas, the demand for efficient and accessible transportation solutions escalates. Cities are increasingly adopting smart mobility initiatives to address congestion and enhance public transport systems. This trend is evident in the projected market value of 8.89 USD Billion in 2024, which reflects the urgent need for innovative mobility solutions. The Global Mobility Technology Market Industry is poised for significant expansion, with expectations of reaching 162.3 USD Billion by 2035, as urban centers continue to evolve and adapt to growing populations.

    Government Initiatives and Policies

    Government initiatives and policies significantly influence the Global Mobility Technology Market Industry. Many countries are implementing regulations and incentives to promote the adoption of advanced mobility solutions. For instance, subsidies for electric vehicles and investments in public transportation infrastructure are common strategies employed by governments to encourage sustainable practices. In 2024, the market is anticipated to reach 8.89 USD Billion, driven by these supportive policies. As governments continue to prioritize sustainable mobility, the Global Mobility Technology Market Industry is likely to see substantial growth, potentially reaching 162.3 USD Billion by 2035.

    Increased Investment in Mobility Startups

    The Global Mobility Technology Market Industry is witnessing a surge in investment directed towards mobility startups. Venture capitalists and private equity firms are increasingly recognizing the potential of innovative mobility solutions, leading to a vibrant ecosystem of startups focused on electric vehicles, ride-sharing, and autonomous driving technologies. This influx of capital not only accelerates technological advancements but also fosters competition within the market. As a result, the industry is expected to experience a compound annual growth rate (CAGR) of 30.22% from 2025 to 2035, reflecting the growing interest in transformative mobility solutions.

    Rising Demand for Sustainable Transportation

    The Global Mobility Technology Market Industry experiences a notable surge in demand for sustainable transportation solutions. As urban populations grow, cities face increasing pressure to reduce carbon emissions and improve air quality. Electric vehicles (EVs) and shared mobility services are becoming increasingly popular, with governments worldwide implementing incentives to promote their adoption. For instance, in 2024, the market is projected to reach 8.89 USD Billion, reflecting a growing consumer preference for eco-friendly transportation options. This trend is likely to continue, as the Global Mobility Technology Market Industry aligns with global sustainability goals, potentially leading to a market value of 162.3 USD Billion by 2035.

    Technological Advancements in Mobility Solutions

    Technological innovation plays a pivotal role in shaping the Global Mobility Technology Market Industry. The integration of artificial intelligence, machine learning, and the Internet of Things (IoT) into mobility solutions enhances efficiency and user experience. For example, smart traffic management systems utilize real-time data to optimize traffic flow, reducing congestion and travel times. This technological evolution is expected to drive market growth, with a compound annual growth rate (CAGR) of 30.22% projected from 2025 to 2035. As these technologies continue to evolve, they may redefine urban mobility, making it more efficient and accessible.

    Market Segment Insights

    Mobility Technology Type Insights

    <p>The Mobility Technology Market segmentation, based on type includes Bluetooth, Wearable Technology, Mobile Augmented Reality, and Wireless Gigabit. The bluetooth segment dominated the market. Bluetooth connectivity, hands-free calling, and smart device integration are all made possible by this technology in the vehicle sector. The rising acceptance of Bluetooth-enabled accessories such as fitness trackers, earbuds, and smartwatches is another factor contributing to the market's rise.</p>

    Mobility Technology Application Insights

    <p>The Mobility Technology Market segmentation, based on application, includes Electronic Products, Car, Medical Equipment, and Other. The car category generated the most income. Important contributing reasons include the increasing demand for electric vehicles (EVs), the growing popularity of linked automobiles, and the advancement of autonomous driving technologies. The increased desire from consumers for technologically advanced, eco-friendly forms of transportation is contributing to the popularity of cars.</p>

    <p>Figure 1: Mobility Technology Market, by Application, 2022 &amp; 2032 (USD Billion)</p>

    <p>Source: Secondary Research, Primary Research, Market Research Future Database and Analyst Review</p>

    Get more detailed insights about Mobility Technology Market Research Report — Global Forecast till 2032

    Regional Insights

    By region, the study provides the market insights into North America, Europe, Asia-Pacific and Rest of the World. The North American mobility technology market area will dominate this market. Electric vehicles (EVs) are widely used in the area, and significant investments have been made in the infrastructure needed for charging them. There is also a lot of activity in the creation and testing of autonomous vehicles, with several businesses actively testing and improving their technologies. The thriving mobility technology business in North America is fueled by investments from the corporate sector, government assistance, and a tech-savvy consumer base.

    Further, the major countries studied in the market report are The US, Canada, German, France, the UK, Italy, Spain, China, Japan, India, Australia, South Korea, and Brazil.

    Figure 2: Mobility Technology Market Share By Region 2022 (USD Billion)

    MOBILITY TECHNOLOGY MARKET SHARE BY REGION 2022

    Source: Secondary Research, Primary Research, Market Research Future Database and Analyst Review

    Europe mobility technology market accounts for the second-largest market share propelled by factors such as government grants for electric cars, stringent environmental regulations, and an emphasis on eco-friendly modes of transportation. European nations are investing more and more in smart mobility infrastructure, such as electric charging networks, smart traffic control systems, and other features that promote walking and bicycling. Further, the German mobility technology market held the largest market share, and the UK mobility technology market was the fastest growing market in the European region

    The Asia-Pacific Mobility Technology Market is expected to grow at the fastest CAGR from 2023 to 2032. The need for sophisticated transportation solutions is fueled by factors such as growing middle class, population growth, and rapid urbanization. Additionally, compared to other countries, a marked increase in demand is anticipated for mobile technology like smartphones, which can be used to access the internet for free or at a reduced cost via Wi-Fi hotspots offered by governments or service providers.

    Moreover, China’s mobility technology market held the largest market share, and the Indian mobility technology market was the fastest growing market in the Asia-Pacific region.

    Key Players and Competitive Insights

    Leading market players are investing heavily in research and development in order to expand their product lines, which will help the mobility technology market, grow even more. Market participants are also undertaking a variety of strategic activities to expand their global footprint, with important market developments including new product launches, contractual agreements, mergers and acquisitions, higher investments, and collaboration with other organizations. To expand and survive in a more competitive and rising market climate, mobility technology industry must offer cost-effective items.

    Manufacturing locally to minimize operational costs is one of the key business tactics used by manufacturers in the global mobility technology industry to benefit clients and increase the market sector. In recent years, the mobility technology industry has offered some of the most significant advantages to medicine. Major players in the mobility technology market are attempting to increase market demand by investing in research and development operations includes Qualcomm, Sierra Wireless, Samsung Electronics, Apple, Nuance Communication, Stmicroelectronics, Motorola Solutions, Texas Instruments, Atmel, Autotalks, Intel, Harris, Daifuku, and Dematic.

    Texas Instruments Inc. (TI) is a semiconductor manufacturer, designer, and distributor. The company's analog and embedded processor divisions sell standard semiconductor devices tailored to specific applications. Power and signal chain solutions are part of the company's analog chip range. Via its embedded processing category, it provides a large selection of microcontrollers, applications processors, and digital signal processors (DSPs). In addition, TI provides custom semiconductors, CAN transceivers, flip flops, calculators, data convertors, voltage translation devices, RF and microwave, sensors, switches, and wireless connection.

    Offering cellular wireless and Internet of Things (IoT) solutions to the machine-to-machine (M2M) and connected device markets is Sierra Wireless Inc. (Sierra Wireless). In addition to wireless gateways and routers for commercial and industrial use, the company provides original equipment manufacturers (OEM) with a portfolio of embedded broadband solutions, embedded wireless modules, and IoT connection services. The company facilitates end-to-end apps and offers cloud services for device management. Sierra Wireless provides its goods and services to the following industries: mobile computing, public safety, enterprise networking, cleantech, field services, healthcare, manufacturing, energy, security, residential, manufacturing, transportation, sales and payment.

    Key Companies in the Mobility Technology Market market include

    Industry Developments

    Future Outlook

    Mobility Technology Market Future Outlook

    <p>The Mobility Technology Market is projected to grow at a remarkable 33.20% CAGR from 2025 to 2035, driven by advancements in autonomous vehicles, smart infrastructure, and sustainable transportation solutions.</p>

    New opportunities lie in:

    • <p>Develop AI-driven mobility solutions for urban planning and traffic management. Invest in electric vehicle charging infrastructure to support growing EV adoption. Create integrated mobility platforms that enhance user experience and connectivity.</p>

    <p>By 2035, the Mobility Technology Market is expected to be a pivotal sector, reflecting substantial growth and innovation.</p>

    Market Segmentation

    Mobility Technology Type Outlook

    • Bluetooth
    • Wearable Technology
    • Mobile Augmented Reality
    • Wireless Gigabit

    Mobility Technology Regional Outlook

    • {"North America"=>["US"
    • "Canada"]}
    • {"Europe"=>["Germany"
    • "France"
    • "UK"
    • "Italy"
    • "Spain"
    • "Rest of Europe"]}
    • {"Asia-Pacific"=>["China"
    • "Japan"
    • "India"
    • "Australia"
    • "South Korea"
    • "Rest of Asia-Pacific"]}
    • {"Rest of the World"=>["Middle East"
    • "Africa"
    • "Latin America"]}

    Mobility Technology Application Outlook

    • Electronic Products
    • Car
    • Medical Equipment
    • Other

    Report Scope

    Report Attribute/MetricDetails
    Market Size 2035215.89 (Value (USD Billion))
    Compound Annual Growth Rate (CAGR)33.20% (2025 - 2035)
    Base Year2024
    Market Forecast Period2025 - 2035
    Historical Data2018- 2022
    Market Forecast UnitsValue (USD Billion)
    Report CoverageRevenue Forecast, Market Competitive Landscape, Growth Factors, and Trends
    Segments CoveredType, Application, and Region
    Geographies CoveredNorth America, Europe, Asia Pacific, and the Rest of the World
    Countries CoveredThe US, Canada, German, France, UK, Italy, Spain, China, Japan, India, Australia, South Korea, and Brazil
    Key Companies ProfiledQualcomm, Sierra Wireless, Samsung Electronics, Apple, Nuance Communication, Stmicroelectronics, Motorola Solutions, Texas Instruments, Atmel, Autotalks, Intel, Harris, Daifuku, and Dematic.
    Key Market Opportunities·       Expanding technological advancements such as ride-sharing and network connectivity
    Key Market Dynamics·       Growing urbanization and the demand for environmentally friendly modes of transportation ·       Utilization of cutting-edge technologies such as wearables and Bluetooth
    Market Size 20249.22 (Value (USD Billion))
    Market Size 202512.28 (Value (USD Billion))

    Market Highlights

    Author

    Swapnil Palwe
    Team Lead - Research

    She holds an experience of about 6+ years in market research and business consulting, working under the spectrum of information communication technology, telecommunications and semiconductor domains. aarti conceptualizes and implements a scalable business strategy and provides strategic leadership to the clients. her expertise lies in market estimation, competitive intelligence, pipeline analysis, customer assessment, etc.

    Leave a Comment

    Latest Comments

    John Doe
    john@example.com

    This is a great article! Really helped me understand the topic better.

    Posted on July 23, 2025, 10:15 AM
    Jane Smith
    jane@domain.com

    Thanks for sharing this. I’ve bookmarked it for later reference.

    Posted on July 22, 2025, 7:45 PM

    FAQs

    How much is the mobility technology market?

    The Mobility Technology Market size was valued at USD 5.2 Billion in 2022.

    What is the growth rate of the mobility technology market?

    The global market is projected to grow at a CAGR of 33.20% during the forecast period, 2023-2032.

    Which region held the largest market share in the mobility technology market?

    North America had the largest share in the global market

    Who are the key players in the mobility technology market?

    The key players in the market are Qualcomm, Sierra Wireless, Samsung Electronics, Apple, Nuance Communication, Stmicroelectronics, Motorola Solutions, Texas Instruments, Atmel, Autotalks, Intel, Harris, Daifuku, and Dematic.

    Which type led the mobility technology market?

    The bluetooth category dominated the market in 2022.

    Which application had the largest market share in the mobility technology market?

    The car category had the largest share in the global market.

    1. . EXECUTIVE SUMMARY
    2. . MARKET INTRODUCTION
    3. . Definition
    4. . Scope of the Study
    5. . Research Objective
    6. . Assumptions
    7. . Limitations
    8. . RESEARCH METHODOLOGY
    9. . Overview
    10. . Data Mining
    11. . Secondary Research
    12. . Primary Research
    13. . Primary Interviews and Information Gathering Process
    14. . Breakdown of Primary Respondents
    15. . Forecasting Modality
    16. . Market Size Estimation
    17. . Bottom-Up Approach
    18. . Top-Down Approach
    19. . Data Triangulation
    20. . Validation
    21. . MARKET DYNAMICS
    22. . Overview
    23. . Drivers
    24. . Restraints
    25. . Opportunities
    26. . MARKET FACTOR ANALYSIS
    27. . Value Chain Analysis
    28. . Porter’s Five Forces Analysis
    29. . Bargaining Power of Suppliers
    30. . Bargaining Power of Buyers
    31. . Threat of New Entrants
    32. . Threat of Substitutes
    33. . Intensity of Rivalry
    34. . COVID-19 Impact Analysis
    35. . Market Impact Analysis
    36. . Regional Impact
    37. . Opportunity and Threat Analysis
    38. . GLOBAL MOBILITY TECHNOLOGY MARKET, BY TYPE
    39. . Overview
    40. . Bluetooth
    41. . Wearable Technology
    42. . Mobile Augmented Reality
    43. . Wireless Gigabit
    44. . GLOBAL MOBILITY TECHNOLOGY MARKET, BY APPLICATION
    45. . Overview
    46. . Electronic Products
    47. . Car
    48. . Medical Equipment
    49. . Other
    50. . GLOBAL MOBILITY TECHNOLOGY MARKET, BY REGION
    51. . Overview
    52. . North America
    53. . US
    54. . Canada
    55. . Europe
    56. . Germany
    57. . France
    58. . UK
    59. . Italy
    60. . Spain
    61. . Rest of Europe
    62. . Asia-Pacific
    63. . China
    64. . India
    65. . Japan
    66. . South Korea
    67. . Australia
    68. . Rest of Asia-Pacific
    69. . Rest of the World
    70. . Middle East
    71. . Africa
    72. . Latin America
    73. . COMPETITIVE LANDSCAPE
    74. . Overview
    75. . Competitive Analysis
    76. . Market Share Analysis
    77. . Major Growth Strategy in the Global Mobility Technology Market,
    78. . Competitive Benchmarking
    79. . Leading Players in Terms of Number of Developments in the Global Mobility Technology Market,
    80. . Key developments and Growth Strategies
    81. . New Product Launch/Service Deployment
    82. . Merger & Acquisitions
    83. . Joint Ventures
    84. . Major Players Financial Matrix
    85. . Sales & Operating Income, 2022
    86. . Major Players R&D Expenditure. 2022
    87. . COMPANY PROFILES
    88. . Qualcomm
    89. . Company Overview
    90. . Financial Overview
    91. . Products Offered
    92. . Key Developments
    93. . SWOT Analysis
    94. . Key Strategies
    95. . SIERRA WIRELESS
    96. . Company Overview
    97. . Financial Overview
    98. . Products Offered
    99. . Key Developments
    100. . SWOT Analysis
    101. . Key Strategies
    102. . SAMSUNG ELECTRONICS
    103. . Company Overview
    104. . Financial Overview
    105. . Products Offered
    106. . Key Developments
    107. . SWOT Analysis
    108. . Key Strategies
    109. . Apple
    110. . Company Overview
    111. . Financial Overview
    112. . Products Offered
    113. . Key Developments
    114. . SWOT Analysis
    115. . Key Strategies
    116. . Nuance Communication
    117. . Company Overview
    118. . Financial Overview
    119. . Products Offered
    120. . Key Developments
    121. . SWOT Analysis
    122. . Key Strategies
    123. . STMICROELECTRONICS
    124. . Company Overview
    125. . Financial Overview
    126. . Products Offered
    127. . Key Developments
    128. . SWOT Analysis
    129. . Key Strategies
    130. . Motorola Solutions
    131. . Company Overview
    132. . Financial Overview
    133. . Products Offered
    134. . Key Developments
    135. . SWOT Analysis
    136. . Key Strategies
    137. . TEXAS INSTRUMENTS
    138. . Company Overview
    139. . Financial Overview
    140. . Products Offered
    141. . Key Developments
    142. . SWOT Analysis
    143. . Key Strategies
    144. . Atmel
    145. . Company Overview
    146. . Financial Overview
    147. . Products Offered
    148. . Key Developments
    149. . SWOT Analysis
    150. . Key Strategies
    151. . Autotalks
    152. . Company Overview
    153. . Financial Overview
    154. . Products Offered
    155. . Key Developments
    156. . SWOT Analysis
    157. . Key Strategies
    158. . Intel
    159. . Company Overview
    160. . Financial Overview
    161. . Products Offered
    162. . Key Developments
    163. . SWOT Analysis
    164. . Key Strategies
    165. . Harris
    166. . Company Overview
    167. . Financial Overview
    168. . Products Offered
    169. . Key Developments
    170. . SWOT Analysis
    171. . Key Strategies
    172. . Daifuku
    173. . Company Overview
    174. . Financial Overview
    175. . Products Offered
    176. . Key Developments
    177. . SWOT Analysis
    178. . Key Strategies
    179. . Dematic
    180. . Company Overview
    181. . Financial Overview
    182. . Products Offered
    183. . Key Developments
    184. . SWOT Analysis
    185. . Key Strategies
    186. . APPENDIX
    187. . References
    188. . Related Reports   LIST OF TABLES TABLE 1 GLOBAL MOBILITY TECHNOLOGY MARKET, SYNOPSIS, 2018–2032 TABLE 2 GLOBAL MOBILITY TECHNOLOGY MARKET, ESTIMATES & FORECAST, 2018–2032 (USD BILLION) TABLE 3 GLOBAL MOBILITY TECHNOLOGY MARKET, BY TYPE, 2018–2032 (USD BILLION) TABLE 4 GLOBAL MOBILITY TECHNOLOGY MARKET, BY APPLICATION, 2018–2032 (USD BILLION) TABLE 5 NORTH AMERICA: MOBILITY TECHNOLOGY MARKET, BY TYPE, 2018–2032 (USD BILLION) TABLE 6 NORTH AMERICA: MOBILITY TECHNOLOGY MARKET, BY APPLICATION, 2018–2032 (USD BILLION) TABLE 7 US: MOBILITY TECHNOLOGY MARKET, BY TYPE, 2018–2032 (USD BILLION) TABLE 8 US: MOBILITY TECHNOLOGY MARKET, BY APPLICATION, 2018–2032 (USD BILLION) TABLE 9 CANADA: MOBILITY TECHNOLOGY MARKET, BY TYPE, 2018–2032 (USD BILLION) TABLE 10 CANADA: MOBILITY TECHNOLOGY MARKET, BY APPLICATION, 2018–2032 (USD BILLION) TABLE 1 EUROPE: MOBILITY TECHNOLOGY MARKET, BY TYPE, 2018–2032 (USD BILLION) TABLE 2 EUROPE: MOBILITY TECHNOLOGY MARKET, BY APPLICATION, 2018–2032 (USD BILLION) TABLE 3 GERMANY: MOBILITY TECHNOLOGY MARKET, BY TYPE, 2018–2032 (USD BILLION) TABLE 4 GERMANY: MOBILITY TECHNOLOGY MARKET, BY APPLICATION, 2018–2032 (USD BILLION) TABLE 5 FRANCE: MOBILITY TECHNOLOGY MARKET, BY TYPE, 2018–2032 (USD BILLION) TABLE 6 FRANCE: MOBILITY TECHNOLOGY MARKET, BY APPLICATION, 2018–2032 (USD BILLION) TABLE 7 ITALY: MOBILITY TECHNOLOGY MARKET, BY TYPE, 2018–2032 (USD BILLION) TABLE 8 ITALY: MOBILITY TECHNOLOGY MARKET, BY APPLICATION, 2018–2032 (USD BILLION) TABLE 9 SPAIN: MOBILITY TECHNOLOGY MARKET, BY TYPE, 2018–2032 (USD BILLION) TABLE 10 SPAIN: MOBILITY TECHNOLOGY MARKET, BY APPLICATION, 2018–2032 (USD BILLION) TABLE 11 UK: MOBILITY TECHNOLOGY MARKET, BY TYPE, 2018–2032 (USD BILLION) TABLE 12 UK: MOBILITY TECHNOLOGY MARKET, BY END UER, 2018–2032 (USD BILLION) TABLE 13 REST OF EUROPE: MOBILITY TECHNOLOGY MARKET, BY TYPE, 2018–2032 (USD BILLION) TABLE 14 REST OF EUROPE: MOBILITY TECHNOLOGY MARKET, BY APPLICATION, 2018–2032 (USD BILLION) TABLE 15 ASIA-PACIFIC: MOBILITY TECHNOLOGY MARKET, BY TYPE, 2018–2032 (USD BILLION) TABLE 16 ASIA-PACIFIC: MOBILITY TECHNOLOGY MARKET, BY APPLICATION, 2018–2032 (USD BILLION) TABLE 17 JAPAN: MOBILITY TECHNOLOGY MARKET, BY TYPE, 2018–2032 (USD BILLION) TABLE 18 JAPAN: MOBILITY TECHNOLOGY MARKET, BY APPLICATION, 2018–2032 (USD BILLION) TABLE 19 CHINA: MOBILITY TECHNOLOGY MARKET, BY TYPE, 2018–2032 (USD BILLION) TABLE 20 CHINA: MOBILITY TECHNOLOGY MARKET, BY APPLICATION, 2018–2032 (USD BILLION) TABLE 21 INDIA: MOBILITY TECHNOLOGY MARKET, BY TYPE, 2018–2032 (USD BILLION) TABLE 22 INDIA: MOBILITY TECHNOLOGY MARKET, BY APPLICATION, 2018–2032 (USD BILLION) TABLE 23 AUSTRALIA: MOBILITY TECHNOLOGY MARKET, BY TYPE, 2018–2032 (USD BILLION) TABLE 24 AUSTRALIA: MOBILITY TECHNOLOGY MARKET, BY APPLICATION, 2018–2032 (USD BILLION) TABLE 25 SOUTH KOREA: MOBILITY TECHNOLOGY MARKET, BY TYPE, 2018–2032 (USD BILLION) TABLE 26 SOUTH KOREA: MOBILITY TECHNOLOGY MARKET, BY APPLICATION, 2018–2032 (USD BILLION) TABLE 27 REST OF ASIA-PACIFIC: MOBILITY TECHNOLOGY MARKET, BY TYPE, 2018–2032 (USD BILLION) TABLE 28 REST OF ASIA-PACIFIC: MOBILITY TECHNOLOGY MARKET, BY APPLICATION, 2018–2032 (USD BILLION) TABLE 29 REST OF THE WORLD: MOBILITY TECHNOLOGY MARKET, BY TYPE, 2018–2032 (USD BILLION) TABLE 30 REST OF THE WORLD: MOBILITY TECHNOLOGY MARKET, BY APPLICATION, 2018–2032 (USD BILLION) TABLE 31 MIDDLE EAST: MOBILITY TECHNOLOGY MARKET, BY TYPE, 2018–2032 (USD BILLION) TABLE 32 MIDDLE EAST: MOBILITY TECHNOLOGY MARKET, BY APPLICATION, 2018–2032 (USD BILLION) TABLE 33 AFRICA: MOBILITY TECHNOLOGY MARKET, BY TYPE, 2018–2032 (USD BILLION) TABLE 34 AFRICA: MOBILITY TECHNOLOGY MARKET, BY APPLICATION, 2018–2032 (USD BILLION) TABLE 35 LATIN AMERICA: MOBILITY TECHNOLOGY MARKET, BY TYPE, 2018–2032 (USD BILLION) TABLE 36 LATIN AMERICA: MOBILITY TECHNOLOGY MARKET, BY APPLICATION, 2018–2032 (USD BILLION) LIST OF FIGURES FIGURE 1 RESEARCH PROCESS FIGURE 2 MARKET STRUCTURE FOR THE GLOBAL MOBILITY TECHNOLOGY MARKET FIGURE 3 MARKET DYNAMICS FOR THE GLOBAL MOBILITY TECHNOLOGY MARKET FIGURE 4 GLOBAL MOBILITY TECHNOLOGY MARKET, SHARE (%), BY TYPE, 2021 FIGURE 5 GLOBAL MOBILITY TECHNOLOGY MARKET, SHARE (%), BY APPLICATION, 2021 FIGURE 6 GLOBAL MOBILITY TECHNOLOGY MARKET, SHARE (%), BY REGION, 2021 FIGURE 7 NORTH AMERICA: MOBILITY TECHNOLOGY MARKET, SHARE (%), BY REGION, 2021 FIGURE 8 EUROPE: MOBILITY TECHNOLOGY MARKET, SHARE (%), BY REGION, 2021 FIGURE 9 ASIA-PACIFIC: MOBILITY TECHNOLOGY MARKET, SHARE (%), BY REGION, 2021 FIGURE 10 REST OF THE WORLD: MOBILITY TECHNOLOGY MARKET, SHARE (%), BY REGION, 2021 FIGURE 11 GLOBAL MOBILITY TECHNOLOGY MARKET: COMPANY SHARE ANALYSIS, 2021 (%) FIGURE 12 QUALCOMM: FINANCIAL OVERVIEW SNAPSHOT FIGURE 13 QUALCOMM: SWOT ANALYSIS FIGURE 14 SIERRA WIRELESS: FINANCIAL OVERVIEW SNAPSHOT FIGURE 15 SIERRA WIRELESS: SWOT ANALYSIS FIGURE 16 SAMSUNG ELECTRONICS: FINANCIAL OVERVIEW SNAPSHOT FIGURE 17 SAMSUNG ELECTRONICS: SWOT ANALYSIS FIGURE 18 APPLE: FINANCIAL OVERVIEW SNAPSHOT FIGURE 19 APPLE: SWOT ANALYSIS FIGURE 20 NUANCE COMMUNICATION: FINANCIAL OVERVIEW SNAPSHOT FIGURE 21 NUANCE COMMUNICATION: SWOT ANALYSIS FIGURE 22 STMICROELECTRONICS: FINANCIAL OVERVIEW SNAPSHOT FIGURE 23 STMICROELECTRONICS: SWOT ANALYSIS FIGURE 24 MOTOROLA SOLUTIONS: FINANCIAL OVERVIEW SNAPSHOT FIGURE 25 MOTOROLA SOLUTIONS: SWOT ANALYSIS FIGURE 26 TEXAS INSTRUMENTS: FINANCIAL OVERVIEW SNAPSHOT FIGURE 27 TEXAS INSTRUMENTS: SWOT ANALYSIS FIGURE 28 ATMEL: FINANCIAL OVERVIEW SNAPSHOT FIGURE 29 ATMEL: SWOT ANALYSIS FIGURE 30 AUTOTALKS: FINANCIAL OVERVIEW SNAPSHOT FIGURE 31 AUTOTALKS: SWOT ANALYSIS FIGURE 32 INTEL: FINANCIAL OVERVIEW SNAPSHOT FIGURE 33 INTEL: SWOT ANALYSIS FIGURE 34 HARRIS: FINANCIAL OVERVIEW SNAPSHOT FIGURE 35 HARRIS: SWOT ANALYSIS FIGURE 36 DAIFUKU: FINANCIAL OVERVIEW SNAPSHOT FIGURE 37 DAIFUKU: SWOT ANALYSIS FIGURE 38 DEMATIC: FINANCIAL OVERVIEW SNAPSHOT FIGURE 39 DEMATIC: SWOT ANALYSIS
    189. List of Tables and Figures
      1. Table FIGURE 1 RESEARCH PROCESS FIGURE 2 MARKET STRUCTURE FOR THE GLOBAL MOBILITY TECHNOLOGY MARKET FIGURE 3 MARKET DYNAMICS FOR THE GLOBAL MOBILITY TECHNOLOGY MARKET FIGURE 4 GLOBAL MOBILITY TECHNOLOGY MARKET, SHARE (%), BY TYPE, 2021 FIGURE 5 GLOBAL MOBILITY TECHNOLOGY MARKET, SHARE (%), BY APPLICATION, 2021 FIGURE 6 GLOBAL MOBILITY TECHNOLOGY MARKET, SHARE (%), BY REGION, 2021 FIGURE 7 NORTH AMERICA: MOBILITY TECHNOLOGY MARKET, SHARE (%), BY REGION, 2021 FIGURE 8 EUROPE: MOBILITY TECHNOLOGY MARKET, SHARE (%), BY REGION, 2021 FIGURE 9 ASIA-PACIFIC: MOBILITY TECHNOLOGY MARKET, SHARE (%), BY REGION, 2021 FIGURE 10 REST OF THE WORLD: MOBILITY TECHNOLOGY MARKET, SHARE (%), BY REGION, 2021 FIGURE 11 GLOBAL MOBILITY TECHNOLOGY MARKET: COMPANY SHARE ANALYSIS, 2021 (%) FIGURE 12 QUALCOMM: FINANCIAL OVERVIEW SNAPSHOT FIGURE 13 QUALCOMM: SWOT ANALYSIS FIGURE 14 SIERRA WIRELESS: FINANCIAL OVERVIEW SNAPSHOT FIGURE 15 SIERRA WIRELESS: SWOT ANALYSIS FIGURE 16 SAMSUNG ELECTRONICS: FINANCIAL OVERVIEW SNAPSHOT FIGURE 17 SAMSUNG ELECTRONICS: SWOT ANALYSIS FIGURE 18 APPLE: FINANCIAL OVERVIEW SNAPSHOT FIGURE 19 APPLE: SWOT ANALYSIS FIGURE 20 NUANCE COMMUNICATION: FINANCIAL OVERVIEW SNAPSHOT FIGURE 21 NUANCE COMMUNICATION: SWOT ANALYSIS FIGURE 22 STMICROELECTRONICS: FINANCIAL OVERVIEW SNAPSHOT FIGURE 23 STMICROELECTRONICS: SWOT ANALYSIS FIGURE 24 MOTOROLA SOLUTIONS: FINANCIAL OVERVIEW SNAPSHOT FIGURE 25 MOTOROLA SOLUTIONS: SWOT ANALYSIS FIGURE 26 TEXAS INSTRUMENTS: FINANCIAL OVERVIEW SNAPSHOT FIGURE 27 TEXAS INSTRUMENTS: SWOT ANALYSIS FIGURE 28 ATMEL: FINANCIAL OVERVIEW SNAPSHOT FIGURE 29 ATMEL: SWOT ANALYSIS FIGURE 30 AUTOTALKS: FINANCIAL OVERVIEW SNAPSHOT FIGURE 31 AUTOTALKS: SWOT ANALYSIS FIGURE 32 INTEL: FINANCIAL OVERVIEW SNAPSHOT FIGURE 33 INTEL: SWOT ANALYSIS FIGURE 34 HARRIS: FINANCIAL OVERVIEW SNAPSHOT FIGURE 35 HARRIS: SWOT ANALYSIS FIGURE 36 DAIFUKU: FINANCIAL OVERVIEW SNAPSHOT FIGURE 37 DAIFUKU: SWOT ANALYSIS FIGURE 38 DEMATIC: FINANCIAL OVERVIEW SNAPSHOT FIGURE 39 DEMATIC: SWOT ANALYSIS
    190. Table FIGURE 1 RESEARCH PROCESS FIGURE 2 MARKET STRUCTURE FOR THE GLOBAL MOBILITY TECHNOLOGY MARKET FIGURE 3 MARKET DYNAMICS FOR THE GLOBAL MOBILITY TECHNOLOGY MARKET FIGURE 4 GLOBAL MOBILITY TECHNOLOGY MARKET, SHARE (%), BY TYPE, 2021 FIGURE 5 GLOBAL MOBILITY TECHNOLOGY MARKET, SHARE (%), BY APPLICATION, 2021 FIGURE 6 GLOBAL MOBILITY TECHNOLOGY MARKET, SHARE (%), BY REGION, 2021 FIGURE 7 NORTH AMERICA: MOBILITY TECHNOLOGY MARKET, SHARE (%), BY REGION, 2021 FIGURE 8 EUROPE: MOBILITY TECHNOLOGY MARKET, SHARE (%), BY REGION, 2021 FIGURE 9 ASIA-PACIFIC: MOBILITY TECHNOLOGY MARKET, SHARE (%), BY REGION, 2021 FIGURE 10 REST OF THE WORLD: MOBILITY TECHNOLOGY MARKET, SHARE (%), BY REGION, 2021 FIGURE 11 GLOBAL MOBILITY TECHNOLOGY MARKET: COMPANY SHARE ANALYSIS, 2021 (%) FIGURE 12 QUALCOMM: FINANCIAL OVERVIEW SNAPSHOT FIGURE 13 QUALCOMM: SWOT ANALYSIS FIGURE 14 SIERRA WIRELESS: FINANCIAL OVERVIEW SNAPSHOT FIGURE 15 SIERRA WIRELESS: SWOT ANALYSIS FIGURE 16 SAMSUNG ELECTRONICS: FINANCIAL OVERVIEW SNAPSHOT FIGURE 17 SAMSUNG ELECTRONICS: SWOT ANALYSIS FIGURE 18 APPLE: FINANCIAL OVERVIEW SNAPSHOT FIGURE 19 APPLE: SWOT ANALYSIS FIGURE 20 NUANCE COMMUNICATION: FINANCIAL OVERVIEW SNAPSHOT FIGURE 21 NUANCE COMMUNICATION: SWOT ANALYSIS FIGURE 22 STMICROELECTRONICS: FINANCIAL OVERVIEW SNAPSHOT FIGURE 23 STMICROELECTRONICS: SWOT ANALYSIS FIGURE 24 MOTOROLA SOLUTIONS: FINANCIAL OVERVIEW SNAPSHOT FIGURE 25 MOTOROLA SOLUTIONS: SWOT ANALYSIS FIGURE 26 TEXAS INSTRUMENTS: FINANCIAL OVERVIEW SNAPSHOT FIGURE 27 TEXAS INSTRUMENTS: SWOT ANALYSIS FIGURE 28 ATMEL: FINANCIAL OVERVIEW SNAPSHOT FIGURE 29 ATMEL: SWOT ANALYSIS FIGURE 30 AUTOTALKS: FINANCIAL OVERVIEW SNAPSHOT FIGURE 31 AUTOTALKS: SWOT ANALYSIS FIGURE 32 INTEL: FINANCIAL OVERVIEW SNAPSHOT FIGURE 33 INTEL: SWOT ANALYSIS FIGURE 34 HARRIS: FINANCIAL OVERVIEW SNAPSHOT FIGURE 35 HARRIS: SWOT ANALYSIS FIGURE 36 DAIFUKU: FINANCIAL OVERVIEW SNAPSHOT FIGURE 37 DAIFUKU: SWOT ANALYSIS FIGURE 38 DEMATIC: FINANCIAL OVERVIEW SNAPSHOT FIGURE 39 DEMATIC: SWOT ANALYSIS

    Mobility Technology Market Segmentation

    Mobility Technology Type Outlook (USD Billion, 2018-2032)

    • Bluetooth
    • Wearable Technology
    • Mobile Augmented Reality
    • Wireless Gigabit

    Mobility Technology Application Outlook (USD Billion, 2018-2032)

    • Electronic Products
    • Car
    • Medical Equipment
    • Other

    Mobility Technology Regional Outlook (USD Billion, 2018-2032)

    • North America Outlook (USD Billion, 2018-2032)
      • North America Mobility Technology by Type
        • Bluetooth
        • Wearable Technology
        • Mobile Augmented Reality
        • Wireless Gigabit
      • North America Mobility Technology by Application
        • Electronic Products
        • Car
        • Medical Equipment
        • Other
      • US Outlook (USD Billion, 2018-2032)
      • US Mobility Technology by Type
        • Bluetooth
        • Wearable Technology
        • Mobile Augmented Reality
        • Wireless Gigabit
      • US Mobility Technology by Application
        • Electronic Products
        • Car
        • Medical Equipment
        • Other
      • CANADA Outlook (USD Billion, 2018-2032)
      • CANADA Mobility Technology by Type
        • Bluetooth
        • Wearable Technology
        • Mobile Augmented Reality
        • Wireless Gigabit
      • CANADA Mobility Technology by Application
        • Electronic Products
        • Car
        • Medical Equipment
        • Other
      • Europe Outlook (USD Billion, 2018-2032)
        • Europe Mobility Technology by Type
          • Bluetooth
          • Wearable Technology
          • Mobile Augmented Reality
          • Wireless Gigabit
        • Europe Mobility Technology by Application
          • Electronic Products
          • Car
          • Medical Equipment
          • Other
        • Germany Outlook (USD Billion, 2018-2032)
        • Germany Mobility Technology by Type
          • Bluetooth
          • Wearable Technology
          • Mobile Augmented Reality
          • Wireless Gigabit
        • Germany Mobility Technology by Application
          • Electronic Products
          • Car
          • Medical Equipment
          • Other
        • France Outlook (USD Billion, 2018-2032)
        • France Mobility Technology by Type
          • Bluetooth
          • Wearable Technology
          • Mobile Augmented Reality
          • Wireless Gigabit
        • France Mobility Technology by Application
          • Electronic Products
          • Car
          • Medical Equipment
          • Other
        • UK Outlook (USD Billion, 2018-2032)
        • UK Mobility Technology by Type
          • Bluetooth
          • Wearable Technology
          • Mobile Augmented Reality
          • Wireless Gigabit
        • UK Mobility Technology by Application
          • Electronic Products
          • Car
          • Medical Equipment
          • Other
        • ITALY Outlook (USD Billion, 2018-2032)
        • ITALY Mobility Technology by Type
          • Bluetooth
          • Wearable Technology
          • Mobile Augmented Reality
          • Wireless Gigabit
        • ITALY Mobility Technology by Application
          • Electronic Products
          • Car
          • Medical Equipment
          • Other
        • SPAIN Outlook (USD Billion, 2018-2032)
        • Spain Mobility Technology by Type
          • Bluetooth
          • Wearable Technology
          • Mobile Augmented Reality
          • Wireless Gigabit
        • Spain Mobility Technology by Application
          • Electronic Products
          • Car
          • Medical Equipment
          • Other
        • Rest Of Europe Outlook (USD Billion, 2018-2032)
        • Rest Of Europe Mobility Technology by Type
          • Bluetooth
          • Wearable Technology
          • Mobile Augmented Reality
          • Wireless Gigabit
        • REST OF EUROPE Mobility Technology by Application
          • Electronic Products
          • Car
          • Medical Equipment
          • Other
        • Asia-Pacific Outlook (USD Billion, 2018-2032)
          • Asia-Pacific Mobility Technology by Type
            • Bluetooth
            • Wearable Technology
            • Mobile Augmented Reality
            • Wireless Gigabit
          • Asia-Pacific Mobility Technology by Application
            • Electronic Products
            • Car
            • Medical Equipment
            • Other
          • China Outlook (USD Billion, 2018-2032)
          • China Mobility Technology by Type
            • Bluetooth
            • Wearable Technology
            • Mobile Augmented Reality
            • Wireless Gigabit
          • China Mobility Technology by Application
            • Electronic Products
            • Car
            • Medical Equipment
            • Other
          • Japan Outlook (USD Billion, 2018-2032)
          • Japan Mobility Technology by Type
            • Bluetooth
            • Wearable Technology
            • Mobile Augmented Reality
            • Wireless Gigabit
          • Japan Mobility Technology by Application
            • Electronic Products
            • Car
            • Medical Equipment
            • Other
          • India Outlook (USD Billion, 2018-2032)
          • India Mobility Technology by Type
            • Bluetooth
            • Wearable Technology
            • Mobile Augmented Reality
            • Wireless Gigabit
          • India Mobility Technology by Application
            • Electronic Products
            • Car
            • Medical Equipment
            • Other
          • Australia Outlook (USD Billion, 2018-2032)
          • Australia Mobility Technology by Type
            • Bluetooth
            • Wearable Technology
            • Mobile Augmented Reality
            • Wireless Gigabit
          • Australia Mobility Technology by Application
            • Electronic Products
            • Car
            • Medical Equipment
            • Other
          • Rest of Asia-Pacific Outlook (USD Billion, 2018-2032)
          • Rest of Asia-Pacific Mobility Technology by Type
            • Bluetooth
            • Wearable Technology
            • Mobile Augmented Reality
            • Wireless Gigabit
          • Rest of Asia-Pacific Mobility Technology by Application
            • Electronic Products
            • Car
            • Medical Equipment
            • Other
          • Rest of the World Outlook (USD Billion, 2018-2032)
            • Rest of the World Mobility Technology by Type
              • Bluetooth
              • Wearable Technology
              • Mobile Augmented Reality
              • Wireless Gigabit
            • Rest of the World Mobility Technology by Application
              • Electronic Products
              • Car
              • Medical Equipment
              • Other
            • Middle East Outlook (USD Billion, 2018-2032)
            • Middle East Mobility Technology by Type
              • Bluetooth
              • Wearable Technology
              • Mobile Augmented Reality
              • Wireless Gigabit
            • Middle East Mobility Technology by Application
              • Electronic Products
              • Car
              • Medical Equipment
              • Other
            • Africa Outlook (USD Billion, 2018-2032)
            • Africa Mobility Technology by Type
              • Bluetooth
              • Wearable Technology
              • Mobile Augmented Reality
              • Wireless Gigabit
            • Africa Mobility Technology by Application
              • Electronic Products
              • Car
              • Medical Equipment
              • Other
            • Latin America Outlook (USD Billion, 2018-2032)
            • Latin America Mobility Technology by Type
              • Bluetooth
              • Wearable Technology
              • Mobile Augmented Reality
              • Wireless Gigabit
            • Latin America Mobility Technology by Application
              • Electronic Products
              • Car
              • Medical Equipment
              • Other
    Infographic

    Free Sample Request

    Kindly complete the form below to receive a free sample of this Report

    Get Free Sample

    Customer Strories

    “I am very pleased with how market segments have been defined in a relevant way for my purposes (such as "Portable Freezers & refrigerators" and "last-mile"). In general the report is well structured. Thanks very much for your efforts.”

    Victoria Milne

    Founder
    Case Study
    Chemicals and Materials