• Cat-intel
  • MedIntelliX
  • Resources
  • About Us
  • Hero Background
    English
    Chinese
    French
    Japanese
    Korean
    German
    Spanish

    LED Materials Market Trends

    ID: MRFR/CnM/4767-CR
    133 Pages
    Anshula Mandaokar
    July 2018

    LED Materials Market By Type (Wafers, Substrates/Semiconductors, and Others), By Application (General Lightings, Consumer Electronics, Automotive Exterior Lighting, Automotive Interior Lighting) - Forecast till 2035

    Share:
    Download PDF ×

    We do not share your information with anyone. However, we may send you emails based on your report interest from time to time. You may contact us at any time to opt-out.

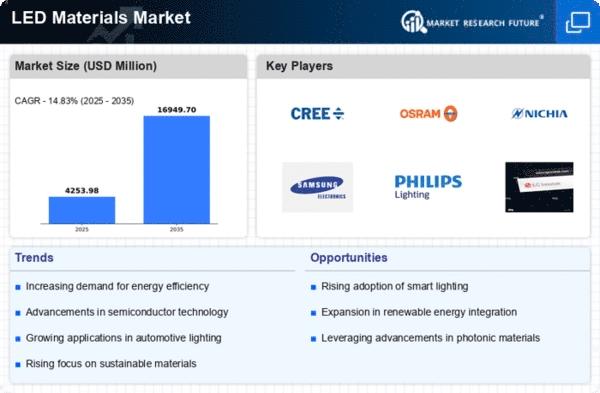
    LED Materials Market Infographic
    $ 4,950.0
    $ 5,950.0
    $ 7,250.0

    Market Trends

    Key Emerging Trends in the LED Materials Market

    The LED materials market has witnessed dynamic shifts in recent years, largely influenced by technological advancements and sustainability imperatives. One of the prominent trends driving this market is the escalating demand for energy-efficient lighting solutions. LED lights have emerged as a go-to choice for consumers and industries alike due to their longer lifespan and lower energy consumption compared to traditional lighting sources. As environmental concerns take center stage, governments worldwide are enforcing stringent regulations favoring energy-efficient lighting, propelling the LED materials market forward. Moreover, the market has seen a surge in research and development initiatives aimed at enhancing the efficiency and performance of LED materials. Manufacturers are investing significantly in developing innovative materials that can improve the luminous efficacy of LEDs while maintaining cost-effectiveness. This trend is fostering a competitive landscape within the LED materials market, encouraging companies to innovate and introduce cutting-edge materials with better thermal management, higher brightness, and improved color rendering capabilities. Another notable trend in the LED materials market is the emphasis on sustainability and eco-friendliness. Consumers are increasingly inclined towards environmentally conscious products, prompting manufacturers to focus on producing LED materials using recyclable or eco-friendly components. This shift towards sustainability not only aligns with consumer preferences but also helps in reducing the environmental footprint associated with LED production and disposal, making the market more appealing to a wider audience. The advent of smart lighting technology has also significantly impacted the LED materials market. With the rise of IoT (Internet of Things) and interconnected devices, there's a growing demand for LED materials that can facilitate smart lighting solutions. These materials are designed to enable features such as remote control, color-changing capabilities, and integration with smart home systems. As smart lighting gains traction across residential, commercial, and industrial sectors, the demand for specialized LED materials catering to these applications continues to grow. Furthermore, the COVID-19 pandemic has influenced market trends, accelerating the adoption of LED lighting solutions. The increased focus on health and wellness has led to a surge in demand for germicidal or UV LED lighting systems that offer disinfection capabilities. These specialized LED materials are being deployed in various settings, including healthcare facilities, offices, and public spaces, to ensure better sanitation and hygiene, thereby contributing to the expansion of the LED materials market.

    Market Summary

    As per Market Research Future Analysis, the LED Materials Market is projected to reach USD 22.68 Billion by 2030, driven by the increasing demand for energy-efficient lighting solutions. The COVID-19 pandemic has adversely affected the sector, disrupting supply chains and reducing demand due to economic downturns in various industries. However, the automotive sector's growing adoption of LEDs and advancements in technology, such as IoT and AI, are expected to propel market growth. The market faces challenges from raw material price volatility and competition from alternative lighting solutions. The Asia Pacific region is anticipated to lead the market, supported by significant manufacturing capabilities in countries like China and South Korea. North America and Europe are also key players, with North America benefiting from a robust electrical and electronics industry and Europe focusing on R&D investments for energy-efficient solutions.

    Key Market Trends & Highlights

    Key trends influencing the LED Materials Market include technological advancements and regulatory support.

    • Market capitalization expected to reach USD 22.68 Billion by 2030.
    • Sapphire segment projected to grow at a CAGR of 8.25% during the forecast period.
    • Residential lighting market projected to hit USD 9.65 Billion by 2024.
    • Asia Pacific to dominate market share due to large-scale manufacturing industries.

    Market Size & Forecast

    Market Size in 2022 USD 22.68 Billion
    Forecast Period 2022-2030
    CAGR Not specified
    Largest Regional Market Asia Pacific

    Major Players

    AkzoNobel N.V., Intematix, OSRAM Opto Semiconductors GmbH, Nichia Corporation, Epistar Corporation, EpiGaN, Plessey, Sumitomo Electric Industries, Ltd, Cree, Inc., MACOM, UBE INDUSTRIES, LTD, DOWA Electronics Materials Co., Ltd, II-VI Incorporated

    Market Trends

    The ongoing advancements in LED materials are poised to enhance energy efficiency and sustainability across various sectors, reflecting a broader commitment to reducing environmental impact.

    U.S. Department of Energy

    LED Materials Market Market Drivers

    Market Growth Projections

    The Global LED Materials Market Industry is poised for substantial growth, with projections indicating a market size of 33.7 USD Billion by 2035. The anticipated compound annual growth rate (CAGR) of 12.04% from 2025 to 2035 reflects the increasing adoption of LED technology across various applications. This growth is underpinned by factors such as rising energy costs, advancements in LED manufacturing, and supportive government policies. The market's expansion is expected to create numerous opportunities for stakeholders, including manufacturers, suppliers, and end-users, as the demand for LED materials continues to rise globally.

    Rising Demand for Energy Efficiency

    The Global LED Materials Market Industry experiences a notable surge in demand driven by the increasing emphasis on energy efficiency. Governments worldwide are implementing stringent regulations aimed at reducing energy consumption, which propels the adoption of LED technology. For instance, the transition from traditional lighting solutions to LED alternatives is projected to save approximately 50% of energy usage. As a result, the Global LED Materials Market is expected to reach 9.65 USD Billion in 2024, reflecting a growing recognition of the environmental and economic benefits associated with LED materials.

    Government Initiatives and Incentives

    Government initiatives and incentives play a crucial role in fostering the growth of the Global LED Materials Market Industry. Various countries are introducing subsidies and tax incentives to encourage the adoption of LED technology in residential, commercial, and industrial sectors. For instance, programs aimed at retrofitting existing lighting systems with LED solutions are gaining traction, thereby enhancing market penetration. These supportive measures not only stimulate demand but also align with broader sustainability goals, indicating a favorable environment for the LED materials market to flourish in the coming years.

    Growing Applications in Diverse Sectors

    The versatility of LED materials leads to their growing applications across various sectors, which significantly drives the Global LED Materials Market Industry. From automotive lighting to consumer electronics and architectural lighting, the adaptability of LED technology caters to a wide range of needs. The increasing integration of LED solutions in smart city initiatives further amplifies this trend, as urban planners seek energy-efficient lighting solutions. This diversification of applications is expected to contribute to a compound annual growth rate (CAGR) of 12.04% from 2025 to 2035, underscoring the market's potential for sustained growth.

    Technological Advancements in LED Manufacturing

    Technological innovations in the manufacturing processes of LED materials significantly contribute to the growth of the Global LED Materials Market Industry. Advances such as improved semiconductor materials and enhanced production techniques lead to higher efficiency and lower costs. For example, the development of quantum dot technology has the potential to revolutionize LED performance, offering brighter and more vibrant colors. This ongoing evolution in manufacturing capabilities is likely to sustain a robust growth trajectory, with projections indicating a market expansion to 33.7 USD Billion by 2035, highlighting the importance of continuous innovation in this sector.

    Consumer Awareness and Preference for Sustainable Products

    There is a marked increase in consumer awareness regarding sustainability, which positively influences the Global LED Materials Market Industry. As consumers become more environmentally conscious, their preference for sustainable products drives the demand for LED lighting solutions. This shift in consumer behavior is evident in the rising sales of energy-efficient lighting options, as individuals seek to reduce their carbon footprint. Retailers are responding by expanding their LED product offerings, further enhancing market accessibility. This growing consumer inclination towards sustainability is likely to bolster the market's growth trajectory in the foreseeable future.

    Market Segment Insights

    Regional Insights

    Key Companies in the LED Materials Market market include

    Industry Developments

    March 2023: Samsung announced that it has developed a new type of LED material that is more efficient and durable than existing materials. The new material is made of gallium nitride (GaN) and is said to be able to last up to 100,000 hours, which is twice as long as the lifetime of current LED materials.

    April 2023: Osram announced that it has begun mass production of its new generation of LED materials. The new materials are made of gallium nitride and indium gallium nitride (InGaN) and are said to be more efficient and cost-effective than existing materials.

    May 2023: Cree announced that it has developed a new type of LED material that can emit light in the ultraviolet (UV) spectrum. The new material is made of gallium nitride and is said to be useful for applications such as water purification and sterilization.

    Future Outlook

    LED Materials Market Future Outlook

    The Global LED Materials Market is projected to grow at a 12.04% CAGR from 2024 to 2035, driven by advancements in energy efficiency, increasing demand for smart lighting, and technological innovations.

    New opportunities lie in:

    • Develop eco-friendly LED materials to meet sustainability demands.
    • Invest in R&D for advanced semiconductor technologies to enhance performance.
    • Expand into emerging markets with tailored LED solutions for local industries.

    By 2035, the market is expected to achieve substantial growth, reflecting a robust demand for innovative LED solutions.

    Market Segmentation

    By Type

    • Others
    • Phosphor
    • Epitaxy Material
    • Substrate/Semiconductor
    • Wafers
    • Others
    • Displays & Billboards
    • Healthcare
    • Automotive Exterior Lighting
    • Automotive Interior Lighting
    • Specialty Lighting
    • General Lighting
    • Consumer Electronics

    Drivers

    • Growing Adoption from Automotive Sector to Drive Market Growth

    Restraints

    • Growing Adoption of Alternatives to Impede Market Growth

    Opportunities

    • Growing R&D Investments to Create Growth Avenues for Market Players

    By Application

    • Others
    • Displays & Billboards
    • Healthcare
    • Automotive Exterior Lighting
    • Automotive Interior Lighting
    • Specialty Lighting
    • General Lighting
    • Consumer Electronics

    Report Overview

    • Others
    • Phosphor
    • Epitaxy Material
    • Substrate/Semiconductor
    • Wafers
    • Others
    • Displays & Billboards
    • Healthcare
    • Automotive Exterior Lighting
    • Automotive Interior Lighting
    • Specialty Lighting
    • General Lighting
    • Consumer Electronics

    Competitive Landscape

    • II-VI Incorporated
    • DOWA Electronics Materials Co., Ltd (DOWA Materials Co., Ltd)
    • UBE INDUSTRIES, LTD
    • MACOM
    • Cree, Inc.
    • Sumitomo Electric Industries, Ltd
    • Plessey
    • EpiGaN
    • Epistar Corporation
    • Nichia Corporation
    • OSRAM Opto Semiconductors GmbH
    • Intematix
    • AkzoNobel N.V.

    Report Scope

    Report Attribute/Metric Details
      Market Size   2030: USD 22.68 billion
      CAGR   2030: 10.3% CAGR
      Base Year   2021
      Forecast Period   2022 to 2030
      Historical Data   2019 & 2020
      Forecast Units    Value (USD Million)
      Report Coverage   Revenue Forecast, Competitive Landscape, Growth Factors, and Trends
      Segments Covered   Type, Application and Region
      Geographies Covered   North America, Europe, Asia-Pacific, and Rest of the World (RoW)
      Key Vendors   AkzoNobel N.V., Intematix, OSRAM Opto Semiconductors GmbH, Nichia Corporation, Epistar Corporation, EpiGaN, Plessey, Sumitomo Electric Industries, Ltd, Cree, Inc., MACOM, UBE INDUSTRIES, LTD, DOWA Electronics Materials Co., Ltd (DOWA Materials Co., Ltd), II-VI Incorporated
      Key Market Opportunities   Growing R&D Investments to Create Growth Avenues for Market Players
      Key Market Drivers   Growing Adoption from Automotive Sector to Drive Market Growth

    Market Highlights

    Author

    Anshula Mandaokar
    Team Lead - Research

    She holds an experience of about 6+ years in market research and business consulting, working under the spectrum of information communication technology, telecommunications and semiconductor domains. aarti conceptualizes and implements a scalable business strategy and provides strategic leadership to the clients. her expertise lies in market estimation, competitive intelligence, pipeline analysis, customer assessment, etc.

    Leave a Comment

    Latest Comments

    John Doe
    john@example.com

    This is a great article! Really helped me understand the topic better.

    Posted on July 23, 2025, 10:15 AM
    Jane Smith
    jane@domain.com

    Thanks for sharing this. I’ve bookmarked it for later reference.

    Posted on July 22, 2025, 7:45 PM

    FAQs

    How much is the global LED materials market worth in the future?

    The valuation of the global LED materials market is projected to grow to USD 22.68 BN by 2027

    Who are the top players in the global LED materials market?

    Epistar Corporation, EpiGaN, AkzoNobel N.V., DOWA Electronics Materials Co., Ltd. (DOWA Materials Co., Ltd), Plessey, Sumitomo Electric Industries, Ltd., II-VI Incorporated, Nichia Corporation, Intematix, MACOM, UBE INDUSTRIES, LTD., OSRAM Opto Semiconductors GmbH, and Cree, Inc., are some of the leading players in the global LED materials market.

    Which region holds the largest share in the global LED materials market?

    Asia Pacific holds the largest share in the global LED materials market followed by North America and Europe, respectively.

    What are the key growth strategies of LED materials industry players?

    Strategic initiatives such as mergers & acquisitions, collaborations, expansion, and technology/ product launch are some of the growth strategies that players operating in the global LED materials market adopt to gain a larger competitive advantage.

    What are the major applications of LED materials?

    LED materials finds their applications in consumer electronics, automotive interior & exterior lighting, and general lightings.

    1. List of Tables and Figures
      1. TABLE
      2. 1 MARKET SYNOPSIS 16
      3. TABLE 2 GLOBAL LED MATERIALS MARKET VALUE, BY TYPE,
      4. (2018–2024) (USD MILLION) 36
      5. TABLE 3 GLOBAL WAFERS MARKET FOR LED
      6. MATERIALS MARKET, BY TYPE, (2018–2024) (USD MILLION) 37
      7. TABLE 4
      8. GLOBAL WAFERS MARKET FOR LED MATERIALS MARKET, BY REGION, (2018–2024) (USD
      9. MILLION) 38
      10. TABLE 5 GLOBAL SAPPHIRE MARKET FOR LED MATERIALS MARKET, BY
      11. REGION, (2018–2024) (USD MILLION) 38
      12. TABLE 6 GLOBAL SILICON MARKET
      13. FOR LED MATERIALS MARKET, BY REGION, (2018–2024) (USD MILLION) 39
      14. TABLE
      15. 7 GLOBAL SILICON CARBIDE MARKET FOR LED MATERIALS MARKET, BY REGION, (2018–2024)
      16. (USD MILLION) 39
      17. TABLE 8 GLOBAL OTHERS MARKET FOR LED MATERIALS MARKET,
      18. BY REGION, (2018–2024) (USD MILLION) 40
      19. TABLE 9 GLOBAL SUBSTRATES/SEMICONDUCTORS
      20. MARKET FOR LED MATERIALS MARKET, BY TYPE, (2018–2024) (USD MILLION) 41
      21. TABLE
      22. 10 GLOBAL SUBSTRATES/SEMICONDUCTORS MARKET FOR LED MATERIALS MARKET, BY REGION,
      23. (2018–2024) (USD MILLION) 41
      24. TABLE 11 GLOBAL GALLIUM ARSENIDE MARKET
      25. FOR LED MATERIALS MARKET, BY REGION, (2018–2024) (USD MILLION) 42
      26. TABLE
      27. 12 GLOBAL GALLIUM NITRIDE MARKET FOR LED MATERIALS MARKET, BY REGION, (2018–2024)
      28. (USD MILLION) 42
      29. TABLE 13 GLOBAL GALLIUM PHOSPHIDE MARKET FOR LED MATERIALS
      30. MARKET, BY REGION, (2018–2024) (USD MILLION) 43
      31. TABLE 14 GLOBAL
      32. INDIUM GALLIUM NITRIDE MARKET FOR LED MATERIALS MARKET, BY REGION, (2018–2024)
      33. (USD MILLION) 43
      34. TABLE 15 GLOBAL ALUMINIUM GALLIUM ARSENIDE MARKET FOR
      35. LED MATERIALS MARKET, BY REGION, (2018–2024) (USD MILLION) 44
      36. TABLE
      37. 16 GLOBAL PHOSPHOR MARKET FOR LED MATERIALS MARKET, BY REGION, (2018–2024)
      38. (USD MILLION) 44
      39. TABLE 17 GLOBAL EPITAXY MATERIAL MARKET FOR LED MATERIALS
      40. MARKET, BY REGION, (2018–2024) (USD MILLION) 45
      41. TABLE 18 GLOBAL
      42. OTHER MARKET FOR LED MATERIALS MARKET, BY REGION, (2018–2024) (USD MILLION)
      43. 45
      44. TABLE 19 GLOBAL LED MATERIALS MARKET VALUE, BY APPLICATION, (2018–2024)
      45. (USD MILLION) 47
      46. TABLE 20 GLOBAL GENERAL LIGHTING MARKET FOR LED MATERIALS
      47. MARKET, BY APPLICATION, (2018–2024) (USD MILLION) 48
      48. TABLE 21 GLOBAL
      49. GENERAL LIGHTING MARKET FOR LED MATERIALS MARKET, BY REGION, (2018–2024) (USD
      50. MILLION) 49
      51. TABLE 22 GLOBAL RESIDENTIAL LIGHTING MARKET FOR LED MATERIALS
      52. MARKET, BY REGION, (2018–2024) (USD MILLION) 49
      53. TABLE 23 GLOBAL
      54. I&I LIGHTING MARKET FOR LED MATERIALS MARKET, BY REGION, (2018–2024) (USD
      55. MILLION) 50
      56. TABLE 24 GLOBAL OUTDOOR LIGHTING MARKET FOR LED MATERIALS
      57. MARKET, BY REGION, (2018–2024) (USD MILLION) 50
      58. TABLE 25 GLOBAL
      59. OTHERS MARKET FOR LED MATERIALS MARKET, BY REGION, (2018–2024) (USD MILLION)
      60. 51
      61. TABLE 26 GLOBAL CONSUMER ELECTRONICS MARKET FOR LED MATERIALS MARKET,
      62. BY APPLICATION, (2018–2024) (USD MILLION) 52
      63. TABLE 27 GLOBAL CONSUMER
      64. ELECTRONICS MARKET FOR LED MATERIALS MARKET, BY REGION, (2018–2024) (USD MILLION)
      65. 52
      66. TABLE 28 GLOBAL HANDHELD DEVICES MARKET FOR LED MATERIALS MARKET, BY
      67. REGION, (2018–2024) (USD MILLION) 53
      68. TABLE 29 GLOBAL TELEVISION
      69. MARKET FOR LED MATERIALS MARKET, BY REGION, (2018–2024) (USD MILLION) 53
      70. TABLE
      71. 30 GLOBAL BACKLIGHT MARKET FOR LED MATERIALS MARKET, BY REGION, (2018–2024)
      72. (USD MILLION) 54
      73. TABLE 31 GLOBAL MONITORS MARKET FOR LED MATERIALS MARKET,
      74. BY REGION, (2018–2024) (USD MILLION) 54
      75. TABLE 32 GLOBAL OTHERS MARKET
      76. FOR LED MATERIALS MARKET, BY REGION, (2018–2024) (USD MILLION) 55
      77. TABLE
      78. 33 GLOBAL AUTOMOTIVE EXTERIOR LIGHTING MARKET FOR LED MATERIALS MARKET, BY REGION,
      79. (2018–2024) (USD MILLION) 55
      80. TABLE 34 GLOBAL DISPLAYS & BILLBOARDS
      81. MARKET FOR LED MATERIALS MARKET, BY REGION, (2018–2024) (USD MILLION) 56
      82. TABLE
      83. 35 GLOBAL AUTOMOTIVE INTERIOR LIGHTING MARKET FOR LED MATERIALS MARKET, BY REGION,
      84. (2018–2024) (USD MILLION) 56
      85. TABLE 36 GLOBAL SPECIALTY LIGHTING
      86. MARKET FOR LED MATERIALS MARKET, BY REGION, (2018–2024) (USD MILLION) 57
      87. TABLE
      88. 37 GLOBAL HEALTHCARE MARKET FOR LED MATERIALS MARKET, BY REGION, (2018–2024)
      89. (USD MILLION) 58
      90. TABLE 38 GLOBAL OTHERS MARKET FOR LED MATERIALS MARKET,
      91. BY REGION, (2018–2024) (USD MILLION) 58
      92. TABLE 39 GLOBAL LED MATERIALS
      93. MARKET, BY REGION, (2018–2024) (USD MILLION) 60
      94. TABLE 40 GLOBAL
      95. LED MATERIALS MARKET, BY TYPE, (2018–2024) (USD MILLION) 61
      96. TABLE
      97. 41 GLOBAL LED MATERIALS MARKET, BY APPLICATION, (2018–2024) (USD MILLION)
      98. 61
      99. TABLE 42 NORTH AMERICA: LED MATERIALS MARKET, BY REGION, (2018–2024)
      100. (USD MILLION) 62
      101. TABLE 43 NORTH AMERICA: LED MATERIALS MARKET, BY TYPE,
      102. (2018–2024) (USD MILLION) 63
      103. TABLE 44 NORTH AMERICA: LED MATERIALS
      104. MARKET, BY APPLICATION, (2018–2024) (USD MILLION) 64
      105. TABLE 45 U.S.:
      106. LED MATERIALS MARKET, BY TYPE, (2018–2024) (USD MILLION) 65
      107. TABLE
      108. 46 U.S.: LED MATERIALS MARKET, BY APPLICATION, (2018–2024) (USD MILLION) 65
      109. TABLE
      110. 47 CANADA: LED MATERIALS MARKET, BY TYPE, (2018–2024) (USD MILLION) 66
      111. TABLE
      112. 48 CANADA: LED MATERIALS MARKET, BY APPLICATION, (2018–2024) (USD MILLION)
      113. 66
      114. TABLE 49 EUROPE: LED MATERIALS MARKET, BY REGION, (2018–2024)
      115. (USD MILLION) 67
      116. TABLE 50 EUROPE: LED MATERIALS MARKET, BY TYPE, (2018–2024)
      117. (USD MILLION) 68
      118. TABLE 51 EUROPE: LED MATERIALS MARKET, BY APPLICATION,
      119. (2018–2024) (USD MILLION) 69
      120. TABLE 52 GERMANY: LED MATERIALS MARKET,
      121. BY TYPE, (2018–2024) (USD MILLION) 70
      122. TABLE 53 GERMANY: LED MATERIALS
      123. MARKET, BY APPLICATION, (2018–2024) (USD MILLION) 70
      124. TABLE 54 FRANCE:
      125. LED MATERIALS MARKET, BY TYPE, (2018–2024) (USD MILLION) 71
      126. TABLE
      127. 55 FRANCE: LED MATERIALS MARKET, BY APPLICATION, (2018–2024) (USD MILLION)
      128. 71
      129. TABLE 56 U.K.: LED MATERIALS MARKET, BY TYPE, (2018–2024) (USD
      130. MILLION) 72
      131. TABLE 57 U.K.: LED MATERIALS MARKET, BY APPLICATION, (2018–2024)
      132. (USD MILLION) 72
      133. TABLE 58 RUSSIA: LED MATERIALS MARKET, BY TYPE, (2018–2024)
      134. (USD MILLION) 73
      135. TABLE 59 RUSSIA: LED MATERIALS MARKET, BY APPLICATION,
      136. (2018–2024) (USD MILLION) 73
      137. TABLE 60 SPAIN: LED MATERIALS MARKET,
      138. BY TYPE, (2018–2024) (USD MILLION) 74
      139. TABLE 61 SPAIN: LED MATERIALS
      140. MARKET, BY APPLICATION, (2018–2024) (USD MILLION) 74
      141. TABLE 62 ITALY:
      142. LED MATERIALS MARKET, BY TYPE, (2018–2024) (USD MILLION) 75
      143. TABLE
      144. 63 ITALY: LED MATERIALS MARKET, BY APPLICATION, (2018–2024) (USD MILLION)
      145. 75
      146. TABLE 64 POLAND: LED MATERIALS MARKET, BY TYPE, (2018–2024) (USD
      147. MILLION) 76
      148. TABLE 65 POLAND: LED MATERIALS MARKET, BY APPLICATION, (2018–2024)
      149. (USD MILLION) 76
      150. TABLE 66 REST OF EUROPE: LED MATERIALS MARKET, BY TYPE,
      151. (2018–2024) (USD MILLION) 77
      152. TABLE 67 REST OF EUROPE: LED MATERIALS
      153. MARKET, BY APPLICATION, (2018–2024) (USD MILLION) 77
      154. TABLE 68 ASIA-PACIFIC:
      155. LED MATERIALS MARKET SHARE, BY COUNTRY, 2020 (% SHARE) 78
      156. TABLE 69 ASIA-PACIFIC:
      157. LED MATERIALS MARKET, BY REGION, (2018–2024) (USD MILLION) 78
      158. TABLE
      159. 70 ASIA-PACIFIC: LED MATERIALS MARKET, BY TYPE, (2018–2024) (USD MILLION)
      160. 79
      161. TABLE 71 ASIA-PACIFIC: LED MATERIALS MARKET, BY APPLICATION, (2018–2024)
      162. (USD MILLION) 80
      163. TABLE 72 CHINA: LED MATERIALS MARKET, BY TYPE, (2018–2024)
      164. (USD MILLION) 81
      165. TABLE 73 CHINA: LED MATERIALS MARKET, BY APPLICATION,
      166. (2018–2024) (USD MILLION) 81
      167. TABLE 74 INDIA: LED MATERIALS MARKET,
      168. BY TYPE, (2018–2024) (USD MILLION) 82
      169. TABLE 75 INDIA: LED MATERIALS
      170. MARKET, BY APPLICATION, (2018–2024) (USD MILLION) 82
      171. TABLE 76 JAPAN:
      172. LED MATERIALS MARKET, BY TYPE, (2018–2024) (USD MILLION) 83
      173. TABLE
      174. 77 JAPAN: LED MATERIALS MARKET, BY APPLICATION, (2018–2024) (USD MILLION)
      175. 83
      176. TABLE 78 AUSTRALIA & NEW ZEALAND: LED MATERIALS MARKET, BY TYPE,
      177. (2018–2024) (USD MILLION) 84
      178. TABLE 79 AUSTRALIA & NEW ZEALAND:
      179. LED MATERIALS MARKET, BY APPLICATION, (2018–2024) (USD MILLION) 84
      180. TABLE
      181. 80 ASEAN: LED MATERIALS MARKET, BY TYPE, (2018–2024) (USD MILLION) 85
      182. TABLE
      183. 81 ASEAN: LED MATERIALS MARKET, BY APPLICATION, (2018–2024) (USD MILLION)
      184. 85
      185. TABLE 82 SOUTH KOREA: LED MATERIALS MARKET, BY TYPE, (2018–2024)
      186. (USD MILLION) 86
      187. TABLE 83 SOUTH KOREA: LED MATERIALS MARKET, BY APPLICATION,
      188. (2018–2024) (USD MILLION) 86
      189. TABLE 84 REST OF ASIA-PACIFIC: LED
      190. MATERIALS MARKET, BY TYPE, (2018–2024) (USD MILLION) 87
      191. TABLE 85
      192. REST OF ASIA-PACIFIC: LED MATERIALS MARKET, BY APPLICATION, (2018–2024) (USD
      193. MILLION) 87
      194. TABLE 86 LATIN AMERICA: LED MATERIALS MARKET SHARE, BY COUNTRY,
      195. 2020 (% SHARE) 88
      196. TABLE 87 LATIN AMERICA: LED MATERIALS MARKET, BY REGION,
      197. (2018–2024) (USD MILLION) 88
      198. TABLE 88 LATIN AMERICA: LED MATERIALS
      199. MARKET, BY TYPE, (2018–2024) (USD MILLION) 89
      200. TABLE 89 LATIN AMERICA:
      201. LED MATERIALS MARKET, BY APPLICATION, (2018–2024) (USD MILLION) 90
      202. TABLE
      203. 90 BRAZIL: LED MATERIALS MARKET, BY TYPE, (2018–2024) (USD MILLION) 91
      204. TABLE
      205. 91 BRAZIL: LED MATERIALS MARKET, BY APPLICATION, (2018–2024) (USD MILLION)
      206. 91
      207. TABLE 92 MEXICO: LED MATERIALS MARKET, BY TYPE, (2018–2024) (USD
      208. MILLION) 92
      209. TABLE 93 MEXICO: LED MATERIALS MARKET, BY APPLICATION, (2018–2024)
      210. (USD MILLION) 92
      211. TABLE 94 ARGENTINA: LED MATERIALS MARKET, BY TYPE, (2018–2024)
      212. (USD MILLION) 93
      213. TABLE 95 ARGENTINA: LED MATERIALS MARKET, BY APPLICATION,
      214. (2018–2024) (USD MILLION) 93
      215. TABLE 96 REST OF LATIN AMERICA: LED
      216. MATERIALS MARKET, BY TYPE, (2018–2024) (USD MILLION) 94
      217. TABLE 97
      218. REST OF LATIN AMERICA: LED MATERIALS MARKET, BY APPLICATION, (2018–2024) (USD
      219. MILLION) 94
      220. TABLE 98 MIDDLE EAST & AFRICA: LED MATERIALS MARKET, BY
      221. REGION, (2018–2024) (USD MILLION) 95
      222. TABLE 99 MIDDLE EAST &
      223. AFRICA: LED MATERIALS MARKET, BY TYPE, (2018–2024) (USD MILLION) 96
      224. TABLE
      225. 100 MIDDLE EAST & AFRICA: LED MATERIALS MARKET, BY APPLICATION, (2018–2024)
      226. (USD MILLION) 97
      227. TABLE 101 TURKEY: LED MATERIALS MARKET, BY TYPE, (2018–2024)
      228. (USD MILLION) 98
      229. TABLE 102 TURKEY: LED MATERIALS MARKET, BY APPLICATION,
      230. (2018–2024) (USD MILLION) 98
      231. TABLE 103 ISRAEL: LED MATERIALS MARKET,
      232. BY TYPE, (2018–2024) (USD MILLION) 99
      233. TABLE 104 ISRAEL: LED MATERIALS
      234. MARKET, BY APPLICATION, (2018–2024) (USD MILLION) 99
      235. TABLE 105 NORTH
      236. AFRICA: LED MATERIALS MARKET, BY TYPE, (2018–2024) (USD MILLION) 100
      237. TABLE
      238. 106 NORTH AFRICA: LED MATERIALS MARKET, BY APPLICATION, (2018–2024) (USD MILLION)
      239. 100
      240. TABLE 107 G.C.C.: LED MATERIALS MARKET, BY TYPE, (2018–2024)
      241. (USD MILLION) 101
      242. TABLE 108 G.C.C.: LED MATERIALS MARKET, BY APPLICATION,
      243. (2018–2024) (USD MILLION) 101
      244. TABLE 109 REST OF THE MIDDLE EAST
      245. & AFRICA: LED MATERIALS MARKET, BY TYPE, (2018–2024) (USD MILLION) 102
      246. TABLE
      247. 110 REST OF THE MIDDLE EAST & AFRICA: LED MATERIALS MARKET, BY APPLICATION,
      248. (2018–2024) (USD MILLION) 102
      249. TABLE 111 KEY DEVELOPMENTS 105
      250.  
      251. 13
    2. List of Tables and Figures
      1. FIGURE 1 GLOBAL LED MATERIALS MARKET: MARKET STRUCTURE
      2. 19
      3. FIGURE 2 RESEARCH PROCESS OF MRFR 21
      4. FIGURE 3 TOP-DOWN &
      5. BOTTOM-UP APPROACH 24
      6. FIGURE 4 DROC ANALYSIS OF GLOBAL LED MATERIALS MARKET
      7. 26
      8. FIGURE 5 DRIVERS IMPACT ANALYSIS: LED MATERIALS MARKET 28
      9. FIGURE
      10. 6 RESTRAINTS IMPACT ANALYSIS: LED MATERIALS MARKET 29
      11. FIGURE 7 SUPPLY
      12. CHAIN: LED MATERIALS MARKET 32
      13. FIGURE 8 PORTER'S FIVE FORCES ANALYSIS
      14. OF THE GLOBAL LED MATERIALS MARKET 33
      15. FIGURE 9 GLOBAL LED MATERIALS MARKET
      16. SHARE, BY TYPE, 2020-2027(USD MILLION) 36
      17. FIGURE 10 GLOBAL WAFERS MARKET
      18. FOR LED MATERIALS MARKET, BY TYPE, 2020-2027(USD MILLION) 37
      19. FIGURE 11
      20. GLOBAL SUBSTRATES/SEMICONDUCTORS MARKET FOR LED MATERIALS MARKET, BY TYPE, 2018–2024,
      21. (USD MILLION) 40
      22. FIGURE 12 GLOBAL LED MATERIALS MARKET SHARE, BY APPLICATION,
      23. 2020-2027(USD MILLION) 47
      24. FIGURE 13 GLOBAL GENERAL LIGHTING MARKET VALUE,
      25. BY APPLICATION, (2018–2024) (USD MILLION) 48
      26. FIGURE 14 GLOBAL CONSUMER
      27. ELECTRONICS MARKET FOR LED MATERIALS MARKET, BY REGION, 2020-2027(USD MILLION) 51
      28. FIGURE
      29. 15 GLOBAL LED MATERIALS MARKET SHARE, BY REGION, 2020 (%) 60
      30. FIGURE 16
      31. NORTH AMERICA: LED MATERIALS MARKET SHARE, BY COUNTRY, 2020 (%) 62
      32. FIGURE
      33. 17 NORTH AMERICA: LED MATERIALS MARKET, BY TYPE, 2020-2027(USD MILLION) 63
      34. FIGURE
      35. 18 NORTH AMERICA: LED MATERIALS MARKET, BY APPLICATION, 2020-2027(USD MILLION) 64
      36. FIGURE
      37. 19 EUROPE: LED MATERIALS MARKET SHARE, BY COUNTRY, 2020 (%) 67
      38. FIGURE
      39. 20 EUROPE: LED MATERIALS MARKET, BY TYPE, 2020-2027(USD MILLION) 68
      40. FIGURE
      41. 21 EUROPE: LED MATERIALS MARKET, BY APPLICATION, 2020-2027(USD MILLION) 69
      42. FIGURE
      43. 22 ASIA-PACIFIC: LED MATERIALS MARKET, BY TYPE, 2020-2027(USD MILLION) 79
      44. FIGURE
      45. 23 ASIA-PACIFIC: LED MATERIALS MARKET, BY APPLICATION, 2020-2027(USD MILLION) 80
      46. FIGURE
      47. 24 LATIN AMERICA: LED MATERIALS MARKET, BY TYPE, 2020-2027(USD MILLION) 89
      48. FIGURE
      49. 25 LATIN AMERICA: LED MATERIALS MARKET, BY APPLICATION, 2020-2027(USD MILLION) 90
      50. FIGURE
      51. 26 MIDDLE EAST & AFRICA: LED MATERIALS MARKET SHARE, BY COUNTRY, 2020 (%) 95
      52. FIGURE
      53. 27 MIDDLE EAST & AFRICA: LED MATERIALS MARKET, BY TYPE, 2020-2027(USD MILLION)
      54. 96
      55. FIGURE 28 MIDDLE EAST & AFRICA: LED MATERIALS MARKET, BY APPLICATION,
      56. 2020-2027(USD MILLION) 97
      57.  

    LED Materials Market Segmentation

    Market Segmentation Overview

    • Detailed segmentation data will be available in the full report
    • Comprehensive analysis by multiple parameters
    • Regional and country-level breakdowns
    • Market size forecasts by segment
    Infographic

    Free Sample Request

    Kindly complete the form below to receive a free sample of this Report

    Get Free Sample

    Customer Strories

    “I am very pleased with how market segments have been defined in a relevant way for my purposes (such as "Portable Freezers & refrigerators" and "last-mile"). In general the report is well structured. Thanks very much for your efforts.”

    Victoria Milne

    Founder
    Case Study
    Chemicals and Materials