• Cat-intel
  • MedIntelliX
  • Resources
  • About Us
  • Hero Background
    English
    Chinese
    French
    Japanese
    Korean
    German
    Spanish

    Federal Edge Computing Market Trends

    ID: MRFR/ICT/10608-HCR
    128 Pages
    Shubham Munde
    October 2025

    Federal Edge Computing Market Research Report: Information By Component (Hardware, Software, and Services), By Application (Smart Cities, Industrial Internet of Things (IoT), Remote Monitoring, Content Delivery, Augmented Reality (AR), Virtual Reality (VR), and Others), By Organization Size (Large Enterprises and SMEs), and By Region (North America, Europe, Asia-Pacific, and Rest Of The World) ...

    Share:
    Download PDF ×

    We do not share your information with anyone. However, we may send you emails based on your report interest from time to time. You may contact us at any time to opt-out.

    Federal Edge Computing Market Infographic
    $ 4,950.0
    $ 5,950.0
    $ 7,250.0

    Market Trends

    Key Emerging Trends in the Federal Edge Computing Market

    As many companies struggle to establish or increase their share in the ever-changing landscape of the Federal Edge Computing Market, they adopt various strategies. One common approach involves technological innovation whereby organizations try to create and provide advanced-edge computing products that are tailor-made for various requirements by different federal institutions with enhanced properties on security needs, thereby enabling them to compete favorably within this market niche. Some firms take up a cost leadership strategy where they aim to provide low-cost edge computing solutions compared to competition levels. However, collaboration and strategic partnership are seen as important aspects to consider when positioning a company or a product within any given marketplace. In terms of geographical expansion, there are different ways for companies to operate in the Federal Edge Computing Market. Going beyond into new regions or countries helps penetrate untapped markets, gain a wider range of federal clients, and reduce reliance on agencies. Besides government priorities, market share positioning is also concerned with adherence to strict cybersecurity standards as well as environmental responsibility. In the case of companies that follow strict guidelines for handling data securely, comply with federal regulations, and use energy-efficient edge computing solutions, they become more attractive to security-focused and eco-friendly federal customers. This not only makes companies trusted partners but also changes customer perception towards them regarding the Federal Edge Computing Market.

    Market Summary

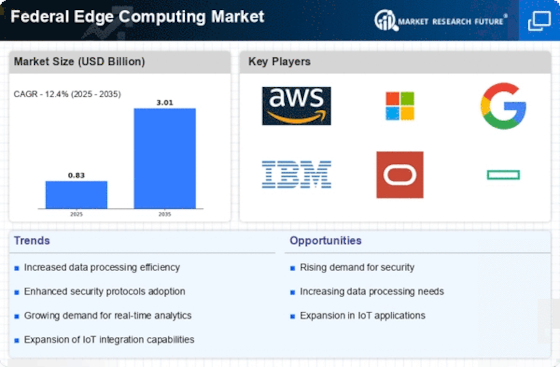
    As per Market Research Future Analysis, the Federal Edge Computing market is projected to grow from USD 0.6579 Billion in 2022 to USD 1.9 Billion by 2032, with a CAGR of 12.4% during the forecast period. Key drivers include increasing data generation at the edge, security concerns, and the need for localized computing. The U.S. federal government is well-positioned to leverage these technologies for various applications, including IoT and smart cities. However, edge computing also introduces new security vulnerabilities that need to be addressed as traditional IT security paradigms become less effective.

    Key Market Trends & Highlights

    The Federal Edge Computing market is experiencing significant growth driven by technological advancements and increasing data demands.

    • Market size in 2022: USD 0.6579 Billion; projected to reach USD 1.9 Billion by 2032.
    • CAGR of 12.4% from 2022 to 2032.
    • 90% of federal officials consider edge solutions crucial for agency objectives.
    • North America held 45.80% market share in 2022.

    Market Size & Forecast

    2022 Market Size USD 0.6579 Billion
    2032 Market Size USD 1.9 Billion
    CAGR 12.4%
    Largest Regional Market Share in 2022 North America.

    Major Players

    Key players include Cisco, AWS, Dell Technologies, Google, HPE, Huawei, IBM, Intel, Microsoft, and others.

    Market Trends

    Increasing quantity of data being created and consumed at the edge is driving the market growth

    The growing amount of data generated and consumed at the edge is a major growth driver. IDC predicts that from now until 2025, data generation at the edge will increase 33% (CAGR), making up 22% of all digital data generated, recorded, and copied globally. Edge computing, which was once primarily thought of as a network accelerator for field-based sensors, is quickly becoming recognized as an intelligent orchestrator of more intricate processes and applications that operate outside of the conventional perimeter.

    The U.S. federal government is particularly well-positioned to profit from these developing technologies given the requirement to carry out a highly spread job, whether it be patrolling the battlefield, guarding our borders, or improving transportation networks and monitoring the environment.

    Federal IT leaders should actively analyze how their architectures and networks can support and benefit from edge computing if they want to take advantage of this opportunity. Additionally, program managers should think about how field-enhanced data from Internet of Things (IoT) devices like cameras and sensors may support smarter, more autonomous operations. According to Accenture study, federal officials already have high expectations, with more than 90% stating that edge solutions are very or extremely crucial to fulfilling the objectives of their agency.

    Smaller, localized data processing and storage do provide new security vulnerabilities. Because they are deployed far from a central data center or infrastructure, edge devices are more difficult to secure both physically and digitally. Companies and government organizations can now hide their data and activities behind a variety of physical and virtual security protections thanks to the concentration of computers in corporate data centers and hyper-scale clouds. Users are being forced to reconsider security by edge computing.

    When it comes to the edge, traditional IT security paradigms are becoming increasingly unworkable; one typical risk is for cybercriminals to intercept data as it is being transferred from devices to the edge server through its many open endpoints. Another danger is that devices or the edge server itself could be infected with malicious malware.

    The further advancement of 5G networks and its benefits are anticipated to have a significant positive impact on edge computing. It is anticipated that the number of connected devices will increase dramatically when the 5G network is deployed. A considerable data burden is also predicted to be placed on physical data centers by connected devices and 5G networks, which will increase the demand for capacity and decrease latency. Due to all of these factors, the market is consequently anticipated to have promising development possibilities. Thus, driving the Federal Edge Computing market revenue.

    The increasing demand for real-time data processing and enhanced security measures is driving the adoption of edge computing solutions within federal agencies, as they seek to optimize operational efficiency and improve service delivery.

    U.S. Department of Defense

    Federal Edge Computing Market Market Drivers

    Market Growth Projections

    The Global Federal Edge Computing Market Industry is expected to exhibit robust growth, with projections indicating a rise from 0.75 USD Billion in 2024 to 2.7 USD Billion by 2035. This growth trajectory suggests a compound annual growth rate (CAGR) of 12.33% from 2025 to 2035. The increasing reliance on edge computing solutions by federal agencies reflects a broader trend towards decentralized data processing, which enhances operational efficiency and responsiveness. As agencies continue to adopt edge computing technologies, the market is likely to evolve, driven by the need for real-time data processing, enhanced security, and support for emerging technologies.

    Support for Emerging Technologies

    The Global Federal Edge Computing Market Industry is poised for growth due to its support for emerging technologies such as artificial intelligence (AI) and machine learning (ML). These technologies require substantial computational power and low latency, both of which are facilitated by edge computing. Federal agencies are increasingly integrating AI and ML into their operations to enhance predictive analytics and automate processes. For example, the National Aeronautics and Space Administration (NASA) employs edge computing to process data from satellites in real-time. This integration is likely to drive market growth, with projections indicating a rise to 0.75 USD Billion in 2024.

    Cost Efficiency and Resource Optimization

    Cost efficiency and resource optimization serve as pivotal drivers in the Global Federal Edge Computing Market Industry. Federal agencies are increasingly tasked with maximizing their budgets while improving service delivery. Edge computing solutions can reduce bandwidth costs and minimize the need for extensive data transmission to centralized cloud servers. By processing data at the edge, agencies can optimize their resources and allocate funds more effectively. This approach not only enhances operational efficiency but also aligns with federal mandates for fiscal responsibility. As agencies recognize these benefits, the market is poised for substantial growth, potentially reaching 2.7 USD Billion by 2035.

    Advancements in IoT and Sensor Technologies

    The Global Federal Edge Computing Market Industry is significantly influenced by advancements in Internet of Things (IoT) and sensor technologies. These innovations enable federal agencies to collect and analyze vast amounts of data from various sources, such as environmental sensors and surveillance systems. By leveraging edge computing, agencies can process this data locally, leading to faster insights and improved operational efficiency. For instance, the Department of Homeland Security utilizes edge computing to enhance border security through real-time data analysis. This trend is expected to contribute to a compound annual growth rate (CAGR) of 12.33% from 2025 to 2035, underscoring the growing importance of IoT in federal operations.

    Enhanced Security and Compliance Requirements

    In the Global Federal Edge Computing Market Industry, heightened security and compliance requirements drive the adoption of edge computing solutions. Federal agencies are mandated to adhere to stringent regulations regarding data protection and privacy. Edge computing offers a decentralized approach, which can potentially mitigate risks associated with centralized data storage. For example, the Federal Risk and Authorization Management Program (FedRAMP) emphasizes the need for secure cloud services, which aligns with edge computing's capabilities. As agencies seek to enhance their security posture, the market is expected to grow significantly, with projections indicating a rise to 2.7 USD Billion by 2035.

    Increased Demand for Real-Time Data Processing

    The Global Federal Edge Computing Market Industry experiences a notable surge in demand for real-time data processing capabilities. As federal agencies increasingly rely on timely data for decision-making, the need for edge computing solutions becomes paramount. This shift allows for data to be processed closer to its source, reducing latency and enhancing operational efficiency. For instance, the Department of Defense is exploring edge computing to improve battlefield communications and situational awareness. The market is projected to reach 0.75 USD Billion in 2024, reflecting a growing recognition of the value of immediate data insights in federal operations.

    Market Segment Insights

    Federal Edge Computing Component Insights

    The Federal Edge Computing Market segmentation, based on component, includes hardware, software, and services. Hardware segment dominated the global market in 2022. Around the world, hardware edge providers are boosting their efforts in edge computing. For instance, HPE invested over USD 4 billion over four years and is improving edgeline converged edge systems, an edge computing device that was already released. Such edge services are anticipated to see an increase in demand in the upcoming years.

    Strategic investments are being made by businesses like Intel Corporation and Dell Technologies Inc. to create and improve edge intelligence solutions for commercial and industrial use. The demand for these technologies and the services that go along with them is anticipated to increase as a result of these expenditures.

    Federal Edge Computing Application Insights

    The Federal Edge Computing Market segmentation, based on application, includes smart cities, industrial internet of things (IoT), remote monitoring, content delivery, augmented reality (AR), virtual reality (VR), and others. Industrial internet of things (IoT) segment dominated the Federal Edge Computing Market in 2022. This is as a result of their wide applications. Omdia claims that despite economic uncertainty, investments and developments in global loT projects are always rising. By using edge computing-enabled technologies like loT and 5G networks, smart cities can operate efficiently. The need for edge solutions in smart cities has increased as a result.

    Federal Edge Computing Organization Size Insights

    The Federal Edge Computing Market segmentation, based on organization size, includes large enterprises and SMEs. Large enterprises segment dominated the Federal Edge Computing Market in 2022. Large businesses worldwide are growing as a result of the data influx from internet of things (IoT) devices, including intelligent cars, machinery, and other objects.

    Figure 1: Federal Edge Computing Market, by Organization Size, 2022 & 2032 (USD Billion)

    Source: Secondary Research, Primary Research, MRFR Database and Analyst Review

    Get more detailed insights about Federal Edge Computing Market Research Report – Forecast till 2032

    Regional Insights

    By region, the study provides the market insights into North America, Europe, Asia-Pacific and Rest of the World. The North America Federal Edge Computing Market dominated this market in 2022 (45.80%). The three main cloud service providers, Microsoft Azure, Web Services, and Google Cloud, are all based in North America. All significant technology advancements, including 5G, autonomous driving, blockchain, gaming, and artificial intelligence, are also thought to have originated in this area. This region of the world has a reputation for being among the first to use newly created technologies.

    Many new technologies being developed nowadays rely largely on data.Further, the U.S. Federal Edge Computing market held the largest market share, and the Canada Federal Edge Computing market was the fastest growing market in the North America region.

    Further, the major countries studied in the market report are The US, Canada, German, France, the UK, Italy, Spain, China, Japan, India, Australia, South Korea, and Brazil.

    Figure 2: FEDERAL EDGE COMPUTING MARKET SHARE BY REGION 2022 (USD Billion)

    FEDERAL EDGE COMPUTING MARKET SHARE BY REGION 2022

    Source: Secondary Research, Primary Research, MRFR Database and Analyst Review

    Europe Federal Edge Computing market accounted for the healthy market share in 2022. The testing phase of 5G technology is presently underway in a number of European nations, including the United Kingdom. For instance, Vodafone is conducting tests in cities like Glasgow, Birmingham, Liverpool, Bristol, Cardiff, London, and Manchester as part of its 5G experiment at the MediaCity UK technology hub. Further, the German Federal Edge Computing market held the largest market share, and the U.K Federal Edge Computing market was the fastest growing market in the European region.

    The Asia Pacific Federal Edge Computing market is expected to register significant growth from 2023 to 2032. In terms of 5G and the edge, China has made good progress; a surveillance culture might determine how technology develops. The worldwide digital economy has been shaped by Western businesses that have established norms for the use of personal data to target advertisements, like Meta, Apple, Netflix, and Google. Chinese businesses like Alibaba, Baidu, Huawei, and ZTE are influencing the route that edge computing-based surveillance technology will take in the future.

    China has the biggest share in the area since these activities there meet the demand. 90% of mobile ecosystem players in China, according to a GSMA survey, see edge computing as a key revenue prospect in the 5G era. The nation's edge computing deployments are made to satisfy the needs of smart ports, campuses, and factories. Edge computing use cases including athletic events, gaming, and autonomous driving will be feasible as the 5G networks expand over the coming years.

    Moreover, China’s Federal Edge Computing market held the largest market share, and the Indian Federal Edge Computing market was the fastest growing market in the Asia-Pacific region.

    Key Players and Competitive Insights

    Leading market players are investing heavily in research and development in order to expand their product lines, which will help the Federal Edge Computing market, grow even more. Market participants are also undertaking a variety of strategic activities to expand their global footprint, with important market developments including new product launches, contractual agreements, mergers and acquisitions, higher investments, and collaboration with other organizations. To expand and survive in a more competitive and rising market climate, Federal Edge Computing Industry must offer cost-effective items.

    Manufacturing locally to minimize operational costs is one of the key business tactics used by manufacturers in the global Federal Edge Computing Industry to benefit clients and increase the market Application. In recent years, the Federal Edge Computing Industry has offered some of the most significant advantages to medicine.

    Major players in the Federal Edge Computing market, including Cisco, AWS, Dell Technologies, Google, HPE, Huawei, IBM, Intel, Litmus Automation, Microsoft, Nokia, ADLINK, Axellio, Capgemini, ClearBlade, Digi International, Fastly, StackPath, Vapor IO, GE Digital, Moxa, Sierra Wireless, Juniper Networks, EdgeConnex, Belden, Saguna Networks, Edge Intelligence, Edgeworx, Sunlight.io, Mutable, Hivecell, Section, and EdgeIQ, are attempting to increase market demand by investing in research and development operations.

    Intelligent solution and cloud-based service provider Hewlett Packard Enterprise Co (HPE). The company's product line includes software, converged systems, servers, storage devices, networking goods, cloud service-based products, and bespoke financial solutions. Additionally, it offers services for IT consulting, IT support, instruction, and training.

    Information and communication technology (ICT) infrastructure and smart gadgets are provided by Huawei Technologies Co Ltd (Huawei), a division of Huawei Investment & Holding Co Ltd. In addition to laptops, tablets, routers, wearable technology, headphones, enterprise wireless goods, enterprise optical transmission and access devices, networking equipment, cloud computing products, and more are all part of the company's product line.

    Key Companies in the Federal Edge Computing Market market include

    Industry Developments

    In May 2024, IBM unveiled the addition of IBM® Power® S1012 to its range of servers. This system, powered by the Power10 CPU and featuring one socket and a half-width design, provides up to three times greater performance per core compared to the Power S812. The product is offered in a 2U rack-mounted or tower deskside design and is specifically designed for edge-level computing. It also provides the most affordable option in the Power portfolio for running essential tasks for small and medium-sized enterprises.

    IBM Power S1012 enables clients to execute AI inferencing workloads in remote office and back office (ROBO) sites, which are situated outside of conventional datacenter facilities. It also allows for direct connectivity to cloud services like IBM® Power® Virtual Server for backup and disaster recovery purposes.

    February 2024: Gcore, a global provider of cloud, AI, and edge solutions, has announced the introduction of FastEdge, an advanced serverless offering that is transforming the way applications are deployed and enhancing performance. FastEdge is a cloud-native development platform that offers a high-performance and low-latency solution for generating responsive and personalized apps. It eliminates the need for server management, making it easier to use. FastEdge utilizes Gcore's extensive knowledge in cloud technology, artificial intelligence, and security to provide serverless edge execution.

    The service allows developers to globally deploy decentralized applications without the requirement for server configuration or infrastructure upkeep. This innovation is based on Gcore's resilient content delivery network (CDN), which disperses customized code across more than 160 edge nodes globally. This guarantees a very instantaneous reaction to user actions, resulting in outstanding app responsiveness.

    Future Outlook

    Federal Edge Computing Market Future Outlook

    The Federal Edge Computing Market is projected to grow at a 12.33% CAGR from 2024 to 2035, driven by increased demand for real-time data processing and enhanced security measures.

    New opportunities lie in:

    • Develop tailored edge solutions for defense applications to enhance operational efficiency.
    • Invest in partnerships with cloud service providers to expand service offerings.
    • Leverage AI and machine learning to optimize edge computing capabilities for federal agencies.

    By 2035, the Federal Edge Computing Market is expected to be a robust sector, reflecting substantial growth and innovation.

    Market Segmentation

    Federal Edge Computing Regional Outlook

    • US
    • Canada

    Federal Edge Computing Component Outlook

    • Hardware
    • Software
    • Services

    Federal Edge Computing Application Outlook

    • Smart Cities
    • Industrial Internet of Things (IoT)
    • Remote Monitoring
    • Content Delivery
    • Augmented Reality (AR) and Virtual Reality (VR)
    • Others (Autonomous Vehicles, Drones, And Gaming)

    Federal Edge Computing Organization Size Outlook

    • Large Enterprises
    • SMEs

    Report Scope

    Report Attribute/Metric Details
    Market Size 2022 USD 0.65789 Billion
    Market Size 2032 USD 1.9 Billion
    Compound Annual Growth Rate (CAGR) 12.4% (2022-2032)
    Base Year 2021
    Market Forecast Period 2022-2032
    Historical Data 2018- 2021
    Market Forecast Units Value (USD Billion)
    Report Coverage Revenue Forecast, Market Competitive Landscape, Growth Factors, and Trends
    Segments Covered Component, Application, Organization Size, Vertical, and Region
    Geographies Covered North America, Europe, Asia Pacific, and the Rest of the World
    Countries Covered The U.S., Canada, German, France, U.K, Italy, Spain, China, Japan, India, Australia, South Korea, and Brazil
    Key Companies Profiled Cisco, AWS, Dell Technologies, Google, HPE, Huawei, IBM, Intel, Litmus Automation, Microsoft, Nokia, ADLINK, Axellio, Capgemini, ClearBlade, Digi International, Fastly, StackPath, Vapor IO, GE Digital, Moxa, Sierra Wireless, Juniper Networks, EdgeConnex, Belden, Saguna Networks, Edge Intelligence, Edgeworx, Sunlight.io, Mutable, Hivecell, Section, and EdgeIQ
    Key Market Opportunities Implications of edge computing for the future of federal office work
    Key Market Dynamics The increasing quantity of data being created and consumed at the edge, making computing more localized, and security implications of edge computing

    Market Highlights

    Author

    Shubham Munde
    Research Analyst Level II

    She holds an experience of about 6+ years in market research and business consulting, working under the spectrum of information communication technology, telecommunications and semiconductor domains. aarti conceptualizes and implements a scalable business strategy and provides strategic leadership to the clients. her expertise lies in market estimation, competitive intelligence, pipeline analysis, customer assessment, etc.

    Leave a Comment

    Latest Comments

    John Doe
    john@example.com

    This is a great article! Really helped me understand the topic better.

    Posted on July 23, 2025, 10:15 AM
    Jane Smith
    jane@domain.com

    Thanks for sharing this. I’ve bookmarked it for later reference.

    Posted on July 22, 2025, 7:45 PM

    FAQs

    How much is the Federal Edge Computing market?

    The Federal Edge Computing Market size was valued at USD 0.65789999 Billion in 2022.

    What is the growth rate of the Federal Edge Computing market?

    The global market is projected to grow at a CAGR of 12.4% during the forecast period, 2022-2032.

    Which region held the largest market share in the Federal Edge Computing market?

    North America had the largest share in the global market

    Who are the key players in the Federal Edge Computing market?

    The key players in the market are Cisco, AWS, Dell Technologies, Google, HPE, Huawei, IBM, Intel, Litmus Automation, Microsoft, Nokia, ADLINK, Axellio, Capgemini, ClearBlade, Digi International, Fastly, StackPath, Vapor IO, GE Digital, Moxa, Sierra Wireless, Juniper Networks, EdgeConnex, Belden, Saguna Networks, Edge Intelligence, Edgeworx, Sunlight.io, Mutable, Hivecell, Section, and EdgeIQ

    Which Component led the Federal Edge Computing market?

    The Hardware Component dominated the market in 2022.

    Which Application had the largest market share in the Federal Edge Computing market?

    The Industrial Internet of Things (IoT) Application had the largest share in the global market.

    1. . EXECUTIVE SUMMARY
    2. . MARKET INTRODUCTION
    3. . Definition
    4. . Scope of the Study
    5. . Research Objective
    6. . Assumptions
    7. . Limitations
    8. . RESEARCH METHODOLOGY
    9. . Overview
    10. . Data Mining
    11. . Secondary Research
    12. . Primary Research
    13. . Primary Interviews and Information Gathering Process
    14. . Breakdown of Primary Respondents
    15. . Forecasting Modality
    16. . Market Size Estimation
    17. . Bottom-Up Approach
    18. . Top-Down Approach
    19. . Data Triangulation
    20. . Validation
    21. . MARKET DYNAMICS
    22. . Overview
    23. . Drivers
    24. . Restraints
    25. . Opportunities
    26. . MARKET FACTOR ANALYSIS
    27. . Value Chain Analysis
    28. . Porter’s Five Forces Analysis
    29. . Bargaining Power of Suppliers
    30. . Bargaining Power of Buyers
    31. . Threat of New Entrants
    32. . Threat of Substitutes
    33. . Intensity of Rivalry
    34. . COVID-19 Impact Analysis
    35. . Market Impact Analysis
    36. . Regional Impact
    37. . Opportunity and Threat Analysis
    38. . GLOBAL RETAIL EDGE COMPUTING MARKET, BY COMPONENT
    39. . Overview
    40. . Hardware
    41. . Software
    42. . Services
    43. . GLOBAL RETAIL EDGE COMPUTING MARKET, BY ORGANIZATION SIZE
    44. . Overview
    45. . Smart Cities
    46. . Industrial Internet of Things (IIoT)
    47. . Remote Monitoring
    48. . Content Delivery
    49. . Augmented Reality (AR)
    50. . Virtual Reality (VR)
    51. . Others
    52. . GLOBAL RETAIL EDGE COMPUTING MARKET, BY ORGANIZATION SIZE
    53. . Overview
    54. . Large Enterprises
    55. . SMEs
    56. . GLOBAL RETAIL EDGE COMPUTING MARKET, BY REGION
    57. . Overview
    58. . North America
    59. . U.S.
    60. . Canada
    61. . Europe
    62. . Germany
    63. . France
    64. . U.K
    65. . Italy
    66. . Spain
    67. . Rest of Europe
    68. . Asia-Pacific
    69. . China
    70. . India
    71. . Japan
    72. . South Korea
    73. . Australia
    74. . Rest of Asia-Pacific
    75. . Rest of the World
    76. . Middle East
    77. . Africa
    78. . Latin America
    79. . COMPETITIVE LANDSCAPE
    80. . Overview
    81. . Competitive Analysis
    82. . Market Share Analysis
    83. . Major Growth Strategy in the Global Retail Edge Computing Market,
    84. . Competitive Benchmarking
    85. . Leading Players in Terms of Number of Developments in the Global Retail Edge Computing Market,
    86. . Key developments and Growth Strategies
    87. . New Product Launch/Application Organization Size
    88. . Merger & Acquisitions
    89. . Joint Ventures
    90. . Major Players Financial Matrix
    91. . Sales & Operating Income, 2022
    92. . Major Players R&D Expenditure. 2022
    93. . COMPANY PROFILES
    94. . Cisco
    95. . Company Overview
    96. . Financial Overview
    97. . Product Offered
    98. . Key Developments
    99. . SWOT Analysis
    100. . Key Strategies
    101. . AWS
    102. . Company Overview
    103. . Financial Overview
    104. . Product Offered
    105. . Key Developments
    106. . SWOT Analysis
    107. . Key Strategies
    108. . Dell Technologies
    109. . Company Overview
    110. . Financial Overview
    111. . Product Offered
    112. . Key Developments
    113. . SWOT Analysis
    114. . Key Strategies
    115. . Google
    116. . Company Overview
    117. . Financial Overview
    118. . Product Offered
    119. . Key Developments
    120. . SWOT Analysis
    121. . Key Strategies
    122. . HPE
    123. . Company Overview
    124. . Financial Overview
    125. . Product Offered
    126. . Key Developments
    127. . SWOT Analysis
    128. . Key Strategies
    129. . Huawei
    130. . Company Overview
    131. . Financial Overview
    132. . Product Offered
    133. . Key Developments
    134. . SWOT Analysis
    135. . Key Strategies
    136. . IBM
    137. . Company Overview
    138. . Financial Overview
    139. . Product Offered
    140. . Key Developments
    141. . SWOT Analysis
    142. . Key Strategies
    143. . Intel
    144. . Company Overview
    145. . Financial Overview
    146. . Product Offered
    147. . Key Developments
    148. . SWOT Analysis
    149. . Key Strategies
    150. . Litmus Automation
    151. . Company Overview
    152. . Financial Overview
    153. . Product Offered
    154. . Key Developments
    155. . SWOT Analysis
    156. . Key Strategies
    157. . Microsoft
    158. . Company Overview
    159. . Financial Overview
    160. . Product Offered
    161. . Key Developments
    162. . SWOT Analysis
    163. . Key Strategies
    164. . Nokia
    165. . Company Overview
    166. . Financial Overview
    167. . Product Offered
    168. . Key Developments
    169. . SWOT Analysis
    170. . Key Strategies
    171. . ADLINK
    172. . Company Overview
    173. . Financial Overview
    174. . Product Offered
    175. . Key Developments
    176. . SWOT Analysis
    177. . Key Strategies
    178. . Axellio
    179. . Company Overview
    180. . Financial Overview
    181. . Product Offered
    182. . Key Developments
    183. . SWOT Analysis
    184. . Key Strategies
    185. . Capgemini
    186. . Company Overview
    187. . Financial Overview
    188. . Product Offered
    189. . Key Developments
    190. . SWOT Analysis
    191. . Key Strategies
    192. . ClearBlade
    193. . Company Overview
    194. . Financial Overview
    195. . Product Offered
    196. . Key Developments
    197. . SWOT Analysis
    198. . Key Strategies
    199. . Digi International
    200. . Company Overview
    201. . Financial Overview
    202. . Product Offered
    203. . Key Developments
    204. . SWOT Analysis
    205. . Key Strategies
    206. . Fastly
    207. . Company Overview
    208. . Financial Overview
    209. . Product Offered
    210. . Key Developments
    211. . SWOT Analysis
    212. . Key Strategies
    213. . StackPath
    214. . Company Overview
    215. . Financial Overview
    216. . Product Offered
    217. . Key Developments
    218. . SWOT Analysis
    219. . Key Strategies
    220. . Vapor IO
    221. . Company Overview
    222. . Financial Overview
    223. . Product Offered
    224. . Key Developments
    225. . SWOT Analysis
    226. . Key Strategies
    227. . GE Digital
    228. . Company Overview
    229. . Financial Overview
    230. . Product Offered
    231. . Key Developments
    232. . SWOT Analysis
    233. . Key Strategies
    234. . Moxa
    235. . Company Overview
    236. . Financial Overview
    237. . Product Offered
    238. . Key Developments
    239. . SWOT Analysis
    240. . Key Strategies
    241. . Sierra Wireless
    242. . Company Overview
    243. . Financial Overview
    244. . Product Offered
    245. . Key Developments
    246. . SWOT Analysis
    247. . Key Strategies
    248. . Juniper Networks
    249. . Company Overview
    250. . Financial Overview
    251. . Product Offered
    252. . Key Developments
    253. . SWOT Analysis
    254. . Key Strategies
    255. . EdgeConnex
    256. . Company Overview
    257. . Financial Overview
    258. . Product Offered
    259. . Key Developments
    260. . SWOT Analysis
    261. . Key Strategies
    262. . Belden
    263. . Company Overview
    264. . Financial Overview
    265. . Product Offered
    266. . Key Developments
    267. . SWOT Analysis
    268. . Key Strategies
    269. . Saguna Networks
    270. . Company Overview
    271. . Financial Overview
    272. . Product Offered
    273. . Key Developments
    274. . SWOT Analysis
    275. . Key Strategies
    276. . Edge Intelligence
    277. . Company Overview
    278. . Financial Overview
    279. . Product Offered
    280. . Key Developments
    281. . SWOT Analysis
    282. . Key Strategies
    283. . Edgeworx
    284. . Company Overview
    285. . Financial Overview
    286. . Product Offered
    287. . Key Developments
    288. . SWOT Analysis
    289. . Key Strategies
    290. . Sunlight.io
    291. . Company Overview
    292. . Financial Overview
    293. . Product Offered
    294. . Key Developments
    295. . SWOT Analysis
    296. . Key Strategies
    297. . Mutable
    298. . Company Overview
    299. . Financial Overview
    300. . Product Offered
    301. . Key Developments
    302. . SWOT Analysis
    303. . Key Strategies
    304. . Hivecell
    305. . Company Overview
    306. . Financial Overview
    307. . Product Offered
    308. . Key Developments
    309. . SWOT Analysis
    310. . Key Strategies
    311. . Section
    312. . Company Overview
    313. . Financial Overview
    314. . Product Offered
    315. . Key Developments
    316. . SWOT Analysis
    317. . Key Strategies
    318. . EdgeIQ
    319. . Company Overview
    320. . Financial Overview
    321. . Product Offered
    322. . Key Developments
    323. . SWOT Analysis
    324. . Key Strategies
    325. . APPENDIX
    326. . References
    327. . Related Reports   LIST OF TABLES TABLE 1 GLOBAL RETAIL EDGE COMPUTING MARKET, SYNOPSIS, 2018-2032 TABLE 2 GLOBAL RETAIL EDGE COMPUTING MARKET, ESTIMATES & FORECAST, 2018-2032 (USD BILLION) TABLE 3 GLOBAL RETAIL EDGE COMPUTING MARKET, BY COMPONENT, 2018-2032 (USD BILLION) TABLE 4 GLOBAL RETAIL EDGE COMPUTING MARKET, BY APPLICATION, 2018-2032 (USD BILLION) TABLE 5 GLOBAL RETAIL EDGE COMPUTING MARKET, BY ORGANIZATION SIZE, 2018-2032 (USD BILLION) TABLE 6 NORTH AMERICA RETAIL EDGE COMPUTING MARKET, BY COMPONENT, 2018-2032 (USD BILLION) TABLE 7 NORTH AMERICA RETAIL EDGE COMPUTING MARKET, BY APPLICATION, 2018-2032 (USD BILLION) TABLE 8 NORTH AMERICA RETAIL EDGE COMPUTING MARKET, BY ORGANIZATION SIZE, 2018-2032 (USD BILLION) TABLE 9 NORTH AMERICA RETAIL EDGE COMPUTING MARKET, BY COUNTRY, 2018-2032 (USD BILLION) TABLE 10 U.S. RETAIL EDGE COMPUTING MARKET, BY COMPONENT, 2018-2032 (USD BILLION) TABLE 11 U.S. RETAIL EDGE COMPUTING MARKET, BY APPLICATION, 2018-2032 (USD BILLION) TABLE 12 U.S. RETAIL EDGE COMPUTING MARKET, BY ORGANIZATION SIZE, 2018-2032 (USD BILLION) TABLE 13 CANADA RETAIL EDGE COMPUTING MARKET, BY COMPONENT, 2018-2032 (USD BILLION) TABLE 14 CANADA RETAIL EDGE COMPUTING MARKET, BY APPLICATION, 2018-2032 (USD BILLION) TABLE 15 CANADA RETAIL EDGE COMPUTING MARKET, BY ORGANIZATION SIZE, 2018-2032 (USD BILLION) TABLE 16 EUROPE RETAIL EDGE COMPUTING MARKET, BY COMPONENT, 2018-2032 (USD BILLION) TABLE 17 EUROPE RETAIL EDGE COMPUTING MARKET, BY APPLICATION, 2018-2032 (USD BILLION) TABLE 18 EUROPE RETAIL EDGE COMPUTING MARKET, BY ORGANIZATION SIZE, 2018-2032 (USD BILLION) TABLE 19 EUROPE RETAIL EDGE COMPUTING MARKET, BY COUNTRY, 2018-2032 (USD BILLION) TABLE 20 GERMANY RETAIL EDGE COMPUTING MARKET, BY COMPONENT, 2018-2032 (USD BILLION) TABLE 21 GERMANY RETAIL EDGE COMPUTING MARKET, BY APPLICATION, 2018-2032 (USD BILLION) TABLE 22 GERMANY RETAIL EDGE COMPUTING MARKET, BY ORGANIZATION SIZE, 2018-2032 (USD BILLION) TABLE 23 FRANCE RETAIL EDGE COMPUTING MARKET, BY COMPONENT, 2018-2032 (USD BILLION) TABLE 24 FRANCE RETAIL EDGE COMPUTING MARKET, BY APPLICATION, 2018-2032 (USD BILLION) TABLE 25 FRANCE RETAIL EDGE COMPUTING MARKET, BY ORGANIZATION SIZE, 2018-2032 (USD BILLION) TABLE 26 ITALY RETAIL EDGE COMPUTING MARKET, BY COMPONENT, 2018-2032 (USD BILLION) TABLE 27 ITALY RETAIL EDGE COMPUTING MARKET, BY APPLICATION, 2018-2032 (USD BILLION) TABLE 28 ITALY RETAIL EDGE COMPUTING MARKET, BY ORGANIZATION SIZE, 2018-2032 (USD BILLION) TABLE 29 SPAIN RETAIL EDGE COMPUTING MARKET, BY COMPONENT, 2018-2032 (USD BILLION) TABLE 30 SPAIN RETAIL EDGE COMPUTING MARKET, BY APPLICATION, 2018-2032 (USD BILLION) TABLE 31 SPAIN RETAIL EDGE COMPUTING MARKET, BY ORGANIZATION SIZE, 2018-2032 (USD BILLION) TABLE 32 U.K RETAIL EDGE COMPUTING MARKET, BY COMPONENT, 2018-2032 (USD BILLION) TABLE 33 U.K RETAIL EDGE COMPUTING MARKET, BY APPLICATION, 2018-2032 (USD BILLION) TABLE 34 U.K RETAIL EDGE COMPUTING MARKET, BY ORGANIZATION SIZE, 2018-2032 (USD BILLION) TABLE 35 REST OF EUROPE RETAIL EDGE COMPUTING MARKET, BY COMPONENT, 2018-2032 (USD BILLION) TABLE 36 REST OF EUROPE RETAIL EDGE COMPUTING MARKET, BY APPLICATION, 2018-2032 (USD BILLION) TABLE 37 REST OF EUROPE RETAIL EDGE COMPUTING MARKET, BY ORGANIZATION SIZE, 2018-2032 (USD BILLION) TABLE 38 ASIA PACIFIC RETAIL EDGE COMPUTING MARKET, BY COMPONENT, 2018-2032 (USD BILLION) TABLE 39 ASIA PACIFIC RETAIL EDGE COMPUTING MARKET, BY APPLICATION, 2018-2032 (USD BILLION) TABLE 40 ASIA PACIFIC RETAIL EDGE COMPUTING MARKET, BY ORGANIZATION SIZE, 2018-2032 (USD BILLION) TABLE 41 ASIA PACIFIC RETAIL EDGE COMPUTING MARKET, BY COUNTRY, 2018-2032 (USD BILLION) TABLE 42 JAPAN RETAIL EDGE COMPUTING MARKET, BY COMPONENT, 2018-2032 (USD BILLION) TABLE 43 JAPAN RETAIL EDGE COMPUTING MARKET, BY APPLICATION, 2018-2032 (USD BILLION) TABLE 44 JAPAN RETAIL EDGE COMPUTING MARKET, BY ORGANIZATION SIZE, 2018-2032 (USD BILLION) TABLE 45 CHINA RETAIL EDGE COMPUTING MARKET, BY COMPONENT, 2018-2032 (USD BILLION) TABLE 46 CHINA RETAIL EDGE COMPUTING MARKET, BY APPLICATION, 2018-2032 (USD BILLION) TABLE 47 CHINA RETAIL EDGE COMPUTING MARKET, BY ORGANIZATION SIZE, 2018-2032 (USD BILLION) TABLE 48 INDIA RETAIL EDGE COMPUTING MARKET, BY COMPONENT, 2018-2032 (USD BILLION) TABLE 49 INDIA RETAIL EDGE COMPUTING MARKET, BY APPLICATION, 2018-2032 (USD BILLION) TABLE 50 INDIA RETAIL EDGE COMPUTING MARKET, BY ORGANIZATION SIZE, 2018-2032 (USD BILLION) TABLE 51 AUSTRALIA RETAIL EDGE COMPUTING MARKET, BY COMPONENT, 2018-2032 (USD BILLION) TABLE 52 AUSTRALIA RETAIL EDGE COMPUTING MARKET, BY APPLICATION, 2018-2032 (USD BILLION) TABLE 53 AUSTRALIA RETAIL EDGE COMPUTING MARKET, BY ORGANIZATION SIZE, 2018-2032 (USD BILLION) TABLE 54 SOUTH KOREA RETAIL EDGE COMPUTING MARKET, BY COMPONENT, 2018-2032 (USD BILLION) TABLE 55 SOUTH KOREA RETAIL EDGE COMPUTING MARKET, BY APPLICATION, 2018-2032 (USD BILLION) TABLE 56 SOUTH KOREA RETAIL EDGE COMPUTING MARKET, BY ORGANIZATION SIZE, 2018-2032 (USD BILLION) TABLE 57 REST OF ASIA-PACIFIC RETAIL EDGE COMPUTING MARKET, BY COMPONENT, 2018-2032 (USD BILLION) TABLE 58 REST OF ASIA-PACIFIC RETAIL EDGE COMPUTING MARKET, BY APPLICATION, 2018-2032 (USD BILLION) TABLE 59 REST OF ASIA-PACIFIC RETAIL EDGE COMPUTING MARKET, BY ORGANIZATION SIZE, 2018-2032 (USD BILLION) TABLE 60 REST OF WORLD RETAIL EDGE COMPUTING MARKET, BY COMPONENT, 2018-2032 (USD BILLION) TABLE 61 REST OF WORLD RETAIL EDGE COMPUTING MARKET, BY APPLICATION, 2018-2032 (USD BILLION) TABLE 62 REST OF WORLD RETAIL EDGE COMPUTING MARKET, BY ORGANIZATION SIZE, 2018-2032 (USD BILLION) TABLE 63 REST OF WORLD RETAIL EDGE COMPUTING MARKET, BY COUNTRY, 2018-2032 (USD BILLION) TABLE 64 MIDDLE EAST RETAIL EDGE COMPUTING MARKET, BY COMPONENT, 2018-2032 (USD BILLION) TABLE 65 MIDDLE EAST RETAIL EDGE COMPUTING MARKET, BY APPLICATION, 2018-2032 (USD BILLION) TABLE 66 MIDDLE EAST RETAIL EDGE COMPUTING MARKET, BY ORGANIZATION SIZE, 2018-2032 (USD BILLION) TABLE 67 AFRICA RETAIL EDGE COMPUTING MARKET, BY COMPONENT, 2018-2032 (USD BILLION) TABLE 68 AFRICA RETAIL EDGE COMPUTING MARKET, BY APPLICATION, 2018-2032 (USD BILLION) TABLE 69 AFRICA RETAIL EDGE COMPUTING MARKET, BY ORGANIZATION SIZE, 2018-2032 (USD BILLION) TABLE 70 LATIN AMERICA RETAIL EDGE COMPUTING MARKET, BY COMPONENT, 2018-2032 (USD BILLION) TABLE 71 LATIN AMERICA RETAIL EDGE COMPUTING MARKET, BY APPLICATION, 2018-2032 (USD BILLION) TABLE 72 LATIN AMERICA RETAIL EDGE COMPUTING MARKET, BY ORGANIZATION SIZE, 2018-2032 (USD BILLION)   LIST OF FIGURES FIGURE 1 RESEARCH PROCESS FIGURE 2 MARKET STRUCTURE FOR THE GLOBAL RETAIL EDGE COMPUTING MARKET FIGURE 3 MARKET DYNAMICS FOR THE GLOBAL RETAIL EDGE COMPUTING MARKET FIGURE 4 GLOBAL RETAIL EDGE COMPUTING MARKET, SHARE (%), BY COMPONENT, 2022 FIGURE 5 GLOBAL RETAIL EDGE COMPUTING MARKET, SHARE (%), BY APPLICATION, 2022 FIGURE 6 GLOBAL RETAIL EDGE COMPUTING MARKET, SHARE (%), BY ORGANIZATION SIZE, 2022 FIGURE 7 GLOBAL RETAIL EDGE COMPUTING MARKET, SHARE (%), BY REGION, 2022 FIGURE 8 NORTH AMERICA: RETAIL EDGE COMPUTING MARKET, SHARE (%), BY REGION, 2022 FIGURE 9 EUROPE: RETAIL EDGE COMPUTING MARKET, SHARE (%), BY REGION, 2022 FIGURE 10 ASIA-PACIFIC: RETAIL EDGE COMPUTING MARKET, SHARE (%), BY REGION, 2022 FIGURE 11 REST OF THE WORLD: RETAIL EDGE COMPUTING MARKET, SHARE (%), BY REGION, 2022 FIGURE 12 GLOBAL RETAIL EDGE COMPUTING MARKET: COMPANY SHARE ANALYSIS, 2022 (%) FIGURE 13 CISCO .: FINANCIAL OVERVIEW SNAPSHOT FIGURE 14 CISCO.: SWOT ANALYSIS FIGURE 15 AWS.: FINANCIAL OVERVIEW SNAPSHOT FIGURE 16 AWS: SWOT ANALYSIS FIGURE 17 DELL TECHNOLOGIES.: FINANCIAL OVERVIEW SNAPSHOT FIGURE 18 DELL TECHNOLOGIES: SWOT ANALYSIS FIGURE 19 GOOGLE.: FINANCIAL OVERVIEW SNAPSHOT FIGURE 20 GOOGLE: SWOT ANALYSIS FIGURE 21 HPE.: FINANCIAL OVERVIEW SNAPSHOT FIGURE 22 HPE: SWOT ANALYSIS FIGURE 23 HUAWEI.: FINANCIAL OVERVIEW SNAPSHOT FIGURE 24 HUAWEI: SWOT ANALYSIS FIGURE 25 IBM.: FINANCIAL OVERVIEW SNAPSHOT FIGURE 26 IBM: SWOT ANALYSIS FIGURE 27 INTEL.: FINANCIAL OVERVIEW SNAPSHOT FIGURE 28 INTEL: SWOT ANALYSIS FIGURE 29 LITMUS AUTOMATION.: FINANCIAL OVERVIEW SNAPSHOT FIGURE 30 LITMUS AUTOMATION: SWOT ANALYSIS FIGURE 31 MICROSOFT.: FINANCIAL OVERVIEW SNAPSHOT FIGURE 32 MICROSOFT: SWOT ANALYSIS FIGURE 33 NOKIA.: FINANCIAL OVERVIEW SNAPSHOT FIGURE 34 NOKIA: SWOT ANALYSIS FIGURE 35 ADLINK.: FINANCIAL OVERVIEW SNAPSHOT FIGURE 36 ADLINK: SWOT ANALYSIS FIGURE 37 AXELLIO.: FINANCIAL OVERVIEW SNAPSHOT FIGURE 38 AXELLIO: SWOT ANALYSIS FIGURE 39 CAPGEMINI.: FINANCIAL OVERVIEW SNAPSHOT FIGURE 40 CAPGEMINI: SWOT ANALYSIS FIGURE 41 CLEARBLADE.: FINANCIAL OVERVIEW SNAPSHOT FIGURE 42 CLEARBLADE: SWOT ANALYSIS FIGURE 43 DIGI INTERNATIONAL.: FINANCIAL OVERVIEW SNAPSHOT FIGURE 44 DIGI INTERNATIONAL: SWOT ANALYSIS FIGURE 45 FASTLY.: FINANCIAL OVERVIEW SNAPSHOT FIGURE 46 FASTLY: SWOT ANALYSIS FIGURE 47 STACKPATH.: FINANCIAL OVERVIEW SNAPSHOT FIGURE 48 STACKPATH: SWOT ANALYSIS FIGURE 49 VAPOR IO.: FINANCIAL OVERVIEW SNAPSHOT FIGURE 50 VAPOR IO: SWOT ANALYSIS FIGURE 51 GE DIGITAL.: FINANCIAL OVERVIEW SNAPSHOT FIGURE 52 GE DIGITAL: SWOT ANALYSIS FIGURE 53 MOXA.: FINANCIAL OVERVIEW SNAPSHOT FIGURE 54 MOXA: SWOT ANALYSIS FIGURE 55 SIERRA WIRELESS.: FINANCIAL OVERVIEW SNAPSHOT FIGURE 56 SIERRA WIRELESS: SWOT ANALYSIS FIGURE 57 JUNIPER NETWORKS.: FINANCIAL OVERVIEW SNAPSHOT FIGURE 58 JUNIPER NETWORKS: SWOT ANALYSIS FIGURE 59 EDGECONNEX.: FINANCIAL OVERVIEW SNAPSHOT FIGURE 60 EDGECONNEX: SWOT ANALYSIS FIGURE 61 BELDEN.: FINANCIAL OVERVIEW SNAPSHOT FIGURE 62 BELDEN: SWOT ANALYSIS FIGURE 63 SAGUNA NETWORKS.: FINANCIAL OVERVIEW SNAPSHOT FIGURE 64 SAGUNA NETWORKS: SWOT ANALYSIS FIGURE 65 EDGE INTELLIGENCE.: FINANCIAL OVERVIEW SNAPSHOT FIGURE 66 EDGE INTELLIGENCE: SWOT ANALYSIS FIGURE 67 EDGEIQ.: FINANCIAL OVERVIEW SNAPSHOT FIGURE 68 EDGEIQ: SWOT ANALYSIS FIGURE 69 EDGEWORX.: FINANCIAL OVERVIEW SNAPSHOT FIGURE 70 EDGEWORX: SWOT ANALYSIS FIGURE 71 HIVECELL.: FINANCIAL OVERVIEW SNAPSHOT FIGURE 72 HIVECELL: SWOT ANALYSIS FIGURE 73 MUTABLE.: FINANCIAL OVERVIEW SNAPSHOT FIGURE 74 MUTABLE: SWOT ANALYSIS FIGURE 75 SECTION.: FINANCIAL OVERVIEW SNAPSHOT FIGURE 76 SECTION: SWOT ANALYSIS FIGURE 77 SUNLIGHT.IO.: FINANCIAL OVERVIEW SNAPSHOT FIGURE 78 SUNLIGHT.IO: SWOT ANALYSIS
    328. List of Tables and Figures
      1. Table FIGURE 1 RESEARCH PROCESS FIGURE 2 MARKET STRUCTURE FOR THE GLOBAL RETAIL EDGE COMPUTING MARKET FIGURE 3 MARKET DYNAMICS FOR THE GLOBAL RETAIL EDGE COMPUTING MARKET FIGURE 4 GLOBAL RETAIL EDGE COMPUTING MARKET, SHARE (%), BY COMPONENT, 2022 FIGURE 5 GLOBAL RETAIL EDGE COMPUTING MARKET, SHARE (%), BY APPLICATION, 2022 FIGURE 6 GLOBAL RETAIL EDGE COMPUTING MARKET, SHARE (%), BY ORGANIZATION SIZE, 2022 FIGURE 7 GLOBAL RETAIL EDGE COMPUTING MARKET, SHARE (%), BY REGION, 2022 FIGURE 8 NORTH AMERICA: RETAIL EDGE COMPUTING MARKET, SHARE (%), BY REGION, 2022 FIGURE 9 EUROPE: RETAIL EDGE COMPUTING MARKET, SHARE (%), BY REGION, 2022 FIGURE 10 ASIA-PACIFIC: RETAIL EDGE COMPUTING MARKET, SHARE (%), BY REGION, 2022 FIGURE 11 REST OF THE WORLD: RETAIL EDGE COMPUTING MARKET, SHARE (%), BY REGION, 2022 FIGURE 12 GLOBAL RETAIL EDGE COMPUTING MARKET: COMPANY SHARE ANALYSIS, 2022 (%) FIGURE 13 CISCO .: FINANCIAL OVERVIEW SNAPSHOT FIGURE 14 CISCO.: SWOT ANALYSIS FIGURE 15 AWS.: FINANCIAL OVERVIEW SNAPSHOT FIGURE 16 AWS: SWOT ANALYSIS FIGURE 17 DELL TECHNOLOGIES.: FINANCIAL OVERVIEW SNAPSHOT FIGURE 18 DELL TECHNOLOGIES: SWOT ANALYSIS FIGURE 19 GOOGLE.: FINANCIAL OVERVIEW SNAPSHOT FIGURE 20 GOOGLE: SWOT ANALYSIS FIGURE 21 HPE.: FINANCIAL OVERVIEW SNAPSHOT FIGURE 22 HPE: SWOT ANALYSIS FIGURE 23 HUAWEI.: FINANCIAL OVERVIEW SNAPSHOT FIGURE 24 HUAWEI: SWOT ANALYSIS FIGURE 25 IBM.: FINANCIAL OVERVIEW SNAPSHOT FIGURE 26 IBM: SWOT ANALYSIS FIGURE 27 INTEL.: FINANCIAL OVERVIEW SNAPSHOT FIGURE 28 INTEL: SWOT ANALYSIS FIGURE 29 LITMUS AUTOMATION.: FINANCIAL OVERVIEW SNAPSHOT FIGURE 30 LITMUS AUTOMATION: SWOT ANALYSIS FIGURE 31 MICROSOFT.: FINANCIAL OVERVIEW SNAPSHOT FIGURE 32 MICROSOFT: SWOT ANALYSIS FIGURE 33 NOKIA.: FINANCIAL OVERVIEW SNAPSHOT FIGURE 34 NOKIA: SWOT ANALYSIS FIGURE 35 ADLINK.: FINANCIAL OVERVIEW SNAPSHOT FIGURE 36 ADLINK: SWOT ANALYSIS FIGURE 37 AXELLIO.: FINANCIAL OVERVIEW SNAPSHOT FIGURE 38 AXELLIO: SWOT ANALYSIS FIGURE 39 CAPGEMINI.: FINANCIAL OVERVIEW SNAPSHOT FIGURE 40 CAPGEMINI: SWOT ANALYSIS FIGURE 41 CLEARBLADE.: FINANCIAL OVERVIEW SNAPSHOT FIGURE 42 CLEARBLADE: SWOT ANALYSIS FIGURE 43 DIGI INTERNATIONAL.: FINANCIAL OVERVIEW SNAPSHOT FIGURE 44 DIGI INTERNATIONAL: SWOT ANALYSIS FIGURE 45 FASTLY.: FINANCIAL OVERVIEW SNAPSHOT FIGURE 46 FASTLY: SWOT ANALYSIS FIGURE 47 STACKPATH.: FINANCIAL OVERVIEW SNAPSHOT FIGURE 48 STACKPATH: SWOT ANALYSIS FIGURE 49 VAPOR IO.: FINANCIAL OVERVIEW SNAPSHOT FIGURE 50 VAPOR IO: SWOT ANALYSIS FIGURE 51 GE DIGITAL.: FINANCIAL OVERVIEW SNAPSHOT FIGURE 52 GE DIGITAL: SWOT ANALYSIS FIGURE 53 MOXA.: FINANCIAL OVERVIEW SNAPSHOT FIGURE 54 MOXA: SWOT ANALYSIS FIGURE 55 SIERRA WIRELESS.: FINANCIAL OVERVIEW SNAPSHOT FIGURE 56 SIERRA WIRELESS: SWOT ANALYSIS FIGURE 57 JUNIPER NETWORKS.: FINANCIAL OVERVIEW SNAPSHOT FIGURE 58 JUNIPER NETWORKS: SWOT ANALYSIS FIGURE 59 EDGECONNEX.: FINANCIAL OVERVIEW SNAPSHOT FIGURE 60 EDGECONNEX: SWOT ANALYSIS FIGURE 61 BELDEN.: FINANCIAL OVERVIEW SNAPSHOT FIGURE 62 BELDEN: SWOT ANALYSIS FIGURE 63 SAGUNA NETWORKS.: FINANCIAL OVERVIEW SNAPSHOT FIGURE 64 SAGUNA NETWORKS: SWOT ANALYSIS FIGURE 65 EDGE INTELLIGENCE.: FINANCIAL OVERVIEW SNAPSHOT FIGURE 66 EDGE INTELLIGENCE: SWOT ANALYSIS FIGURE 67 EDGEIQ.: FINANCIAL OVERVIEW SNAPSHOT FIGURE 68 EDGEIQ: SWOT ANALYSIS FIGURE 69 EDGEWORX.: FINANCIAL OVERVIEW SNAPSHOT FIGURE 70 EDGEWORX: SWOT ANALYSIS FIGURE 71 HIVECELL.: FINANCIAL OVERVIEW SNAPSHOT FIGURE 72 HIVECELL: SWOT ANALYSIS FIGURE 73 MUTABLE.: FINANCIAL OVERVIEW SNAPSHOT FIGURE 74 MUTABLE: SWOT ANALYSIS FIGURE 75 SECTION.: FINANCIAL OVERVIEW SNAPSHOT FIGURE 76 SECTION: SWOT ANALYSIS FIGURE 77 SUNLIGHT.IO.: FINANCIAL OVERVIEW SNAPSHOT FIGURE 78 SUNLIGHT.IO: SWOT ANALYSIS
    329. Table FIGURE 1 RESEARCH PROCESS FIGURE 2 MARKET STRUCTURE FOR THE GLOBAL RETAIL EDGE COMPUTING MARKET FIGURE 3 MARKET DYNAMICS FOR THE GLOBAL RETAIL EDGE COMPUTING MARKET FIGURE 4 GLOBAL RETAIL EDGE COMPUTING MARKET, SHARE (%), BY COMPONENT, 2022 FIGURE 5 GLOBAL RETAIL EDGE COMPUTING MARKET, SHARE (%), BY APPLICATION, 2022 FIGURE 6 GLOBAL RETAIL EDGE COMPUTING MARKET, SHARE (%), BY ORGANIZATION SIZE, 2022 FIGURE 7 GLOBAL RETAIL EDGE COMPUTING MARKET, SHARE (%), BY REGION, 2022 FIGURE 8 NORTH AMERICA: RETAIL EDGE COMPUTING MARKET, SHARE (%), BY REGION, 2022 FIGURE 9 EUROPE: RETAIL EDGE COMPUTING MARKET, SHARE (%), BY REGION, 2022 FIGURE 10 ASIA-PACIFIC: RETAIL EDGE COMPUTING MARKET, SHARE (%), BY REGION, 2022 FIGURE 11 REST OF THE WORLD: RETAIL EDGE COMPUTING MARKET, SHARE (%), BY REGION, 2022 FIGURE 12 GLOBAL RETAIL EDGE COMPUTING MARKET: COMPANY SHARE ANALYSIS, 2022 (%) FIGURE 13 CISCO .: FINANCIAL OVERVIEW SNAPSHOT FIGURE 14 CISCO.: SWOT ANALYSIS FIGURE 15 AWS.: FINANCIAL OVERVIEW SNAPSHOT FIGURE 16 AWS: SWOT ANALYSIS FIGURE 17 DELL TECHNOLOGIES.: FINANCIAL OVERVIEW SNAPSHOT FIGURE 18 DELL TECHNOLOGIES: SWOT ANALYSIS FIGURE 19 GOOGLE.: FINANCIAL OVERVIEW SNAPSHOT FIGURE 20 GOOGLE: SWOT ANALYSIS FIGURE 21 HPE.: FINANCIAL OVERVIEW SNAPSHOT FIGURE 22 HPE: SWOT ANALYSIS FIGURE 23 HUAWEI.: FINANCIAL OVERVIEW SNAPSHOT FIGURE 24 HUAWEI: SWOT ANALYSIS FIGURE 25 IBM.: FINANCIAL OVERVIEW SNAPSHOT FIGURE 26 IBM: SWOT ANALYSIS FIGURE 27 INTEL.: FINANCIAL OVERVIEW SNAPSHOT FIGURE 28 INTEL: SWOT ANALYSIS FIGURE 29 LITMUS AUTOMATION.: FINANCIAL OVERVIEW SNAPSHOT FIGURE 30 LITMUS AUTOMATION: SWOT ANALYSIS FIGURE 31 MICROSOFT.: FINANCIAL OVERVIEW SNAPSHOT FIGURE 32 MICROSOFT: SWOT ANALYSIS FIGURE 33 NOKIA.: FINANCIAL OVERVIEW SNAPSHOT FIGURE 34 NOKIA: SWOT ANALYSIS FIGURE 35 ADLINK.: FINANCIAL OVERVIEW SNAPSHOT FIGURE 36 ADLINK: SWOT ANALYSIS FIGURE 37 AXELLIO.: FINANCIAL OVERVIEW SNAPSHOT FIGURE 38 AXELLIO: SWOT ANALYSIS FIGURE 39 CAPGEMINI.: FINANCIAL OVERVIEW SNAPSHOT FIGURE 40 CAPGEMINI: SWOT ANALYSIS FIGURE 41 CLEARBLADE.: FINANCIAL OVERVIEW SNAPSHOT FIGURE 42 CLEARBLADE: SWOT ANALYSIS FIGURE 43 DIGI INTERNATIONAL.: FINANCIAL OVERVIEW SNAPSHOT FIGURE 44 DIGI INTERNATIONAL: SWOT ANALYSIS FIGURE 45 FASTLY.: FINANCIAL OVERVIEW SNAPSHOT FIGURE 46 FASTLY: SWOT ANALYSIS FIGURE 47 STACKPATH.: FINANCIAL OVERVIEW SNAPSHOT FIGURE 48 STACKPATH: SWOT ANALYSIS FIGURE 49 VAPOR IO.: FINANCIAL OVERVIEW SNAPSHOT FIGURE 50 VAPOR IO: SWOT ANALYSIS FIGURE 51 GE DIGITAL.: FINANCIAL OVERVIEW SNAPSHOT FIGURE 52 GE DIGITAL: SWOT ANALYSIS FIGURE 53 MOXA.: FINANCIAL OVERVIEW SNAPSHOT FIGURE 54 MOXA: SWOT ANALYSIS FIGURE 55 SIERRA WIRELESS.: FINANCIAL OVERVIEW SNAPSHOT FIGURE 56 SIERRA WIRELESS: SWOT ANALYSIS FIGURE 57 JUNIPER NETWORKS.: FINANCIAL OVERVIEW SNAPSHOT FIGURE 58 JUNIPER NETWORKS: SWOT ANALYSIS FIGURE 59 EDGECONNEX.: FINANCIAL OVERVIEW SNAPSHOT FIGURE 60 EDGECONNEX: SWOT ANALYSIS FIGURE 61 BELDEN.: FINANCIAL OVERVIEW SNAPSHOT FIGURE 62 BELDEN: SWOT ANALYSIS FIGURE 63 SAGUNA NETWORKS.: FINANCIAL OVERVIEW SNAPSHOT FIGURE 64 SAGUNA NETWORKS: SWOT ANALYSIS FIGURE 65 EDGE INTELLIGENCE.: FINANCIAL OVERVIEW SNAPSHOT FIGURE 66 EDGE INTELLIGENCE: SWOT ANALYSIS FIGURE 67 EDGEIQ.: FINANCIAL OVERVIEW SNAPSHOT FIGURE 68 EDGEIQ: SWOT ANALYSIS FIGURE 69 EDGEWORX.: FINANCIAL OVERVIEW SNAPSHOT FIGURE 70 EDGEWORX: SWOT ANALYSIS FIGURE 71 HIVECELL.: FINANCIAL OVERVIEW SNAPSHOT FIGURE 72 HIVECELL: SWOT ANALYSIS FIGURE 73 MUTABLE.: FINANCIAL OVERVIEW SNAPSHOT FIGURE 74 MUTABLE: SWOT ANALYSIS FIGURE 75 SECTION.: FINANCIAL OVERVIEW SNAPSHOT FIGURE 76 SECTION: SWOT ANALYSIS FIGURE 77 SUNLIGHT.IO.: FINANCIAL OVERVIEW SNAPSHOT FIGURE 78 SUNLIGHT.IO: SWOT ANALYSIS

    Federal Edge Computing Market Segmentation

    Market Segmentation Overview

    • Detailed segmentation data will be available in the full report
    • Comprehensive analysis by multiple parameters
    • Regional and country-level breakdowns
    • Market size forecasts by segment
    Infographic

    Free Sample Request

    Kindly complete the form below to receive a free sample of this Report

    Get Free Sample

    Customer Strories

    “I am very pleased with how market segments have been defined in a relevant way for my purposes (such as "Portable Freezers & refrigerators" and "last-mile"). In general the report is well structured. Thanks very much for your efforts.”

    Victoria Milne

    Founder
    Case Study
    Chemicals and Materials