• Cat-intel
  • MedIntelliX
  • Resources
  • About Us
  • English
    Chinese
    French
    Japanese
    Korean
    German
    Spanish

    Elevators Market Size

    ID: MRFR/CnM/1017-HCR
    122 Pages
    Chitranshi Jaiswal
    September 2025

    Elevators Market Research Report Information By Type (Passenger Elevators, Goods Elevators, Capsule Elevators, Automobile Elevators, Others), By Application (Commercial, Institutional, Residential), By Service(New Installation, Maintenance and Repair, Modernization ) By Technology( Traction Elevator, Machine Room Less Traction Elevator, Hydraulic) ,and by Region (North America, Europe, Asia-Pac...

    Share:
    Download PDF ×

    We do not share your information with anyone. However, we may send you emails based on your report interest from time to time. You may contact us at any time to opt-out.

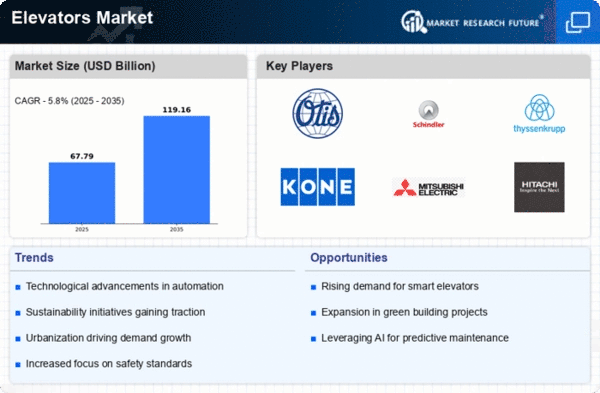
    Elevators Market Research Report – Forecast till 2035 Infographic
    $ 4,950.0
    $ 5,950.0
    $ 7,250.0

    Elevators Size

    Elevators Market Growth Projections and Opportunities

    Many variables affect the elevator market. Global construction, where elevators enable vertical movement, is a key driver. As urbanization increases demand for towering buildings and denser populations, efficient and creative elevator systems are needed. Skyscrapers, residential complexes, and commercial structures boost the elevators industry. Elevators Market Size was $50.8 Billion in 2022. The elevator industry is expected to increase from USD 54.1 Billion in 2023 to USD 89.5 Billion in 2032, a CAGR of 5.35%. With improvements improving safety, energy efficiency, and user experience, technology shapes the elevator business. Smart lifts with IoT, destination control, and predictive maintenance are becoming common. These advances boost elevator efficiency and meet the growing need for smart and sustainable building solutions. Safety and accessibility laws and building rules affect the elevator industry. Elevator manufacturers must follow standards and regulations to guarantee user safety and seamless integration into building designs. Regulations aimed at improving energy efficiency and accommodating disabled persons affect elevator design and functionality. Urbanization and population demographics affect elevator market dynamics. Vertical transportation efficiency is crucial in highly populated metropolitan areas. Elevator demand is driven by high-rise residential, commercial, and mixed-use complexes. Retrofitting older buildings with elevators becomes prevalent as the global population ages, further driving market expansion. Construction operations are generally tied to economic growth, hence economic factors shape the elevator industry. In times of economic boom, real estate and infrastructure expenditures boost elevator demand. Conversely, economic downturns or building slowdowns may impair new installations and elevator modernization projects. Sustainability and environmental concerns are growing in the elevator sector. As green building practices proliferate, elevator manufacturers are designing energy-efficient technologies that lessen environmental effect. Energy-efficient elevators, regenerative drive systems, and low-carbon materials fit the green building trend. Elevator market dynamics depend on consumer safety, comfort, and aesthetics. Elevators are useful and part of the building experience. Modern customers choose elevators with safety features, pleasant rides, and attractive designs. Elevator manufacturers include improved safety systems and customized design to meet these needs. Competition in the elevator sector drives R&D to discover new solutions. Manufacturers must differentiate via features, technology, and services to compete. Strong collaborations with architects, developers, and construction companies also affect elevator brand and model acceptance.
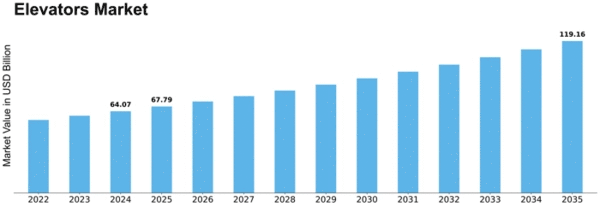
    Market Size Graph

    Market Summary

    As per Market Research Future Analysis, the Global Elevators Market was valued at USD 93.57 Billion in 2024 and is projected to grow from USD 99.94 Billion in 2025 to USD 199.03 Billion by 2035, exhibiting a CAGR of 7.80% during the forecast period. The market is driven by the growing construction industry, rapid industrialization, and increasing safety and accessibility requirements. The demand for vertical transportation solutions is being fueled by urbanization and infrastructure projects, particularly in high-rise buildings.

    Key Market Trends & Highlights

    The adoption of Smart Elevator Solutions is transforming the elevators market.

    • Smart elevators leverage IoT technology for real-time data monitoring and predictive maintenance.
    • Passenger elevators dominated the market in 2024, while capsule elevators are projected to be the fastest-growing segment.
    • The residential segment is expected to grow rapidly due to urbanization and high-rise construction.
    • Machine Room Less Traction Elevators are projected to grow at a CAGR of 9.69%.

    Market Size & Forecast

    2024 Market Size USD 93.57 Billion
    2035 Market Size USD 199.03 Billion
    CAGR (2025-2035) 7.80%
    Largest Regional Market Share in 2024 Asia-Pacific.

    Major Players

    Key players include SCHINDLER GROUP, KONE CORPORATION, MITSUBISHI ELECTRIC CORPORATION, OTIS ELEVATOR COMPANY, and TK ELEVATOR.

    Market Trends

    • SMART ELEVATOR SOLUTIONS

    The adoption of Smart Elevator Solutions represents a significant and transformative opportunity within the elevators market. As the world transitions towards smart buildings and the Internet of Things (IoT), elevators are evolving from traditional transportation devices to intelligent systems that enhance efficiency, user experience, and building management. Smart elevators leverage IoT technology to provide real-time data monitoring, predictive maintenance, and advanced connectivity features, allowing building operators to optimize performance and energy usage.

    This opportunity is driven by the increasing demand for connected and automated solutions in the construction industry. Smart elevators offer benefits such as improved energy efficiency, reduced downtime through predictive maintenance, and enhanced security features. Building owners and operators are increasingly recognizing the value of these smart technologies in optimizing operational costs and creating a more seamless and secure vertical transportation experience for occupants.

    Manufacturers entering the smart elevator space have the opportunity to differentiate themselves by offering innovative features and integrated solutions. These may include touchless controls, personalized user interfaces, and data analytics for predictive maintenance. The growing awareness of the long-term advantages of smart technologies in elevators positions this segment as a key driver of market growth, as businesses and building developers seek solutions that align with the broader goals of sustainability, efficiency, and connectivity in modern structures.

    The Global Elevators Market is poised for substantial growth, driven by urbanization and the increasing demand for smart building technologies, which collectively enhance vertical transportation efficiency.

    U.S. Department of Commerce

    Elevators Market Market Drivers

    Technological Advancements

    Innovations in elevator technology, such as smart elevators and energy-efficient systems, are reshaping the Global Global Elevators Market Industry. The integration of IoT and AI into elevator systems enhances operational efficiency and user experience. For instance, predictive maintenance technologies minimize downtime and reduce operational costs, appealing to building owners and managers. These advancements not only improve safety but also align with sustainability goals, as energy-efficient elevators contribute to lower carbon footprints. As these technologies proliferate, they are expected to drive market growth, potentially leading to a compound annual growth rate of 7.1 percent from 2025 to 2035.

    Market Trends and Growth Projections

    The Global Global Elevators Market Industry is characterized by dynamic trends and growth projections. The market is anticipated to grow from 93.6 USD Billion in 2024 to 199.0 USD Billion by 2035, reflecting a robust compound annual growth rate of 7.1 percent from 2025 to 2035. This growth trajectory is influenced by various factors, including urbanization, technological advancements, and sustainability initiatives. The demand for elevators is expected to rise in tandem with the increasing construction of high-rise buildings and infrastructure projects worldwide. These trends indicate a promising future for the Global Global Elevators Market Industry, as it adapts to meet the evolving needs of urban environments.

    Sustainability and Energy Efficiency

    The Global Global Elevators Market Industry is increasingly influenced by sustainability initiatives and the push for energy-efficient solutions. Governments and organizations are implementing regulations that encourage the adoption of green technologies in building designs, including elevators. Energy-efficient elevators, which consume less power and utilize regenerative drives, are becoming standard in new constructions. This shift not only reduces operational costs but also aligns with global efforts to combat climate change. As sustainability becomes a priority for developers and consumers alike, the Global Global Elevators Market Industry is likely to see a surge in demand for eco-friendly elevator solutions, further propelling market growth.

    Aging Population and Accessibility Needs

    The increasing aging population globally necessitates the development of accessible infrastructure, including elevators. As the demographic shifts towards older age groups, there is a growing demand for elevators that accommodate mobility challenges. The Global Global Elevators Market Industry is responding to this need by designing elevators with features such as wider doors, lower thresholds, and advanced control systems. This trend is particularly evident in residential and healthcare facilities, where accessibility is paramount. The focus on inclusivity not only enhances the quality of life for older adults but also expands the market potential, ensuring that the Global Global Elevators Market Industry remains robust in the coming years.

    Economic Growth and Real Estate Development

    Economic growth in various regions is fostering real estate development, which in turn stimulates the Global Global Elevators Market Industry. As economies expand, there is a notable increase in commercial and residential construction projects, leading to heightened demand for elevators. This trend is particularly pronounced in emerging markets, where urban development is accelerating. The investment in real estate not only boosts the construction sector but also creates opportunities for elevator manufacturers to innovate and expand their product offerings. As the market evolves, the Global Global Elevators Market Industry is poised for growth, supported by favorable economic conditions and increased construction activities.

    Urbanization and Infrastructure Development

    The rapid pace of urbanization globally drives the demand for elevators, particularly in densely populated cities. As urban centers expand, the need for high-rise buildings increases, necessitating efficient vertical transportation solutions. In 2024, the Global Global Elevators Market Industry is valued at approximately 93.6 USD Billion, reflecting the growing infrastructure investments in urban areas. Governments worldwide are prioritizing smart city initiatives, which often include the integration of advanced elevator systems. This trend suggests that as urban populations continue to rise, the Global Global Elevators Market Industry will likely experience sustained growth, with projections indicating a market size of 199.0 USD Billion by 2035.

    Market Segment Insights

    Global Elevators Type Insights

    This chapter consists of a detailed study of the global Elevators market. It provides an overview of the various TYPE of the Elevators market. The Elevators Market is segmented, based on TYPE, into. Passenger Elevators, Goods Elevators, Capsule Elevators, Automobile Elevators, Others. The Passenger Elevators segment dominated the global market in 2024, while the Capsule Elevators is projected to be the fastest–growing segment during the forecast period. Passenger elevators represent a pivotal segment within the global elevator market, playing a crucial role in vertical transportation within buildings and structures. 

    These elevators are specifically designed to transport people efficiently and safely between different floors, making them an indispensable component of modern urban infrastructure. With advancements in technology, passenger elevators have evolved to offer enhanced features such as faster speed, energy efficiency, and advanced safety systems, catering to the growing demands of urbanization and high-rise construction.One key trend in the passenger elevator market is the increasing focus on smart and connected solutions. Elevator manufacturers are integrating IoT (Internet of Things) capabilities to enable remote monitoring, predictive maintenance, and real-time data analysis.

    This not only enhances the overall performance of passenger elevators but also contributes to a more seamless and convenient user experience. Additionally, sustainable practices are gaining prominence, with the development of energy-efficient elevator systems that reduce environmental impact and operating costs.

    Global Elevators Application Insights

    This chapter consists of a detailed study of the global Elevators market. It provides an overview of the various Application of the Elevators market. The Elevators Market is segmented, based on Application, into: Commercial, Institutional, Residential. The Residential segment dominated the global market in 2024, while the Residential is projected to be the fastest–growing segment during the forecast period. The Residential segment within the elevators market caters to the vertical transportation needs of residential buildings, including condominiums, apartments, and private homes.

    Elevators in this segment serve as convenient solutions for enhancing accessibility, mobility, and comfort for residents, particularly in high-rise or multi-story buildings. With a focus on space efficiency, aesthetics, and safety, residential elevators are designed to seamlessly integrate into home environments while providing reliable and smooth vertical transportation.

    One of the primary drivers of demand in the Residential segment is the growing trend of urbanization and the construction of high-rise residential buildings in densely populated cities. As urban populations increase and land becomes scarce, vertical expansion becomes a practical solution for accommodating housing demand. Residential elevators offer convenience and luxury to homeowners, providing ease of access between floors and adding value to properties, especially in upscale residential developments where premium amenities are sought after.

    Figure 1: Global Elevators Market, by Application, 2024 & 2035 (US$ Billion)

    Global Elevators By Service Insights

    This chapter consists of a detailed study of the global Elevators market. It provides an overview of the various Service of the Elevators market. The Elevators Market is segmented, based on Service, into: New Installation, Maintenance and Repair, Modernization. The New Installation segment dominated the global market in 2024, while the Modernization is projected to be the fastest–growing segment during the forecast period. The New Installation segment in the elevators market pertains to the installation of brand-new elevator systems in various settings, including commercial, residential, institutional, and industrial buildings.

    This segment is characterized by the installation of elevators in newly constructed structures or as part of major renovation projects. New installation services encompass a comprehensive process, from initial design and planning to the installation, testing, and commissioning of the elevator system, ensuring compliance with safety standards and regulations.

    One of the key drivers of demand in the New Installation segment is the ongoing construction activity in urban areas, driven by population growth, urbanization, and infrastructure development. As cities expand and modernize, there is a continuous need for vertical transportation solutions to facilitate efficient movement within buildings and ensure accessibility for occupants and visitors. New installations cater to the evolving needs of building owners, architects, and developers who seek state-of-the-art elevator systems that enhance the functionality, safety, and aesthetics of their properties.

    Global Elevators Technology Insights

    This chapter consists of a detailed study of the global Elevators market. It provides an overview of the various Technology of the Elevators market. The Elevators Market is segmented, based on Technology, into Fertilizer, Pharmaceuticals, Food Additives, Industrial, Chemical and others  .The Machine Room Less Traction Elevator segment dominated the global market in 2024, while the Machine Room Less Traction Elevator is projected to be the fastest–growing segment during the forecast period. The Machine room less traction elevator segment of the Elevators market is rapidly expanding, with a market size of $ 32,237.09 Million and a remarkable CAGR of 9.69%.

    The Machine Room-Less (MRL) Traction Elevator segment represents a significant advancement in elevator technology, offering a space-saving and efficient vertical transportation solution. Unlike traditional traction elevators that require a separate machine room for housing the motor and control equipment, MRL traction elevators integrate these components within the elevator shaft itself, eliminating the need for a dedicated machine room. This innovation allows for greater flexibility in building design, reduces construction costs, and maximizes usable space, making MRL traction elevators particularly suitable for modern urban environments with space constraints.

    One of the primary drivers of demand for MRL Traction Elevators is the increasing trend towards sustainable and efficient building practices. MRL elevators offer significant energy savings compared to traditional traction elevators, as they utilize gearless or compact gear traction machines that operate more efficiently and consume less power. Additionally, the elimination of the machine room reduces the overall footprint of the elevator system, contributing to greater resource efficiency and environmental sustainability in building design and construction.

    Get more detailed insights about Elevators Market Research Report – Forecast till 2035

    Regional Insights

    Key Companies in the Elevators Market market include

    Industry Developments

    Future Outlook

    Elevators Market Future Outlook

    The Global Elevators Market is poised for growth at 7.1% CAGR from 2024 to 2035, driven by urbanization, technological advancements, and sustainability initiatives.

    New opportunities lie in:

    • Invest in smart elevator technologies to enhance energy efficiency and user experience.
    • Develop eco-friendly elevator solutions to meet increasing regulatory demands.
    • Expand into emerging markets with tailored products for local infrastructure needs.

    By 2035, the Global Elevators Market is expected to exhibit robust growth, reflecting evolving consumer demands and technological innovations.

    Market Segmentation

    Regional Outlook

    North America
    • US
    • Canada
    • Mexico

    Global Elevators Regional Outlook

    North America
    • US
    • Canada
    • Mexico

    Elevators Market By Type Outlook (US$ Billion, 2019-2035)

    • Passenger Elevators
    • Goods Elevators
    • Capsule Elevators
    • Automobile Elevators
    • Others

    Elevators Market by Service Outlook (US$ Billion, 2019-2035)

    • New Installation
    • Maintenance and Repair
    • Modernization

    Elevators Market by Technology Outlook (US$ Billion, 2019-2035)

    • Traction Elevator
    • Machine Room Less Traction Elevator
    • Hydraulic

    Elevators Market By Application Outlook (US$ Billion, 2019-2035)

    • Commercial
    • Institutional
    • Residential

    Report Scope

    Report Attribute/Metric Details
    Market Size 2024 USD 93.57 Billion
    Market Size 2025 USD 99.94 Billion
    Market Size 2035 USD 199.03 Billion
    Compound Annual Growth Rate (CAGR) 7.80% (2025-2035)
    Base Year 2024
    Market Forecast Period 2025-2035
    Historical Data 2019- 2023
    Market Forecast Units Value (US$ Billion, Thousand Units)
    Report Coverage Revenue Forecast, Market Competitive Landscape, Growth Factors, and Trends
    Segments Covered By Type, By Application, By Service, By Technology, And Region
    Geographies Covered North America, Europe, Asia-Pacific, South America, Middle East & Africa.
    Countries Covered The U.S., Canada, Mexico, Germany, France, United, Kingdom, Spain, Italy, Austria, Romania, Switzerland, Netherland, Poland , Ireland, Finland, Denmark, Sweden, Norway, Hungary, Belgium ,Rest of Europe, Japan, Chaina, India, Rest of Asia Pacific, Middle East, Africa, South America.
    Key Companies Profiled SCHINDLER GROUP, KONE CORPORATION, MITSUBISHI ELECTRIC CORPORATION, OTIS ELEVATOR COMPANY, TK ELEVATOR, ACURO ORGANICS LIMITED, HITACHI, LTD, ARITCO LIFT AB, SIGMA ELEVATOR COMPANY, SCHUMACHER ELEVATOR COMPANY, CANNY ELEVATOR CO, LTD., among others.
    Key Market Opportunities ·         SMART ELEVATOR SOLUTIONS ·         ENERGY-EFFICIENT ELEVATORS
    Key Market Dynamics ·         GROWING CONSTRUCTION INDUSTRY ·         RAPID INDUSTRIALIZATION

    Market Highlights

    Author

    Chitranshi Jaiswal
    Research Analyst Level I

    She holds an experience of about 6+ years in market research and business consulting, working under the spectrum of information communication technology, telecommunications and semiconductor domains. aarti conceptualizes and implements a scalable business strategy and provides strategic leadership to the clients. her expertise lies in market estimation, competitive intelligence, pipeline analysis, customer assessment, etc.

    Leave a Comment

    Latest Comments

    John Doe

    This is a great article! Really helped me understand the topic better.

    Posted on July 23, 2025, 10:15 AM
    Jane Smith

    Thanks for sharing this. I’ve bookmarked it for later reference.

    Posted on July 22, 2025, 7:45 PM

    FAQs

    How much is the Global Elevators Market?

    The Elevators Market size is expected to be valued at USD 199.03 Billion in 2035.

    What is the growth rate of the Global Elevators Market?

    The global market is projected to grow at a CAGR of 7.80% during the forecast period, 2024-2035.

    Which region held the largest market share in the Global Elevators Market?

    Asia Pacific had the largest share of the global market.

    Who are the key players in the Global Elevators Market?

    The key players in the market are Astec Industries SCHINDLER GROUP, KONE CORPORATION, MITSUBISHI ELECTRIC CORPORATION, OTIS ELEVATOR COMPANY, TK ELEVATOR, ACURO ORGANICS LIMITED, HITACHI, LTD, ARITCO LIFT AB, SIGMA ELEVATOR COMPANY, SCHUMACHER ELEVATOR COMPANY, CANNY ELEVATOR CO, LTD., among others.

    Which Technology led the Global Elevators Market?

    Machine Room Less Traction Elevator dominated the market in 2024.

    Which Service had the largest market share in the Global Elevators Market?

    New Installation segment had the largest revenue share of the global market.

    1. EXECUTIVE SUMMARY
      1. MARKET ATTRACTIVENESS
    2. ANALYSIS
      1. GLOBAL ELEVATORS MARKET, BY TYPE
        1. GLOBAL ELEVATORS
    3. MARKET, BY APPLICATION
      1. GLOBAL ELEVATORS MARKET, BY TECHNOLOGY
    4. GLOBAL ELEVATORS MARKET, BY REGION
    5. MARKET INTRODUCTION
      1. DEFINITION
      2. SCOPE OF THE STUDY
      3. RESEARCH OBJECTIVE
      4. MARKET STRUCTURE
    6. RESEARCH METHODOLOGY
      1. DATA MINING
      2. SECONDARY RESEARCH
    7. PRIMARY RESEARCH
      1. PRIMARY INTERVIEWS AND INFORMATION GATHERING PROCESS
        1. BREAKDOWN OF PRIMARY RESPONDENTS
      2. RESEARCH METHODOLOGY FOR MARKET
    8. SIZE ESTIMATION
      1. BOTTOM-UP APPROACH
        1. TOP-DOWN APPROACH
    9. DATA VALIDATION
      1. ASSUMPTIONS & LIMITATIONS
    10. MARKET DYNAMICS
      1. INTRODUCTION
      2. DRIVERS
        1. GROWING CONSTRUCTION INDUSTRY
        2. RAPID INDUSTRIALIZATION
        3. SAFETY AND ACCESSIBILITY REQUIREMENTS
      3. RESTRAINT
        1. HIGH INITIAL COSTS
      4. OPPORTUNITIES
    11. SMART ELEVATOR SOLUTIONS
      1. ENERGY-EFFICIENT ELEVATORS
      2. CHALLENGES
        1. INTENSE COMPETITION
    12. MARKET FACTOR ANALYSIS
      1. SUPPLY CHAIN
    13. ANALYSIS
      1. RAW MATERIAL
        1. MANUFACTURER
        2. DISTRIBUTION
        3. END USER
      2. PORTER’S FIVE FORCES MODEL
        1. BARGAINING
    14. POWER OF SUPPLIERS
      1. BARGAINING POWER OF BUYERS
        1. THREAT OF NEW
    15. ENTRANTS
      1. THREAT OF SUBSTITUTES
        1. INTENSITY OF RIVALRY
    16. COVID-19 IMPACT ANALYSIS
      1. IMPACT ON THE OVERALL CONSTRUCTION INDUSTRY
        1. ECONOMIC IMPACT
        2. IMPACT ON ELEVATORS MARKET
        3. IMPACT
    17. ON SUPPLY CHAIN
      1. PRICE VARIATION OF KEY RAW TYPES
        1. PRODUCTION
    18. SHUTDOWN
      1. CASH FLOW CONSTRAINTS
        1. IMPACT ON IMPORT/EXPORT
        2. IMPACT ON MARKET DEMAND
        3. IMPACT DUE TO RESTRICTION/LOCKDOWN
        4. CONSUMER SENTIMENTS
        5. IMPACT ON PRICING
        6. PRICING ANALYSIS
    19. GLOBAL ELEVATORS MARKET, BY TYPE
      1. INTRODUCTION
      2. PASSENGER ELEVATORS
      3. GOODS ELEVATORS
      4. CAPSULE ELEVATORS
      5. AUTOMOBILE ELEVATORS
      6. OTHERS
    20. GLOBAL ELEVATORS MARKET, BY APPLICATION
      1. INTRODUCTION
      2. COMMERCIAL
      3. INSTITUTIONAL
      4. RESIDENTIAL
    21. GLOBAL ELEVATORS
    22. MARKET, BY SERVICE
      1. INTRODUCTION
      2. NEW INSTALLATION
      3. MAINTENANCE
    23. & REPAIR
      1. MODERNIZATION
    24. GLOBAL ELEVATORS MARKET, BY TECHNOLOGY
      1. INTRODUCTION
      2. TRACTION ELEVATOR
      3. MACHINE ROOM LESS TRACTION
    25. ELEVATOR
      1. HYDRAULIC
    26. GLOBAL ELEVATORS MARKET, BY REGION
    27. INTRODUCTION
      1. NORTH AMERICA
        1. MARKET DYNAMIC
        2. US
        3. CANADA
        4. MEXICO
      2. EUROPE
        1. MARKET DYNAMIC
        2. GERMANY
        3. FRANCE
        4. UK
        5. SPAIN
        6. ITALY
        7. AUSTRIA
    28. ROMANIA
      1. SWITZERLAND
        1. NETHERLAND
        2. FINLAND
        3. DENMARK
        4. SWEDEN
        5. NORWAY
        6. HUNGARY
        7. BELGIUM
        8. REST OF
    29. EUROPE
      1. ASIA PACIFIC
        1. CHINA
        2. INDIA
        3. JAPAN
        4. REST OF ASIA PACIFIC
      2. SOUTH AMERICA
        1. BRAZIL
    30. ARGENTINA
      1. REST OF SOUTH AMERICA
      2. MEA
        1. SAUDI ARABIA
        2. UAE
        3. SOUTH AFRICA
        4. REST OF MEA
    31. COMPETITIVE LANDSCAPE
      1. COMPETITIVE OVERVIEW
      2. COMPETITIVE BENCHMARKING
    32. DEVELOPMENT SHARE ANALYSIS
      1. LIST OF PARTS AND COMPONENT SUPPLIERS
    33. KEY DEVELOPMENTS & GROWTH STRATEGIES
      1. NEW PRODUCT LAUNCH/SERVICE
    34. DEPLOYMENT
      1. PARTNERSHIP, AGREEMENT AND COLLABORATION
        1. ACQUISATION
        2. EXPANSION
    35. COMPANY PROFILES
      1. SCHINDLER GROUP
    36. COMPANY OVERVIEW
      1. FINANCIAL OVERVIEW
        1. PRODUCTS OFFERED
        2. KEY DEVELOPMENTS
        3. SWOT ANALYSIS
        4. KEY STRATEGY
      2. KONE CORPORATION
        1. COMPANY OVERVIEW
        2. FINANCIAL OVERVIEW
        3. PRODUCTS OFFERED
        4. KEY DEVELOPMENTS
        5. SWOT ANALYSIS
        6. KEY STRATEGY
      3. MITSUBISHI ELECTRIC CORPORATION
        1. COMPANY
    37. OVERVIEW
      1. FINANCIAL OVERVIEW
        1. PRODUCTS OFFERED
    38. KEY DEVELOPMENTS
      1. SWOT ANALYSIS
        1. KEY STRATEGY
      2. OTIS
    39. ELEVATOR COMPANY
      1. COMPANY OVERVIEW
        1. FINANCIAL OVERVIEW
        2. PRODUCTS OFFERED
        3. KEY DEVELOPMENTS
        4. SWOT ANALYSIS
        5. KEY STRATEGY
      2. TK ELEVATOR
        1. COMPANY OVERVIEW
    40. PRODUCTS OFFERED
      1. KEY DEVELOPMENTS
        1. SWOT ANALYSIS
    41. KEY STRATEGY
      1. HITACHI, LTD
        1. COMPANY OVERVIEW
        2. FINANCIAL
    42. OVERVIEW
      1. PRODUCTS OFFERED
        1. KEY DEVELOPMENTS
        2. SWOT
    43. ANALYSIS
      1. KEY STRATEGY
      2. ARITCO LIFT AB
        1. COMPANY OVERVIEW
        2. PRODUCTS OFFERED
        3. SWOT ANALYSIS
        4. KEY STRATEGY
      3. SIGMA ELEVATOR COMPANY
        1. COMPANY OVERVIEW
        2. PRODUCTS
    44. OFFERED
      1. KEY DEVELOPMENTS
        1. SWOT ANALYSIS
        2. KEY STRATEGY
      2. SCHUMACHER ELEVATOR COMPANY
        1. COMPANY OVERVIEW
        2. PRODUCTS
    45. OFFERED
      1. SWOT ANALYSIS
        1. KEY STRATEGY
      2. CANNY ELEVATOR
    46. CO, LTD.
      1. COMPANY OVERVIEW
        1. PRODUCTS OFFERED
    47. KEY DEVELOPMENTS
      1. SWOT ANALYSIS
        1. KEY STRATEGY
    48. GLOBAL ELEVATORS MARKET, BY TYPE, 2018-2035 (THOUSAND UNITS)
    49. ELEVATORS MARKET, BY APPLICATION, 2018-2035 (USD BILLION)
    50. MARKET, BY APPLICATION, 2018-2035 (THOUSAND UNITS)
    51. MARKET, BY SERVICE, 2018-2035 (USD BILLION)
    52. BY TECHNOLOGY, 2018-2035 (USD BILLION)
    53. TECHNOLOGY, 2018-2035 (THOUSAND UNITS)
    54. REGION, 2018-2035 (USD BILLION)
    55. 2035 (THOUSAND UNITS)
    56. TO 2035 (USD BILLION)
    57. TO 2035 (THOUSAND UNITS)
    58. 2035 (USD BILLION)
    59. (THOUSAND UNITS)
    60. (USD BILLION)
    61. (THOUSAND UNITS)
    62. (USD BILLION)
    63. (USD BILLION)
    64. (THOUSAND UNITS)
    65. US ELEVATORS MARKET, BY APPLICATION, 2018-2035 (USD BILLION)
    66. MARKET, BY APPLICATION, 2018-2035 (THOUSAND UNITS)
    67. BY SERVICE, 2018-2035 (USD BILLION)
    68. 2035 (USD BILLION)
    69. (THOUSAND UNITS)
    70. BILLION)
    71. CANADA ELEVATORS MARKET, BY APPLICATION, 2018-2035 (THOUSAND UNITS)
    72. CANADA ELEVATORS MARKET, BY SERVICE, 2018-2035 (USD BILLION)
    73. ELEVATORS MARKET, BY TECHNOLOGY, 2018-2035 (USD BILLION)
    74. MARKET, BY TECHNOLOGY, 2018-2035 (THOUSAND UNITS)
    75. MARKET, BY TYPE, 2018-2035 (USD BILLION)
    76. BY TYPE, 2018-2035 (THOUSAND UNITS)
    77. 2035 (USD BILLION)
    78. (THOUSAND UNITS)
    79. BILLION)
    80. EUROPE: ELEVATORS MARKET, BY COUNTRY, 2018 TO 2035 (THOUSAND UNITS)
    81. EUROPE ELEVATORS MARKET, BY TYPE, 2018-2035 (USD BILLION)
    82. ELEVATORS MARKET, BY TYPE, 2018-2035 (THOUSAND UNITS)
    83. MARKET, BY APPLICATION, 2018-2035 (USD BILLION)
    84. BY APPLICATION, 2018-2035 (THOUSAND UNITS)
    85. BY SERVICE, 2018-2035 (USD BILLION)
    86. 2035 (USD BILLION)
    87. (THOUSAND UNITS)
    88. BILLION)
    89. GERMANY ELEVATORS MARKET, BY TECHNOLOGY, 2018-2035 (USD BILLION)
    90. GERMANY ELEVATORS MARKET, BY TECHNOLOGY, 2018-2035 (THOUSAND UNITS)
    91. FRANCE ELEVATORS MARKET, BY TYPE, 2018-2035 (USD BILLION)
    92. MARKET, BY TYPE, 2018-2035 (THOUSAND UNITS)
    93. BY APPLICATION, 2018-2035 (USD BILLION)
    94. APPLICATION, 2018-2035 (THOUSAND UNITS)
    95. SERVICE, 2018-2035 (USD BILLION)
    96. 2035 (USD BILLION)
    97. (THOUSAND UNITS)
    98. (USD BILLION)
    99. (THOUSAND UNITS)
    100. 2035 (USD BILLION)
    101. 2035 (THOUSAND UNITS)
    102. 2035 (USD BILLION)
    103. 2035 (USD BILLION)
    104. 2035 (THOUSAND UNITS)
    105. (USD BILLION)
    106. UNITS)
    107. SPAIN ELEVATORS MARKET, BY TECHNOLOGY, 2018-2035 (USD BILLION)
    108. SPAIN ELEVATORS MARKET, BY TECHNOLOGY, 2018-2035 (THOUSAND UNITS)
    109. ITALY ELEVATORS MARKET, BY TYPE, 2018-2035 (USD BILLION)
    110. MARKET, BY TYPE, 2018-2035 (THOUSAND UNITS)
    111. BY APPLICATION, 2018-2035 (USD BILLION)
    112. APPLICATION, 2018-2035 (THOUSAND UNITS)
    113. SERVICE, 2018-2035 (USD BILLION)
    114. 2035 (USD BILLION)
    115. (THOUSAND UNITS)
    116. BILLION)
    117. AUSTRIA ELEVATORS MARKET, BY TECHNOLOGY, 2018-2035 (USD BILLION)
    118. AUSTRIA ELEVATORS MARKET, BY TECHNOLOGY, 2018-2035 (THOUSAND UNITS)
    119. ROMANIA ELEVATORS MARKET, BY TYPE, 2018-2035 (USD BILLION)
    120. ELEVATORS MARKET, BY TYPE, 2018-2035 (THOUSAND UNITS)
    121. MARKET, BY APPLICATION, 2018-2035 (USD BILLION)
    122. MARKET, BY APPLICATION, 2018-2035 (THOUSAND UNITS)
    123. MARKET, BY SERVICE, 2018-2035 (USD BILLION)
    124. BY TECHNOLOGY, 2018-2035 (USD BILLION)
    125. TECHNOLOGY, 2018-2035 (THOUSAND UNITS)
    126. BY TYPE, 2018-2035 (USD BILLION)
    127. TYPE, 2018-2035 (THOUSAND UNITS)
    128. APPLICATION, 2018-2035 (USD BILLION)
    129. BY APPLICATION, 2018-2035 (THOUSAND UNITS)
    130. MARKET, BY SERVICE, 2018-2035 (USD BILLION)
    131. MARKET, BY TECHNOLOGY, 2018-2035 (USD BILLION)
    132. MARKET, BY TECHNOLOGY, 2018-2035 (THOUSAND UNITS)
    133. MARKET, BY TYPE, 2018-2035 (USD BILLION)
    134. BY TYPE, 2018-2035 (THOUSAND UNITS)
    135. BY APPLICATION, 2018-2035 (USD BILLION)
    136. BY APPLICATION, 2018-2035 (THOUSAND UNITS)
    137. BY SERVICE, 2018-2035 (USD BILLION)
    138. BY TECHNOLOGY, 2018-2035 (USD BILLION)
    139. BY TECHNOLOGY, 2018-2035 (THOUSAND UNITS)
    140. BY TYPE, 2018-2035 (USD BILLION)
    141. 2035 (THOUSAND UNITS)
    142. 2035 (USD BILLION)
    143. 2035 (THOUSAND UNITS)
    144. (USD BILLION)
    145. BILLION)
    146. UNITS)
    147. IRELAND ELEVATORS MARKET, BY APPLICATION, 2018-2035 (USD BILLION)
    148. IRELAND ELEVATORS MARKET, BY APPLICATION, 2018-2035 (THOUSAND UNITS)
    149. IRELAND ELEVATORS MARKET, BY SERVICE, 2018-2035 (USD BILLION)
    150. IRELAND ELEVATORS MARKET, BY TECHNOLOGY, 2018-2035 (USD BILLION)
    151. IRELAND ELEVATORS MARKET, BY TECHNOLOGY, 2018-2035 (THOUSAND UNITS)
    152. FINLAND ELEVATORS MARKET, BY TYPE, 2018-2035 (USD BILLION)
    153. ELEVATORS MARKET, BY TYPE, 2018-2035 (THOUSAND UNITS)
    154. MARKET, BY APPLICATION, 2018-2035 (USD BILLION)
    155. MARKET, BY APPLICATION, 2018-2035 (THOUSAND UNITS)
    156. MARKET, BY SERVICE, 2018-2035 (USD BILLION)
    157. BY TECHNOLOGY, 2018-2035 (USD BILLION)
    158. BY TECHNOLOGY, 2018-2035 (THOUSAND UNITS)
    159. BY TYPE, 2018-2035 (USD BILLION)
    160. 2035 (THOUSAND UNITS)
    161. 2035 (USD BILLION)
    162. 2035 (THOUSAND UNITS)
    163. 2035 (USD BILLION)
    164. 2035 (USD BILLION)
    165. 2035 (THOUSAND UNITS)
    166. (USD BILLION)
    167. UNITS)
    168. SWEDEN ELEVATORS MARKET, BY TECHNOLOGY, 2018-2035 (USD BILLION)
    169. SWEDEN ELEVATORS MARKET, BY TECHNOLOGY, 2018-2035 (THOUSAND UNITS)
    170. NORWAY ELEVATORS MARKET, BY TYPE, 2018-2035 (USD BILLION)
    171. ELEVATORS MARKET, BY TYPE, 2018-2035 (THOUSAND UNITS)
    172. MARKET, BY APPLICATION, 2018-2035 (USD BILLION)
    173. MARKET, BY APPLICATION, 2018-2035 (THOUSAND UNITS)
    174. MARKET, BY SERVICE, 2018-2035 (USD BILLION)
    175. BY TECHNOLOGY, 2018-2035 (USD BILLION)
    176. TECHNOLOGY, 2018-2035 (THOUSAND UNITS)
    177. BY TYPE, 2018-2035 (USD BILLION)
    178. 2035 (THOUSAND UNITS)
    179. 2035 (USD BILLION)
    180. 2035 (THOUSAND UNITS)
    181. 2035 (USD BILLION)
    182. 2035 (USD BILLION)
    183. 2035 (THOUSAND UNITS)
    184. (USD BILLION)
    185. UNITS)
    186. BELGIUM ELEVATORS MARKET, BY TECHNOLOGY, 2018-2035 (USD BILLION)
    187. BELGIUM ELEVATORS MARKET, BY TECHNOLOGY, 2018-2035 (THOUSAND UNITS)
    188. REST OF EUROPE ELEVATORS MARKET, BY TYPE, 2018-2035 (USD BILLION)
    189. REST OF EUROPE ELEVATORS MARKET, BY TYPE, 2018-2035 (THOUSAND UNITS)
    190. REST OF EUROPE ELEVATORS MARKET, BY APPLICATION, 2018-2035 (USD BILLION)
    191. UNITS)
    192. BILLION)
    193. (USD BILLION)
    194. (THOUSAND UNITS)
    195. TO 2035 (USD BILLION)
    196. TO 2035 (THOUSAND UNITS)
    197. 2035 (USD BILLION)
    198. (THOUSAND UNITS)
    199. (USD BILLION)
    200. (THOUSAND UNITS)
    201. (USD BILLION)
    202. (USD BILLION)
    203. (THOUSAND UNITS)
    204. BILLION)
    205. CHINA ELEVATORS MARKET, BY APPLICATION, 2018-2035 (THOUSAND UNITS)
    206. CHINA ELEVATORS MARKET, BY SERVICE, 2018-2035 (USD BILLION)
    207. ELEVATORS MARKET, BY TECHNOLOGY, 2018-2035 (USD BILLION)
    208. MARKET, BY TECHNOLOGY, 2018-2035 (THOUSAND UNITS)
    209. MARKET, BY TYPE, 2018-2035 (USD BILLION)
    210. BY TYPE, 2018-2035 (THOUSAND UNITS)
    211. 2035 (USD BILLION)
    212. (THOUSAND UNITS)
    213. BILLION)
    214. JAPAN ELEVATORS MARKET, BY TYPE, 2018-2035 (THOUSAND UNITS)
    215. ELEVATORS MARKET, BY APPLICATION, 2018-2035 (USD BILLION)
    216. MARKET, BY APPLICATION, 2018-2035 (THOUSAND UNITS)
    217. MARKET, BY SERVICE, 2018-2035 (USD BILLION)
    218. BY TECHNOLOGY, 2018-2035 (USD BILLION)
    219. TECHNOLOGY, 2018-2035 (THOUSAND UNITS)
    220. MARKET, BY TYPE, 2018-2035 (USD BILLION)
    221. MARKET, BY TYPE, 2018-2035 (THOUSAND UNITS)
    222. ELEVATORS MARKET, BY APPLICATION, 2018-2035 (USD BILLION)
    223. ASIA PACIFIC ELEVATORS MARKET, BY APPLICATION, 2018-2035 (THOUSAND UNITS)
    224. REST OF ASIA PACIFIC ELEVATORS MARKET, BY SERVICE, 2018-2035 (USD BILLION)
    225. BILLION)
    226. (THOUSAND UNITS)
    227. TO 2035 (USD BILLION)
    228. TO 2035 (THOUSAND UNITS)
    229. TYPE, 2018-2035 (USD BILLION)
    230. TYPE, 2018-2035 (THOUSAND UNITS)
    231. BY APPLICATION, 2018-2035 (USD BILLION)
    232. BY APPLICATION, 2018-2035 (THOUSAND UNITS)
    233. MARKET, BY SERVICE, 2018-2035 (USD BILLION)
    234. MARKET, BY TECHNOLOGY, 2018-2035 (USD BILLION)
    235. MARKET, BY TECHNOLOGY, 2018-2035 (THOUSAND UNITS)
    236. MARKET, BY TYPE, 2018-2035 (USD BILLION)
    237. BY TYPE, 2018-2035 (THOUSAND UNITS)
    238. 2035 (USD BILLION)
    239. 2035 (THOUSAND UNITS)
    240. (USD BILLION)
    241. BILLION)
    242. UNITS)
    243. ARGENTINA ELEVATORS MARKET, BY APPLICATION, 2018-2035 (USD BILLION)
    244. ARGENTINA ELEVATORS MARKET, BY APPLICATION, 2018-2035 (THOUSAND UNITS)
    245. ARGENTINA ELEVATORS MARKET, BY SERVICE, 2018-2035 (USD BILLION)
    246. ARGENTINA ELEVATORS MARKET, BY TECHNOLOGY, 2018-2035 (USD BILLION)
    247. ARGENTINA ELEVATORS MARKET, BY TECHNOLOGY, 2018-2035 (THOUSAND UNITS)
    248. REST OF SOUTH AMERICA ELEVATORS MARKET, BY TYPE, 2018-2035 (USD BILLION)
    249. UNITS)
    250. (USD BILLION)
    251. 2035 (THOUSAND UNITS)
    252. BY SERVICE, 2018-2035 (USD BILLION)
    253. MARKET, BY TECHNOLOGY, 2018-2035 (USD BILLION)
    254. ELEVATORS MARKET, BY TECHNOLOGY, 2018-2035 (THOUSAND UNITS)
    255. ELEVATORS MARKET, BY COUNTRY, 2018 TO 2035 (USD BILLION)
    256. MARKET, BY COUNTRY, 2018 TO 2035 (THOUSAND UNITS)
    257. BY TYPE, 2018-2035 (USD BILLION)
    258. (THOUSAND UNITS)
    259. (USD BILLION)
    260. UNITS)
    261. MEA ELEVATORS MARKET, BY TECHNOLOGY, 2018-2035 (THOUSAND UNITS)
    262. SAUDI ARABIA ELEVATORS MARKET, BY TYPE, 2018-2035 (USD BILLION)
    263. ARABIA ELEVATORS MARKET, BY TYPE, 2018-2035 (THOUSAND UNITS)
    264. ARABIA ELEVATORS MARKET, BY APPLICATION, 2018-2035 (USD BILLION)
    265. SAUDI ARABIA ELEVATORS MARKET, BY APPLICATION, 2018-2035 (THOUSAND UNITS)
    266. SAUDI ARABIA ELEVATORS MARKET, BY SERVICE, 2018-2035 (USD BILLION)
    267. SAUDI ARABIA ELEVATORS MARKET, BY TECHNOLOGY, 2018-2035 (USD BILLION)
    268. SAUDI ARABIA ELEVATORS MARKET, BY TECHNOLOGY, 2018-2035 (THOUSAND UNITS)
    269. UAE ELEVATORS MARKET, BY TYPE, 2018-2035 (THOUSAND UNITS)
    270. MARKET, BY APPLICATION, 2018-2035 (USD BILLION)
    271. BY APPLICATION, 2018-2035 (THOUSAND UNITS)
    272. BY SERVICE, 2018-2035 (USD BILLION)
    273. 2035 (USD BILLION)
    274. (THOUSAND UNITS)
    275. (USD BILLION)
    276. UNITS)
    277. BILLION)
    278. (THOUSAND UNITS)
    279. (USD BILLION)
    280. (USD BILLION)
    281. (THOUSAND UNITS)
    282. (USD BILLION)
    283. UNITS)
    284. BILLION)
    285. (THOUSAND UNITS)
    286. (USD BILLION)
    287. (USD BILLION)
    288. (THOUSAND UNITS)
    289. PARTNERSHIP, AGREEMENT AND COLLABORATION
    290. EXPANSION
    291. GROUP: KEY DEVELOPMENTS
    292. KONE CORPORATION: KEY DEVELOPMENTS
    293. PRODUCTS OFFERED
    294. COMPANY: KEY DEVELOPMENTS
    295. TK ELEVATOR: KEY DEVELOPMENTS
    296. OFFERED
    297. ELEVATOR COMPANY: KEY DEVELOPMENTS
    298. OFFERED
    299. CANNY ELEVATOR: KEY DEVELOPMENTS
    300. GLOBAL ELEVATORS MARKET ANALYSIS BY TYPE
    301. ANALYSIS BY APPLICATION
    302. MARKET: STRUCTURE
    303. MARKET DYNAMIC ANALYSIS OF THE GLOBAL ELEVATORS MARKET
    304. ANALYSIS
    305. ELEVATORS MARKET
    306. MARKET
    307. NORTH AMERICA: ELEVATORS MARKET SHARE, BY COUNTRY, 2022 (% SHARE)
    308. EUROPE: ELEVATORS MARKET SHARE, BY COUNTRY, 2022 (% SHARE)
    309. PACIFIC: ELEVATORS MARKET SHARE, BY COUNTRY, 2022 (% SHARE)
    310. AMERICA: ELEVATORS MARKET SHARE, BY COUNTRY, 2022 (% SHARE)
    311. ELEVATORS MARKET SHARE, BY COUNTRY, 2022 (% SHARE)
    312. MAJOR COMPETITORS
    313. GROUP: FINANCIAL OVERVIEW SNAPSHOT
    314. SWOT ANALYSIS
    315. SNAPSHOT
    316. OTIS ELEVATOR COMPANY: FINANCIAL OVERVIEW SNAPSHOT
    317. COMPANY: SWOT ANALYSIS
    318. HITACHI LTD: FINANCIAL OVERVIEW SNAPSHOT
    319. SWOT ANALYSIS
    320. CANNY ELEVATOR: SWOT ANALYSIS

    Global Outlook (US$ Million, 2018-2035)

    Global Elevators, Type (US$ Million, 2018-2035)

    • Passenger Elevators
    • Goods Elevators
    • Capsule Elevators

    Global Elevators, Application (US$ Million, 2018-2035)

    • Commercial
    • Institutional
    • Residential

    Global Elevators, Service (US$ Million, 2018-2035)

    • New Installation
    • Maintenance and Repair
    • Modernization

    Global Elevators, Technology (US$ Million, 2018-2035)

    • Traction Elevator
    • Machine Room Less Traction Elevator
    • Hydraulic

    North America Outlook (US$ Million, 2018-2035)

    North America Elevators, Type (US$ Million, 2018-2035)

    • Passenger Elevators
    • Goods Elevators
    • Capsule Elevators

    North America Elevators, Application (US$ Million, 2018-2035)

    • Commercial
    • Institutional
    • Residential

    North America Elevators, Service (US$ Million, 2018-2035)

    • New Installation
    • Maintenance and Repair
    • Modernization

    North America Elevators, Technology (US$ Million, 2018-2035)

    • Traction Elevator
    • Machine Room Less Traction Elevator
    • Hydraulic

    US Outlook (US$ Million, 2018-2035)

    US Elevators, Type (US$ Million, 2018-2035)

    • Passenger Elevators
    • Goods Elevators
    • Capsule Elevators

    US Elevators, Application (US$ Million, 2018-2035)

    • Commercial
    • Institutional
    • Residential

    US Elevators, Service (US$ Million, 2018-2035)

    • New Installation
    • Maintenance and Repair
    • Modernization

    US Elevators, Technology (US$ Million, 2018-2035)

    • Traction Elevator
    • Machine Room Less Traction Elevator
    • Hydraulic

    Canada Outlook (US$ Million, 2018-2035)

    Canada Elevators, Type (US$ Million, 2018-2035)

    • Passenger Elevators
    • Goods Elevators
    • Capsule Elevators

    Canada Elevators, Application (US$ Million, 2018-2035)

    • Commercial
    • Institutional
    • Residential

    Canada Elevators, Service (US$ Million, 2018-2035)

    • New Installation
    • Maintenance and Repair
    • Modernization

    Canada Elevators, Technology (US$ Million, 2018-2035)

    • Traction Elevator
    • Machine Room Less Traction Elevator
    • Hydraulic

    Mexico Outlook (US$ Million, 2018-2035)

    Mexico Elevators, Type (US$ Million, 2018-2035)

    • Passenger Elevators
    • Goods Elevators
    • Capsule Elevators

    Mexico Elevators, Application (US$ Million, 2018-2035)

    • Commercial
    • Institutional
    • Residential

    Mexico Elevators, Service (US$ Million, 2018-2035)

    • New Installation
    • Maintenance and Repair
    • Modernization

    Mexico Elevators, Technology (US$ Million, 2018-2035)

    • Traction Elevator
    • Machine Room Less Traction Elevator
    • Hydraulic

    Europe Outlook (US$ Million, 2018-2035)

    Europe Elevators, Type (US$ Million, 2018-2035)

    • Passenger Elevators
    • Goods Elevators
    • Capsule Elevators

    Europe Elevators, Application (US$ Million, 2018-2035)

    • Commercial
    • Institutional
    • Residential

    Europe Elevators, Service (US$ Million, 2018-2035)

    • New Installation
    • Maintenance and Repair
    • Modernization

    Europe Elevators, Technology (US$ Million, 2018-2035)

    • Traction Elevator
    • Machine Room Less Traction Elevator
    • Hydraulic

    Germany Outlook (US$ Million, 2018-2035)

    Germany Elevators, Type (US$ Million, 2018-2035)

    • Passenger Elevators
    • Goods Elevators
    • Capsule Elevators

    Germany Elevators, Application (US$ Million, 2018-2035)

    • Commercial
    • Institutional
    • Residential

    Germany Elevators, Service (US$ Million, 2018-2035)

    • New Installation
    • Maintenance and Repair
    • Modernization

    Germany Elevators, Technology (US$ Million, 2018-2035)

    • Traction Elevator
    • Machine Room Less Traction Elevator
    • Hydraulic

    France Outlook (US$ Million, 2018-2035)

    France Elevators, Type (US$ Million, 2018-2035)

    • Passenger Elevators
    • Goods Elevators
    • Capsule Elevators

    France Elevators, Application (US$ Million, 2018-2035)

    • Commercial
    • Institutional
    • Residential

    France Elevators, Service (US$ Million, 2018-2035)

    • New Installation
    • Maintenance and Repair
    • Modernization

    France Elevators, Technology (US$ Million, 2018-2035)

    • Traction Elevator
    • Machine Room Less Traction Elevator
    • Hydraulic

    United Kingdom Outlook (US$ Million, 2018-2035)

    United Kingdom Elevators, Type (US$ Million, 2018-2035)

    • Passenger Elevators
    • Goods Elevators
    • Capsule Elevators

    United Kingdom Elevators, Application (US$ Million, 2018-2035)

    • Commercial
    • Institutional
    • Residential

    United Kingdom Elevators, Service (US$ Million, 2018-2035)

    • New Installation
    • Maintenance and Repair
    • Modernization

    United Kingdom Elevators, Technology (US$ Million, 2018-2035)

    • Traction Elevator
    • Machine Room Less Traction Elevator
    • Hydraulic

    Spain Outlook (US$ Million, 2018-2035)

    Spain Elevators, Type (US$ Million, 2018-2035)

    • Passenger Elevators
    • Goods Elevators
    • Capsule Elevators

    Spain Elevators, Application (US$ Million, 2018-2035)

    • Commercial
    • Institutional
    • Residential

    Spain Elevators, Service (US$ Million, 2018-2035)

    • New Installation
    • Maintenance and Repair
    • Modernization

    Spain Elevators, Technology (US$ Million, 2018-2035)

    • Traction Elevator
    • Machine Room Less Traction Elevator
    • Hydraulic

    Italy Outlook (US$ Million, 2018-2035)

    Italy Elevators, Type (US$ Million, 2018-2035)

    • Passenger Elevators
    • Goods Elevators
    • Capsule Elevators

    Italy Elevators, Application (US$ Million, 2018-2035)

    • Commercial
    • Institutional
    • Residential

    Italy Elevators, Service (US$ Million, 2018-2035)

    • New Installation
    • Maintenance and Repair
    • Modernization

    Italy Elevators, Technology (US$ Million, 2018-2035)

    • Traction Elevator
    • Machine Room Less Traction Elevator
    • Hydraulic

    Austria Outlook (US$ Million, 2018-2035)

    Austria Elevators, Type (US$ Million, 2018-2035)

    • Passenger Elevators
    • Goods Elevators
    • Capsule Elevators

    Austria Elevators, Application (US$ Million, 2018-2035)

    • Commercial
    • Institutional
    • Residential

    Austria Elevators, Service (US$ Million, 2018-2035)

    • New Installation
    • Maintenance and Repair
    • Modernization

    Austria Elevators, Technology (US$ Million, 2018-2035)

    • Traction Elevator
    • Machine Room Less Traction Elevator
    • Hydraulic

    Romania Outlook (US$ Million, 2018-2035)

    Romania Elevators, Type (US$ Million, 2018-2035)

    • Passenger Elevators
    • Goods Elevators
    • Capsule Elevators

    Romania Elevators, Application (US$ Million, 2018-2035)

    • Commercial
    • Institutional
    • Residential

    Romania Elevators, Service (US$ Million, 2018-2035)

    • New Installation
    • Maintenance and Repair
    • Modernization

    Romania Elevators, Technology (US$ Million, 2018-2035)

    • Traction Elevator
    • Machine Room Less Traction Elevator
    • Hydraulic

    Switzerland Outlook (US$ Million, 2018-2035)

    Switzerland Elevators, Type (US$ Million, 2018-2035)

    • Passenger Elevators
    • Goods Elevators
    • Capsule Elevators

    Switzerland Elevators, Application (US$ Million, 2018-2035)

    • Commercial
    • Institutional
    • Residential

    Switzerland Elevators, Service (US$ Million, 2018-2035)

    • New Installation
    • Maintenance and Repair
    • Modernization

    Switzerland Elevators, Technology (US$ Million, 2018-2035)

    • Traction Elevator
    • Machine Room Less Traction Elevator
    • Hydraulic

    Netherland Outlook (US$ Million, 2018-2035)

    Netherland Elevators, Type (US$ Million, 2018-2035)

    • Passenger Elevators
    • Goods Elevators
    • Capsule Elevators

    Netherland Elevators, Application (US$ Million, 2018-2035)

    • Commercial
    • Institutional
    • Residential

    Netherland Elevators, Service (US$ Million, 2018-2035)

    • New Installation
    • Maintenance and Repair
    • Modernization

    Netherland Elevators, Technology (US$ Million, 2018-2035)

    • Traction Elevator
    • Machine Room Less Traction Elevator
    • Hydraulic

    Poland Outlook (US$ Million, 2018-2035)

    Poland Elevators, Type (US$ Million, 2018-2035)

    • Passenger Elevators
    • Goods Elevators
    • Capsule Elevators

    Poland Elevators, Application (US$ Million, 2018-2035)

    • Commercial
    • Institutional
    • Residential

    Poland Elevators, Service (US$ Million, 2018-2035)

    • New Installation
    • Maintenance and Repair
    • Modernization

    Poland Elevators, Technology (US$ Million, 2018-2035)

    • Traction Elevator
    • Machine Room Less Traction Elevator
    • Hydraulic

    Finland Outlook (US$ Million, 2018-2035)

    Finland Elevators, Type (US$ Million, 2018-2035)

    • Passenger Elevators
    • Goods Elevators
    • Capsule Elevators

    Finland Elevators, Application (US$ Million, 2018-2035)

    • Commercial
    • Institutional
    • Residential

    Finland Elevators, Service (US$ Million, 2018-2035)

    • New Installation
    • Maintenance and Repair
    • Modernization

    Finland Elevators, Technology (US$ Million, 2018-2035)

    • Traction Elevator
    • Machine Room Less Traction Elevator
    • Hydraulic

    Denmark Outlook (US$ Million, 2018-2035)

    Denmark Elevators, Type (US$ Million, 2018-2035)

    • Passenger Elevators
    • Goods Elevators
    • Capsule Elevators

    Denmark Elevators, Application (US$ Million, 2018-2035)

    • Commercial
    • Institutional
    • Residential

    Denmark Elevators, Service (US$ Million, 2018-2035)

    • New Installation
    • Maintenance and Repair
    • Modernization

    Denmark Elevators, Technology (US$ Million, 2018-2035)

    • Traction Elevator
    • Machine Room Less Traction Elevator
    • Hydraulic

    Sweden Outlook (US$ Million, 2018-2035)

    Sweden Elevators, Type (US$ Million, 2018-2035)

    • Passenger Elevators
    • Goods Elevators
    • Capsule Elevators

    Sweden Elevators, Application (US$ Million, 2018-2035)

    • Commercial
    • Institutional
    • Residential

    Sweden Elevators, Service (US$ Million, 2018-2035)

    • New Installation
    • Maintenance and Repair
    • Modernization

    Sweden Elevators, Technology (US$ Million, 2018-2035)

    • Traction Elevator
    • Machine Room Less Traction Elevator
    • Hydraulic

    Norway Outlook (US$ Million, 2018-2035)

    Norway Elevators, Type (US$ Million, 2018-2035)

    • Passenger Elevators
    • Goods Elevators
    • Capsule Elevators

    Norway Elevators, Application (US$ Million, 2018-2035)

    • Commercial
    • Institutional
    • Residential

    Norway Elevators, Service (US$ Million, 2018-2035)

    • New Installation
    • Maintenance and Repair
    • Modernization

    Norway Elevators, Technology (US$ Million, 2018-2035)

    • Traction Elevator
    • Machine Room Less Traction Elevator
    • Hydraulic

    Hungary Outlook (US$ Million, 2018-2035)

    Hungary Elevators, Type (US$ Million, 2018-2035)

    • Passenger Elevators
    • Goods Elevators
    • Capsule Elevators

    Hungary Elevators, Application (US$ Million, 2018-2035)

    • Commercial
    • Institutional
    • Residential

    Hungary Elevators, Service (US$ Million, 2018-2035)

    • New Installation
    • Maintenance and Repair
    • Modernization

    Hungary Elevators, Technology (US$ Million, 2018-2035)

    • Traction Elevator
    • Machine Room Less Traction Elevator
    • Hydraulic

    Belgium Outlook (US$ Million, 2018-2035)

    Belgium Elevators, Type (US$ Million, 2018-2035)

    • Passenger Elevators
    • Goods Elevators
    • Capsule Elevators

    Belgium Elevators, Application (US$ Million, 2018-2035)

    • Commercial
    • Institutional
    • Residential

    Belgium Elevators, Service (US$ Million, 2018-2035)

    • New Installation
    • Maintenance and Repair
    • Modernization

    Belgium Elevators, Technology (US$ Million, 2018-2035)

    • Traction Elevator
    • Machine Room Less Traction Elevator
    • Hydraulic

    Rest of Europe Outlook (US$ Million, 2018-2035)

    Rest of Europe Elevators, Type (US$ Million, 2018-2035)

    • Passenger Elevators
    • Goods Elevators
    • Capsule Elevators

    Rest of Europe Elevators, Application (US$ Million, 2018-2035)

    • Commercial
    • Institutional
    • Residential

    Rest of Europe Elevators, Service (US$ Million, 2018-2035)

    • New Installation
    • Maintenance and Repair
    • Modernization

    Rest of Europe Elevators, Technology (US$ Million, 2018-2035)

    • Traction Elevator
    • Machine Room Less Traction Elevator
    • Hydraulic

    Asia Pacific Outlook (US$ Million, 2018-2035)

    Asia Pacific Elevators, Type (US$ Million, 2018-2035)

    • Passenger Elevators
    • Goods Elevators
    • Capsule Elevators

    Asia Pacific Elevators, Application (US$ Million, 2018-2035)

    • Commercial
    • Institutional
    • Residential

    Asia Pacific Elevators, Service (US$ Million, 2018-2035)

    • New Installation
    • Maintenance and Repair
    • Modernization

    Asia Pacific Elevators, Technology (US$ Million, 2018-2035)

    • Traction Elevator
    • Machine Room Less Traction Elevator
    • Hydraulic

    China Outlook (US$ Million, 2018-2035)

    China Elevators, Type (US$ Million, 2018-2035)

    • Passenger Elevators
    • Goods Elevators
    • Capsule Elevators

    China Elevators, Application (US$ Million, 2018-2035)

    • Commercial
    • Institutional
    • Residential

    China Elevators, Service (US$ Million, 2018-2035)

    • New Installation
    • Maintenance and Repair
    • Modernization

    China Elevators, Technology (US$ Million, 2018-2035)

    • Traction Elevator
    • Machine Room Less Traction Elevator
    • Hydraulic

    India Outlook (US$ Million, 2018-2035)

    India Elevators, Type (US$ Million, 2018-2035)

    • Passenger Elevators
    • Goods Elevators
    • Capsule Elevators

    India Elevators, Application (US$ Million, 2018-2035)

    • Commercial
    • Institutional
    • Residential

    India Elevators, Service (US$ Million, 2018-2035)

    • New Installation
    • Maintenance and Repair
    • Modernization

    India Elevators, Technology (US$ Million, 2018-2035)

    • Traction Elevator
    • Machine Room Less Traction Elevator
    • Hydraulic

    Japan Outlook (US$ Million, 2018-2035)

    Japan Elevators, Type (US$ Million, 2018-2035)

    • Passenger Elevators
    • Goods Elevators
    • Capsule Elevators

    Japan Elevators, Application (US$ Million, 2018-2035)

    • Commercial
    • Institutional
    • Residential

    Japan Elevators, Service (US$ Million, 2018-2035)

    • New Installation
    • Maintenance and Repair
    • Modernization

    Japan Elevators, Technology (US$ Million, 2018-2035)

    • Traction Elevator
    • Machine Room Less Traction Elevator
    • Hydraulic

    Rest of Asia Pacific Outlook (US$ Million, 2018-2035)

    Rest of Asia Pacific Elevators, Type (US$ Million, 2018-2035)

    • Passenger Elevators
    • Goods Elevators
    • Capsule Elevators

    Rest of Asia Pacific Elevators, Application (US$ Million, 2018-2035)

    • Commercial
    • Institutional
    • Residential

    Rest of Asia Pacific Elevators, Service (US$ Million, 2018-2035)

    • New Installation
    • Maintenance and Repair
    • Modernization

    Rest of Asia Pacific Elevators, Technology (US$ Million, 2018-2035)

    • Traction Elevator
    • Machine Room Less Traction Elevator
    • Hydraulic

    South America Outlook (US$ Million, 2018-2035)

    South America Elevators, Type (US$ Million, 2018-2035)

    • Passenger Elevators
    • Goods Elevators
    • Capsule Elevators

    South America Elevators, Application (US$ Million, 2018-2035)

    • Commercial
    • Institutional
    • Residential

    South America Elevators, Service (US$ Million, 2018-2035)

    • New Installation
    • Maintenance and Repair
    • Modernization

    South America Elevators, Technology (US$ Million, 2018-2035)

    • Traction Elevator
    • Machine Room Less Traction Elevator
    • Hydraulic

    Brazil Outlook (US$ Million, 2018-2035)

    Brazil Elevators, Type (US$ Million, 2018-2035)

    • Passenger Elevators
    • Goods Elevators
    • Capsule Elevators

    Brazil Elevators, Application (US$ Million, 2018-2035)

    • Commercial
    • Institutional
    • Residential

    Brazil Elevators, Service (US$ Million, 2018-2035)

    • New Installation
    • Maintenance and Repair
    • Modernization

    Brazil Elevators, Technology (US$ Million, 2018-2035)

    • Traction Elevator
    • Machine Room Less Traction Elevator
    • Hydraulic

    Argentina Outlook (US$ Million, 2018-2035)

    Argentina Elevators, Type (US$ Million, 2018-2035)

    • Passenger Elevators
    • Goods Elevators
    • Capsule Elevators

    Argentina Elevators, Application (US$ Million, 2018-2035)

    • Commercial
    • Institutional
    • Residential

    Argentina Elevators, Service (US$ Million, 2018-2035)

    • New Installation
    • Maintenance and Repair
    • Modernization

    Argentina Elevators, Technology (US$ Million, 2018-2035)

    • Traction Elevator
    • Machine Room Less Traction Elevator
    • Hydraulic

    Rest of LATAM Outlook (US$ Million, 2018-2035)

    Rest of LATAM Elevators, Type (US$ Million, 2018-2035)

    • Passenger Elevators
    • Goods Elevators
    • Capsule Elevators

    Rest of LATAM Elevators, Application (US$ Million, 2018-2035)

    • Commercial
    • Institutional
    • Residential

    Rest of LATAM Elevators, Service (US$ Million, 2018-2035)

    • New Installation
    • Maintenance and Repair
    • Modernization

    Rest of LATAM Elevators, Technology (US$ Million, 2018-2035)

    • Traction Elevator
    • Machine Room Less Traction Elevator
    • Hydraulic

    Middle East & Africa Outlook (US$ Million, 2018-2035)

    Middle East & Africa Elevators, Type (US$ Million, 2018-2035)

    • Passenger Elevators
    • Goods Elevators
    • Capsule Elevators

    Middle East & Africa Elevators, Application (US$ Million, 2018-2035)

    • Commercial
    • Institutional
    • Residential

    Middle East & Africa Elevators, Service (US$ Million, 2018-2035)

    • New Installation
    • Maintenance and Repair
    • Modernization

    Middle East & Africa Elevators, Technology (US$ Million, 2018-2035)

    • Traction Elevator
    • Machine Room Less Traction Elevator
    • Hydraulic

    Saudi Outlook (US$ Million, 2018-2035)

    Saudi Elevators, Type (US$ Million, 2018-2035)

    • Passenger Elevators
    • Goods Elevators
    • Capsule Elevators

    Saudi Elevators, Application (US$ Million, 2018-2035)

    • Commercial
    • Institutional
    • Residential

    Saudi Elevators, Service (US$ Million, 2018-2035)

    • New Installation
    • Maintenance and Repair
    • Modernization

    Saudi Elevators, Technology (US$ Million, 2018-2035)

    • Traction Elevator
    • Machine Room Less Traction Elevator
    • Hydraulic

    UAE Outlook (US$ Million, 2018-2035)

    UAE Elevators, Type (US$ Million, 2018-2035)

    • Passenger Elevators
    • Goods Elevators
    • Capsule Elevators

    UAE Elevators, Application (US$ Million, 2018-2035)

    • Commercial
    • Institutional
    • Residential

    UAE Elevators, Service (US$ Million, 2018-2035)

    • New Installation
    • Maintenance and Repair
    • Modernization

    UAE Elevators, Technology (US$ Million, 2018-2035)

    • Traction Elevator
    • Machine Room Less Traction Elevator
    • Hydraulic

    South Africa Outlook (US$ Million, 2018-2035)

    South Africa Elevators, Type (US$ Million, 2018-2035)

    • Passenger Elevators
    • Goods Elevators
    • Capsule Elevators

    South Africa Elevators, Application (US$ Million, 2018-2035)

    • Commercial
    • Institutional
    • Residential

    South Africa Elevators, Service (US$ Million, 2018-2035)

    • New Installation
    • Maintenance and Repair
    • Modernization

    South Africa Elevators, Technology (US$ Million, 2018-2035)

    • Traction Elevator
    • Machine Room Less Traction Elevator
    • Hydraulic

    Rest of MEA Outlook (US$ Million, 2018-2035)

    Rest of MEA Elevators, Type (US$ Million, 2018-2035)

    • Passenger Elevators
    • Goods Elevators
    • Capsule Elevators

    Rest of MEA Elevators, Application (US$ Million, 2018-2035)

    • Commercial
    • Institutional
    • Residential

    Rest of MEA Elevators, Service (US$ Million, 2018-2035)

    • New Installation
    • Maintenance and Repair
    • Modernization

    Rest of MEA Elevators, Technology (US$ Million, 2018-2035)

    • Traction Elevator
    • Machine Room Less Traction Elevator
    • Hydraulic
    Infographic

    Free Sample Request

    Kindly complete the form below to receive a free sample of this Report

    Get Free Sample

    Customer Strories

    “I am very pleased with how market segments have been defined in a relevant way for my purposes (such as "Portable Freezers & refrigerators" and "last-mile"). In general the report is well structured. Thanks very much for your efforts.”

    Victoria Milne

    Founder
    Case Study

    Smartphone Motherboard Parts Manufacturing Research