• Cat-intel
  • MedIntelliX
  • Resources
  • About Us
  • Hero Background
    English
    Chinese
    French
    Japanese
    Korean
    German
    Spanish

    Chromatography Reagents Market Size

    ID: MRFR/HC/7695-HCR
    150 Pages
    Kinjoll Dey
    October 2025

    Chromatography Reagents Market Research Report Information by Type (Solvents, Buffers, Derivatization Reagents, Ion-Pair Reagents), by Technology (Gas Chromatography {GC} Reagents, Liquid Chromatography {LC}Reagents, Supercritical Fluid Chromatography {SFC}Reagents, Thin Layer Chromatography {TLC}Reagents), by Separation Mechanism (Adsorption Chromatography, Partition Chromatography, Ion-Exchan...

    Share:
    Download PDF ×

    We do not share your information with anyone. However, we may send you emails based on your report interest from time to time. You may contact us at any time to opt-out.

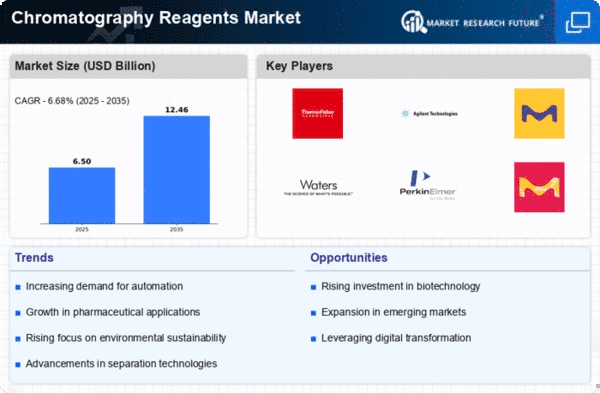
    Chromatography Reagents Market Infographic
    $ 4,950.0
    $ 5,950.0
    $ 7,250.0

    Chromatography Reagents Size

    Chromatography Reagents Market Growth Projections and Opportunities

    The Chromatography Reagents Market is significantly influenced by the rising demand for pharmaceuticals. As pharmaceutical research and development activities expand globally, chromatography reagents play a crucial role in various stages of drug discovery, leading to a substantial market growth. Techniques of chromatography have important use of detection of contaminants in the safety of different food product, which has expansion of chromatography reagents market. The market is also transformed by the growing concern in environmental monitoring. Chromatography methods along with instrumental analysis for a variety of samples including air, water, soil have found enormous scope in the environmental sector to detect pollutants. Harsher environmental regulations increase the demand for chromatography reagents in this industry. HPLC and GC, a current chromatography technology, are currently in the development stages and give rise to the need for specially designed reagents. The market is profiting from innovations that increase efficiency, precision, as well as speed in the analytical process which attracts more users and investors. The current developments within the biopharmaceutical industry affects directly the chromatography reagents market. The need for chromatography reagents for purification and analysis grows proportionately to the rate of biologics and biosimilars being produced, leading to the further growing market. Governments, universities, other institutions and private companies funding scientific research increases the demand for the chromatography reagents, since they are imperative components in all analytical work. The market dynamics are underpinned by the internationalization of the life sciences industry. As border collaborative lab initiatives and partnerships increase the demand for chromatography reagents as they are integral parts in laboratories across the globe which is the driver of growth for the market. More strict regulations in pharmaceuticals, biotechnology, food and beverages necessitate the use of high-quality chromatography reagents. According to market research, the need for precise and accurate reagents due to compliance with regulatory standards dictates the demand of this particular market. This region of Asia-Pacific has started holding importance as new market for chromatography reagents. Pharmaceutical and biotechnology industries in countries such as China and India are growing on larger scale with increasing investments in the brief and this has direct impact on chromatography reagents demands in this region. The rising focus on personalized medicine and targeted therapies fuels the demand for chromatography reagents. These reagents are essential for the analysis and purification of biomolecules, supporting the development of personalized treatments and contributing to market expansion.
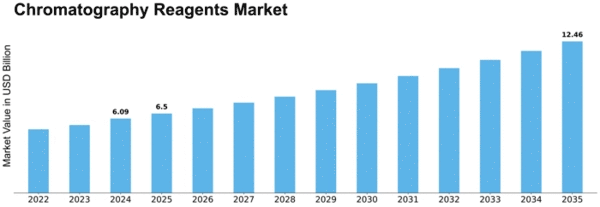
    Chromatography Reagents Market Size Graph

    Market Summary

    The Global Chromatography Reagents Market is projected to grow significantly from 8.71 USD Billion in 2024 to 16.4 USD Billion by 2035.

    Key Market Trends & Highlights

    Chromatography Reagents Key Trends and Highlights

    • The market is expected to expand at a compound annual growth rate (CAGR) of 5.9% from 2025 to 2035.
    • By 2035, the market valuation is anticipated to reach 16.4 USD Billion, indicating robust growth potential.
    • In 2024, the market is valued at 8.71 USD Billion, reflecting a strong foundation for future expansion.
    • Growing adoption of chromatography techniques due to increasing demand for quality control in pharmaceuticals is a major market driver.

    Market Size & Forecast

    2024 Market Size 8.71 (USD Billion)
    2035 Market Size 16.4 (USD Billion)
    CAGR (2025-2035) 5.9%
    Largest Regional Market Share in 2024 latin_america)

    Major Players

    Agilent Technologies, Inc., Avantor, Bio-Rad Laboratories, Inc., Chiron AS, Cytiva, GFS Chemicals Inc, Kanto Chemical, Loba Chemie Pvt. Ltd, Merck KGaA, Regis Technologies, Inc., Restek, Santa Cruz Biotechnology, Spectrum Chemical Mfg. Corp., Thermo Fisher Scientific, Tosoh Bioscience, Waters Corporation

    Market Trends

    The increasing demand for high-purity chromatography reagents in pharmaceutical and biotechnology applications underscores a pivotal shift towards enhanced analytical precision and efficiency in laboratory practices.

    U.S. Food and Drug Administration (FDA)

    Chromatography Reagents Market Market Drivers

    Market Growth Projections

    Growth in Biopharmaceuticals

    The biopharmaceutical sector significantly influences the Global Chromatography Reagents Market Industry, as the production of biologics requires sophisticated purification processes. Chromatography is essential for the separation and purification of proteins, antibodies, and other biomolecules. The increasing investment in biopharmaceutical research and development, coupled with the rising prevalence of chronic diseases, is expected to propel the market forward. This growth trajectory aligns with a projected CAGR of 5.9% from 2025 to 2035, indicating a robust demand for chromatography reagents tailored for biopharmaceutical applications.

    Rising Demand for Analytical Testing

    The Global Chromatography Reagents Market Industry experiences a surge in demand for analytical testing across various sectors, including pharmaceuticals, food and beverage, and environmental monitoring. This trend is driven by stringent regulatory requirements that necessitate accurate and reliable testing methods. For instance, the pharmaceutical sector relies heavily on chromatography for drug formulation and quality control. As a result, the market is projected to reach 8.71 USD Billion in 2024, reflecting the increasing need for high-quality reagents that ensure compliance with regulatory standards.

    Emerging Markets and Global Expansion

    Emerging markets present a significant opportunity for the Global Chromatography Reagents Market Industry as developing economies invest in healthcare and research infrastructure. Countries in Asia-Pacific and Latin America are witnessing rapid growth in laboratory facilities and analytical services, which drives the demand for chromatography reagents. As these regions enhance their research capabilities, the market is likely to experience substantial growth, contributing to the overall expansion of the industry. This trend underscores the importance of global outreach and the need for manufacturers to adapt their strategies to cater to diverse market needs.

    Environmental Regulations and Sustainability

    Environmental regulations are becoming increasingly stringent, driving the Global Chromatography Reagents Market Industry towards sustainable practices. Industries are compelled to adopt greener methodologies to comply with environmental standards, which often necessitate the use of chromatography for monitoring pollutants and ensuring product safety. The emphasis on sustainability is prompting manufacturers to develop eco-friendly reagents that minimize environmental impact. This shift not only aligns with regulatory compliance but also caters to the growing consumer demand for sustainable products, thereby enhancing market prospects.

    Technological Advancements in Chromatography

    Technological advancements play a pivotal role in shaping the Global Chromatography Reagents Market Industry. Innovations such as ultra-high-performance liquid chromatography (UHPLC) and advancements in mass spectrometry enhance the efficiency and accuracy of separation techniques. These developments not only improve the resolution of complex mixtures but also reduce analysis time, thereby increasing throughput in laboratories. As these technologies become more accessible, they are likely to drive market growth, contributing to an anticipated market value of 16.4 USD Billion by 2035, as laboratories seek to adopt cutting-edge methodologies.

    Market Segment Insights

    Regional Insights

    Key Companies in the Chromatography Reagents Market market include

    Industry Developments

      • In 2019, CARLO ERBA Reagents (Italy), a producer of solvents for chromatography,extended its range of solvents for GC to meet the increasing demand from researchers for detection methods. CARLO ERBA Reagents offers a specific range of products dedicated to the GC-MS application with very high purity.

    Future Outlook

    Chromatography Reagents Market Future Outlook

    The Global Chromatography Reagents Market is projected to grow at a 5.9% CAGR from 2024 to 2035, driven by advancements in analytical techniques and increasing demand in pharmaceuticals.

    New opportunities lie in:

    • Develop eco-friendly chromatography reagents to meet sustainability goals.
    • Invest in automation technologies for enhanced laboratory efficiency.
    • Expand product offerings to include specialty reagents for niche applications.

    By 2035, the market is expected to reach a robust position, reflecting substantial growth and innovation.

    Market Segmentation

    By Type

    • Solvents
    • Buffers
    • Derivatization Reagents
    • Ion-Pair Reagents
    • Gas Chromatography Reagents
    • Liquid Chromatography Reagents
    • Supercritical Fluid Chromatography Reagents
    • Thin-Layer Chromatography Reagents
    • Adsorption Chromatography
    • Partition Chromatography
    • Ion-Exchange Chromatography
    • Size-Exclusion Chromatography
    • Affinity Chromatography
    • Pharmaceutical Testing
    • Biopharma-Biotech Applications
    • Research & Academic Applications
    • Food & Beverage Testing
    • Clinical Testing
    • Others
    • North America:
    • Europe:
    • Asia-Pacific:
    • Rest of the World:
    • Waters Corporation (US)
    • Tosoh Bioscience (Japan)
    • Thermo Fisher Scientific (US)
    • Spectrum Chemical Mfg. Corp. (US)
    • Santa Cruz Biotechnology (US)
    • Restek (US)
    • Regis Technologies, Inc. (US)
    • Merck KGaA (Germany)
    • Loba Chemie Pvt. Ltd (India)
    • Kanto Chemical (Japan)
    • GFS Chemicals Inc (US)
    • Cytiva (US)
    • Chiron AS (Norway)
    • Bio-Rad Laboratories, Inc. (US)
    • Avantor (US)
    • Agilent Technologies, Inc. (US)
    • In 2019, CARLO ERBA Reagents (Italy), a producer of solvents for chromatography,extended its range of solvents for GC to meet the increasing demand from researchers for detection methods. CARLO ERBA Reagents offers a specific range of products dedicated to the GC-MS application with very high purity.

    By Region

    • North America:
    • Europe:
    • Asia-Pacific:
    • Rest of the World:
    • Waters Corporation (US)
    • Tosoh Bioscience (Japan)
    • Thermo Fisher Scientific (US)
    • Spectrum Chemical Mfg. Corp. (US)
    • Santa Cruz Biotechnology (US)
    • Restek (US)
    • Regis Technologies, Inc. (US)
    • Merck KGaA (Germany)
    • Loba Chemie Pvt. Ltd (India)
    • Kanto Chemical (Japan)
    • GFS Chemicals Inc (US)
    • Cytiva (US)
    • Chiron AS (Norway)
    • Bio-Rad Laboratories, Inc. (US)
    • Avantor (US)
    • Agilent Technologies, Inc. (US)
    • In 2019, CARLO ERBA Reagents (Italy), a producer of solvents for chromatography,extended its range of solvents for GC to meet the increasing demand from researchers for detection methods. CARLO ERBA Reagents offers a specific range of products dedicated to the GC-MS application with very high purity.

    Key Players

    • Waters Corporation (US)
    • Tosoh Bioscience (Japan)
    • Thermo Fisher Scientific (US)
    • Spectrum Chemical Mfg. Corp. (US)
    • Santa Cruz Biotechnology (US)
    • Restek (US)
    • Regis Technologies, Inc. (US)
    • Merck KGaA (Germany)
    • Loba Chemie Pvt. Ltd (India)
    • Kanto Chemical (Japan)
    • GFS Chemicals Inc (US)
    • Cytiva (US)
    • Chiron AS (Norway)
    • Bio-Rad Laboratories, Inc. (US)
    • Avantor (US)
    • Agilent Technologies, Inc. (US)
    • In 2019, CARLO ERBA Reagents (Italy), a producer of solvents for chromatography,extended its range of solvents for GC to meet the increasing demand from researchers for detection methods. CARLO ERBA Reagents offers a specific range of products dedicated to the GC-MS application with very high purity.

    By Technology

    • Gas Chromatography Reagents
    • Liquid Chromatography Reagents
    • Supercritical Fluid Chromatography Reagents
    • Thin-Layer Chromatography Reagents
    • Adsorption Chromatography
    • Partition Chromatography
    • Ion-Exchange Chromatography
    • Size-Exclusion Chromatography
    • Affinity Chromatography
    • Pharmaceutical Testing
    • Biopharma-Biotech Applications
    • Research & Academic Applications
    • Food & Beverage Testing
    • Clinical Testing
    • Others
    • North America:
    • Europe:
    • Asia-Pacific:
    • Rest of the World:
    • Waters Corporation (US)
    • Tosoh Bioscience (Japan)
    • Thermo Fisher Scientific (US)
    • Spectrum Chemical Mfg. Corp. (US)
    • Santa Cruz Biotechnology (US)
    • Restek (US)
    • Regis Technologies, Inc. (US)
    • Merck KGaA (Germany)
    • Loba Chemie Pvt. Ltd (India)
    • Kanto Chemical (Japan)
    • GFS Chemicals Inc (US)
    • Cytiva (US)
    • Chiron AS (Norway)
    • Bio-Rad Laboratories, Inc. (US)
    • Avantor (US)
    • Agilent Technologies, Inc. (US)
    • In 2019, CARLO ERBA Reagents (Italy), a producer of solvents for chromatography,extended its range of solvents for GC to meet the increasing demand from researchers for detection methods. CARLO ERBA Reagents offers a specific range of products dedicated to the GC-MS application with very high purity.

    By Application

    • Pharmaceutical Testing
    • Biopharma-Biotech Applications
    • Research & Academic Applications
    • Food & Beverage Testing
    • Clinical Testing
    • Others
    • North America:
    • Europe:
    • Asia-Pacific:
    • Rest of the World:
    • Waters Corporation (US)
    • Tosoh Bioscience (Japan)
    • Thermo Fisher Scientific (US)
    • Spectrum Chemical Mfg. Corp. (US)
    • Santa Cruz Biotechnology (US)
    • Restek (US)
    • Regis Technologies, Inc. (US)
    • Merck KGaA (Germany)
    • Loba Chemie Pvt. Ltd (India)
    • Kanto Chemical (Japan)
    • GFS Chemicals Inc (US)
    • Cytiva (US)
    • Chiron AS (Norway)
    • Bio-Rad Laboratories, Inc. (US)
    • Avantor (US)
    • Agilent Technologies, Inc. (US)
    • In 2019, CARLO ERBA Reagents (Italy), a producer of solvents for chromatography,extended its range of solvents for GC to meet the increasing demand from researchers for detection methods. CARLO ERBA Reagents offers a specific range of products dedicated to the GC-MS application with very high purity.

    Recent Developments

    • In 2019, CARLO ERBA Reagents (Italy), a producer of solvents for chromatography,extended its range of solvents for GC to meet the increasing demand from researchers for detection methods. CARLO ERBA Reagents offers a specific range of products dedicated to the GC-MS application with very high purity.

    Competitive Landscape

    • Waters Corporation (US)
    • Tosoh Bioscience (Japan)
    • Thermo Fisher Scientific (US)
    • Spectrum Chemical Mfg. Corp. (US)
    • Santa Cruz Biotechnology (US)
    • Restek (US)
    • Regis Technologies, Inc. (US)
    • Merck KGaA (Germany)
    • Loba Chemie Pvt. Ltd (India)
    • Kanto Chemical (Japan)
    • GFS Chemicals Inc (US)
    • Cytiva (US)
    • Chiron AS (Norway)
    • Bio-Rad Laboratories, Inc. (US)
    • Avantor (US)
    • Agilent Technologies, Inc. (US)
    • In 2019, CARLO ERBA Reagents (Italy), a producer of solvents for chromatography,extended its range of solvents for GC to meet the increasing demand from researchers for detection methods. CARLO ERBA Reagents offers a specific range of products dedicated to the GC-MS application with very high purity.

    By Separation Mechanism 

    • Adsorption Chromatography
    • Partition Chromatography
    • Ion-Exchange Chromatography
    • Size-Exclusion Chromatography
    • Affinity Chromatography
    • Pharmaceutical Testing
    • Biopharma-Biotech Applications
    • Research & Academic Applications
    • Food & Beverage Testing
    • Clinical Testing
    • Others
    • North America:
    • Europe:
    • Asia-Pacific:
    • Rest of the World:
    • Waters Corporation (US)
    • Tosoh Bioscience (Japan)
    • Thermo Fisher Scientific (US)
    • Spectrum Chemical Mfg. Corp. (US)
    • Santa Cruz Biotechnology (US)
    • Restek (US)
    • Regis Technologies, Inc. (US)
    • Merck KGaA (Germany)
    • Loba Chemie Pvt. Ltd (India)
    • Kanto Chemical (Japan)
    • GFS Chemicals Inc (US)
    • Cytiva (US)
    • Chiron AS (Norway)
    • Bio-Rad Laboratories, Inc. (US)
    • Avantor (US)
    • Agilent Technologies, Inc. (US)
    • In 2019, CARLO ERBA Reagents (Italy), a producer of solvents for chromatography,extended its range of solvents for GC to meet the increasing demand from researchers for detection methods. CARLO ERBA Reagents offers a specific range of products dedicated to the GC-MS application with very high purity.

    Chromatography Reagents Market Drivers

    • Increasing number of awards, grants, scholarships, and funding for chromatography research
    • Rising applications of chromatography reagents for drug development in oncology
    • Therapeutic drug monitoring and dose adjustment of drugs are beneficial in treating various cancer. For example, a research paper published in 2020 in Therapeutic Drug Monitoring aimed to validate a high-performance liquid chromatography (HPLC) method for routine serum lenvatinib detection in patients with thyroid cancer.A high number of methods are being developed by researchers based on various chromatographic techniques increasing the demand for chromatography reagents
    • Similarly, a clinical study published in Biomedical Chromatography during 2020 assessed various bioanalytical methods used for immuno-oncology drugs in cancer therapy. The most commonly used methods according to this study were HPLC and Liquid Chromatography-Mass Spectrometry (LC-MS).A higher frequency of chromatography-based techniques for quantitative analysis of drugs used for cancer is expected to propel the chromatography reagents market growth. Moreover, an increasing number of cancer patients is expected to support this growth. National Cancer Institute estimated 1,806,590 new cases of cancer in the US for 2020, while an estimated 16.9 million cancer survivors in the US.

    Chromatography Reagents Market Segment

    • Solvents
    • Buffers
    • Derivatization Reagents
    • Ion-Pair Reagents
    • Gas Chromatography Reagents
    • Liquid Chromatography Reagents
    • Supercritical Fluid Chromatography Reagents
    • Thin-Layer Chromatography Reagents
    • Adsorption Chromatography
    • Partition Chromatography
    • Ion-Exchange Chromatography
    • Size-Exclusion Chromatography
    • Affinity Chromatography
    • Pharmaceutical Testing
    • Biopharma-Biotech Applications
    • Research & Academic Applications
    • Food & Beverage Testing
    • Clinical Testing
    • Others
    • North America:
    • Europe:
    • Asia-Pacific:
    • Rest of the World:
    • Waters Corporation (US)
    • Tosoh Bioscience (Japan)
    • Thermo Fisher Scientific (US)
    • Spectrum Chemical Mfg. Corp. (US)
    • Santa Cruz Biotechnology (US)
    • Restek (US)
    • Regis Technologies, Inc. (US)
    • Merck KGaA (Germany)
    • Loba Chemie Pvt. Ltd (India)
    • Kanto Chemical (Japan)
    • GFS Chemicals Inc (US)
    • Cytiva (US)
    • Chiron AS (Norway)
    • Bio-Rad Laboratories, Inc. (US)
    • Avantor (US)
    • Agilent Technologies, Inc. (US)
    • In 2019, CARLO ERBA Reagents (Italy), a producer of solvents for chromatography,extended its range of solvents for GC to meet the increasing demand from researchers for detection methods. CARLO ERBA Reagents offers a specific range of products dedicated to the GC-MS application with very high purity.

    Chromatography Reagents Market Restraints

    • Shortage of supplies and reagents
    • Helium is widely utilized as the carrier gas for gas chromatography. Its applications include deep-sea diving, airbags, cryogenics, rocket fuel, and MRI machines.It is the gold standard for gas chromatography as it is safe, inert, and provides optimal run times for gas chromatography. The helium shortage, which startedin 2019 globally, can impede the growth of the chromatography reagents market. Owing to this,severalgas chromatography professionals are switching to hydrogen gas using a hydrogen generator as their carrier gas supply.
    • The commonly used organic solvents for mobile phases in reverse chromatography are probably acetonitrile and methanol. The analytical industry experienceda severeacetonitrile shortage during the first half of 2020. Waters Corporation (US) has recommended replacing traditional high-performance HPLC with Waters ACQUITY UltraPerformance LC,which reduces acetonitrile consumption by at least 70%. The shortage of necessary supplies is anticipated to curb the growth of the chromatography reagents market.

    Chromatography Reagents Market Opportunities

    • Growing applications of chromatography
    • Value Chain Analysis

    Global Chromatography Reagents Market, by Type

    • Other
    • Ion-Pair Reagents
    • Derivatization Reagents
    • Buffers
    • Solvents

    Global Chromatography Reagents Market, by Region

    • Rest of the World
    • Middle East
    • Africa
    • Latin America
    • Asia-Pacific
    • China
    • Japan
    • India
    • Australia
    • South Korea
    • Rest of Asia-Pacific
    • Europe
    • Germany
    • France
    • UK
    • Italy
    • Spain
    • Rest of Europe
    • North America
    • US
    • Canada

    Global Chromatography Reagents Market, by Technology

    • Others
    • Thin Layer Chromatography Reagents
    • Supercritical Fluid Chromatography Reagents
    • Liquid Chromatography Reagents
    • Gas Chromatography Reagents

    Global Chromatography Reagents Market, by Application

    • Others
    • Clinical Testing
    • Food & Beverage Testing
    • Research & Academic Applications
    • Biopharma-Biotech Applications
    • Pharmaceutical Testing

    Global Chromatography Reagents Market, by Separation Mechanism

    • Others
    • Affinity Chromatography
    • Size-Exclusion Chromatography
    • Ion-Exchange Chromatography
    • Partition Chromatography
    • Adsorption Chromatography

    Report Scope

    Report Attribute/Metric Details
      Market Size   2032: USD 13.7 Billion
      CAGR   6.1%
      Base Year   2020
      Forecast Period   2023-2032
      Historical Data   2018 & 2019
      Forecast Units   Value (USD Million)
      Report Coverage   Revenue Forecast, Competitive Landscape, Growth Factors, and Trends
      Segments Covered   Type, Technology, Separation Mechanism, Application
      Geographies Covered   North America, Europe, AsNorth America, Europe, Asia-Pacific, Rest of the Worldia-Pacific, Rest of the World
      Key Vendors   • Agilent Technologies, Inc. (US) • Avantor (US) • Bio-Rad Laboratories, Inc. (US) • Chiron AS (Norway) • Cytiva (US) • GFS Chemicals Inc (US) • Kanto Chemical (Japan) • Loba Chemie Pvt. Ltd. (India) • Merck KGaA (Germany) • Regis Technologies, Inc. (US) • Restek (US) • Santa Cruz Biotechnology (US) • Spectrum Chemical Mfg. Corp. (US) • Thermo Fisher Scientific (US) • Tosoh Bioscience (Japan) • Waters Corporation (US)
      Key Market Opportunities   Development of cell banks in developing countries
      Key Market Drivers   • Growing utilization of chromatography in drug development • Rising number of strategic decisions by manufacturers

    Market Highlights

    Author

    Kinjoll Dey
    Research Analyst Level I

    She holds an experience of about 6+ years in market research and business consulting, working under the spectrum of information communication technology, telecommunications and semiconductor domains. aarti conceptualizes and implements a scalable business strategy and provides strategic leadership to the clients. her expertise lies in market estimation, competitive intelligence, pipeline analysis, customer assessment, etc.

    Leave a Comment

    Latest Comments

    John Doe
    john@example.com

    This is a great article! Really helped me understand the topic better.

    Posted on July 23, 2025, 10:15 AM
    Jane Smith
    jane@domain.com

    Thanks for sharing this. I’ve bookmarked it for later reference.

    Posted on July 22, 2025, 7:45 PM

    FAQs

    1. . EXECUTIVE SUMMARY
    2. . MARKET INTRODUCTION
    3. . Definition
    4. . Scope of the Study
    5. . Research Objective
    6. . Assumptions
    7. . Limitations
    8. . RESEARCH METHODOLOGY
    9. . Overview
    10. . Data Mining
    11. . Secondary Research
    12. . Primary Research
    13. . Primary Interviews and Information Gathering Process
    14. . Breakdown of Primary Respondents
    15. . Forecasting Techniques
    16. . Market Size Estimation
    17. . Bottom-Up Approach
    18. . Top-Down Approach
    19. . Data Triangulation
    20. . Validation
    21. . MARKET DYNAMICS
    22. . Overview
    23. . Drivers
    24. . Restraints
    25. . Opportunities
    26. . MARKET FACTOR ANALYSIS
    27. . Porter’s Five Forces Analysis
    28. . Bargaining Power of Suppliers
    29. . Bargaining Power of Buyers
    30. . Threat of New Entrants
    31. . Threat of Substitutes
    32. . Intensity of Rivalry
    33. . Value Chain Analysis
    34. . COVID-19 Impact Analysis
    35. . Market Impact Analysis
    36. . Impact on R&D
    37. . Regional Impact
    38. . Impact on Market Growth
    39. . GLOBAL CHROMATOGRAPHY REAGENTS MARKET, BY TYPE
    40. . Overview
    41. . Solvents Market Estimates & Forecast, by Region, 2023–2032 Market Estimates & Forecast, by Country, 2023–2032
    42. . Buffers Market Estimates & Forecast, by Region, 2023–2032 Market Estimates & Forecast, by Country, 2023–2032
    43. . Derivatization Reagents Market Estimates & Forecast, by Region, 2023–2032 Market Estimates & Forecast, by Country, 2023–2032
    44. . Ion-Pair Reagents Market Estimates & Forecast, by Region, 2023–2032 Market Estimates & Forecast, by Country, 2023–2032
    45. . Other Market Estimates & Forecast, by Region, 2023–2032 Market Estimates & Forecast, by Country, 2023–2032
    46. . GLOBAL CHROMATOGRAPHY REAGENTS MARKET, BY TECHNOLOGY
    47. . Overview
    48. . Gas Chromatography Reagents Market Estimates & Forecast, by Region, 2023–2032 Market Estimates & Forecast, by Country, 2023–2032
    49. . Liquid ChromatographyReagents Market Estimates & Forecast, by Region, 2023–2032 Market Estimates & Forecast, by Country, 2023–2032
    50. . Supercritical Fluid Chromatography Reagents Market Estimates & Forecast, by Region, 2023–2032 Market Estimates & Forecast, by Country, 2023–2032
    51. . Thin Layer Chromatography Reagents Market Estimates & Forecast, by Region, 2023–2032 Market Estimates & Forecast, by Country, 2023–2032
    52. . Others Market Estimates & Forecast, by Region, 2023–2032 Market Estimates & Forecast, by Country, 2023–2032
    53. . GLOBAL CHROMATOGRAPHY REAGENTS MARKET, BY SEPARATION MECHANISM
    54. . Overview
    55. . Adsorption Chromatography Market Estimates & Forecast, by Region, 2023–2032 Market Estimates & Forecast, by Country, 2023–2032
    56. . Partition Chromatography Market Estimates & Forecast, by Region, 2023–2032 Market Estimates & Forecast, by Country, 2023–2032
    57. . Ion-Exchange Chromatography Market Estimates & Forecast, by Region, 2023–2032 Market Estimates & Forecast, by Country, 2023–2032
    58. . Size-Exclusion Chromatography Market Estimates & Forecast, by Region, 2023–2032 Market Estimates & Forecast, by Country, 2023–2032
    59. . Affinity Chromatography Market Estimates & Forecast, by Region, 2023–2032 Market Estimates & Forecast, by Country, 2023–2032
    60. . Others Market Estimates & Forecast, by Region, 2023–2032 Market Estimates & Forecast, by Country, 2023–2032
    61. . GLOBAL CHROMATOGRAPHY REAGENTS MARKET, BY APPLICATION
    62. . Overview
    63. . Pharmaceutical Testing Market Estimates & Forecast, by Region, 2023–2032 Market Estimates & Forecast, by Country, 2023–2032
    64. . Biopharma-Biotech Applications Market Estimates & Forecast, by Region, 2023–2032 Market Estimates & Forecast, by Country, 2023–2032
    65. . Research & Academic Applications Market Estimates & Forecast, by Region, 2023–2032 Market Estimates & Forecast, by Country, 2023–2032
    66. . Food & Beverage Testing Market Estimates & Forecast, by Region, 2023–2032 Market Estimates & Forecast, by Country, 2023–2032
    67. . Clinical Testing Market Estimates & Forecast, by Region, 2023–2032 Market Estimates & Forecast, by Country, 2023–2032
    68. . Others Market Estimates & Forecast, by Region, 2023–2032 Market Estimates & Forecast, by Country, 2023–2032
    69. . GLOBAL CHROMATOGRAPHY REAGENTS MARKET, BY REGION
    70. . Overview
    71. . North America
    72. . US
    73. . Canada
    74. . Europe
    75. . Germany
    76. . France
    77. . Italy
    78. . Spain
    79. . UK
    80. . Rest of Europe
    81. . Asia-Pacific
    82. . Japan
    83. . China
    84. . India
    85. . Australia
    86. . South Korea
    87. . Rest of Asia-Pacific
    88. . Rest of the World
    89. . Middle East
    90. . Africa
    91. . Latin America
    92. . COMPANY LANDSCAPE
    93. . Overview
    94. . Competitive Analysis
    95. . Market Share Analysis
    96. . Major Growth Strategy in the Global Chromatography Reagents Market
    97. . Competitive Benchmarking
    98. . Leading Players in Terms of Number of Developments in the Global Chromatography Reagents Market
    99. . Key developments and Growth Strategies
    100. . New Product Launch/Service Deployment
    101. . Merger &Acquisitions
    102. . Joint Ventures
    103. . Major Players Financial Matrix
    104. . Sales & Operating Income, 2020
    105. . Major Players R&D Expenditure, 2020
    106. . COMPANY PROFILES
    107. . Agilent Technologies, Inc.
    108. . Company Overview
    109. . Products Offered
    110. . Financial Overview
    111. . Key Developments
    112. . SWOT Analysis
    113. . Key Strategies
    114. . Avantor
    115. . Company Overview
    116. . ProductsOffered
    117. . Financial Overview
    118. . Key Developments
    119. . SWOT Analysis
    120. . Key Strategies
    121. . Bio-Rad Laboratories, Inc.
    122. . Company Overview
    123. . Products Offered
    124. . Financial Overview
    125. . Key Developments
    126. . SWOT Analysis
    127. . Key Strategies
    128. . Chiron AS
    129. . Company Overview
    130. . Products Offered
    131. . Financial Overview
    132. . Key Developments
    133. . SWOT Analysis
    134. . Key Strategies
    135. . Cytiva
    136. . Company Overview
    137. . Products Offered
    138. . Financial Overview
    139. . Key Developments
    140. . SWOT Analysis
    141. . Key Strategies
    142. . GFS Chemicals Inc
    143. . Company Overview
    144. . Products Offered
    145. . Financial Overview
    146. . Key Developments
    147. . SWOT Analysis
    148. . Key Strategies
    149. . Kanto Chemical
    150. . Company Overview
    151. . Products Offered
    152. . Financial Overview
    153. . Key Developments
    154. . SWOT Analysis
    155. . Key Strategies
    156. . Loba Chemie Pvt. Ltd
    157. . Company Overview
    158. . Products Offered
    159. . Financial Overview
    160. . Key Developments
    161. . SWOT Analysis
    162. . Key Strategies
    163. . Merck KGaA
    164. . Company Overview
    165. . Products Offered
    166. . Financial Overview
    167. . Key Developments
    168. . SWOT Analysis
    169. . Key Strategies
    170. . Regis Technologies, Inc.
    171. . Company Overview
    172. . Products Offered
    173. . Financial Overview
    174. . Key Developments
    175. . SWOT Analysis
    176. . Key Strategies
    177. . Restek
    178. . Company Overview
    179. . Products Offered
    180. . Financial Overview
    181. . Key Developments
    182. . SWOT Analysis
    183. . Key Strategies
    184. . Santa Cruz Biotechnology
    185. . Company Overview
    186. . Products Offered
    187. . Financial Overview
    188. . Key Developments
    189. . SWOT Analysis
    190. . Key Strategies
    191. . Spectrum Chemical Mfg. Corp.
    192. . Company Overview
    193. . Products Offered
    194. . Financial Overview
    195. . Key Developments
    196. . SWOT Analysis
    197. . Key Strategies
    198. . Thermo Fisher Scientific
    199. . Company Overview
    200. . Products Offered
    201. . Financial Overview
    202. . Key Developments
    203. . SWOT Analysis
    204. . Key Strategies
    205. . Tosoh Bioscience
    206. . Company Overview
    207. . Products Offered
    208. . Financial Overview
    209. . Key Developments
    210. . SWOT Analysis
    211. . Key Strategies
    212. . APPENDIX
    213. . References
    214. . Related Reports   LIST OF TABLES TABLE 1 GLOBAL CHROMATOGRAPHY REAGENTS MARKET SYNOPSIS, 2023–2032 TABLE 2 GLOBAL CHROMATOGRAPHY REAGENTS MARKET ESTIMATES &FORECAST, 2023–2032(USD MILLION) TABLE 3 GLOBAL CHROMATOGRAPHY REAGENTS MARKET, BYTYPE, 2023–2032 (USD MILLION) TABLE 4 GLOBAL CHROMATOGRAPHY REAGENTS MARKET, BY TECHNOLOGY, 2023–2032 (USD MILLION) TABLE 5 GLOBAL CHROMATOGRAPHY REAGENTS MARKET, BY SEPARATION MECHANISM, 2023–2032 (USD MILLION) TABLE 6 GLOBAL CHROMATOGRAPHY REAGENTS MARKET, BY APPLICATION, 2023–2032 (USD MILLION) TABLE 7 GLOBAL CHROMATOGRAPHY REAGENTS MARKET, BY REGION, 2023–2032 (USD MILLION) TABLE 8 NORTH AMERICA: CHROMATOGRAPHY REAGENTS MARKET, BY REGION, 2023–2032 (USD MILLION) TABLE 9 NORTH AMERICA: CHROMATOGRAPHY REAGENTS MARKET, BY TYPE, 2023–2032 (USD MILLION) TABLE 10 NORTH AMERICA:CHROMATOGRAPHY REAGENTS MARKET, BY TECHNOLOGY, 2023–2032 (USD MILLION) TABLE 11 NORTH AMERICA: CHROMATOGRAPHY REAGENTS MARKET, BY SEPARATION MECHANISM, 2023–2032 (USD MILLION) TABLE 12 NORTH AMERICA: CHROMATOGRAPHY REAGENTS MARKET, BY APPLICATION, 2023–2032 (USD MILLION) TABLE 13 US: CHROMATOGRAPHY REAGENTS MARKET, BY TYPE, 2023–2032 (USD MILLION) TABLE 14 US:CHROMATOGRAPHY REAGENTS MARKET, BY TECHNOLOGY, 2023–2032 (USD MILLION) TABLE 15 US: CHROMATOGRAPHY REAGENTS MARKET, BY SEPARATION MECHANISM, 2023–2032 (USD MILLION) TABLE 16 US: CHROMATOGRAPHY REAGENTS MARKET, BY APPLICATION, 2023–2032 (USD MILLION) TABLE 17 CANADA: CHROMATOGRAPHY REAGENTS MARKET, BY TYPE, 2023–2032 (USD MILLION) TABLE 18 CANADA:CHROMATOGRAPHY REAGENTS MARKET, BY TECHNOLOGY, 2023–2032 (USD MILLION) TABLE 19 CANADA: CHROMATOGRAPHY REAGENTS MARKET, BY SEPARATION MECHANISM, 2023–2032 (USD MILLION) TABLE 20 CANADA: CHROMATOGRAPHY REAGENTS MARKET, BY APPLICATION, 2023–2032 (USD MILLION) TABLE 21 EUROPE: CHROMATOGRAPHY REAGENTS MARKET, BY REGION, 2023–2032 (USD MILLION) TABLE 22 EUROPE: CHROMATOGRAPHY REAGENTS MARKET, BY TYPE, 2023–2032 (USD MILLION) TABLE 23 EUROPE:CHROMATOGRAPHY REAGENTS MARKET, BY TECHNOLOGY, 2023–2032 (USD MILLION) TABLE 24 EUROPE: CHROMATOGRAPHY REAGENTS MARKET, BY SEPARATION MECHANISM, 2023–2032 (USD MILLION) TABLE 25 EUROPE: CHROMATOGRAPHY REAGENTS MARKET, BY APPLICATION, 2023–2032 (USD MILLION) TABLE 26 GERMANY: CHROMATOGRAPHY REAGENTS MARKET, BY TYPE, 2023–2032 (USD MILLION) TABLE 27 GERMANY:CHROMATOGRAPHY REAGENTS MARKET, BY TECHNOLOGY, 2023–2032 (USD MILLION) TABLE 28 GERMANY: CHROMATOGRAPHY REAGENTS MARKET, BY SEPARATION MECHANISM, 2023–2032 (USD MILLION) TABLE 29 GERMANY: CHROMATOGRAPHY REAGENTS MARKET, BY APPLICATION, 2023–2032 (USD MILLION) TABLE 30 UK: CHROMATOGRAPHY REAGENTS MARKET, BY TYPE, 2023–2032 (USD MILLION) TABLE 31 UK:CHROMATOGRAPHY REAGENTS MARKET, BY TECHNOLOGY, 2023–2032 (USD MILLION) TABLE 32 UK: CHROMATOGRAPHY REAGENTS MARKET, BY SEPARATION MECHANISM, 2023–2032 (USD MILLION) TABLE 33 UK: CHROMATOGRAPHY REAGENTS MARKET, BY APPLICATION, 2023–2032 (USD MILLION) TABLE 34 FRANCE: CHROMATOGRAPHY REAGENTS MARKET, BY TYPE, 2023–2032 (USD MILLION) TABLE 35 FRANCE:CHROMATOGRAPHY REAGENTS MARKET, BY TECHNOLOGY, 2023–2032 (USD MILLION) TABLE 36 FRANCE: CHROMATOGRAPHY REAGENTS MARKET, BY SEPARATION MECHANISM, 2023–2032 (USD MILLION) TABLE 37 FRANCE: CHROMATOGRAPHY REAGENTS MARKET, BY APPLICATION, 2023–2032 (USD MILLION) TABLE 38 ITALY: CHROMATOGRAPHY REAGENTS MARKET, BY TYPE, 2023–2032 (USD MILLION) TABLE 39 ITALY:CHROMATOGRAPHY REAGENTS MARKET, BY TECHNOLOGY, 2023–2032 (USD MILLION) TABLE 40 ITALY: CHROMATOGRAPHY REAGENTS MARKET, BY SEPARATION MECHANISM, 2023–2032 (USD MILLION) TABLE 41 ITALY: CHROMATOGRAPHY REAGENTS MARKET, BY APPLICATION, 2023–2032 (USD MILLION) TABLE 42 SPAIN: CHROMATOGRAPHY REAGENTS MARKET, BY TYPE, 2023–2032 (USD MILLION) TABLE 43 SPAIN:CHROMATOGRAPHY REAGENTS MARKET, BY TECHNOLOGY, 2023–2032 (USD MILLION) TABLE 44 SPAIN: CHROMATOGRAPHY REAGENTS MARKET, BY SEPARATION MECHANISM, 2023–2032 (USD MILLION) TABLE 45 SPAIN: CHROMATOGRAPHY REAGENTS MARKET, BY APPLICATION, 2023–2032 (USD MILLION) TABLE 46 REST OF EUROPE: CHROMATOGRAPHY REAGENTS MARKET, BY TYPE, 2023–2032 (USD MILLION) TABLE 47 REST OF EUROPE:CHROMATOGRAPHY REAGENTS MARKET, BY TECHNOLOGY, 2023–2032 (USD MILLION) TABLE 48 REST OF EUROPE: CHROMATOGRAPHY REAGENTS MARKET, BY SEPARATION MECHANISM, 2023–2032 (USD MILLION) TABLE 49 REST OF EUROPE: CHROMATOGRAPHY REAGENTS MARKET, BY APPLICATION, 2023–2032 (USD MILLION) TABLE 50 ASIA-PACIFIC: CHROMATOGRAPHY REAGENTS MARKET, BY REGION, 2023–2032 (USD MILLION) TABLE 51 ASIA-PACIFIC: CHROMATOGRAPHY REAGENTS MARKET, BY TYPE, 2023–2032 (USD MILLION) TABLE 52 ASIA-PACIFIC:CHROMATOGRAPHY REAGENTS MARKET, BY TECHNOLOGY, 2023–2032 (USD MILLION) TABLE 53 ASIA-PACIFIC: CHROMATOGRAPHY REAGENTS MARKET, BY SEPARATION MECHANISM, 2023–2032 (USD MILLION) TABLE 54 ASIA-PACIFIC: CHROMATOGRAPHY REAGENTS MARKET, BY APPLICATION, 2023–2032 (USD MILLION) TABLE 55 INDIA: CHROMATOGRAPHY REAGENTS MARKET, BY TYPE, 2023–2032 (USD MILLION) TABLE 56 INDIA:CHROMATOGRAPHY REAGENTS MARKET, BY TECHNOLOGY, 2023–2032 (USD MILLION) TABLE 57 INDIA: CHROMATOGRAPHY REAGENTS MARKET, BY SEPARATION MECHANISM, 2023–2032 (USD MILLION) TABLE 58 INDIA: CHROMATOGRAPHY REAGENTS MARKET, BY APPLICATION, 2023–2032 (USD MILLION) TABLE 59 CHINA: CHROMATOGRAPHY REAGENTS MARKET, BY TYPE, 2023–2032 (USD MILLION) TABLE 60 CHINA:CHROMATOGRAPHY REAGENTS MARKET, BY TECHNOLOGY, 2023–2032 (USD MILLION) TABLE 61 CHINA: CHROMATOGRAPHY REAGENTS MARKET, BY SEPARATION MECHANISM, 2023–2032 (USD MILLION) TABLE 62 CHINA: CHROMATOGRAPHY REAGENTS MARKET, BY APPLICATION, 2023–2032 (USD MILLION) TABLE 63 JAPAN: CHROMATOGRAPHY REAGENTS MARKET, BY TYPE, 2023–2032 (USD MILLION) TABLE 64 JAPAN:CHROMATOGRAPHY REAGENTS MARKET, BY TECHNOLOGY, 2023–2032 (USD MILLION) TABLE 65 JAPAN: CHROMATOGRAPHY REAGENTS MARKET, BY SEPARATION MECHANISM, 2023–2032 (USD MILLION) TABLE 66 JAPAN: CHROMATOGRAPHY REAGENTS MARKET, BY APPLICATION, 2023–2032 (USD MILLION) TABLE 67 SOUTH KOREA: CHROMATOGRAPHY REAGENTS MARKET, BY TYPE, 2023–2032 (USD MILLION) TABLE 68 SOUTH KOREA:CHROMATOGRAPHY REAGENTS MARKET, BY TECHNOLOGY, 2023–2032 (USD MILLION) TABLE 69 SOUTH KOREA: CHROMATOGRAPHY REAGENTS MARKET, BY SEPARATION MECHANISM, 2023–2032 (USD MILLION) TABLE 70 SOUTH KOREA: CHROMATOGRAPHY REAGENTS MARKET, BY APPLICATION, 2023–2032 (USD MILLION) TABLE 71 AUSTRALIA: CHROMATOGRAPHY REAGENTS MARKET, BY TYPE, 2023–2032 (USD MILLION) TABLE 72 AUSTRALIA:CHROMATOGRAPHY REAGENTS MARKET, BY TECHNOLOGY, 2023–2032 (USD MILLION) TABLE 73 AUSTRALIA: CHROMATOGRAPHY REAGENTS MARKET, BY SEPARATION MECHANISM, 2023–2032 (USD MILLION) TABLE 74 AUSTRALIA: CHROMATOGRAPHY REAGENTS MARKET, BY APPLICATION, 2023–2032 (USD MILLION) TABLE 75 REST OF ASIA-PACIFIC: CHROMATOGRAPHY REAGENTS MARKET, BY TYPE, 2023–2032 (USD MILLION) TABLE 76 REST OF ASIA-PACIFIC:CHROMATOGRAPHY REAGENTS MARKET, BY TECHNOLOGY, 2023–2032 (USD MILLION) TABLE 77 REST OF ASIA-PACIFIC: CHROMATOGRAPHY REAGENTS MARKET, BY SEPARATION MECHANISM, 2023–2032 (USD MILLION) TABLE 78 REST OF ASIA-PACIFIC: CHROMATOGRAPHY REAGENTS MARKET, BY APPLICATION, 2023–2032 (USD MILLION) TABLE 79 REST OF THE WORLD: CHROMATOGRAPHY REAGENTS MARKET, BY REGION, 2023–2032 (USD MILLION) TABLE 80 REST OF THE WORLD: CHROMATOGRAPHY REAGENTS MARKET, BY TYPE, 2023–2032 (USD MILLION) TABLE 81 REST OF THE WORLD:CHROMATOGRAPHY REAGENTS MARKET, BY TECHNOLOGY, 2023–2032 (USD MILLION) TABLE 82 REST OF THE WORLD: CHROMATOGRAPHY REAGENTS MARKET, BY SEPARATION MECHANISM, 2023–2032 (USD MILLION) TABLE 83 REST OF THE WORLD: CHROMATOGRAPHY REAGENTS MARKET, BY APPLICATION, 2023–2032 (USD MILLION) TABLE 84 MIDDLE EAST: CHROMATOGRAPHY REAGENTS MARKET, BY TYPE, 2023–2032 (USD MILLION) TABLE 85 MIDDLE EAST:CHROMATOGRAPHY REAGENTS MARKET, BY TECHNOLOGY, 2023–2032 (USD MILLION) TABLE 86 MIDDLE EAST: CHROMATOGRAPHY REAGENTS MARKET, BY SEPARATION MECHANISM, 2023–2032 (USD MILLION) TABLE 87 MIDDLE EAST: CHROMATOGRAPHY REAGENTS MARKET, BY APPLICATION, 2023–2032 (USD MILLION) TABLE 88 AFRICA: CHROMATOGRAPHY REAGENTS MARKET, BY TYPE, 2023–2032 (USD MILLION) TABLE 89 AFRICA:CHROMATOGRAPHY REAGENTS MARKET, BY TECHNOLOGY, 2023–2032 (USD MILLION) TABLE 90 AFRICA: CHROMATOGRAPHY REAGENTS MARKET, BY SEPARATION MECHANISM, 2023–2032 (USD MILLION) TABLE 91 AFRICA: CHROMATOGRAPHY REAGENTS MARKET, BY APPLICATION, 2023–2032 (USD MILLION) TABLE 92 LATIN AMERICA: CHROMATOGRAPHY REAGENTS MARKET, BY TYPE, 2023–2032 (USD MILLION) TABLE 93 LATIN AMERICA:CHROMATOGRAPHY REAGENTS MARKET, BY TECHNOLOGY, 2023–2032 (USD MILLION) TABLE 94 LATIN AMERICA: CHROMATOGRAPHY REAGENTS MARKET, BY SEPARATION MECHANISM, 2023–2032 (USD MILLION) TABLE 95 LATIN AMERICA: CHROMATOGRAPHY REAGENTS MARKET, BY APPLICATION, 2023–2032 (USD MILLION) LIST OF FIGURES FIGURE 1 RESEARCH PROCESS FIGURE 2 MARKET STRUCTURE FOR THE GLOBAL CHROMATOGRAPHY REAGENTS MARKET FIGURE 3 MARKET DYNAMICS FOR THE GLOBAL CHROMATOGRAPHY REAGENTS MARKET FIGURE 4 GLOBAL CHROMATOGRAPHY REAGENTS MARKET SHARE, BY TYPE, 2020 (%) FIGURE 5 GLOBAL CHROMATOGRAPHY REAGENTS MARKET SHARE, BY TECHNOLOGY, 2020 (%) FIGURE 6 GLOBAL CHROMATOGRAPHY REAGENTS MARKET SHARE, BY SEPARATION MECHANISM,2020 (%) FIGURE 7 GLOBAL CHROMATOGRAPHY REAGENTS MARKET SHARE, BY APPLICATION, 2020 (%) FIGURE 8 GLOBAL CHROMATOGRAPHY REAGENTS MARKET SHARE, BY REGION, 2020 (%) FIGURE 9 NORTH AMERICA: CHROMATOGRAPHY REAGENTS MARKET SHARE, BY REGION, 2020 (%) FIGURE 10 EUROPE: CHROMATOGRAPHY REAGENTS MARKET SHARE, BY REGION, 2020 (%) FIGURE 11 ASIA-PACIFIC: CHROMATOGRAPHY REAGENTS MARKET SHARE, BY REGION, 2020 (%) FIGURE 12 REST OF THE WORLD: CHROMATOGRAPHY REAGENTS MARKET SHARE, BY REGION, 2020 (%) FIGURE 13 GLOBAL CHROMATOGRAPHY REAGENTS MARKET: COMPANY SHARE ANALYSIS, 2020 (%) FIGURE 14 AGILENT TECHNOLOGIES, INC.: KEY FINANCIALS FIGURE 15 AGILENT TECHNOLOGIES, INC.: SWOT ANALYSIS FIGURE 16 AGILENT TECHNOLOGIES, INC.: REGIONAL REVENUE FIGURE 17 AVANTOR: KEY FINANCIALS FIGURE 18 AVANTOR: SWOT ANALYSIS FIGURE 19 AVANTOR: REGIONAL REVENUE FIGURE 20 BIO-RAD LABORATORIES, INC.: KEY FINANCIALS FIGURE 21 BIO-RAD LABORATORIES, INC.: SWOT ANALYSIS FIGURE 22 BIO-RAD LABORATORIES, INC.: REGIONAL REVENUE FIGURE 23 CHIRON AS: KEY FINANCIALS FIGURE 24 CHIRON AS: SWOT ANALYSIS FIGURE 25 CHIRON AS: REGIONAL REVENUE FIGURE 26 CYTIVA: KEY FINANCIALS FIGURE 27 CYTIVA: SWOT ANALYSIS FIGURE 28 CYTIVA: REGIONAL REVENUE FIGURE 29 GFS CHEMICALS INC: KEY FINANCIALS FIGURE 30 GFS CHEMICALS INC: SWOT ANALYSIS FIGURE 31 GFS CHEMICALS INC: REGIONAL REVENUE FIGURE 32 KANTO CHEMICAL: KEY FINANCIALS FIGURE 33 KANTO CHEMICAL: SWOT ANALYSIS FIGURE 34 KANTO CHEMICAL: REGIONAL REVENUE FIGURE 35 LOBA CHEMIE PVT. LTD: KEY FINANCIALS FIGURE 36 LOBA CHEMIE PVT. LTD: SWOT ANALYSIS FIGURE 37 LOBA CHEMIE PVT. LTD: SWOT ANALYSIS FIGURE 38 MERCK KGAA: KEY FINANCIALS FIGURE 39 MERCK KGAA: SWOT ANALYSIS FIGURE 40 MERCK KGAA: REGIONAL REVENUE FIGURE 41 REGIS TECHNOLOGIES, INC.: KEY FINANCIALS FIGURE 42 REGIS TECHNOLOGIES, INC.: SWOT ANALYSIS FIGURE 43 REGIS TECHNOLOGIES, INC.: REGIONAL REVENUE FIGURE 44 RESTEK: KEY FINANCIALS FIGURE 45 RESTEK: SWOT ANALYSIS FIGURE 46 RESTEK: REGIONAL REVENUE FIGURE 47 SANTA CRUZ BIOTECHNOLOGY: KEY FINANCIALS FIGURE 48 SANTA CRUZ BIOTECHNOLOGY: SWOT ANALYSIS FIGURE 49 SANTA CRUZ BIOTECHNOLOGY: REGIONAL REVENUE FIGURE 50 SPECTRUM CHEMICAL MFG. CORP: KEY FINANCIALS FIGURE 51 SPECTRUM CHEMICAL MFG. CORP.: SWOT ANALYSIS FIGURE 52 SPECTRUM CHEMICAL MFG. CORP.: REGIONAL REVENUE FIGURE 53 THERMO FISHER SCIENTIFIC: KEY FINANCIALS FIGURE 54 THERMO FISHER SCIENTIFIC: SWOT ANALYSIS FIGURE 55 THERMO FISHER SCIENTIFIC: REGIONAL REVENUE FIGURE 56 TOSOH BIOSCIENCE: KEY FINANCIALS FIGURE 57 TOSOH BIOSCIENCE: SWOT ANALYSIS FIGURE 58 TOSOH BIOSCIENCE: REGIONAL REVENUE FIGURE 59 WATERS CORPORATION: KEY FINANCIALS FIGURE 60 WATERS CORPORATION: SWOT ANALYSIS FIGURE 61 WATERS CORPORATION: REGIONAL REVENUE
    215. List of Tables and Figures
      1. Table FIGURE 1 RESEARCH PROCESS FIGURE 2 MARKET STRUCTURE FOR THE GLOBAL CHROMATOGRAPHY REAGENTS MARKET FIGURE 3 MARKET DYNAMICS FOR THE GLOBAL CHROMATOGRAPHY REAGENTS MARKET FIGURE 4 GLOBAL CHROMATOGRAPHY REAGENTS MARKET SHARE, BY TYPE, 2020 (%) FIGURE 5 GLOBAL CHROMATOGRAPHY REAGENTS MARKET SHARE, BY TECHNOLOGY, 2020 (%) FIGURE 6 GLOBAL CHROMATOGRAPHY REAGENTS MARKET SHARE, BY SEPARATION MECHANISM,2020 (%) FIGURE 7 GLOBAL CHROMATOGRAPHY REAGENTS MARKET SHARE, BY APPLICATION, 2020 (%) FIGURE 8 GLOBAL CHROMATOGRAPHY REAGENTS MARKET SHARE, BY REGION, 2020 (%) FIGURE 9 NORTH AMERICA: CHROMATOGRAPHY REAGENTS MARKET SHARE, BY REGION, 2020 (%) FIGURE 10 EUROPE: CHROMATOGRAPHY REAGENTS MARKET SHARE, BY REGION, 2020 (%) FIGURE 11 ASIA-PACIFIC: CHROMATOGRAPHY REAGENTS MARKET SHARE, BY REGION, 2020 (%) FIGURE 12 REST OF THE WORLD: CHROMATOGRAPHY REAGENTS MARKET SHARE, BY REGION, 2020 (%) FIGURE 13 GLOBAL CHROMATOGRAPHY REAGENTS MARKET: COMPANY SHARE ANALYSIS, 2020 (%) FIGURE 14 AGILENT TECHNOLOGIES, INC.: KEY FINANCIALS FIGURE 15 AGILENT TECHNOLOGIES, INC.: SWOT ANALYSIS FIGURE 16 AGILENT TECHNOLOGIES, INC.: REGIONAL REVENUE FIGURE 17 AVANTOR: KEY FINANCIALS FIGURE 18 AVANTOR: SWOT ANALYSIS FIGURE 19 AVANTOR: REGIONAL REVENUE FIGURE 20 BIO-RAD LABORATORIES, INC.: KEY FINANCIALS FIGURE 21 BIO-RAD LABORATORIES, INC.: SWOT ANALYSIS FIGURE 22 BIO-RAD LABORATORIES, INC.: REGIONAL REVENUE FIGURE 23 CHIRON AS: KEY FINANCIALS FIGURE 24 CHIRON AS: SWOT ANALYSIS FIGURE 25 CHIRON AS: REGIONAL REVENUE FIGURE 26 CYTIVA: KEY FINANCIALS FIGURE 27 CYTIVA: SWOT ANALYSIS FIGURE 28 CYTIVA: REGIONAL REVENUE FIGURE 29 GFS CHEMICALS INC: KEY FINANCIALS FIGURE 30 GFS CHEMICALS INC: SWOT ANALYSIS FIGURE 31 GFS CHEMICALS INC: REGIONAL REVENUE FIGURE 32 KANTO CHEMICAL: KEY FINANCIALS FIGURE 33 KANTO CHEMICAL: SWOT ANALYSIS FIGURE 34 KANTO CHEMICAL: REGIONAL REVENUE FIGURE 35 LOBA CHEMIE PVT. LTD: KEY FINANCIALS FIGURE 36 LOBA CHEMIE PVT. LTD: SWOT ANALYSIS FIGURE 37 LOBA CHEMIE PVT. LTD: SWOT ANALYSIS FIGURE 38 MERCK KGAA: KEY FINANCIALS FIGURE 39 MERCK KGAA: SWOT ANALYSIS FIGURE 40 MERCK KGAA: REGIONAL REVENUE FIGURE 41 REGIS TECHNOLOGIES, INC.: KEY FINANCIALS FIGURE 42 REGIS TECHNOLOGIES, INC.: SWOT ANALYSIS FIGURE 43 REGIS TECHNOLOGIES, INC.: REGIONAL REVENUE FIGURE 44 RESTEK: KEY FINANCIALS FIGURE 45 RESTEK: SWOT ANALYSIS FIGURE 46 RESTEK: REGIONAL REVENUE FIGURE 47 SANTA CRUZ BIOTECHNOLOGY: KEY FINANCIALS FIGURE 48 SANTA CRUZ BIOTECHNOLOGY: SWOT ANALYSIS FIGURE 49 SANTA CRUZ BIOTECHNOLOGY: REGIONAL REVENUE FIGURE 50 SPECTRUM CHEMICAL MFG. CORP: KEY FINANCIALS FIGURE 51 SPECTRUM CHEMICAL MFG. CORP.: SWOT ANALYSIS FIGURE 52 SPECTRUM CHEMICAL MFG. CORP.: REGIONAL REVENUE FIGURE 53 THERMO FISHER SCIENTIFIC: KEY FINANCIALS FIGURE 54 THERMO FISHER SCIENTIFIC: SWOT ANALYSIS FIGURE 55 THERMO FISHER SCIENTIFIC: REGIONAL REVENUE FIGURE 56 TOSOH BIOSCIENCE: KEY FINANCIALS FIGURE 57 TOSOH BIOSCIENCE: SWOT ANALYSIS FIGURE 58 TOSOH BIOSCIENCE: REGIONAL REVENUE FIGURE 59 WATERS CORPORATION: KEY FINANCIALS FIGURE 60 WATERS CORPORATION: SWOT ANALYSIS FIGURE 61 WATERS CORPORATION: REGIONAL REVENUE
    216. Table FIGURE 1 RESEARCH PROCESS FIGURE 2 MARKET STRUCTURE FOR THE GLOBAL CHROMATOGRAPHY REAGENTS MARKET FIGURE 3 MARKET DYNAMICS FOR THE GLOBAL CHROMATOGRAPHY REAGENTS MARKET FIGURE 4 GLOBAL CHROMATOGRAPHY REAGENTS MARKET SHARE, BY TYPE, 2020 (%) FIGURE 5 GLOBAL CHROMATOGRAPHY REAGENTS MARKET SHARE, BY TECHNOLOGY, 2020 (%) FIGURE 6 GLOBAL CHROMATOGRAPHY REAGENTS MARKET SHARE, BY SEPARATION MECHANISM,2020 (%) FIGURE 7 GLOBAL CHROMATOGRAPHY REAGENTS MARKET SHARE, BY APPLICATION, 2020 (%) FIGURE 8 GLOBAL CHROMATOGRAPHY REAGENTS MARKET SHARE, BY REGION, 2020 (%) FIGURE 9 NORTH AMERICA: CHROMATOGRAPHY REAGENTS MARKET SHARE, BY REGION, 2020 (%) FIGURE 10 EUROPE: CHROMATOGRAPHY REAGENTS MARKET SHARE, BY REGION, 2020 (%) FIGURE 11 ASIA-PACIFIC: CHROMATOGRAPHY REAGENTS MARKET SHARE, BY REGION, 2020 (%) FIGURE 12 REST OF THE WORLD: CHROMATOGRAPHY REAGENTS MARKET SHARE, BY REGION, 2020 (%) FIGURE 13 GLOBAL CHROMATOGRAPHY REAGENTS MARKET: COMPANY SHARE ANALYSIS, 2020 (%) FIGURE 14 AGILENT TECHNOLOGIES, INC.: KEY FINANCIALS FIGURE 15 AGILENT TECHNOLOGIES, INC.: SWOT ANALYSIS FIGURE 16 AGILENT TECHNOLOGIES, INC.: REGIONAL REVENUE FIGURE 17 AVANTOR: KEY FINANCIALS FIGURE 18 AVANTOR: SWOT ANALYSIS FIGURE 19 AVANTOR: REGIONAL REVENUE FIGURE 20 BIO-RAD LABORATORIES, INC.: KEY FINANCIALS FIGURE 21 BIO-RAD LABORATORIES, INC.: SWOT ANALYSIS FIGURE 22 BIO-RAD LABORATORIES, INC.: REGIONAL REVENUE FIGURE 23 CHIRON AS: KEY FINANCIALS FIGURE 24 CHIRON AS: SWOT ANALYSIS FIGURE 25 CHIRON AS: REGIONAL REVENUE FIGURE 26 CYTIVA: KEY FINANCIALS FIGURE 27 CYTIVA: SWOT ANALYSIS FIGURE 28 CYTIVA: REGIONAL REVENUE FIGURE 29 GFS CHEMICALS INC: KEY FINANCIALS FIGURE 30 GFS CHEMICALS INC: SWOT ANALYSIS FIGURE 31 GFS CHEMICALS INC: REGIONAL REVENUE FIGURE 32 KANTO CHEMICAL: KEY FINANCIALS FIGURE 33 KANTO CHEMICAL: SWOT ANALYSIS FIGURE 34 KANTO CHEMICAL: REGIONAL REVENUE FIGURE 35 LOBA CHEMIE PVT. LTD: KEY FINANCIALS FIGURE 36 LOBA CHEMIE PVT. LTD: SWOT ANALYSIS FIGURE 37 LOBA CHEMIE PVT. LTD: SWOT ANALYSIS FIGURE 38 MERCK KGAA: KEY FINANCIALS FIGURE 39 MERCK KGAA: SWOT ANALYSIS FIGURE 40 MERCK KGAA: REGIONAL REVENUE FIGURE 41 REGIS TECHNOLOGIES, INC.: KEY FINANCIALS FIGURE 42 REGIS TECHNOLOGIES, INC.: SWOT ANALYSIS FIGURE 43 REGIS TECHNOLOGIES, INC.: REGIONAL REVENUE FIGURE 44 RESTEK: KEY FINANCIALS FIGURE 45 RESTEK: SWOT ANALYSIS FIGURE 46 RESTEK: REGIONAL REVENUE FIGURE 47 SANTA CRUZ BIOTECHNOLOGY: KEY FINANCIALS FIGURE 48 SANTA CRUZ BIOTECHNOLOGY: SWOT ANALYSIS FIGURE 49 SANTA CRUZ BIOTECHNOLOGY: REGIONAL REVENUE FIGURE 50 SPECTRUM CHEMICAL MFG. CORP: KEY FINANCIALS FIGURE 51 SPECTRUM CHEMICAL MFG. CORP.: SWOT ANALYSIS FIGURE 52 SPECTRUM CHEMICAL MFG. CORP.: REGIONAL REVENUE FIGURE 53 THERMO FISHER SCIENTIFIC: KEY FINANCIALS FIGURE 54 THERMO FISHER SCIENTIFIC: SWOT ANALYSIS FIGURE 55 THERMO FISHER SCIENTIFIC: REGIONAL REVENUE FIGURE 56 TOSOH BIOSCIENCE: KEY FINANCIALS FIGURE 57 TOSOH BIOSCIENCE: SWOT ANALYSIS FIGURE 58 TOSOH BIOSCIENCE: REGIONAL REVENUE FIGURE 59 WATERS CORPORATION: KEY FINANCIALS FIGURE 60 WATERS CORPORATION: SWOT ANALYSIS FIGURE 61 WATERS CORPORATION: REGIONAL REVENUE

    Chromatography Reagents Market Segmentation

    Market Segmentation Overview

    • Detailed segmentation data will be available in the full report
    • Comprehensive analysis by multiple parameters
    • Regional and country-level breakdowns
    • Market size forecasts by segment
    Infographic

    Free Sample Request

    Kindly complete the form below to receive a free sample of this Report

    Get Free Sample

    Customer Strories

    “I am very pleased with how market segments have been defined in a relevant way for my purposes (such as "Portable Freezers & refrigerators" and "last-mile"). In general the report is well structured. Thanks very much for your efforts.”

    Victoria Milne

    Founder
    Case Study
    Chemicals and Materials