• Cat-intel
  • MedIntelliX
  • Resources
  • About Us
  • Hero Background
    English
    Chinese
    French
    Japanese
    Korean
    German
    Spanish

    Cholic acid Market Size

    ID: MRFR/HC/6619-CR
    70 Pages
    Rahul Gotadki
    July 2019

    Cholic Acid Market Research Report Information by Application ( Emulsifier, Detergents, Medicines, Organic acid) Method (Folding ethyl acetate separation method, Folding ethanol crystallization method, Folding animal extraction, Others) Region (Europe, Asia-Pacific, Americas and the Middle East & Africa) - Forecast till 2035

    Share:
    Download PDF ×

    We do not share your information with anyone. However, we may send you emails based on your report interest from time to time. You may contact us at any time to opt-out.

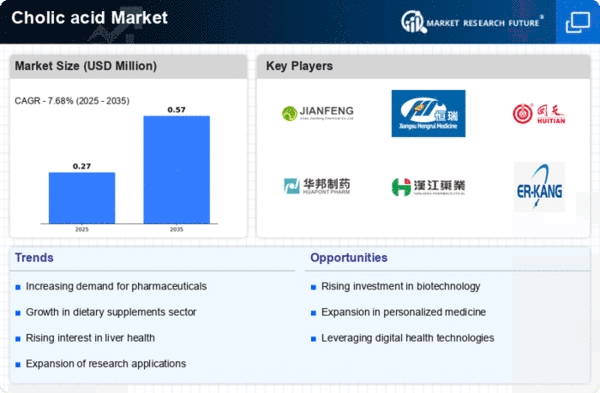
    Cholic acid Market Infographic
    $ 4,950.0
    $ 5,950.0
    $ 7,250.0

    Cholic Acid Size

    Cholic acid Market Growth Projections and Opportunities

    The cholic acid market is influenced by various factors that drive its growth and dynamics. Firstly, the pharmaceutical industry's demand for cholic acid as a key raw material for the synthesis of bile acid-based drugs plays a significant role in market expansion. Cholic acid, a primary bile acid naturally produced in the liver, serves as a crucial starting material for the production of bile acid derivatives used in pharmaceutical formulations. As the pharmaceutical sector continues to develop new drugs for various therapeutic applications, the demand for cholic acid as a precursor remains robust.

    Moreover, regulatory factors shape the cholic acid market landscape. Regulations governing the production, distribution, and use of cholic acid vary across different countries and regions. Compliance with regulatory standards is essential for manufacturers to ensure product quality, safety, and efficacy. Changes in regulations related to pharmaceutical ingredients or dietary supplements may impact the cholic acid market by influencing manufacturing practices, labeling requirements, and market access for suppliers.

    Additionally, market competition drives innovation and influences pricing strategies within the cholic acid market. As the market becomes more competitive with the entry of new suppliers and the emergence of alternative production methods, manufacturers strive to differentiate their products through factors such as purity, quality, and pricing. Price competition may intensify as suppliers seek to gain market share by offering competitive pricing while maintaining product quality and reliability.

    Furthermore, technological advancements in cholic acid production methods contribute to market growth and efficiency. Traditional methods of cholic acid extraction from animal bile have limitations in terms of scalability, cost, and environmental impact. However, advancements in biotechnology and chemical synthesis techniques enable the production of cholic acid through microbial fermentation or chemical synthesis from renewable resources. These innovative production methods offer advantages such as higher yields, lower production costs, and reduced environmental footprint, thereby driving market expansion.

    Moreover, consumer trends and dietary preferences influence the demand for cholic acid in the food and dietary supplement industries. Cholic acid is used as a food additive in various products such as infant formula, nutritional supplements, and functional foods. Consumer awareness of the health benefits associated with bile acids, including their role in fat digestion and absorption, may drive demand for cholic acid-containing products. Additionally, dietary supplement manufacturers may incorporate cholic acid into formulations targeting digestive health or weight management, further stimulating market growth.

    Furthermore, demographic factors such as population growth, aging demographics, and changing lifestyles impact market demand for cholic acid and related products. As the global population grows and ages, the prevalence of age-related conditions such as liver diseases, gallstones, and dyslipidemia increases, driving demand for pharmaceuticals and dietary supplements containing cholic acid. Changes in dietary habits and lifestyle choices, such as increased consumption of high-fat diets or sedentary lifestyles, may also contribute to the demand for cholic acid-based products targeting digestive health and metabolic disorders.

    Lastly, economic factors such as GDP growth, healthcare expenditure, and purchasing power influence market dynamics and consumer spending on cholic acid products. Countries with rising healthcare expenditures and increasing disposable incomes may experience higher demand for pharmaceuticals and dietary supplements containing cholic acid. Conversely, economic downturns or fluctuations in currency exchange rates may impact market growth by affecting consumer purchasing power and healthcare budgets.
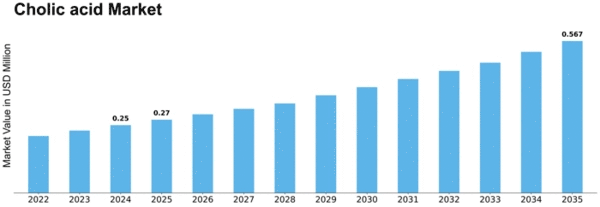
    Cholic acid Market Size Graph

    Market Summary

    As per Market Research Future Analysis, the Cholic Acid Market is projected to reach USD 265 million, growing at a CAGR of 7.4% from 2023 to 2032. Cholic acid, produced by the liver from cholesterol, plays a crucial role in fat digestion and is essential in manufacturing ursodeoxycholic acid, a treatment for gallbladder stones and liver diseases. The market is driven by rising obesity rates, increasing cases of gallbladder cancer, and a growing geriatric population. However, stringent regulations pose challenges to market growth. The COVID-19 pandemic has also impacted the market, necessitating adaptations in business operations.

    Key Market Trends & Highlights

    The Cholic Acid Market is witnessing significant growth due to various health-related factors.

    • Gallbladder cancer cases reached approximately 220,000 globally in 2018, driving demand for cholic acid.
    • The market is expected to grow at a CAGR of 8.47% during the forecast period.
    • Europe holds the largest market share at 39.5%, attributed to a high concentration of manufacturers.
    • The Asia-Pacific region is seeing increased demand due to rising obesity rates in countries like India and China.

    Market Size & Forecast

    Market Size USD 265 Million
    Forecast CAGR 7.4% (2023-2032)
    Largest Regional Market Share Europe (39.5%)
    Expected CAGR in Asia-Pacific 8.47%.

    Major Players

    Key players include Alchem International Ltd, Zhejiang Yongning Pharmaceutical, Showa Denko KK, Erregierre SpA, Retrophin, Inc., and PharmaZell GmbH.

    Market Trends

    One of the significant factors behind the growth of the Cholic acid market is the increase in the cases of gallbladder cancer. And according to the studies, gallstones are the reason behind the development of the market. This study revealed that almost 2,20,00 new cases of people suffering from gallbladder cancer were diagnosed worldwide in the year 2018. This high rate of gall cancer cases can be correlated with gallstones too. Therefore, the growing rate of gallbladder cancer has ultimately led to an increase in the usage of colic acid.

    The entire scenario has made the market grow at a favorable rate. The market is expected to grow at a similar place due to changing lifestyles, obesity, and similar factors leading to liver diseases and gall bladder conditions.

    Regulatory Implications

    Few factors affect the cholic acid market analysis, but the one that has been affecting the most is the regulations and laws laid down by various regulatory bodies, governments, and local bodies for the wise usage of cholic acid. These are indeed strict and stringent and holds back the market from growing further. The regulations are implemented because of the use on the human body. Though they have been found very useful in treating liver and gallbladder conditions, there are still some contraindications that negatively affect the human body.

    The regulatory bodies need to make sure that colic acid is done in an appropriate manner and that it does not cause any harm to any human being or even the environment. No doubt the regulations are structured, but there is a fire need for such stringent rules to make cholic acid function be implemented in a wiser way.

    Cholic Acid Market Segmentation 

    The market can be divided based on two factors. They are:

    Based on application: Based on application, the market can further be subdivided into the following categories:

    Emulsifier Detergents Medicines Organic acid

    Based on method: Based on the technique, the market can further be classified into the following subcategories:

    Folding ethyl acetate separation method Folding ethanol crystallization method Folding animal extraction Others

    Based on these two broad classifications of the market, each of them has a unique market value. Based on the application, the Medicines segment holds a significant part in the cholic acid market. With its widespread use in various kidney diseases, it has gained popularity across the world.

    Cholic Acid Market Regional Analysis

    Based on the regions, the cholic acid market has the following subtypes:

    Americas Europe The Middle East and Africa Asia- Pacific

    Europe holds the most significant share in the market with a value of almost 39.5% of the total stake.  The dominance of the region in the market is primarily due to substantial manufacturers in the area.

    The Asia Pacific also holds a significant share of the ursodeoxycholic acid market. This is because of the increase in ten obese populations the countries like India and China. Obesity comes with an increased risk of gall stems and, after that, gallbladder cancer.

    The cholic acid market expects to attend a CAGR of 8.47% during the forecast period. The American region has two central areas that include North America and Latin America. Increased gall bladder stones are likely to be a significant factor in the increased growth of the market.

    The Middle East and Africa have the most negligible share in the cholic acid market but expect a steady increase due to the increased geriatric population in the region.

    Cholic Acid Market Key Players

    The major players are: 

    Alchem International Ltd (US) Zhejiang Yongning Pharmaceutical (Zhejiang) Showa Denko KK (Japan) Erregierre SpA (Italy) Retrophin, Inc. (the US) Fujimoto Chemicals (Japan) PharmaZell GmbH (Germany) Panjin Hengchanglong Pharmaceutical (China) Kinsy SL (Spain) Istituto Biologico Chemioterapico SpA (Italy) Daewoong Bio, Inc. (South Korea) Suzhou Tianlu Biopharmaceuticals Co. Ltd (China, Dipharma Francis SRL (Italy) New Zealand Pharmaceuticals Limited (New Zealand)  Industria Chimica Emiliana SRL (Italy)

    All these significant players in the market have been working in a strategic and a planned manner. Various collaborations, acquisitions, and mergers amongst themselves have taken the call to the heights of success. They have also been leading the market as idols for the new entrants. It is not just for the growth of themself but also for the development of the market as a whole.

    Recent advancements

    Here are few recent advancements made in the cholic acid market:

    In April 2016, a significant stake created by the bile business was acquired by PharmaZell GmbH from Fayan international to expand its business horizons. New Zealand pharmaceutical limited was acquired by Archer’s capital in July 2016 to increase its share in the ursodeoxycholic acid market. Dipharma Francis SRL acquired Kalexsyn Inc. The motive was to offer services in the field of biotechnology and pharma. Advancements in the market are being made to ensure the market strictly follows the regulations laid down by the governments of various regions. The use of colic acid in industries like detergents and emulsifiers is being studied in depth. The main aim is to increase its usage in various end-use industries to increase the global market. 

    Report overview

    The report provided includes all the significant and small aspects required by an organization to do well and even combat losses during the Covid times. Starting from the overview of the cholic acid market to analysis based on the Covid impact, it also includes the market dynamics of the cholic acid market. The market segmentation based on method type and application is also included in the report. The market analysis based on five different regions is also provided with the report.

    The report's lap gives the details about the major players in the market and various strategies they have been following for the market's growth. The latest developments in the market are also provided to move forward with the newest technology. The current market scenario and the ways that can be implemented to bring about growth are shared in a detailed manner—all the reports are prepared by analysts with expertise in the field and the industry experts.

    The global cholic acid market appears to be experiencing a notable shift towards increased demand driven by its applications in pharmaceuticals and dietary supplements, suggesting a growing recognition of its therapeutic potential.

    U.S. Food and Drug Administration (FDA)

    Cholic acid Market Market Drivers

    Market Growth Projections

    The Global Cholic Acid Market Industry is projected to experience substantial growth over the next decade. With a compound annual growth rate (CAGR) of 11.18% anticipated from 2025 to 2035, the market is expected to expand significantly. This growth is driven by various factors, including the rising demand for bile acid derivatives and the increasing applications in pharmaceuticals. The market size is forecasted to reach 328.3 USD Million by 2035, reflecting the growing recognition of cholic acid's therapeutic potential. These projections underscore the dynamic nature of the Global Cholic Acid Market Industry and its capacity to adapt to evolving market demands.

    Rising Demand for Bile Acid Derivatives

    The Global Cholic Acid Market Industry experiences a notable increase in demand for bile acid derivatives, which are essential for various pharmaceutical applications. As bile acids play a crucial role in digestion and metabolism, their derivatives are increasingly utilized in drug formulations. This trend is driven by the growing prevalence of metabolic disorders and liver diseases, which require effective treatment options. The market is projected to reach 102.3 USD Million in 2024, reflecting a robust growth trajectory. The rising awareness of the therapeutic potential of bile acids further propels this demand, indicating a promising outlook for the Global Cholic Acid Market Industry.

    Expansion of Pharmaceutical Applications

    The Global Cholic Acid Market Industry is significantly influenced by the expansion of pharmaceutical applications. Cholic acid is increasingly recognized for its role in drug development, particularly in the formulation of novel therapeutics. Its unique properties facilitate the solubilization of poorly soluble drugs, enhancing bioavailability and therapeutic efficacy. As pharmaceutical companies invest in research and development, the utilization of cholic acid in innovative drug formulations is expected to rise. This trend is anticipated to contribute to the market's growth, with projections indicating a market size of 328.3 USD Million by 2035, highlighting the potential of cholic acid in the pharmaceutical sector.

    Growing Interest in Natural and Organic Products

    The Global Cholic Acid Market Industry is witnessing a shift towards natural and organic products, driven by consumer preferences for health and wellness. Cholic acid, derived from natural sources, aligns with the increasing demand for clean-label ingredients in dietary supplements and functional foods. This trend is particularly prominent in regions where consumers prioritize transparency and sustainability in product sourcing. As manufacturers respond to this demand by incorporating cholic acid into their offerings, the market is likely to benefit from this growing interest. This shift towards natural products may further enhance the market's growth potential in the coming years.

    Increasing Research Activities and Clinical Trials

    The Global Cholic Acid Market Industry is bolstered by increasing research activities and clinical trials focusing on the therapeutic applications of cholic acid. Researchers are exploring its potential in treating various conditions, including metabolic disorders and liver diseases. The growing body of scientific literature and clinical evidence supports the efficacy of cholic acid in these applications, attracting interest from pharmaceutical companies. As more clinical trials are initiated, the market is expected to witness a surge in demand for cholic acid, further solidifying its position in the pharmaceutical landscape. This trend indicates a promising future for the Global Cholic Acid Market Industry.

    Technological Advancements in Production Processes

    Technological advancements in production processes are playing a pivotal role in shaping the Global Cholic Acid Market Industry. Innovations in extraction and synthesis methods have led to improved efficiency and cost-effectiveness in cholic acid production. These advancements not only enhance the quality of the final product but also contribute to sustainability by reducing waste and energy consumption. As manufacturers adopt these technologies, the overall supply chain becomes more robust, facilitating a steady supply of cholic acid to meet the growing demand. This trend is likely to support the market's expansion, particularly as production capabilities are optimized.

    Market Segment Insights

    Regional Insights

    Industry Developments

    Future Outlook

    Cholic acid Market Future Outlook

    The Cholic Acid Market is projected to grow at 11.18% CAGR from 2024 to 2035, driven by rising healthcare demands, advancements in pharmaceuticals, and increasing applications in dietary supplements.

    New opportunities lie in:

    • Develop innovative cholic acid derivatives for enhanced therapeutic applications.
    • Expand production capabilities to meet growing global demand in emerging markets.
    • Leverage digital marketing strategies to increase awareness and accessibility of cholic acid products.

    By 2035, the Cholic Acid Market is expected to achieve substantial growth, solidifying its position as a key player in the pharmaceutical industry.

    Market Segmentation

    Recent advancements

    • The use of colic acid in industries like detergents and emulsifiers is being studied in depth. The main aim is to increase its usage in various end-use industries to increase the global market. 
    • Advancements in the market are being made to ensure the market strictly follows the regulations laid down by the governments of various regions.
    • Dipharma Francis SRL acquired Kalexsyn Inc. The motive was to offer services in the field of biotechnology and pharma.
    • New Zealand pharmaceutical limited was acquired by Archer’s capital in July 2016 to increase its share in the ursodeoxycholic acid market.
    • In April 2016, a significant stake created by the bile business was acquired by PharmaZell GmbH from Fayan international to expand its business horizons.

    Cholic Acid Market Key Players

    • Industria Chimica Emiliana SRL (Italy)
    • New Zealand Pharmaceuticals Limited (New Zealand) 
    • Suzhou Tianlu Biopharmaceuticals Co. Ltd (China, Dipharma Francis SRL (Italy)
    • Daewoong Bio, Inc. (South Korea)
    • Istituto Biologico Chemioterapico SpA (Italy)
    • Kinsy SL (Spain)
    • Panjin Hengchanglong Pharmaceutical (China)
    • PharmaZell GmbH (Germany)
    • Fujimoto Chemicals (Japan)
    • Retrophin, Inc. (the US)
    • Erregierre SpA (Italy)
    • Showa Denko KK (Japan)
    • Zhejiang Yongning Pharmaceutical (Zhejiang)
    • Alchem International Ltd (US)
    • The use of colic acid in industries like detergents and emulsifiers is being studied in depth. The main aim is to increase its usage in various end-use industries to increase the global market. 
    • Advancements in the market are being made to ensure the market strictly follows the regulations laid down by the governments of various regions.
    • Dipharma Francis SRL acquired Kalexsyn Inc. The motive was to offer services in the field of biotechnology and pharma.
    • New Zealand pharmaceutical limited was acquired by Archer’s capital in July 2016 to increase its share in the ursodeoxycholic acid market.
    • In April 2016, a significant stake created by the bile business was acquired by PharmaZell GmbH from Fayan international to expand its business horizons.

    Cholic Acid Market Segmentation 

    • Organic acid
    • Medicines
    • Detergents
    • Emulsifier
    • Others
    • Folding animal extraction
    • Folding ethanol crystallization method
    • Folding ethyl acetate separation method

    Cholic Acid Market Regional Analysis

    • Asia- Pacific
    • The Middle East and Africa
    • Europe
    • Americas

    Report Scope

    Report Attribute/Metric Details
      Market Size   2032 : 265 Million
      CAGR   7.4% (2023- 2032)
      Base Year   2020
      Forecast Period   2023-2032
      Historical Data   2019
      Forecast Units    Value (USD Million)
      Report Coverage   Revenue Forecast, Competitive Landscape, Growth Factors, and Trends
      Segments Covered   By Region
      Geographies Covered   North America, Europe, Asia-Pacific, and Rest of the World (RoW)
      Key Vendors   Alchem International Ltd (US), Zhejiang Yongning Pharmaceutical (Zhejiang), Showa Denko KK (Japan), Erregierre SpA (Italy), Retrophin, Inc. (the US), Fujimoto Chemicals (Japan), PharmaZell GmbH (Germany), Panjin Hengchanglong Pharmaceutical (China), Kinsy SL (Spain), Istituto Biologico Chemioterapico SpA (Italy), Daewoong Bio, Inc. (South Korea), Suzhou Tianlu Biopharmaceuticals Co. Ltd (China, Dipharma Francis SRL (Italy)
      Key Market Opportunities   strategic alliances, mergers and acquisitions and new product developments
      Key Market Drivers ·  Increased geriatric population ·  Increase in the cases of gallbladder cancer

    Market Highlights

    Author

    Rahul Gotadki
    Assistant Manager

    She holds an experience of about 6+ years in market research and business consulting, working under the spectrum of information communication technology, telecommunications and semiconductor domains. aarti conceptualizes and implements a scalable business strategy and provides strategic leadership to the clients. her expertise lies in market estimation, competitive intelligence, pipeline analysis, customer assessment, etc.

    Leave a Comment

    Latest Comments

    John Doe
    john@example.com

    This is a great article! Really helped me understand the topic better.

    Posted on July 23, 2025, 10:15 AM
    Jane Smith
    jane@domain.com

    Thanks for sharing this. I’ve bookmarked it for later reference.

    Posted on July 22, 2025, 7:45 PM

    FAQs

    What is the predicted CAGR for the forecast period of 2023 to 2032?

    cholic acid market CAGR would be 7.4% during the forecast period.

    What is the projected valuation of the market?`

    The market by 2032 would grow up to USD 265 Million.

    What are the restraints of the market?

    The prevalence of gallbladder cancer, obesity, geriatric population, and regulatory policies can hold back the market.

    Which region would lead the market?

    Europe would lead the market with a 39.5% market share.

    Which region would be the fastest-growing in the global market?

    The Americas would be the fastest-growing region in the global market.

    1. Market Introduction
      1. Definition 12
      2. Scope of the Study 12
      3. Market Structure 12
    2. Research Methodology
      1. Research Process 13
      2. Primary Research 14
      3. Secondary Research 15
      4. Market Size Estimation 16
      5. Forecast Model 16
    3. Market Dynamics
      1. Overview 17
      2. Drivers 18
        1. High Prevalence Of Gallbladder Cancer 18
        2. High Prevalence Of Obesity 18
        3. Increasing Geriatric Population 18
        4. Drivers Impact Analysis 19
      3. Restraints 19
        1. Stringent Regulatory Policies 19
        2. Restraints Impact Analysis 19
      4. Opportunities 20
        1. Low Manufacturing In The Middle East & Africa 20
    4. Market Factor Analysis
      1. Value Chain Analysis 21
        1. Overview 21
        2. R&D 21
        3. Procurement Of Raw Material 21
        4. Manufacturing 21
        5. Distribution & Sales 22
        6. Post-Sales Monitoring 22
      2. Porter’s Five Forces Model 23
        1. Overview 23
        2. Threat Of New Entrants 24
        3. Bargaining Power Of Suppliers 24
        4. Threat Of Substitutes 24
        5. Bargaining Power Of Buyers 24
        6. Intensity Of Rivalry 24
    5. Global Cholic Acid Market, By Region
      1. Introduction 25
      2. Europe 27
        1. Western Europe 28
        2. Eastern Europe 32
      3. Asia-Pacific 33
        1. China 34
        2. India 34
        3. Japan 35
        4. Australia 35
        5. South Korea 36
        6. Rest Of Asia-Pacific 36
      4. Americas 37
        1. North America 38
        2. Latin America 39
      5. Middle East & Africa 40
        1. Middle East 41
        2. Africa 41
    6. Company Landscape
      1. Company Position Analysis 42
    7. Company Profile
      1. Alchem International Ltd 44
        1. Company Overview 44
        2. Financial Overview 44
        3. Products/Services Offered 44
        4. Key Developments 44
        5. SWOT Analysis 44
        6. Key Strategies 45
      2. Daewoong Bio, Inc. 46
        1. Company Overview 46
        2. Financial Overview 46
        3. Products/Services Offered 46
        4. Key Developments 46
        5. SWOT Analysis 46
        6. Key Strategies 47
      3. Dipharma Francis SRL 48
        1. Company Overview 48
        2. Financial Overview 48
        3. Products Offering 48
        4. Key Developments 48
        5. SWOT Analysis 48
        6. Key Strategies 49
      4. Erregierre SpA 50
        1. Company Overview 50
        2. Financial Overview 50
        3. Products/Services Offered 50
        4. Key Developments 50
        5. SWOT Analysis 50
        6. Key Strategies 50
      5. Fujimoto Chemicals 51
        1. Company Overview 51
        2. Financial Overview 51
        3. Products/Services Offered 51
        4. Key Developments 51
        5. SWOT Analysis 51
        6. Key Strategies 51
      6. Industria Chimica Emiliana SRL 52
        1. Company Overview 52
        2. Financial Overview 52
        3. Products/Services Offered 52
        4. Key Developments 52
        5. SWOT Analysis 52
        6. Key Strategies 53
      7. Istituto Biologico Chemioterapico SpA 54
        1. Company Overview 54
        2. Financial Overview 54
        3. Products/Services Offered 54
        4. Key Developments 54
        5. SWOT Analysis 54
        6. Key Strategies 54
      8. Kinsy SL 55
        1. Company Overview 55
        2. Financial Overview 55
        3. Products/Services Offered 55
        4. Key Developments 55
        5. SWOT Analysis 55
        6. Key Strategies 55
      9. New Zealand Pharmaceuticals Limited 56
        1. Company Overview 56
        2. Financial Overview 56
        3. Products/Services Offered 56
        4. Key Developments 56
        5. SWOT Analysis 57
        6. Key Strategies 57
      10. Panjin Hengchanglong Pharmaceutical 58
        1. Company Overview 58
        2. Financial Overview 58
        3. Products/Services Offered 58
        4. Key Developments 58
        5. SWOT Analysis 58
        6. Key Strategies 59
      11. PharmaZell GmbH 60
        1. Company Overview 60
        2. Financial Overview 60
        3. Products/Services Offered 60
        4. Key Developments 60
        5. SWOT Analysis 61
        6. Key Strategies 61
      12. Retrophin, Inc. 62
        1. Company Overview 62
        2. Financial Overview 62
        3. Products/Services Offered 63
        4. Key Developments 63
        5. SWOT Analysis 63
        6. Key Strategies 63
      13. Showa Denko KK 64
        1. Company Overview 64
        2. Financial Overview 64
        3. Products/Services Offered 65
        4. Key Developments 65
        5. SWOT Analysis 65
        6. Key Strategies 65
      14. Suzhou Tianlu Biopharmaceuticals Co. Ltd 66
        1. Company Overview 66
        2. Financial Overview 66
        3. Products/Services Offered 66
        4. Key Developments 66
        5. SWOT Analysis 66
        6. Key Strategies 67
      15. Zhejiang Yongning Pharmaceutical 68
        1. Company Overview 68
        2. Financial Overview 68
        3. Products/Services Offered 68
        4. Key Developments 68
        5. SWOT Analysis 68
        6. Key Strategies 69
    8. Appendix
      1. References 70
      2. Related Reports 70
    9. List of Tables and Figures
      1. 9 List Of Tables
      2. TABLE 1 PRIMARY INTERVIEWS 16
      3. TABLE 2 GLOBAL HEMP BASED PRODUCTS MARKET, BY REGION 2023-2032 (USD MILLION) 32
      4. TABLE 3 AMERICAS HEMP BASED PRODUCTS MARKET, BY REGION 2023-2032 (USD MILLION) 33
      5. TABLE 4 NORTH AMERICA HEMP BASED PRODUCTS MARKET, BY REGION 2023-2032 (USD MILLION) 33
      6. TABLE 5 EUROPE HEMP BASED PRODUCTS MARKET, BY REGION 2023-2032 (USD MILLION) 34
      7. TABLE 6 WESTERN EUROPE HEMP BASED PRODUCTS MARKET, BY REGION 2023-2032 (USD MILLION) 34
      8. TABLE 7 ASIA-PACIFIC: HEMP BASED PRODUCTS MARKET, BY COUNTRY 2023–2032 (USD MILLION) 35
      9. TABLE 8 REST OF THE WORLD (ROW) HEMP BASED PRODUCTS MARKET, BY REGION 2023-2032 (USD MILLION) 35
      10. TABLE 9 GLOBAL HEMP BASED PRODUCTS MARKET , BY INDUSTRIAL APPLICATION, 2023–2032 (USD MILLION) 36
      11. TABLE 10 GLOBAL HEMP BASED PRODUCTS MARKET, FOR HEMP CBD BY TYPE, 2023–2032 (USD MILLION) 37
      12. TABLE 11 GLOBAL HEMP BASED PRODUCTS MARKET, FOR HEMP CBD BY TYPE, 2023–2028 (VOLUME) 38
      13. TABLE 12 GLOBAL HEMP BASED PRODUCTS MARKET, FOR HEMP CBD BY TYPE, 2019–2032 (VOLUME) 38
      14. TABLE 13 GLOBAL CBD OIL MARKET, BY PRODUCT, 2023–2032 (USD MILLION) 40
      15. TABLE 14 GLOBAL CBD OIL MARKET, FOR MARIJUANA-DERIVED CBD OIL BY REGION, 2023–2032 (USD MILLION) 41
      16. TABLE 15 GLOBAL CBD OIL MARKET, FOR HEMP-DERIVED CBD OIL BY REGION, 2023–2032 (USD MILLION) 42
      17. TABLE 16 GLOBAL CBD OIL MARKET, BY APPLICATION, 2023–2032 (USD MILLION) 44
      18. TABLE 17 GLOBAL CBD OIL MARKET, FOR PAIN RELIEF BY REGION, 2023–2032 (USD MILLION) 45
      19. TABLE 18 GLOBAL CBD OIL MARKET, FOR NEUROLOGICAL DISORDERS BY REGION, 2023–2032 (USD MILLION) 46
      20. TABLE 19 GLOBAL CBD OIL MARKET, FOR FIBROMYALGIA BY REGION, 2023–2032 (USD MILLION) 46
      21. TABLE 20 GLOBAL CBD OIL MARKET, FOR MOOD DISORDERS BY REGION, 2023–2032 (USD MILLION) 47
      22. TABLE 21 GLOBAL CBD OIL MARKET, FOR DIABETES BY REGION, 2023–2032 (USD MILLION) 47
      23. TABLE 22 GLOBAL CBD OIL MARKET, BY DISTRIBUTION CHANNEL 2023–2032 (USD MILLION) 49
      24. TABLE 23 GLOBAL CBD OIL MARKET, FOR E-COMMERCE WEBSITES BY REGION 2023–2032 (USD MILLION) 50
      25. TABLE 24 GLOBAL CBD OIL MARKET, FOR RETAIL PHARMACIES BY REGION 2023–2032 (USD MILLION) 50
      26. TABLE 25 GLOBAL CBD OIL MARKET, FOR MEDICAL MARIJUANA DISPENSARIES BY REGION 2023–2032 (USD MILLION 51
      27. TABLE 26 GLOBAL CBD OIL MARKET, FOR HOSPITAL PHARMACIES BY REGION 2023–2032 (USD MILLION 51
      28. TABLE 27 GLOBAL CBD OIL MARKET, BY REGION 2023–2032 (USD MILLION) 54
      29. TABLE 28 AMERICAS: CBD OIL MARKET, BY REGION 2023–2032 (USD MILLION) 55
      30. TABLE 29 AMERICAS: CBD OIL MARKET, BY PRODUCT 2023–2032 (USD MILLION) 55
      31. TABLE 30 AMERICAS: CBD OIL MARKET, BY APPLICATION 2023–2032 (USD MILLION) 56
      32. TABLE 31 AMERICAS: CBD OIL MARKET, BY DISTRIBUTION CHANNEL 2023–2032 (USD MILLION) 56
      33. TABLE 32 NORTH AMERICA: CBD OIL MARKET, BY COUNTRY 2023–2032 (USD MILLION) 57
      34. TABLE 33 NORTH AMERICA: CBD OIL MARKET, BY PRODUCT 2023–2032 (USD MILLION) 57
      35. TABLE 34 NORTH AMERICA: CBD OIL MARKET, BY APPLICATION 2023–2032 (USD MILLION) 58
      36. TABLE 35 NORTH AMERICA: CBD OIL MARKET, BY DISTRIBUTION CHANNEL 2023–2032 (USD MILLION) 58
      37. TABLE 36 US: CBD OIL MARKET, BY PRODUCT 2023–2032 (USD MILLION) 59
      38. TABLE 37 US: CBD OIL MARKET, BY APPLICATION 2023–2032 (USD MILLION) 59
      39. TABLE 38 US: CBD OIL MARKET, BY DISTRIBUTION CHANNEL 2023–2032 (USD MILLION) 60
      40. TABLE 39 CANADA: CBD OIL MARKET, BY PRODUCT 2023–2032 (USD MILLION) 60
      41. TABLE 40 CANADA: CBD OIL MARKET, BY APPLICATION 2023–2032 (USD MILLION) 61
      42. TABLE 41 CANADA: CBD OIL MARKET, BY DISTRIBUTION CHANNEL 2023–2032 (USD MILLION) 61
      43. TABLE 42 SOUTH AMERICA: CBD OIL MARKET, BY PRODUCT 2023–2032 (USD MILLION) 62
      44. TABLE 43 SOUTH AMERICA: CBD OIL MARKET, BY APPLICATION 2023–2032 (USD MILLION) 62
      45. TABLE 44 SOUTH AMERICA: CBD OIL MARKET, BY DISTRIBUTION CHANNEL 2023–2032 (USD MILLION) 63
      46. TABLE 45 EUROPE: CBD OIL MARKET, BY REGION 2023–2032 (USD MILLION) 64
      47. TABLE 46 EUROPE: CBD OIL MARKET, BY PRODUCT 2023–2032 (USD MILLION) 64
      48. TABLE 47 EUROPE: CBD OIL MARKET, BY APPLICATION 2023–2032 (USD MILLION) 65
      49. TABLE 48 EUROPE: CBD OIL MARKET, BY DISTRIBUTION CHANNEL 2023–2032 (USD MILLION) 65
      50. TABLE 49 WESTERN EUROPE: CBD OIL MARKET, BY COUNTRY 2023–2032 (USD MILLION) 66
      51. TABLE 50 WESTERN EUROPE: CBD OIL MARKET, BY PRODUCT 2023–2032 (USD MILLION) 67
      52. TABLE 51 WESTERN EUROPE CBD OIL MARKET, BY APPLICATION 2023–2032 (USD MILLION) 67
      53. TABLE 52 WESTERN EUROPE: CBD OIL MARKET, BY DISTRIBUTION CHANNEL 2023–2032 (USD MILLION) 68
      54. TABLE 53 GERMANY: CBD OIL MARKET, BY PRODUCT 2023–2032 (USD MILLION) 69
      55. TABLE 54 GERMANY: CBD OIL MARKET, BY APPLICATION 2023–2032 (USD MILLION) 69
      56. TABLE 55 GERMANY: CBD OIL MARKET, BY DISTRIBUTION CHANNEL 2023–2032 (USD MILLION) 70
      57. TABLE 56 UK: CBD OIL MARKET, BY PRODUCT 2023–2032 (USD MILLION) 70
      58. TABLE 57 UK: CBD OIL MARKET, BY APPLICATION 2023–2032 (USD MILLION) 71
      59. TABLE 58 UK: CBD OIL MARKET, BY DISTRIBUTION CHANNEL 2023–2032 (USD MILLION) 71
      60. TABLE 59 FRANCE: CBD OIL MARKET, BY PRODUCT 2023–2032 (USD MILLION) 72
      61. TABLE 60 FRANCE: CBD OIL MARKET, BY APPLICATION 2023–2032 (USD MILLION) 72
      62. TABLE 61 FRANCE: CBD OIL MARKET, BY DISTRIBUTION CHANNEL 2023–2032 (USD MILLION) 73
      63. TABLE 62 SPAIN: CBD OIL MARKET, BY PRODUCT 2023–2032 (USD MILLION) 73
      64. TABLE 63 SPAIN: CBD OIL MARKET, BY APPLICATION 2023–2032 (USD MILLION) 74
      65. TABLE 64 SPAIN: CBD OIL MARKET, BY DISTRIBUTION CHANNEL 2023–2032 (USD MILLION) 74
      66. TABLE 65 ITALY: CBD OIL MARKET, BY PRODUCT 2023–2032 (USD MILLION) 75
      67. TABLE 66 ITALY: CBD OIL MARKET, BY APPLICATION 2023–2032 (USD MILLION) 75
      68. TABLE 67 ITALY: CBD OIL MARKET, BY DISTRIBUTION CHANNEL 2023–2032 (USD MILLION) 76
      69. TABLE 68 REST OF WESTERN EUROPE: CBD OIL MARKET, BY PRODUCT 2023–2032 (USD MILLION) 76
      70. TABLE 69 REST OF WESTERN EUROPE: CBD OIL MARKET, BY APPLICATION 2023–2032 (USD MILLION) 77
      71. TABLE 70 REST OF WESTERN EUROPE: CBD OIL MARKET, BY DISTRIBUTION CHANNEL 2023–2032 (USD MILLION) 77
      72. TABLE 71 EASTERN EUROPE: CBD OIL MARKET, BY PRODUCT 2023–2032 (USD MILLION) 78
      73. TABLE 72 EASTERN EUROPE: CBD OIL MARKET, BY APPLICATION 2023–2032 (USD MILLION) 78
      74. TABLE 73 EASTERN EUROPE: CBD OIL MARKET, BY DISTRIBUTION CHANNEL 2023–2032 (USD MILLION) 79
      75. TABLE 74 ASIA-PACIFIC: CBD OIL MARKET, BY COUNTRY 2023–2032 (USD MILLION) 80
      76. TABLE 75 ASIA-PACIFIC: CBD OIL MARKET, BY PRODUCT 2023–2032 (USD MILLION) 81
      77. TABLE 76 ASIA-PACIFIC: CBD OIL MARKET, BY APPLICATION 2023–2032 (USD MILLION) 81
      78. TABLE 77 ASIA-PACIFIC: CBD OIL MARKET, BY DISTRIBUTION CHANNEL 2023–2032 (USD MILLION) 82
      79. TABLE 78 JAPAN: CBD OIL MARKET, BY PRODUCT 2023–2032 (USD MILLION) 82
      80. TABLE 79 JAPAN: CBD OIL MARKET, BY APPLICATION 2023–2032 (USD MILLION) 83
      81. TABLE 80 JAPAN: CBD OIL MARKET, BY DISTRIBUTION CHANNEL 2023–2032 (USD MILLION) 83
      82. TABLE 81 CHINA: CBD OIL MARKET, BY PRODUCT 2023–2032 (USD MILLION) 84
      83. TABLE 82 CHINA: CBD OIL MARKET, BY APPLICATION 2023–2032 (USD MILLION) 84
      84. TABLE 83 CHINA: CBD OIL MARKET, BY DISTRIBUTION CHANNEL 2023–2032 (USD MILLION) 85
      85. TABLE 84 AUSTRALIA: CBD OIL MARKET, BY PRODUCT 2023–2032 (USD MILLION) 85
      86. TABLE 85 AUSTRALIA: CBD OIL MARKET, BY APPLICATION 2023–2032 (USD MILLION) 86
      87. TABLE 86 AUSTRALIA: CBD OIL MARKET, BY DISTRIBUTION CHANNEL 2023–2032 (USD MILLION) 86
      88. TABLE 87 INDIA: CBD OIL MARKET, BY PRODUCT 2023–2032 (USD MILLION) 87
      89. TABLE 88 INDIA: CBD OIL MARKET, BY APPLICATION 2023–2032 (USD MILLION) 87
      90. TABLE 89 INDIA: CBD OIL MARKET, BY DISTRIBUTION CHANNEL 2023–2032 (USD MILLION) 88
      91. TABLE 90 SOUTH KOREA: CBD OIL MARKET, BY PRODUCT 2023–2032 (USD MILLION) 89
      92. TABLE 91 SOUTH KOREA: CBD OIL MARKET, BY APPLICATION 2023–2032 (USD MILLION) 89
      93. TABLE 92 SOUTH KOREA: CBD OIL MARKET, BY DISTRIBUTION CHANNEL 2023–2032 (USD MILLION) 90
      94. TABLE 93 REST OF ASIA-PACIFIC: CBD OIL MARKET, BY PRODUCT 2023–2032 (USD MILLION) 90
      95. TABLE 94 REST OF ASIA-PACIFIC: CBD OIL MARKET, BY APPLICATION 2023–2032 (USD MILLION) 91
      96. TABLE 95 REST OF ASIA-PACIFIC: CBD OIL MARKET, BY DISTRIBUTION CHANNEL 2023–2032 (USD MILLION) 91
      97. TABLE 96 REST OF THE WORLD: CBD OIL MARKET, BY REGION 2023–2032 (USD MILLION) 92
      98. TABLE 97 REST OF THE WORLD: CBD OIL MARKET, BY PRODUCT 2023–2032 (USD MILLION) 92
      99. TABLE 98 REST OF THE WORLD: CBD OIL MARKET, BY APPLICATION 2023–2032 (USD MILLION) 93
      100. TABLE 99 REST OF THE WORLD: CBD OIL MARKET, BY DISTRIBUTION CHANNEL 2023–2032 (USD MILLION) 93   10 List Of Figures
      101. FIGURE 1 GLOBAL CBD OIL MARKET: MARKET STRUCTURE 14
      102. FIGURE 2 RESEARCH PROCESS 16
      103. FIGURE 3 TOP-DOWN & Bottom-up Approach 19
      104. FIGURE 4 MARKET DYNAMICS: ANALYSIS OF GLOBAL CBD OIL MARKET 21
      105. FIGURE 5 VALUE CHAIN: GLOBAL CBD OIL MARKET 26
      106. FIGURE 6 PORTER’S FIVE FORCES ANALYSIS: GLOBAL CBD OIL MARKET 27
      107. FIGURE 7 GLOBAL HEMP BASED PRODUCTS MARKET, BY INDUSTRIAL APPLICATION, 2023 (%) 31
      108. FIGURE 8 GLOBAL HEMP BASED PRODUCTS MARKET, BY HEMP CBD PRODUCT TYPE, 2023 (%) 31
      109. FIGURE 9 GLOBAL HEMP BASED PRODUCTS MARKET, BY REGION, 2023 & 2032 (USD MILLION) 32
      110. FIGURE 10 GLOBAL HEMP BASED PRODUCTS MARKET, BY INDUSTRIAL APPLICATION, 2023 & 2032 (USD MILLION) 36
      111. FIGURE 11 GLOBAL HEMP BASED PRODUCTS MARKET, FOR HEMP CBD BY TYPE, 2023 & 2032 (USD MILLION) 37
      112. FIGURE 12 GLOBAL HEMP BASED PRODUCTS MARKET, FOR HEMP CBD BY TYPE, 2023 & 2032 (VOLUME) 38
      113. FIGURE 13 GLOBAL CBD OIL MARKET, BY PRODUCT, 2023 & 2032 (USD MILLION) 41
      114. FIGURE 14 GLOBAL CBD OIL MARKET, BY APPLICATION, 2023 & 2032 (USD MILLION) 45
      115. FIGURE 15 GLOBAL CBD OIL MARKET, BY DISTRIBUTION CHANNEL, 2023 & 2032 (USD MILLION) 49
      116. FIGURE 16 GLOBAL CBD OIL MARKET, BY REGION 2023 & 2032 (USD MILLION) 54
      117. FIGURE 17 AMERICAS: CBD OIL MARKET SHARE, BY REGION 2023 55
      118. FIGURE 18 NORTH AMERICA: CBD OIL MARKET SHARE, BY COUNTRY 2023 57
      119. FIGURE 19 EUROPE: CBD OIL MARKET SHARE, BY REGION 2023 64
      120. FIGURE 20 WESTERN EUROPE: CBD OIL MARKET SHARE, BY COUNTRY 2023 66
      121. FIGURE 21 ASIA-PACIFIC: CBD OIL MARKET SHARE, BY COUNTRY 2023 80
      122. FIGURE 22 REST OF THE WORLD: CBD OIL MARKET SHARE, BY REGION 2023 92
      123. FIGURE 23 GLOBAL CBD OIL MARKET SHARE ANALYSIS, 2023 (%) 95

    Cholic acid Market Segmentation

    Market Segmentation Overview

    • Detailed segmentation data will be available in the full report
    • Comprehensive analysis by multiple parameters
    • Regional and country-level breakdowns
    • Market size forecasts by segment
    Infographic

    Free Sample Request

    Kindly complete the form below to receive a free sample of this Report

    Get Free Sample

    Customer Strories

    “I am very pleased with how market segments have been defined in a relevant way for my purposes (such as "Portable Freezers & refrigerators" and "last-mile"). In general the report is well structured. Thanks very much for your efforts.”

    Victoria Milne

    Founder
    Case Study
    Chemicals and Materials