• Cat-intel
  • MedIntelliX
  • Resources
  • About Us
  • English
    Chinese
    French
    Japanese
    Korean
    German
    Spanish

    Bio Power Market Size

    ID: MRFR/E&P/0983-CR
    128 Pages
    Anshula Mandaokar
    March 2024

    Bio Power Market Research Report Information By Technology (Direct Combustion, Cofiring & Gasification, Anaerobic Digestion, Pyrolysis, and Landfill Gas), By End-User (Residential, Commercia, and Industrial), By Region -Global Forecast to 2030

    Share:
    Download PDF ×

    We do not share your information with anyone. However, we may send you emails based on your report interest from time to time. You may contact us at any time to opt-out.

    Bio Power Market Research Report - Global Forecast to 2030 Infographic
    $ 4,950.0
    $ 5,950.0
    $ 7,250.0

    Bio Power Size

    Bio Power Market Growth Projections and Opportunities

    The Bio Power industry is dynamic and uses organic resources to create sustainable energy. Technological advances, regulatory laws, and environmental issues affect this sector. As nations encourage bioenergy usage, government regulations and incentives shape the Bio Power industry. Feed-in tariffs, tax credits, and subsidies stimulate bio power investment by businesses and people. Technological advances also affect Bio Power market dynamics. Bioenergy production efficiency, affordability, and competitiveness compared to traditional energy sources are being improved via research and development. Advanced biomass conversion technologies like anaerobic digestion and gasification diversify bioenergy sources and grow the market. Environmentalism and the global trend toward sustainable energy sources drive Bio Power market dynamics. Market dynamics are also affected by feedstock supply and characteristics. Bio Power relies on biomass feedstocks, whose quantity, affordability, and sustainability affect market growth. Bioenergy output and market stability can be affected by feedstock availability. Additionally, Bio Power's inclusion into the energy environment affects market dynamics. Bioenergy's capacity to complement wind and solar energy creates a more balanced and stable energy mix. Advances in energy storage technology make bioenergy grid integration possible, solving intermittency issues with some renewable sources. Market dynamics reflect changing consumer choices and business sustainability aims. Businesses and consumers seek Bio Power as knowledge and demand for green energy sources rise. As part of their sustainability plans, companies are adding bioenergy to their energy portfolios to reduce their carbon impact. The dynamics influence the Bio Power market's growth and trajectory, making it crucial to the worldwide shift to a more sustainable and resilient energy future. Bio Power's position in the energy environment will change as regulations, technology, and market factors change."

    Market Size Graph

    Market Summary

    As per Market Research Future Analysis, the Global Bio Power Market was valued at USD 91,985.11 million in 2022 and is projected to grow to USD 142,703.07 million by 2030, with a CAGR of 5.72% from 2023 to 2030. Bio power, derived from biological sources like biomass and organic waste, plays a crucial role in renewable energy generation, offering an eco-friendly alternative to fossil fuels. Technologies such as direct combustion, anaerobic digestion, and thermal gasification are employed to convert biomass into energy, contributing to sustainable energy production and reducing greenhouse gas emissions. The market is driven by rising government initiatives, the need for cleaner energy sources, and the depletion of natural energy resources, leading to increased investments in bio power technologies.

    Key Market Trends & Highlights

    The bio power market is witnessing significant growth due to various trends.

    • The market is projected to grow from USD 96,680.49 million in 2023 to USD 142,703.07 million by 2030.
    • Direct combustion technology accounted for 53.98% of the market share in 2022.
    • The industrial segment held a revenue share of 35.78% in 2022.
    • Asia Pacific dominated the market with a share of 43.10% in 2022.

    Market Size & Forecast

    2022 Market Size USD 91,985.11 million
    2023 Market Size USD 96,680.49 million
    2030 Market Size USD 142,703.07 million
    CAGR (2023-2030) 5.72%
    Largest Regional Market Share in 2022 Asia Pacific.

    Major Players

    Key players include Drax Group, BP PLC, Leo Group, Statkraft AS, Ørsted A/S, and Afry AB.

    Market Trends

    Rising need to control greenhouse gas emission.

    The carbon in biomass is taken up by plants during photosynthesis.  Modern bioenergy is a promising nearly emission-free fuel because when this biomass is used to generate electricity, the carbon is liberated during combustion and only returns to the environment.

    The market for bio power is also expanding owing to rising government initiatives to reduce carbon emissions, which are encouraging the production and consumption of biomass. This growing demand for clean and green energy across many industries is driving growth in the global market for bio power generation.

    Depletion of energy resources driving the market growth

    While energy imports, such as fossil fuels, can fuel economic growth, they can also pose environmental risks if not managed effectively. Furthermore, they can lead to higher energy prices, which may strain the budgets of many households.

    The Global Bio Power Market is poised for substantial growth as nations increasingly prioritize renewable energy sources to meet their sustainability goals and reduce greenhouse gas emissions.

    U.S. Department of Energy

    Bio Power Market Market Drivers

    Market Growth Projections

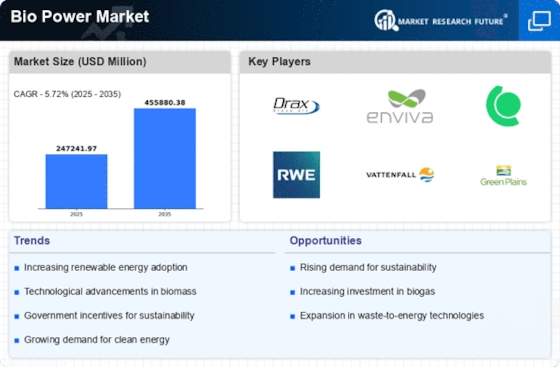
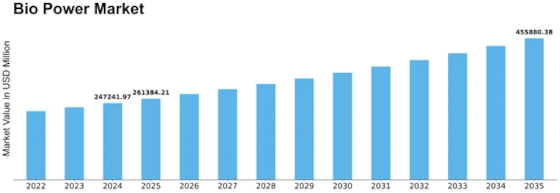
    The Global Bio Power Market Industry is projected to experience substantial growth over the next decade. With a market size of 100.3 USD Billion in 2024, it is anticipated to expand to 188.5 USD Billion by 2035. This growth trajectory suggests a compound annual growth rate of 5.9% from 2025 to 2035, reflecting the increasing adoption of bioenergy solutions across various sectors. The expansion is driven by a combination of factors, including technological advancements, government policies, and rising demand for renewable energy. Such projections indicate a promising future for the bio power sector.

    Diverse Feedstock Availability

    The availability of diverse feedstocks is a significant driver in the Global Bio Power Market Industry. Various organic materials, including agricultural residues, forestry by-products, and municipal solid waste, can be utilized for bioenergy production. This diversity not only enhances the sustainability of bioenergy but also supports local economies by providing new revenue streams for farmers and waste management sectors. As the demand for bioenergy increases, the ability to source feedstocks from multiple channels is likely to strengthen the market's resilience and adaptability, ensuring a steady supply of bioenergy in the future.

    Government Incentives and Policies

    Government incentives and supportive policies are pivotal drivers in the Global Bio Power Market Industry. Many countries are establishing frameworks that promote the use of bioenergy, including tax credits, grants, and subsidies for bioenergy projects. For example, the implementation of renewable portfolio standards mandates a certain percentage of energy to come from renewable sources, including bioenergy. Such policies not only stimulate investment but also encourage the development of bioenergy infrastructure. As governments strive to meet international climate commitments, these incentives are expected to bolster the market significantly in the coming years.

    Rising Demand for Renewable Energy

    The Global Bio Power Market Industry is experiencing a notable surge in demand for renewable energy sources, driven by increasing awareness of climate change and the need for sustainable energy solutions. Governments worldwide are implementing policies to reduce greenhouse gas emissions, which has led to a shift towards bioenergy. In 2024, the market is projected to reach 100.3 USD Billion, reflecting a growing preference for cleaner energy alternatives. This trend is expected to continue, as the industry anticipates a market size of 188.5 USD Billion by 2035, indicating a robust compound annual growth rate of 5.9% from 2025 to 2035.

    Growing Awareness of Energy Security

    The Global Bio Power Market Industry is increasingly influenced by the growing awareness of energy security among nations. As countries seek to reduce their dependence on fossil fuels and enhance energy independence, bioenergy emerges as a viable alternative. This shift is particularly evident in regions with abundant biomass resources, where local energy production can mitigate risks associated with energy supply disruptions. The emphasis on energy security is likely to drive investments in bioenergy projects, fostering a more resilient energy landscape. Consequently, this trend may contribute to the overall growth of the bio power market.

    Technological Advancements in Bioenergy

    Technological innovations play a crucial role in the Global Bio Power Market Industry, enhancing the efficiency and feasibility of bioenergy production. Advances in biomass conversion technologies, such as anaerobic digestion and gasification, are improving energy yields and reducing costs. For instance, the development of more efficient biogas plants has made it possible to convert organic waste into energy more effectively. These advancements not only contribute to the sustainability of bioenergy but also attract investments, further propelling market growth. As technology continues to evolve, it is likely to unlock new opportunities within the bio power sector.

    Market Segment Insights

    Bio Power Market Insights

    Bio Power by Technology Insights

    The Bio Power Market segmentation, based on technology the market has been segmented as direct combustion, cofiring & gasification, anaerobic digestion, pyrolysis, and landfill gas. Among these, the direct combustion segment dominated the global market with the largest revenue share of 53.98% in 2022 and is projected to dominate the Bio Power Market revenue through the projected period. Direct combustion involves burning the biomass in a boiler to heat water, then running the resulting steam through a turbine. It is the most common method for converting biomass to useful energy.

    All biomass can be burned directly for heating buildings and water, for providing industrial process heat, and for generating electricity in steam turbines. Biomass is burned in a boiler to produce high-pressure steam. 

    This steam flows over a series of turbine blades, causing them to rotate. The rotation of the turbine drives a generator, producing electricity. Biomass can also serve as substitute for a portion of coal in an existing power plant furnace in a process called co-firing (combusting two different types of materials at the same time).  Generally, direct combustion is carried out inside a furnace, steam turbine, or boiler at a temperature range of 800–1000°C.

    The cost of energy production from direct combustion is slightly higher as compared to pyrolysis and gasification due to the need of pretreatment of biomass, such as dehydrating, cutting, and crushing, before introducing into the combustion chamber.

    Bio Power by End-User Insights

    Get more detailed insights about Bio Power Market Research Report - Global Forecast to 2030

    Regional Insights

    Based on Region, the bio power market is segmented into North America, Europe, Asia-Pacific, Middle East & Africa, and Latin America. The Asia Pacific bio power market held the maximum market share of 43.10% in 2022 and is also expected to account for a significant revenue share during the forecast period. The Bio power market in the Asia Pacific region has experienced significant growth, driven by increasing awareness of environmental sustainability and the rise in the demand for cleaner energy sources.

    Governments across the region are actively promoting bioenergy projects, fostering a favorable regulatory environment.  Investments in biomass and biogas technologies have surged, supported by technological advancements and the rising need for energy security. The dynamic combination of favorable policies, technological innovation, and a growing commitment to green energy solutions positions the Asia Pacific Bio power market as a robust and expanding sector, contributing substantially to the region's sustainable energy transition.

    Key Players and Competitive Insights

    The Bio Power Market is characterized by the presence of many regional and local players. The market is competitive, with all the players continually competing to gain a larger market share. To stay competitive, market players engage in various strategies, including new product launches, partnerships, mergers and acquisitions, and expansion into new markets.  They invest in research and development to enhance product performance, improve efficiency, and meet evolving customer demands. Moreover, players focus on building strong distribution networks and establishing long-term relationships with customers to ensure a steady market presence.

    The growth of the vendors is dependent on market conditions, government support, and industrial development. Thus, the vendors should focus on expanding their presence and improving their services.

    Drax Group:Drax Group is a leading renewable energy company that generates renewable energy. The company produces sustainable biomass and sells renewable electricity to commercial customers. It is the UK's primary source of renewable energy. The company operates its business in sustainable biomass, hydroelectric, and pumped hydro storage assets.  The business portfolio of the company is flexible, low-carbon, and renewable UK power assets that provide the energy grid with dispatchable, renewable power and system support services. Drax Group has four generation facilities in England and Scotland.

    In addition, the company maintains a global bioenergy supply business with 13 manufacturing facilities in the United States and Canada, producing compressed wood pellets for its usage as well as customers in 38 locations across Europe and Asia.

    BP PLC:BP PLC, an integrated oil and gas company, has a diverse range of operations that include exploration, production, transportation, refining, and marketing of oil, natural gas, and petroleum products. The company’s operations can be categorized into three segments: upstream, downstream, and Rosneft. The upstream segment focuses on exploration, development, and production of oil and natural gas.  The downstream segment involves refining, manufacturing, marketing, and trading of crude oil, petroleum, petrochemical products, and related services. The Rosneft segment represents BP's equity investment in Rosneft, a Russian oil company.

    Moreover, BP PLC has also made efforts to expand its presence in renewable energy, including bio power. For instance, the company has announced a major expansion in renewable energy by combining its Brazilian biofuels and bio power businesses with Bunge, creating BP Bunge Bioenergia.  This venture aims to be a world-scale, highly-efficient producer of sugarcane ethanol in Brazil, contributing to BP's biofuels business. Furthermore, the company has its operations worldwide including Europe, Asia Pacific, Americas, and Africa & Middle East.

    Bio Power Industry Developments

    July 2022: Drax and MOL Drybulk collaborated to create wind power technologies that will cut biomass shipping emissions by one-fifth. MOL's Wind Challenger hard sail technology will be used on new vessels, with the first ship scheduled as early as 2025. The program is part of Drax's plans to use bioenergy with carbon capture and storage (BECCS) to cut supply chain emissions and achieve carbon negative by 2030.   

    July 2023: BP PLC is strengthening its investment in bioenergy by partnering with US biofuels developer WasteFuel. In a move to support the development of a global network of plants, BP has invested USD 10 million in WasteFuel. The objective of this collaboration is to convert municipal and agricultural waste into bio-methanol, a biofuel that has the potential to play a crucial role in decarbonizing challenging sectors such as shipping. Recently, Drax Group partnered with Molpus Woodlands Group in February 2024. In so doing, they can acquire a source of sustainable woody biomass.

    The concept behind this biomass is to use it as fuel for the company’s bioenergy operations combined with Carbon Capture and Storage (CCS) plants located in the southeastern US.

    On December 2023, MVV Energie AG, based in Mannheim, signed a letter of intent alongside Reutlinger FairEnergie GmbH, Stadtwerke Tübingen GmbH and Stadtwerke Balingen.

    This agreement involves the establishment of a project company that will facilitate the construction, funding and subsequent operation of a biogas upgrading plant within Meßstetten town, which is located in Zollernalb district Baden-Württemberg; Evero Energy Group Limited – previously known as Bioenergy Infrastructure Group—announced that Mitsubishi Heavy Industries Ltd. (MHI), one of the global industrial leaders, had become its strategic partner The Ince bio-power site owned by Evero Energy will be sited at an InBECCS Project—a wood-waste-fired power station near the Hynet industrial cluster in north-west England.

    Therefore, introducing the InBECCS scheme at Ince is an important step toward achieving its sustainability goals. In 2030, reducing aviation emissions by 20%, and backing three billion gallons of renewable fuels from sustainable feedstock, among other proposals and undertakings, have been limited because of the US government’s restrictions while supporting their agriculture & manufacturers through extra income to producers but helping the Government in climate change mitigation.

    According to EPA estimates, several landfills could effectively support gas-to-energy projects, and EPA has also established a Landfill Methane Outreach Program, which was created to cost-effectively reduce methane emissions from landfills while promoting eco-friendly as well as economically beneficial landfill gas-to-energy projects.
    Key Companies in the Bio Power Market market include

    Industry Developments

    July 2022: Drax and MOL Drybulk collaborated to create wind power technologies that will cut biomass shipping emissions by one-fifth. MOL's Wind Challenger hard sail technology will be used on new vessels, with the first ship scheduled as early as 2025. The program is part of Drax's plans to use bioenergy with carbon capture and storage (BECCS) to cut supply chain emissions and achieve carbon negative by 2030.   

    July 2023: BP PLC is strengthening its investment in bioenergy by partnering with US biofuels developer WasteFuel. In a move to support the development of a global network of plants, BP has invested USD 10 million in WasteFuel. The objective of this collaboration is to convert municipal and agricultural waste into bio-methanol, a biofuel that has the potential to play a crucial role in decarbonizing challenging sectors such as shipping. Recently, Drax Group partnered with Molpus Woodlands Group in February 2024. In so doing, they can acquire a source of sustainable woody biomass.

    The concept behind this biomass is to use it as fuel for the company’s bioenergy operations combined with Carbon Capture and Storage (CCS) plants located in the southeastern US.

    On December 2023, MVV Energie AG, based in Mannheim, signed a letter of intent alongside Reutlinger FairEnergie GmbH, Stadtwerke Tübingen GmbH and Stadtwerke Balingen.

    This agreement involves the establishment of a project company that will facilitate the construction, funding and subsequent operation of a biogas upgrading plant within Meßstetten town, which is located in Zollernalb district Baden-Württemberg; Evero Energy Group Limited – previously known as Bioenergy Infrastructure Group—announced that Mitsubishi Heavy Industries Ltd. (MHI), one of the global industrial leaders, had become its strategic partner The Ince bio-power site owned by Evero Energy will be sited at an InBECCS Project—a wood-waste-fired power station near the Hynet industrial cluster in north-west England.

    Therefore, introducing the InBECCS scheme at Ince is an important step toward achieving its sustainability goals. In 2030, reducing aviation emissions by 20%, and backing three billion gallons of renewable fuels from sustainable feedstock, among other proposals and undertakings, have been limited because of the US government’s restrictions while supporting their agriculture & manufacturers through extra income to producers but helping the Government in climate change mitigation.

    According to EPA estimates, several landfills could effectively support gas-to-energy projects, and EPA has also established a Landfill Methane Outreach Program, which was created to cost-effectively reduce methane emissions from landfills while promoting eco-friendly as well as economically beneficial landfill gas-to-energy projects.

    Key Companies in the Bio Power Market include.

      • Drax Group
      • BP PLC
      • Leo Group
      • Statkraft AS
      • Ørsted A/S
      • Afry AB
      • Thachang Green Energy Public Company Limited
      • Oulun Energia
      • Hyogo Pulp Co., Ltd.
      • Erex Group
      • Other Key Players

    Future Outlook

    Bio Power Market Future Outlook

    The Global Bio Power Market is projected to grow at a 5.9% CAGR from 2024 to 2035, driven by increasing renewable energy demand and technological advancements.

    New opportunities lie in:

    • Invest in advanced biomass conversion technologies to enhance efficiency and reduce costs.
    • Develop strategic partnerships with agricultural sectors for sustainable feedstock supply.
    • Explore innovative financing models to support bioenergy project development and expansion.

    By 2035, the Bio Power Market is expected to achieve substantial growth, positioning itself as a key player in the global energy landscape.

    Market Segmentation

    Bio Power End-User Outlook

    • Industrial
    • Commercial
    • Residential

    Bio Power Technology Outlook

    • Direct Combustion
    • Cofiring & Gasification
    • Anaerobic Digestion
    • Pyrolysis
    • Landfill Gas

    Bio Power Market Regional Outlook

    North America
    • US
    • Canada

    Report Scope

    Attribute/Metric Details
    Market Size 2022 USD 91,9985.11 million
    Market Size 2023 USD 2,33,864.9 million
    Market Size 2030 USD 1,42,703.07 million
    Compound Annual Growth Rate (CAGR) 5.72% (2023-2030)
    Base Year 2022
    Forecast Period 2023-2030
    Historical Data 2019 & 2021
    Forecast Units Value (USD Million)
    Report Coverage Revenue Forecast, Competitive Landscape, Growth Factors, and Trends
    Segments Covered Technology, End-User, and Region
    Geographies Covered North America, Europe, Asia Pacific, Middle East & Africa and Latin America
    Countries Covered US, Canada, Germany, UK, France, Russia, Italy, Spain, China, India, Japan, South Korea, Brazil, Mexico, Argentina, GCC Countries, South Africa
    Key Companies Profiled Drax Group, BP PLC, Leo Group, Statkraft AS, Ørsted A/S, Afry AB, Thachang Green Energy Public Company Limited, Oulun Energia, Hyogo Pulp Co., Ltd., Erex Group, and Other Key Players.
    Key Market Opportunities Surging favorable regulations and initiatives by government and major market players expected to drive market forward in forecast period.
    Key Market Dynamics Rising need to control greenhouse gas emission.Depletion of energy resources driving the market growth

    Market Highlights

    Author

    Anshula Mandaokar
    Team Lead - Research

    She holds an experience of about 6+ years in market research and business consulting, working under the spectrum of information communication technology, telecommunications and semiconductor domains. aarti conceptualizes and implements a scalable business strategy and provides strategic leadership to the clients. her expertise lies in market estimation, competitive intelligence, pipeline analysis, customer assessment, etc.

    Leave a Comment

    Latest Comments

    John Doe

    This is a great article! Really helped me understand the topic better.

    Posted on July 23, 2025, 10:15 AM
    Jane Smith

    Thanks for sharing this. I’ve bookmarked it for later reference.

    Posted on July 22, 2025, 7:45 PM

    FAQs

    What is Bio Power?

    Bio power is a renewable source of energy which is derived from biological sources such as bio fuels, biomass, and organic waste.

    Which region held the largest market share in the Bio Power Market?

    The Asia Pacific region dominated the Bio Power Market with the largest market revenue share of 43.10% in 2022.

    Who are the key players in the Bio Power Market?

    Drax Group, BP PLC, Leo Group, Statkraft AS, Ørsted A/S, Afry AB, Thachang Green Energy Public Company Limited, Oulun Energia, Hyogo Pulp Co., Ltd., Erex Group, and Other Key Players.

    Which technology had the largest market share in the bio power market?

    The direct combustion segment dominated the global market with the largest revenue share of 53.98% in 2022

    Which end-user had the largest market share in the bio power market?

    The industrial segment dominated the Bio Power Market with the largest market revenue share of 35.78% in 2022

    1. 'Table of Contents  
    2. 1    Executive Summary   2    Market Introduction
      1.     Market Definition
      2.     Scope of the Study
      3.     Market Structure 3    Research Methodology 
      4.     Primary Research
      5.     Secondary Research
      6.     Market size Estimation
      7.     Forecast Model
      8.     
      9.     Limitations of the study 4    Market Insights  5    Market Dynamics 
      10.     Introduction
      11.     Market Drivers
      12.     Market Restraints
      13.     Market Opportunities
      14.   
    3.  Value Chain/Supply Chain Analysis
      1.     Porter’s Five Forces Analysis
        1.     Threat of New Entrants
        2.   
    4.  Bargaining Power of Buyers
      1.     Bargaining Power of Suppliers
        1.     Threat of Substitutes
        2.   
    5.  Intensity of Rivalry         6  
    6.  Global Bio Power Market, By Technology
      1.     Introduction
      2.     Direct Combustion
        1.     Market Estimates & Forecast, 2020-2027
        2.     Market Estimates & Forecast by Region, 2020-2027
      3.     Cofiring
        1.   
    7.  Market Estimates & Forecast, 2020-2027
      1.     Market
    8. Estimates & Forecast by Region, 2020-2027
      1.     Gasification
        1.     Market Estimates & Forecast, 2020-2027
        2.   
    9.  Market Estimates & Forecast by Region, 2020-2027
      1.     Anaerobic digestion
        1.     Market Estimates & Forecast
        2.     Market Estimates & Forecast by Region
      2.     Pyrolysis
        1.     Market
    10. Estimates & Forecast, 2020-2027
      1.     Market Estimates
    11. & Forecast by Region, 2020-2027
      1.     Landfill gas
        1.   
    12.  Market Estimates & Forecast, 2020-2027
      1.     Market
    13. Estimates & Forecast by Region, 2020-2027 7    Global Bio
    14. Power Market, By End-User
      1.     Introduction
      2.     Residential
        1.     Market Estimates & Forecast
        2.     Market Estimates & Forecast by Region
      3.     Commercial
        1.     Market
    15. Estimates & Forecast, 2020-2027
      1.     Market Estimates
    16. & Forecast by Region, 2020-2027
      1.     Industrial
        1.   
    17.  Market Estimates & Forecast, 2020-2027
      1.     Market
    18. Estimates & Forecast by Region, 2020-2027
      1.     Others
        1.     Market Estimates & Forecast, 2020-2027
        2.   
    19.  Market Estimates & Forecast by Region, 2020-2027 8    Global
    20. Bio Power Market, By Region
      1.     Introduction
      2.     North America
        1.     Market Estimates & Forecast, By Country, 2020-2027
        2.     Market Estimates & Forecast, By Technology, 2020-2027
        3.     Market Estimates & Forecast, By End-User, 2020-2027
        4.     US 
    21.  Market Estimates & Forecast, By Technology, 2020-2027
      1.   
    22.  Market Estimates & Forecast, By End-User, 2020-2027
      1.     Canada
        1.     Market Estimates & Forecast, By Technology, 2020-2027
        2.     Mexico  
    23.  Market Estimates & Forecast, By Technology, 2020-2027
      1.   
    24.  Market Estimates & Forecast, By End-User, 2020-2027
      1.     Europe
        1.     Market Estimates & Forecast, By Country
        2.     Market Estimates & Forecast, By Technology
        3.     Market Estimates & Forecast, By End-User
        4.     UK
    25. Estimates & Forecast, By Technology, 2020-2027
      1.     Market
    26. Estimates & Forecast, By End-User, 2020-2027
      1.     Germany
        1.     Market Estimates & Forecast, By Technology, 2020-2027
        2.     France
    27. & Forecast, By Technology, 2020-2027
      1.     Market Estimates
    28. & Forecast, By End-User, 2020-2027
      1.     Italy
        1.   
    29.  Market Estimates & Forecast, By Technology, 2020-2027
      1.   
    30.  Market Estimates & Forecast, By End-User, 2020-2027
      1.     Rest of Europe
        1.     Market Estimates & Forecast, By Technology, 2020-2027
      2.     Asia-Pacific
        1.   
    31.  Market Estimates & Forecast, By Country, 2020-2027
      1.   
    32.  Market Estimates & Forecast, By Technology, 2020-2027
      1.   
    33.  Market Estimates & Forecast, By End-User, 2020-2027
      1.     China
        1.     Market Estimates & Forecast, By Technology
        2.     Japan
    34. Estimates & Forecast, By Technology, 2020-2027
      1.     Market
    35. Estimates & Forecast, By End-User, 2020-2027
      1.     India
        1.     Market Estimates & Forecast, By Technology, 2020-2027
        2.     Rest of Asia-Pacific
    36. Estimates & Forecast, By Technology, 2020-2027
      1.     Market
    37. Estimates & Forecast, By End-User, 2020-2027
      1.     Middle East & Africa
        1.     Market Estimates & Forecast, By Country, 2020-2027
        2.     Market Estimates & Forecast, By Technology, 2020-2027
        3.     Market Estimates & Forecast, By End-User, 2020-2027
        4.     UAE
    38.  Market Estimates & Forecast, By Technology, 2020-2027
      1.   
    39.  Market Estimates & Forecast, By End-User, 2020-2027
      1.     Saudi Arabia
        1.     Market Estimates & Forecast, By Technology, 2020-2027
        2.     South Africa
    40.  Market Estimates & Forecast, By Technology, 2020-2027
      1.   
    41.  Market Estimates & Forecast, By End-User, 2020-2027
      1.   
    42.  Rest of Middle East & Africa
      1.     Market Estimates
    43. & Forecast, By Technology, 2020-2027
      1.     Market Estimates
    44. & Forecast, By End-User, 2020-2027
      1.     South America
        1.     Market Estimates & Forecast, By Country, 2020-2027
        2.     Market Estimates & Forecast, By Technology, 2020-2027
        3.     Market Estimates & Forecast, By End-User, 2020-2027
        4.     Brazil
    45. & Forecast, By Technology, 2020-2027
      1.     Market Estimates
    46. & Forecast, By End-User, 2020-2027
      1.     Argentina
        1.     Market Estimates & Forecast, By Technology, 2020-2027
        2.     Rest of South America
    47. Estimates & Forecast, By Technology, 2020-2027
      1.     Market
    48. Estimates & Forecast, By End-User, 2020-2027 9    Competitive Landscape
      1.     Competitive Scenario
      2.     Competitive
    49. Benchmarking of the Global Bio Power Market 
      1.     Major
    50. Growth Strategy in the Global Bio Power Market
      1.     Market
    51. Share Analysis: Global Bio Power Market 
      1.     Schlumberger:
    52. The Leading Player in terms of Number of Developments in Global Bio Power Market   
      1.     New Product Development 
      2.     Mergers & Acquisitions 
      3.     Contracts & Agreements 
      4.     Expansions & Investments      10    Company Profile
      5.     Dalkia (France)
        1.     Company Overview
        2.     Product/Services Offered
        3.     Key Developments
        4.     SWOT Analysis
        5.     Strategy
      6.     EnviTec Biogas AG (Germany)
        1.     Company Overview
        2.     Product/Services Offered
        3.     Key Developments
        4.     SWOT Analysis
        5.     Strategy
      7.     Schmack Biogas GmbH (Germany)
        1.     Company Overview
        2.     Product/Services Offered
        3.     Key Developments
        4.     SWOT Analysis
        5.     Strategy
      8.     WELTEC BIOPOWER GMBH (Germany)
        1.     Company Overview
        2.     Product/Services Offered
        3.     Key Developments
        4.     SWOT Analysis
        5.     Strategy
      9.     Ørsted A/S (Denmark)
        1.     Company Overview
        2.     Product/Services Offered
        3.     Key Developments
        4.     SWOT Analysis
        5.     Strategy
      10.     ElectraTherm (Georgia)
        1.     Company Overview
        2.     Product/Services Offered
        3.     Key Developments
        4.     SWOT Analysis
        5.     Strategy
      11.     Babcock & Wilcox Enterprises, Inc. (US)
        1.     Company Overview
        2.     Product/Services Offered
        3.     Key Developments
        4.     SWOT Analysis
        5.     Strategy
      12.     Ameresco (US)
        1.     Company Overview
        2.     Product/Services Offered
        3.     Key Developments
        4.     SWOT Analysis
        5.     Strategy
      13.     MVV Energie AG (Germany)
        1.     Company Overview
        2.     Product/Services Offered
        3.     Key Developments
        4.     SWOT Analysis
        5.     Strategy
      14.     Enerkem (Canada)
        1.     Company Overview
        2.     Product/Services Offered
        3.     Key Developments
        4.     SWOT Analysis
        5.     Strategy    
    53. Note:  The companies listed above are based on initial secondary research
    54. the detailed list of players will be covered in the final study and according to the client requirement.  
    55.      Global Bio Power Market: By Region, 2020-2027   Country, 2020-2027  
    56. Bio Power Market: By Country, 2020-2027  
    57.  Asia-Pacific Bio Power Market: By Country, 2020-2027  
    58.      Middle East & Africa Bio Power Market: By Country
    59. Market: By Country, 2020-2027  
    60.  Global Bio Power Market By Technology: By Regions, 2020-2027  
    61. 8         North America Bio Power Market By Technology:
    62. By Country, 2020-2027  
    63. Bio Power Market By Technology: By Country, 2020-2027  
    64.  Asia-Pacific Bio Power Market By Technology: By Country, 2020-2027  
    65. By Country, 2020-2027  
    66. Market By Technology: By Country, 2020-2027  
    67. Bio Power Market, By End-User, By Regions, 2020-2027  
    68.  North America Bio Power Market, By End-User, By Country, 2020-2027    
    69. By Country, 2020-2027  
    70. Bio Power Market, By End-User, By Country, 2020-2027  
    71.  South America Bio Power Market, By End-User, By Country, 2020-2027  
    72. 22    North America: Bio Power Market, By End-User
    73.  Europe:  Bio Power Market, By Country  
    74.  Europe:  Bio Power Market, By Technology
    75.  Bio Power Market, By End-User
    76.  Bio Power Market, By Country
    77.  Bio Power Market, By Technology
    78.  Bio Power Market, By End-User
    79. & Africa:  Bio Power Market, By Region
    80. East & Africa: Bio Power Market, By Technology
    81. East & Africa: Bio Power Market, By End-User
    82. America:  Bio Power Market, By Region
    83. America: Bio Power Market, By Technology
    84. Bio Power Market, By End-User 
    85. 2        Top Down & Bottom Up Approach
    86. 3        Market Dynamics
    87.      Impact Analysis: Market Drivers
    88.      Impact Analysis: Market Restraints
    89.      Porter’s Five Forces Analysis
    90.      Value Chain Analysis
    91.  Global Bio Power Market Share, By Technology, 2020 (%)
    92.      Global Bio Power Market, By Technology, 2020-2027 (USD Million)
    93. 2020 (%)
    94. 2020-2027 (USD Million)
    95. Share (%), BY REGION, 2020
    96. BY REGION, 2020-2027 (USD Million)
    97. Bio Power Market Share (%), 2020
    98. Bio Power Market by Country, 2020-2027 (USD Million)
    99.  Europe Bio Power Market Share (%), 2020
    100. Bio Power Market by Country, 2020-2027 (USD Million)
    101.  Asia-Pacific Bio Power Market Share (%), 2020
    102. Bio Power Market by Country, 2020-2027 (USD Million)
    103.  Middle East & Africa Bio Power Market Share (%), 2020
    104.  Middle East & Africa Bio Power Market by Country, 2020-2027 (USD Million) (USD Million)'

    Bio Power Market Segmentation

    Market Segmentation Overview

    • Detailed segmentation data will be available in the full report
    • Comprehensive analysis by multiple parameters
    • Regional and country-level breakdowns
    • Market size forecasts by segment
    Infographic

    Free Sample Request

    Kindly complete the form below to receive a free sample of this Report

    Get Free Sample

    Customer Strories

    “I am very pleased with how market segments have been defined in a relevant way for my purposes (such as "Portable Freezers & refrigerators" and "last-mile"). In general the report is well structured. Thanks very much for your efforts.”

    Victoria Milne

    Founder
    Case Study

    Smartphone Motherboard Parts Manufacturing Research