• Cat-intel
  • MedIntelliX
  • Resources
  • About Us
  • Hero Background
    English
    Chinese
    French
    Japanese
    Korean
    German
    Spanish

    Airside Services Market Share

    ID: MRFR/A&D/10287-HCR
    128 Pages
    Swapnil Palwe
    October 2025

    Airside Services Market Research Report Information By Airport Class (Class A, Class B, Class C, and Class D), By Operation (Aircraft Handling, Passenger Handling, and Cargo Handling), By Platform (Hardware, Software, and Service), By End Use (Commercial and Military), and By Region (North America, Europe, Asia-Pacific, and Rest Of The World) – Market Forecast Till 2035

    Share:
    Download PDF ×

    We do not share your information with anyone. However, we may send you emails based on your report interest from time to time. You may contact us at any time to opt-out.

    Airside Services Market Infographic
    $ 4,950.0
    $ 5,950.0
    $ 7,250.0

    Market Share

    Airside Services Market Share Analysis

    The Airside Services market encompasses a broad range of essential ground handling activities at airports, including aircraft handling, passenger services, baggage handling, and aircraft refueling, among others. In this bustling industry, companies are strategically positioning themselves to cater to the increasing demand for efficient and reliable airside services in the aviation sector. One fundamental strategy within this market is differentiation. Companies aim to differentiate their airside services by offering unique features, performance characteristics, and specialized solutions tailored to the specific needs of different airports and airlines. This could involve providing a comprehensive suite of services encompassing ground handling, ramp operations, and aircraft servicing, as well as specialized services such as de-icing, catering, and cargo handling. By offering airside services with distinct advantages over competitors, companies can attract customers seeking efficient, safe, and cost-effective solutions, thereby gaining a competitive edge and increasing their market share. Pricing strategies also play a significant role in market share positioning within the Airside Services market. Some companies may adopt a cost leadership approach, aiming to capture market share by offering their services at competitive prices compared to rival providers. This strategy can be particularly effective in segments where airlines prioritize cost efficiency without compromising on service quality or safety standards. Conversely, other companies may pursue premium pricing, positioning themselves as providers of high-quality airside services with superior reliability, efficiency, and customer satisfaction. While this approach may limit market share in terms of volume, it can lead to higher profit margins and revenue from customers valuing top-tier service standards. Additionally, distribution strategies are crucial for expanding market reach and capturing a larger share of the Airside Services market. Companies may establish strategic partnerships with airport operators, airlines, and aviation authorities to ensure widespread availability and adoption of their service offerings. Moreover, investing in efficient distribution networks, operational infrastructure, and workforce management can enhance service delivery capabilities and customer satisfaction, ultimately driving market share growth. By optimizing distribution channels and providing seamless access to their services, companies can increase their market share and establish a strong presence in the airside services market. Marketing and branding efforts also play a vital role in market share positioning within the Airside Services market. Companies invest in targeted marketing campaigns to raise awareness of their brand and service offerings among airport operators, airlines, and aviation stakeholders. This may involve showcasing the reliability, efficiency, and safety record of airside services through case studies, testimonials, and industry certifications. Additionally, participating in aviation industry events, trade shows, and conferences can provide opportunities to showcase capabilities, network with key decision-makers, and forge partnerships. By effectively communicating the value proposition of their services and building a reputable brand image, companies can enhance their market share and competitiveness in the airside services market. Furthermore, continuous innovation is essential for maintaining market share positioning and driving growth in the Airside Services market. Companies must invest in research and development to develop next-generation service solutions, improve operational efficiency, and address emerging trends such as automation, digitalization, and sustainability. By staying at the forefront of technological advancements and offering innovative service offerings, companies can attract new customers, retain existing ones, and solidify their market share in this dynamic and competitive sector.

    Market Summary

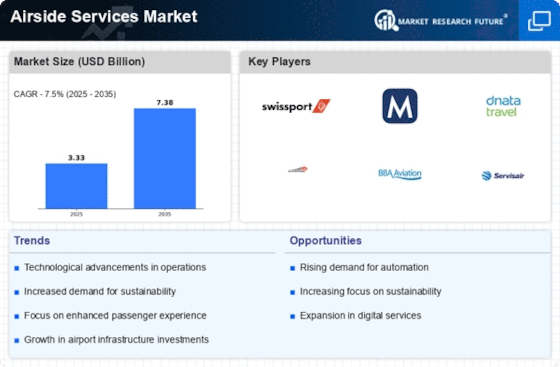
    The Global Airside Services Market is projected to grow from 3.33 USD Billion in 2024 to 7.39 USD Billion by 2035, reflecting a robust CAGR of 7.5%.

    Key Market Trends & Highlights

    Airside Services Key Trends and Highlights

    • The market is expected to expand significantly, reaching 7.39 USD Billion by 2035 from a base value of 3.33 USD Billion in 2024.
    • A compound annual growth rate of 7.5% is anticipated for the period from 2025 to 2035, indicating strong growth potential.
    • The increasing demand for efficient ground handling services is likely to drive market expansion in the coming years.
    • Growing adoption of advanced technology due to the need for enhanced operational efficiency is a major market driver.

    Market Size & Forecast

    2024 Market Size 3.33 (USD Billion)
    2035 Market Size 7.39 (USD Billion)
    CAGR (2025-2035) 7.50%
    Largest Regional Market Share in 2024 latin_america)

    Major Players

    Aena, Amadeus IT Group SA, Cisco Systems, Inc., Daifuku Co. Ltd, Damarel System International Ltd., Honeywell International Inc., HUAWEI TECHNOLOGIES CO., LTD., IBM, INFORM GMBH, Indra, QinetiQ, Raytheon Technologies Corporation, Siemens, SITA, Teledyne Technologies Incorporated, Thales

    Market Trends

    The increasing private participation in ground handling & maintenance is driving the market growth

    Due to increased private engagement in ground handling & maintenance and growing liberalisation, the global market for airside services is anticipated to grow steadily over the course of the projected period. Trade liberalisation combined with a supportive regulatory framework is crucial for driving the market and advancing the growth of global businesses like tourism. Liberalisation also has an impact on pricing strategy and network optimisation, which lowers the production effectiveness of the aviation industry.

    Major ramp services, fuel and oil handling services, pushback tractors, aerobridges, towbars, baggage handling at the sorting area, service segmentation, aircraft servicing, aircraft maintenance services, and regulatory environment & governing bodies are some of the key services falling under this market.

    The growth of the airside services sector is anticipated to be fueled by rising passenger and freight air traffic, a positive prognosis for the commercial aviation sector, and rising demand for Low-Cost Carriers (LCCs). The factors favourably affecting the market expansion are the rising popularity of on-airport de-icing services, rising demand for oil & handling services, along with rising need for ramp handling services. Airport ramp handling services, which include safety regulations and suitable ground handling, guarantee effective aircraft turnaround, resulting in the scheduled arrival and departure of the flights.

    As a result, it is anticipated that increased use of baggage handling services such as Mass Rapid Transit System (MRTS), which includes X-Ray baggage scanning systems for small bags as well as baggage scanning at airports to protect nations from terrorist and anti-social threats, will positively affect the market for airside services.

    The future course of airport administration is likely to depend on how well each stakeholder performs. It is planned that all agents—landside, terminal, and airside—will be integrated onto a single platform, allowing for real-time analysis to support decision-making. Total airport management (TAM) encourages data-driven decision making, thorough KPI tracking, and the integration of operations by integrating processes and systems throughout the airport. The Airport Operational Plan (AOP) can be developed, adopted, and maintained based on performance thanks to TAM's performance-based airside services.

    This guarantees justice, resolves any potential conflicts of interest between stakeholders, and assures that everyone is working as hard as they can to achieve a common goal.  Thus, driving the Airside Services market revenue.

    The Global Airside Services Market is poised for growth as airports increasingly prioritize efficiency and passenger experience, driven by advancements in technology and evolving regulatory frameworks.

    Federal Aviation Administration (FAA)

    Airside Services Market Market Drivers

    Focus on Sustainability

    Sustainability initiatives are increasingly influencing the Global Airside Services Market Industry. Airports and airlines are prioritizing eco-friendly practices, such as reducing carbon emissions and minimizing waste. This shift is prompting investments in sustainable technologies and services, including electric ground support equipment and energy-efficient facilities. Governments are also implementing regulations to promote greener operations, which may further accelerate the adoption of sustainable airside services. As the industry moves towards a more sustainable future, the demand for environmentally responsible airside solutions is likely to grow, aligning with global efforts to combat climate change.

    Market Growth Projections

    The Global Airside Services Market Industry is projected to experience robust growth, with a market value of 3.33 USD Billion in 2024 and an anticipated increase to 7.39 USD Billion by 2035. This growth trajectory suggests a compound annual growth rate of 7.5% from 2025 to 2035. Factors contributing to this expansion include rising air traffic, technological advancements, and a focus on sustainability. As the industry adapts to changing demands and regulatory environments, the market is likely to evolve, presenting opportunities for stakeholders to innovate and enhance service offerings.

    Technological Advancements

    Technological innovations play a pivotal role in shaping the Global Airside Services Market Industry. The integration of automation, artificial intelligence, and data analytics is transforming airside operations, enhancing efficiency and safety. For instance, automated baggage handling systems are being adopted to streamline processes, reduce turnaround times, and minimize human error. These advancements not only improve operational performance but also contribute to cost savings for airlines and airports. As the industry evolves, the adoption of such technologies is expected to drive market growth, potentially leading to a market value of 7.39 USD Billion by 2035.

    Increasing Air Traffic Volume

    The Global Airside Services Market Industry is experiencing a notable surge in air traffic volume, driven by rising passenger demand and the expansion of global trade. In 2024, the market is valued at approximately 3.33 USD Billion, reflecting the growing need for efficient airside operations. Airports worldwide are investing in advanced technologies and infrastructure to accommodate this increase, which may lead to enhanced service offerings. The International Air Transport Association projects that global air passenger numbers could reach 8.2 billion by 2037, further emphasizing the necessity for robust airside services to manage this anticipated growth.

    Expansion of Airport Infrastructure

    The expansion of airport infrastructure is a critical driver for the Global Airside Services Market Industry. As air travel demand increases, many countries are investing in the development and modernization of airport facilities. This includes the construction of new terminals, runways, and airside services facilities to accommodate larger aircraft and higher passenger volumes. Such investments not only enhance operational capacity but also improve the overall passenger experience. With the ongoing expansion efforts, the market is poised for growth, potentially reaching a valuation of 7.39 USD Billion by 2035, as airports strive to meet the evolving needs of travelers.

    Regulatory Compliance and Safety Standards

    The Global Airside Services Market Industry is significantly impacted by stringent regulatory compliance and safety standards. Governments and aviation authorities impose regulations to ensure the safety and security of airside operations. Compliance with these regulations necessitates continuous investment in training, technology, and infrastructure. Airports must adhere to guidelines set by organizations such as the International Civil Aviation Organization, which may drive demand for specialized airside services. As safety remains a top priority, the industry is likely to witness sustained growth, with a projected CAGR of 7.5% from 2025 to 2035, reflecting the importance of maintaining high safety standards.

    Market Segment Insights

    Airside Services Airport Class Insights

    Airside Services Airport Class Insights

    The Airside Services Market segmentation, based on airport class, includes class A, class B, class C, and class D. The class B segment dominated the global market in 2022. Due to growing expansion in the tourism, business, and other sectors, a surge in domestic flights is anticipated to fuel segment growth. The CAGR for domestic passenger traffic is predicted to be 10% between 2022 and 2029 by the World Airport Transport Service. Rising air travel in developing nations like China and India will promote market expansion.

    Airside Services Operation Insights

    Airside Services Operation Insights

    The Airside Services Market segmentation, based on operation, includes more aircraft handling, passenger handling, and cargo handling. The passenger handling segment dominated the global market in 2022. From initial check-in through boarding, passenger service streamlines the flow of customers. This rise is brought on by an increase in the number of airports and airlines operating globally, as well as an increase in the cost of air travel. The International Civil Aviation Organisation (ICAO) projects that during the next 20 years, annual growth in passenger traffic would average 4.2% worldwide.

    Airside Services Platform Insights

    Airside Services Platform Insights

    The Airside Services Market segmentation, based on platform, includes hardware, software, and service. Hardware segment dominated the Airside Services Market in 2022. This is brought on by improvements in OEM baggage handling technology and rising airport security concerns. Ramp processing services are in high demand as a result of growing need for aircraft unloading, pushback, loading planning, shunting, surface maintenance and airport transportation.

    Airside Services End Use Insights

    Airside Services End Use Insights

    The Airside Services Market segmentation, based on end use, includes commercial and military. The commercial segment dominated the Airside Services Market in 2022. During the projected period, it is anticipated that demand for the commercial segment will increase due to rising demand for air freight to transfer commodities, such as emergency medical services, during a pandemic.

    Figure 1: Airside Services Market, by End Use, 2025 & 2034 (USD Billion)

    Source: Secondary Research, Primary Research, Market Research Future Database and Analyst Review

    Get more detailed insights about Airside Services Market Research Report—Global Forecast till 2034

    Regional Insights

    By region, the study provides the market insights into North America, Europe, Asia-Pacific and Rest of the World. The North America Airside Services Market dominated this market in 2022 (45.80%). This is due to widespread technological use, strict air travel regulations, and steadily rising air traffic. Airport growth and order backlogs for business and commercial aircraft in North America have fueled market demand. Further, the U.S. Airside Services market held the largest market share, and the Canada Airside Services market was the fastest growing market in the North America region.

    Further, the major countries studied in the market report are The US, Canada, German, France, the UK, Italy, Spain, China, Japan, India, Australia, South Korea, and Brazil.

    Figure 2: AIRSIDE SERVICES MARKET SHARE BY REGION 2024 (USD Billion)

    Source: Secondary Research, Primary Research, Market Research Future Database and Analyst Review

    Europe Airside Services market accounted for the healthy market share in 2022. This expansion is the result of increased air travel in nations like the United Kingdom, Germany, and France. Spending more money in the aviation industry will also help the European market flourish. Further, the German Airside Services market held the largest market share, and the U.K Airside Services market was the fastest growing market in the European region

    The Asia Pacific Airside Services market is expected to register significant growth from 2023 to 2032. Increased domestic and international passenger travel is anticipated to promote market expansion. The demand for better ground and cargo handling services at airports would also rise as a result of significant investment in new airport projects in India. The market in Asia Pacific is also being driven by the rise in demand for IoT-based interface at airports for better customer experiences and surveillance activities.

    Moreover, China’s Airside Services market held the largest market share, and the Indian Airside Services market was the fastest growing market in the Asia-Pacific region.

    Key Players and Competitive Insights

    Leading market players are investing heavily in research and development in order to expand their product lines, which will help the Airside Services market, grow even more. Market participants are also undertaking a variety of strategic activities to expand their global footprint, with important market developments including new product launches, contractual agreements, mergers and acquisitions, higher investments, and collaboration with other organizations. To expand and survive in a more competitive and rising market climate, Airside Services industry must offer cost-effective items.

    Manufacturing locally to minimize operational costs is one of the key business tactics used by manufacturers in the global Airside Services industry to benefit clients and increase the market sector. In recent years, the Airside Services industry has offered some of the most significant advantages to medicine. Major players in the Airside Services market, including Aena, Amadeus IT Group SA, Cisco Systems, Inc., Daifuku Co.

    Ltd, Damarel System International Ltd., Honeywell International Inc., HUAWEI TECHNOLOGIES CO., LTD., IBM, INFORM GMBH, Indra, QinetiQ, Raytheon Technologies Corporation, Siemens, SITA, Teledyne Technologies Incorporated, and Thales, are attempting to increase market demand by investing in research and development operations.

    A media and communications company is Havas SA (Havas). Advertising, analytics and decision sciences, brand designing, brand strategies, content development and administration, digital commerce, direct marketing, and engagement planning are all services that the company provides. Additionally, it provides services for designing user experiences, product development, social marketing, healthcare communications, mobile marketing, PR, corporate communications, and integrated planning, buying, contest, and marketing support services across channels. Additionally, the business has a number of cooperative workspaces known as Havas villages around the globe that allow colleagues from different fields and media and creative companies to collaborate.

    Operating in the Americas, Europe, Asia Pacific, and Africa are Havas and its subsidiaries. The headquarters of Havas are in Paris, Ile-de-France, France. Havaş purchased MZLZ Ground Handling Services in February 2022 to operate at Zagreb Airport (ZAG). Zagreb is now the 31st air terminal in Havaş' portfolio because to this new arrangement. In Zagreb, Croatia, Havaş has announced that it will begin offering airport services.

    Ground and air cargo handling services are offered by Swissport International AG (Swissport). Passenger services, ramp handling, lounge hospitality, fueling, aircraft maintenance, and aviation security are all part of the company's service offering. Other aviation services offered by Swissport include flight planning, aid for passengers and crew, help with customs and immigration, and booking aircraft charter. The company offers a variety of cargo services, including trucking, warehousing, freight handling, and freighter ramp services. Additionally, the business provides e-ticketing, catering arrangements, hotel and restaurant bookings, and automobile rentals.

    It is present in a number of nations in Europe, Africa, the Middle East, Asia-Pacific, North America, and Latin America. The headquarters of Swissport are in Zurich, Switzerland. Swissport International and the International Airlines Group (IAG) inked a contract in March 2021 to provide air terminal ground services to IAG's carriers at the new Berlin Brandenburg International Airport (BER) for an extended period of time.

    Key Companies in the Airside Services Market market include

    Industry Developments

    September 2021: The main new customer of Worldwide Flight Services (WFS) at London Heathrow is now Sri Lankan Airlines.

    Future Outlook

    Airside Services Market Future Outlook

    The Airside Services Market is projected to grow at a 7.50% CAGR from 2025 to 2035, driven by technological advancements, increasing air traffic, and enhanced safety regulations.

    New opportunities lie in:

    • Invest in automation technologies to streamline ground handling processes and reduce operational costs.
    • Develop eco-friendly ground support equipment to meet sustainability goals and regulatory requirements.
    • Expand service offerings to include premium passenger services, enhancing customer experience and loyalty.

    By 2035, the Airside Services Market is expected to be robust, reflecting significant growth and innovation.

    Market Segmentation

    Airside Services End Use Outlook

    • Commercial
    • Military

    Airside Services Platform Outlook

    • Hardware
    • Software
    • Service

    Airside Services Regional Outlook

    North America
    • US
    • Canada

    Airside Services Operation Outlook

    • Aircraft Handling
    • Passenger Handling
    • Cargo Handling

    Airside Services Airport Class Outlook

    • Class A
    • Class B
    • Class C
    • Class D

    Report Scope

    Report Attribute/Metric Details
    Market Size 2024 USD 2.9 Billion
    Market Size 2025 USD 3.1 Billion
    Market Size 2035 7.39 (Value (USD Billion))
    Compound Annual Growth Rate (CAGR) 7.50% (2025 - 2035)
    Base Year 2024
    Market Forecast Period 2025 - 2035
    Historical Data 2019- 2023
    Market Forecast Units Value (USD Billion)
    Report Coverage Revenue Forecast, Market Competitive Landscape, Growth Factors, and Trends
    Segments Covered Airport Class, Operation, Platform, End Use, and Region
    Geographies Covered North America, Europe, Asia Pacific, and the Rest of the World
    Countries Covered The U.S., Canada, German, France, U.K, Italy, Spain, China, Japan, India, Australia, South Korea, and Brazil
    Key Companies Profiled Aena, Amadeus IT Group SA, Cisco Systems, Inc., Daifuku Co. Ltd, Damarel System International Ltd., Honeywell International Inc., HUAWEI TECHNOLOGIES CO., LTD., IBM, INFORM GMBH, Indra, QinetiQ, Raytheon Technologies Corporation, Siemens, SITA, Teledyne Technologies Incorporated, and Thales
    Key Market Opportunities Integration of artificial intelligence (AI) and machine learning (ML) technologies
    Key Market Dynamics The increasing private participation in ground handling & maintenance and growing liberalization

    Market Highlights

    Author

    Swapnil Palwe
    Team Lead - Research

    She holds an experience of about 6+ years in market research and business consulting, working under the spectrum of information communication technology, telecommunications and semiconductor domains. aarti conceptualizes and implements a scalable business strategy and provides strategic leadership to the clients. her expertise lies in market estimation, competitive intelligence, pipeline analysis, customer assessment, etc.

    Leave a Comment

    Latest Comments

    John Doe
    john@example.com

    This is a great article! Really helped me understand the topic better.

    Posted on July 23, 2025, 10:15 AM
    Jane Smith
    jane@domain.com

    Thanks for sharing this. I’ve bookmarked it for later reference.

    Posted on July 22, 2025, 7:45 PM

    FAQs

    What is the growth rate of the Airside Services market?

    The Airside Services Market size was valued at USD 3.1 Billion in 2023.

    What is the growth rate of the Airside Services market?

    The global market is projected to grow at a CAGR of 7.50% during the forecast period, 2025-2034.

    Which region held the largest market share in the Airside Services market?

    North America had the largest share in the global market

    Who are the key players in the Airside Services market?

    The key players in the market are Aena, Amadeus IT Group SA, Cisco Systems, Inc., Daifuku Co. Ltd, Damarel System International Ltd., Honeywell International Inc., HUAWEI TECHNOLOGIES CO., LTD., IBM, INFORM GMBH, Indra, QinetiQ, Raytheon Technologies Corporation, Siemens, SITA, Teledyne Technologies Incorporated, and Thales

    Which Airport Class led the Airside Services market?

    The Class B Airport Class dominated the market in 2022.

    Which Operation had the largest market share in the Airside Services market?

    The Passenger Handling Operation had the largest share in the global market.

    1. List of Tables and Figures
      1. |-
      2. Table of Contents 1. Executive Summary 2. Market Introduction 2.1. Definition 2.2. Scope of the Study 2.2.1. Research Objective 2.2.2. Assumptions 2.2.3. Limitations 3. Research Methodology 3.1. Overview 3.2. Data Mining 3.3. Secondary Research 3.4. Primary Research 3.4.1. Primary Interviews and Information Gathering Process 3.4.2. Breakdown of Primary Respondents 3.5. Forecasting Model 3.6. Market Size Estimation 3.6.1. Bottom-up Approach 3.6.2. Top-Down Approach 3.7. Data Triangulation 3.8. Validation 4. MARKET DYNAMICS 4.1. Overview 4.2. Drivers 4.3. Restraints 4.4. Opportunities 5. MARKET FACTOR ANALYSIS 5.1. Value Chain Analysis 5.2. Porter’s Five Forces Analysis 5.2.1. Bargaining Power of Suppliers 5.2.2. Bargaining Power of Buyers 5.2.3. Threat of New Entrants 5.2.4. Threat of Substitutes 5.2.5. Intensity of Rivalry 5.3. COVID-19 Impact Analysis 5.3.1. Market Impact Analysis 5.3.2. Regional Impact 5.3.3. Opportunity and Threat Analysis 6. GLOBAL AIRSIDE SERVICES MARKET, BY AIRPORT CLASS 6.1. Overview 6.2. Class A 6.3. Class B 6.4. Class C 6.5. Class D 7. GLOBAL AIRSIDE SERVICES MARKET, BY OPERATION 7.1. Overview 7.2. Aircraft Handling 7.3. Passenger Handling 7.4. Cargo Handling 8. GLOBAL AIRSIDE SERVICES MARKET, BY PLATFORM 8.1. Overview 8.2. Hardware 8.3. Software 8.4. Service 9. GLOBAL AIRSIDE SERVICES MARKET, BY END-USE 9.1. Overview 9.2. End Use 9.3. Commercial 9.4. Military 10. GLOBAL AIRSIDE SERVICES MARKET, BY REGION 10.1. Overview 10.2. North America 10.2.1. U.S. 10.2.2. Canada 10.3. Europe 10.3.1. Germany 10.3.2. France 10.3.3. U.K 10.3.4. Italy 10.3.5. Spain 10.3.6. Rest of Europe 10.4. Asia-Pacific 10.4.1. China 10.4.2. India 10.4.3. Japan 10.4.4. South Korea 10.4.5. Australia 10.4.6. Rest of Asia-Pacific 10.5. Rest of the World 10.5.1. Middle East 10.5.2. Africa 10.5.3. Latin America 11. Competitive Landscape 11.1. Overview 11.2. Competitive Analysis 11.3. Market Share Analysis 11.4. Major Growth Strategy in the Global Airside Services Market, 11.5. Competitive Benchmarking 11.6. Leading Players in Terms of Number of Developments in the Global Airside Services Market, 11.7. Key developments and Growth Strategies 11.7.1. New Dosage Form Launch/Type Application 11.7.2. Merger & Acquisitions 11.7.3. Joint Ventures 11.8. Major Players Financial Matrix 11.8.1. Sales & Operating Income, 2022 11.8.2. Major Players R&D Expenditure. 2022 12. COMPANY PROFILES 12.1. AENA 12.1.1. Company Overview 12.1.2. Financial Overview 12.1.3. Dosage Forms Offered 12.1.4. Key Developments 12.1.5. SWOT Analysis 12.1.6. Key Strategies 12.2. Amadeus IT Group SA 12.2.1. Company Overview 12.2.2. Financial Overview 12.2.3. Dosage Forms Offered 12.2.4. Key Developments 12.2.5. SWOT Analysis 12.2.6. Key Strategies 12.3. CISCO SYSTEMS, INC. 12.3.1. Company Overview 12.3.2. Financial Overview 12.3.3. Dosage Forms Offered 12.3.4. Key Developments 12.3.5. SWOT Analysis 12.3.6. Key Strategies 12.4. Daifuku Co. Ltd 12.4.1. Company Overview 12.4.2. Financial Overview 12.4.3. Dosage Forms Offered 12.4.4. Key Developments 12.4.5. SWOT Analysis 12.4.6. Key Strategies 12.5. Damarel System International Ltd. 12.5.1. Company Overview 12.5.2. Financial Overview 12.5.3. Dosage Forms Offered 12.5.4. Key Developments 12.5.5. SWOT Analysis 12.5.6. Key Strategies 12.6. HONEYWELL INTERNATIONAL INC. 12.6.1. Company Overview 12.6.2. Financial Overview 12.6.3. Dosage Forms Offered 12.6.4. Key Developments 12.6.5. SWOT Analysis 12.6.6. Key Strategies 12.7. HUAWEI TECHNOLOGIES CO., LTD. 12.7.1. Company Overview 12.7.2. Financial Overview 12.7.3. Dosage Forms Offered 12.7.4. Key Developments 12.7.5. SWOT Analysis 12.7.6. Key Strategies 12.8. IBM 12.8.1. Company Overview 12.8.2. Financial Overview 12.8.3. Dosage Forms Offered 12.8.4. Key Developments 12.8.5. SWOT Analysis 12.8.6. Key Strategies 12.9. INFORM GMBH 12.9.1. Company Overview 12.9.2. Financial Overview 12.9.3. Dosage Forms Offered 12.9.4. Key Developments 12.9.5. SWOT Analysis 12.9.6. Key Strategies 12.10. Indra 12.10.1. Company Overview 12.10.2. Financial Overview 12.10.3. Dosage Forms Offered 12.10.4. Key Developments 12.10.5. SWOT Analysis 12.10.6. Key Strategies 12.11. QinetiQ 12.11.1. Company Overview 12.11.2. Financial Overview 12.11.3. Dosage Forms Offered 12.11.4. Key Developments 12.11.5. SWOT Analysis 12.11.6. Key Strategies 12.12. Raytheon Technologies Corporation 12.12.1. Company Overview 12.12.2. Financial Overview 12.12.3. Dosage Forms Offered 12.12.4. Key Developments 12.12.5. SWOT Analysis 12.12.6. Key Strategies 12.13. Siemens 12.13.1. Company Overview 12.13.2. Financial Overview 12.13.3. Dosage Forms Offered 12.13.4. Key Developments 12.13.5. SWOT Analysis 12.13.6. Key Strategies 12.14. SITA 12.14.1. Company Overview 12.14.2. Financial Overview 12.14.3. Dosage Forms Offered 12.14.4. Key Developments 12.14.5. SWOT Analysis 12.14.6. Key Strategies 12.15. Teledyne Technologies Incorporated 12.15.1. Company Overview 12.15.2. Financial Overview 12.15.3. Dosage Forms Offered 12.15.4. Key Developments 12.15.5. SWOT Analysis 12.15.6. Key Strategies 12.16. Thales 12.16.1. Company Overview 12.16.2. Financial Overview 12.16.3. Dosage Forms Offered 12.16.4. Key Developments 12.16.5. SWOT Analysis 12.16.6. Key Strategies 13. APPENDIX 13.1. References 13.2. Related Reports   LIST OF TABLES
      3. TABLE 1 GLOBAL AIRSIDE SERVICES MARKET, SYNOPSIS, 2018-2032
      4. TABLE 2 GLOBAL AIRSIDE SERVICES MARKET, ESTIMATES & FORECAST, 2025-2034 (USD BILLION)
      5. TABLE 3 GLOBAL AIRSIDE SERVICES MARKET, BY AIRPORT CLASS, 2025-2034 (USD BILLION)
      6. TABLE 4 GLOBAL AIRSIDE SERVICES MARKET, BY OPERATION, 2025-2034 (USD BILLION)
      7. TABLE 5 GLOBAL AIRSIDE SERVICES MARKET, BY PLATFORM, 2025-2034 (USD BILLION)
      8. TABLE 6 GLOBAL AIRSIDE SERVICES MARKET, BY END-USE, 2025-2034 (USD BILLION)
      9. TABLE 7 NORTH AMERICA AIRSIDE SERVICES MARKET, BY AIRPORT CLASS, 2025-2034 (USD BILLION)
      10. TABLE 8 NORTH AMERICA AIRSIDE SERVICES MARKET, BY OPERATION, 2025-2034 (USD BILLION)
      11. TABLE 9 NORTH AMERICA AIRSIDE SERVICES MARKET, BY PLATFORM, 2025-2034 (USD BILLION)
      12. TABLE 10 NORTH AMERICA AIRSIDE SERVICES MARKET, BY END-USE, 2025-2034 (USD BILLION)
      13. TABLE 11 NORTH AMERICA AIRSIDE SERVICES MARKET, BY COUNTRY, 2025-2034 (USD BILLION)
      14. TABLE 12 U.S. AIRSIDE SERVICES MARKET, BY AIRPORT CLASS, 2025-2034 (USD BILLION)
      15. TABLE 13 U.S. AIRSIDE SERVICES MARKET, BY OPERATION, 2025-2034 (USD BILLION)
      16. TABLE 14 U.S. AIRSIDE SERVICES MARKET, BY PLATFORM, 2025-2034 (USD BILLION)
      17. TABLE 15 U.S. AIRSIDE SERVICES MARKET, BY END-USE, 2025-2034 (USD BILLION)
      18. TABLE 16 CANADA AIRSIDE SERVICES MARKET, BY AIRPORT CLASS, 2025-2034 (USD BILLION)
      19. TABLE 17 CANADA AIRSIDE SERVICES MARKET, BY OPERATION, 2025-2034 (USD BILLION)
      20. TABLE 18 CANADA AIRSIDE SERVICES MARKET, BY PLATFORM, 2025-2034 (USD BILLION)
      21. TABLE 19 CANADA AIRSIDE SERVICES MARKET, BY END-USE, 2025-2034 (USD BILLION)
      22. TABLE 20 EUROPE AIRSIDE SERVICES MARKET, BY AIRPORT CLASS, 2025-2034 (USD BILLION)
      23. TABLE 21 EUROPE AIRSIDE SERVICES MARKET, BY OPERATION, 2025-2034 (USD BILLION)
      24. TABLE 22 EUROPE AIRSIDE SERVICES MARKET, BY PLATFORM, 2025-2034 (USD BILLION)
      25. TABLE 23 EUROPE AIRSIDE SERVICES MARKET, BY END-USE, 2025-2034 (USD BILLION)
      26. TABLE 24 EUROPE AIRSIDE SERVICES MARKET, BY COUNTRY, 2025-2034 (USD BILLION)
      27. TABLE 25 GERMANY AIRSIDE SERVICES MARKET, BY AIRPORT CLASS, 2025-2034 (USD BILLION)
      28. TABLE 26 GERMANY AIRSIDE SERVICES MARKET, BY OPERATION, 2025-2034 (USD BILLION)
      29. TABLE 27 GERMANY AIRSIDE SERVICES MARKET, BY PLATFORM, 2025-2034 (USD BILLION)
      30. TABLE 28 GERMANY AIRSIDE SERVICES MARKET, BY END-USE, 2025-2034 (USD BILLION)
      31. TABLE 29 FRANCE AIRSIDE SERVICES MARKET, BY AIRPORT CLASS, 2025-2034 (USD BILLION)
      32. TABLE 30 FRANCE AIRSIDE SERVICES MARKET, BY OPERATION, 2025-2034 (USD BILLION)
      33. TABLE 31 FRANCE AIRSIDE SERVICES MARKET, BY PLATFORM, 2025-2034 (USD BILLION)
      34. TABLE 32 FRANCE AIRSIDE SERVICES MARKET, BY END-USE, 2025-2034 (USD BILLION)
      35. TABLE 33 ITALY AIRSIDE SERVICES MARKET, BY AIRPORT CLASS, 2025-2034 (USD BILLION)
      36. TABLE 34 ITALY AIRSIDE SERVICES MARKET, BY OPERATION, 2025-2034 (USD BILLION)
      37. TABLE 35 ITALY AIRSIDE SERVICES MARKET, BY PLATFORM, 2025-2034 (USD BILLION)
      38. TABLE 36 ITALY AIRSIDE SERVICES MARKET, BY END-USE, 2025-2034 (USD BILLION)
      39. TABLE 37 SPAIN AIRSIDE SERVICES MARKET, BY AIRPORT CLASS, 2025-2034 (USD BILLION)
      40. TABLE 38 SPAIN AIRSIDE SERVICES MARKET, BY OPERATION, 2025-2034 (USD BILLION)
      41. TABLE 39 SPAIN AIRSIDE SERVICES MARKET, BY PLATFORM, 2025-2034 (USD BILLION)
      42. TABLE 40 SPAIN AIRSIDE SERVICES MARKET, BY END-USE, 2025-2034 (USD BILLION)
      43. TABLE 41 U.K AIRSIDE SERVICES MARKET, BY AIRPORT CLASS, 2025-2034 (USD BILLION)
      44. TABLE 42 U.K AIRSIDE SERVICES MARKET, BY OPERATION, 2025-2034 (USD BILLION)
      45. TABLE 43 U.K AIRSIDE SERVICES MARKET, BY PLATFORM, 2025-2034 (USD BILLION)
      46. TABLE 44 U.K AIRSIDE SERVICES MARKET, BY END-USE, 2025-2034 (USD BILLION)
      47. TABLE 45 REST OF EUROPE AIRSIDE SERVICES MARKET, BY AIRPORT CLASS, 2025-2034 (USD BILLION)
      48. TABLE 46 REST OF EUROPE AIRSIDE SERVICES MARKET, BY OPERATION, 2025-2034 (USD BILLION)
      49. TABLE 47 REST OF EUROPE AIRSIDE SERVICES MARKET, BY PLATFORM, 2025-2034 (USD BILLION)
      50. TABLE 48 REST OF EUROPE AIRSIDE SERVICES MARKET, BY END-USE, 2025-2034 (USD BILLION)
      51. TABLE 49 ASIA PACIFIC AIRSIDE SERVICES MARKET, BY AIRPORT CLASS, 2025-2034 (USD BILLION)
      52. TABLE 50 ASIA PACIFIC AIRSIDE SERVICES MARKET, BY OPERATION, 2025-2034 (USD BILLION)
      53. TABLE 51 ASIA PACIFIC AIRSIDE SERVICES MARKET, BY PLATFORM, 2025-2034 (USD BILLION)
      54. TABLE 52 ASIA PACIFIC AIRSIDE SERVICES MARKET, BY END-USE, 2025-2034 (USD BILLION)
      55. TABLE 53 ASIA PACIFIC AIRSIDE SERVICES MARKET, BY COUNTRY, 2025-2034 (USD BILLION)
      56. TABLE 54 JAPAN AIRSIDE SERVICES MARKET, BY AIRPORT CLASS, 2025-2034 (USD BILLION)
      57. TABLE 55 JAPAN AIRSIDE SERVICES MARKET, BY OPERATION, 2025-2034 (USD BILLION)
      58. TABLE 56 JAPAN AIRSIDE SERVICES MARKET, BY PLATFORM, 2025-2034 (USD BILLION)
      59. TABLE 57 JAPAN AIRSIDE SERVICES MARKET, BY END-USE, 2025-2034 (USD BILLION)
      60. TABLE 58 CHINA AIRSIDE SERVICES MARKET, BY AIRPORT CLASS, 2025-2034 (USD BILLION)
      61. TABLE 59 CHINA AIRSIDE SERVICES MARKET, BY OPERATION, 2025-2034 (USD BILLION)
      62. TABLE 60 CHINA AIRSIDE SERVICES MARKET, BY PLATFORM, 2025-2034 (USD BILLION)
      63. TABLE 61 CHINA AIRSIDE SERVICES MARKET, BY END-USE, 2025-2034 (USD BILLION)
      64. TABLE 62 INDIA AIRSIDE SERVICES MARKET, BY AIRPORT CLASS, 2025-2034 (USD BILLION)
      65. TABLE 63 INDIA AIRSIDE SERVICES MARKET, BY OPERATION, 2025-2034 (USD BILLION)
      66. TABLE 64 INDIA AIRSIDE SERVICES MARKET, BY PLATFORM, 2025-2034 (USD BILLION)
      67. TABLE 65 INDIA AIRSIDE SERVICES MARKET, BY END-USE, 2025-2034 (USD BILLION)
      68. TABLE 66 AUSTRALIA AIRSIDE SERVICES MARKET, BY AIRPORT CLASS, 2025-2034 (USD BILLION)
      69. TABLE 67 AUSTRALIA AIRSIDE SERVICES MARKET, BY OPERATION, 2025-2034 (USD BILLION)
      70. TABLE 68 AUSTRALIA AIRSIDE SERVICES MARKET, BY PLATFORM, 2025-2034 (USD BILLION)
      71. TABLE 69 AUSTRALIA AIRSIDE SERVICES MARKET, BY END-USE, 2025-2034 (USD BILLION)
      72. TABLE 70 SOUTH KOREA AIRSIDE SERVICES MARKET, BY AIRPORT CLASS, 2025-2034 (USD BILLION)
      73. TABLE 71 SOUTH KOREA AIRSIDE SERVICES MARKET, BY OPERATION, 2025-2034 (USD BILLION)
      74. TABLE 72 SOUTH KOREA AIRSIDE SERVICES MARKET, BY PLATFORM, 2025-2034 (USD BILLION)
      75. TABLE 73 SOUTH KOREA AIRSIDE SERVICES MARKET, BY END-USE, 2025-2034 (USD BILLION)
      76. TABLE 74 REST OF ASIA-PACIFIC AIRSIDE SERVICES MARKET, BY AIRPORT CLASS, 2025-2034 (USD BILLION)
      77. TABLE 75 REST OF ASIA-PACIFIC AIRSIDE SERVICES MARKET, BY OPERATION, 2025-2034 (USD BILLION)
      78. TABLE 76 REST OF ASIA-PACIFIC AIRSIDE SERVICES MARKET, BY PLATFORM, 2025-2034 (USD BILLION)
      79. TABLE 77 REST OF ASIA-PACIFIC AIRSIDE SERVICES MARKET, BY END-USE, 2025-2034 (USD BILLION)
      80. TABLE 78 REST OF WORLD AIRSIDE SERVICES MARKET, BY AIRPORT CLASS, 2025-2034 (USD BILLION)
      81. TABLE 79 REST OF WORLD AIRSIDE SERVICES MARKET, BY OPERATION, 2025-2034 (USD BILLION)
      82. TABLE 80 REST OF WORLD AIRSIDE SERVICES MARKET, BY PLATFORM, 2025-2034 (USD BILLION)
      83. TABLE 81 REST OF WORLD AIRSIDE SERVICES MARKET, BY END-USE, 2025-2034 (USD BILLION)
      84. TABLE 82 REST OF WORLD AIRSIDE SERVICES MARKET, BY COUNTRY, 2025-2034 (USD BILLION)
      85. TABLE 83 MIDDLE EAST AIRSIDE SERVICES MARKET, BY AIRPORT CLASS, 2025-2034 (USD BILLION)
      86. TABLE 84 MIDDLE EAST AIRSIDE SERVICES MARKET, BY OPERATION, 2025-2034 (USD BILLION)
      87. TABLE 85 MIDDLE EAST AIRSIDE SERVICES MARKET, BY PLATFORM, 2025-2034 (USD BILLION)
      88. TABLE 86 MIDDLE EAST AIRSIDE SERVICES MARKET, BY END-USE, 2025-2034 (USD BILLION)
      89. TABLE 87 AFRICA AIRSIDE SERVICES MARKET, BY AIRPORT CLASS, 2025-2034 (USD BILLION)
      90. TABLE 88 AFRICA AIRSIDE SERVICES MARKET, BY OPERATION, 2025-2034 (USD BILLION)
      91. TABLE 89 AFRICA AIRSIDE SERVICES MARKET, BY PLATFORM, 2025-2034 (USD BILLION)
      92. TABLE 90 AFRICA AIRSIDE SERVICES MARKET, BY END-USE, 2025-2034 (USD BILLION)
      93. TABLE 91 LATIN AMERICA AIRSIDE SERVICES MARKET, BY AIRPORT CLASS, 2025-2034 (USD BILLION)
      94. TABLE 92 LATIN AMERICA AIRSIDE SERVICES MARKET, BY OPERATION, 2025-2034 (USD BILLION)
      95. TABLE 93 LATIN AMERICA AIRSIDE SERVICES MARKET, BY PLATFORM, 2025-2034 (USD BILLION)
      96. TABLE 94 LATIN AMERICA AIRSIDE SERVICES MARKET, BY END-USE, 2025-2034 (USD BILLION)   LIST OF FIGURES
      97. FIGURE 1 RESEARCH PROCESS
      98. FIGURE 2 MARKET STRUCTURE FOR THE GLOBAL AIRSIDE SERVICES MARKET
      99. FIGURE 3 MARKET DYNAMICS FOR THE GLOBAL AIRSIDE SERVICES MARKET
      100. FIGURE 4 GLOBAL AIRSIDE SERVICES MARKET, SHARE (%), BY AIRPORT CLASS, 2022
      101. FIGURE 5 GLOBAL AIRSIDE SERVICES MARKET, SHARE (%), BY OPERATION, 2022
      102. FIGURE 6 GLOBAL AIRSIDE SERVICES MARKET, SHARE (%), BY PLATFORM, 2022
      103. FIGURE 7 GLOBAL AIRSIDE SERVICES MARKET, SHARE (%), BY END-USE, 2022
      104. FIGURE 8 GLOBAL AIRSIDE SERVICES MARKET, SHARE (%), BY REGION, 2022
      105. FIGURE 9 NORTH AMERICA: AIRSIDE SERVICES MARKET, SHARE (%), BY REGION, 2022
      106. FIGURE 10 EUROPE: AIRSIDE SERVICES MARKET, SHARE (%), BY REGION, 2022
      107. FIGURE 11 ASIA-PACIFIC: AIRSIDE SERVICES MARKET, SHARE (%), BY REGION, 2022
      108. FIGURE 12 REST OF THE WORLD: AIRSIDE SERVICES MARKET, SHARE (%), BY REGION, 2022
      109. FIGURE 13 GLOBAL AIRSIDE SERVICES MARKET: COMPANY SHARE ANALYSIS, 2022 (%)
      110. FIGURE 14 AENA: FINANCIAL OVERVIEW SNAPSHOT
      111. FIGURE 15 AENA: SWOT ANALYSIS
      112. FIGURE 16 AMADEUS IT GROUP SA: FINANCIAL OVERVIEW SNAPSHOT
      113. FIGURE 17 AMADEUS IT GROUP SA: SWOT ANALYSIS
      114. FIGURE 18 CISCO SYSTEMS, INC.: FINANCIAL OVERVIEW SNAPSHOT
      115. FIGURE 19 CISCO SYSTEMS, INC.: SWOT ANALYSIS
      116. FIGURE 20 DAIFUKU CO. LTD: FINANCIAL OVERVIEW SNAPSHOT
      117. FIGURE 21 DAIFUKU CO. LTD: SWOT ANALYSIS
      118. FIGURE 22 DAMAREL SYSTEM INTERNATIONAL LTD..: FINANCIAL OVERVIEW SNAPSHOT
      119. FIGURE 23 DAMAREL SYSTEM INTERNATIONAL LTD..: SWOT ANALYSIS
      120. FIGURE 24 HONEYWELL INTERNATIONAL INC.: FINANCIAL OVERVIEW SNAPSHOT
      121. FIGURE 25 HONEYWELL INTERNATIONAL INC.: SWOT ANALYSIS
      122. FIGURE 26 HUAWEI TECHNOLOGIES CO., LTD.: FINANCIAL OVERVIEW SNAPSHOT
      123. FIGURE 27 HUAWEI TECHNOLOGIES CO., LTD.: SWOT ANALYSIS
      124. FIGURE 28 IBM: FINANCIAL OVERVIEW SNAPSHOT
      125. FIGURE 29 IBM: SWOT ANALYSIS
      126. FIGURE 30 INFORM GMBH: FINANCIAL OVERVIEW SNAPSHOT
      127. FIGURE 31 INFORM GMBH: SWOT ANALYSIS
      128. FIGURE 32 INDRA: FINANCIAL OVERVIEW SNAPSHOT
      129. FIGURE 33 INDRA: SWOT ANALYSIS
      130. FIGURE 34 QINETIQ: FINANCIAL OVERVIEW SNAPSHOT
      131. FIGURE 35 QINETIQ: SWOT ANALYSIS
      132. FIGURE 36 RAYTHEON TECHNOLOGIES CORPORATION: FINANCIAL OVERVIEW SNAPSHOT
      133. FIGURE 37 RAYTHEON TECHNOLOGIES CORPORATION: SWOT ANALYSIS
      134. FIGURE 38 SIEMENS: FINANCIAL OVERVIEW SNAPSHOT
      135. FIGURE 39 SIEMENS: SWOT ANALYSIS
      136. FIGURE 40 SITA: FINANCIAL OVERVIEW SNAPSHOT
      137. FIGURE 41 SITA: SWOT ANALYSIS
      138. FIGURE 42 TELEDYNE TECHNOLOGIES INCORPORATED: FINANCIAL OVERVIEW SNAPSHOT
      139. FIGURE 43 TELEDYNE TECHNOLOGIES INCORPORATED: SWOT ANALYSIS
      140. FIGURE 44 THALES: FINANCIAL OVERVIEW SNAPSHOT
      141. FIGURE 45 THALES: SWOT ANALYSIS

    Airside Services Market Segmentation

    Airside Services Airport Class Outlook (USD Billion, 2018-2032)

    • Class A
    • Class B
    • Class C
    • Class D

    Airside Services Operation Outlook (USD Billion, 2018-2032)

    • Aircraft Handling
    • Passenger Handling
    • Cargo Handling

    Airside Services Platform Outlook (USD Billion, 2018-2032)

    • Hardware
    • Software
    • Service

    Airside Services End Use Outlook (USD Billion, 2018-2032)

    • Commercial
    • Military

    Airside Services Regional Outlook (USD Billion, 2018-2032)

    • North America Outlook (USD Billion, 2018-2032)

      • Airside Services by Airport Class
        • Class A
        • Class B
        • Class C
        • Class D
      • Airside Services Operation Outlook (USD Billion, 2018-2032)

        • Aircraft Handling
        • Passenger Handling
        • Cargo Handling
      • Airside Services Platform Outlook (USD Billion, 2018-2032)

        • Hardware
        • Software
        • Service
      • Airside Services End Use Outlook (USD Billion, 2018-2032)

        • Commercial
        • Military
      • US Outlook (USD Billion, 2018-2032)

      • Airside Services by Airport Class
        • Class A
        • Class B
        • Class C
        • Class D
      • Airside Services Operation Outlook (USD Billion, 2018-2032)

        • Aircraft Handling
        • Passenger Handling
        • Cargo Handling
      • Airside Services Platform Outlook (USD Billion, 2018-2032)

        • Hardware
        • Software
        • Service
      • Airside Services End Use Outlook (USD Billion, 2018-2032)

        • Commercial
        • Military
      • Canada Outlook (USD Billion, 2018-2032)

      • Airside Services by Airport Class
        • Class A
        • Class B
        • Class C
        • Class D
      • Airside Services Operation Outlook (USD Billion, 2018-2032)

        • Aircraft Handling
        • Passenger Handling
        • Cargo Handling
      • Airside Services Platform Outlook (USD Billion, 2018-2032)

        • Hardware
        • Software
        • Service
      • Airside Services End Use Outlook (USD Billion, 2018-2032)

        • Commercial
        • Military
    • Europe Outlook (USD Billion, 2018-2032)

      • Airside Services by Airport Class
        • Class A
        • Class B
        • Class C
        • Class D
      • Airside Services Operation Outlook (USD Billion, 2018-2032)

        • Aircraft Handling
        • Passenger Handling
        • Cargo Handling
      • Airside Services Platform Outlook (USD Billion, 2018-2032)

        • Hardware
        • Software
        • Service
      • Airside Services End Use Outlook (USD Billion, 2018-2032)

        • Commercial
        • Military
      • Germany Outlook (USD Billion, 2018-2032)

      • Airside Services by Airport Class
        • Class A
        • Class B
        • Class C
        • Class D
      • Airside Services Operation Outlook (USD Billion, 2018-2032)

        • Aircraft Handling
        • Passenger Handling
        • Cargo Handling
      • Airside Services Platform Outlook (USD Billion, 2018-2032)

        • Hardware
        • Software
        • Service
      • Airside Services End Use Outlook (USD Billion, 2018-2032)

        • Commercial
        • Military
      • France Outlook (USD Billion, 2018-2032)

      • Airside Services by Airport Class
        • Class A
        • Class B
        • Class C
        • Class D
      • Airside Services Operation Outlook (USD Billion, 2018-2032)

        • Aircraft Handling
        • Passenger Handling
        • Cargo Handling
      • Airside Services Platform Outlook (USD Billion, 2018-2032)

        • Hardware
        • Software
        • Service
      • Airside Services End Use Outlook (USD Billion, 2018-2032)

        • Commercial
        • Military
      • UK Outlook (USD Billion, 2018-2032)

      • Airside Services by Airport Class
        • Class A
        • Class B
        • Class C
        • Class D
      • Airside Services Operation Outlook (USD Billion, 2018-2032)

        • Aircraft Handling
        • Passenger Handling
        • Cargo Handling
      • Airside Services Platform Outlook (USD Billion, 2018-2032)

        • Hardware
        • Software
        • Service
      • Airside Services End Use Outlook (USD Billion, 2018-2032)

        • Commercial
        • Military
      • Italy Outlook (USD Billion, 2018-2032)

      • Airside Services by Airport Class
        • Class A
        • Class B
        • Class C
        • Class D
      • Airside Services Operation Outlook (USD Billion, 2018-2032)

        • Aircraft Handling
        • Passenger Handling
        • Cargo Handling
      • Airside Services Platform Outlook (USD Billion, 2018-2032)

        • Hardware
        • Software
        • Service
      • Airside Services End Use Outlook (USD Billion, 2018-2032)

        • Commercial
        • Military
      • Spain Outlook (USD Billion, 2018-2032)

      • Airside Services by Airport Class
        • Class A
        • Class B
        • Class C
        • Class D
      • Airside Services Operation Outlook (USD Billion, 2018-2032)

        • Aircraft Handling
        • Passenger Handling
        • Cargo Handling
      • Airside Services Platform Outlook (USD Billion, 2018-2032)

        • Hardware
        • Software
        • Service
      • Airside Services End Use Outlook (USD Billion, 2018-2032)

        • Commercial
        • Military
      • Rest Of Europe Outlook (USD Billion, 2018-2032)

      • Airside Services by Airport Class
        • Class A
        • Class B
        • Class C
        • Class D
      • Airside Services Operation Outlook (USD Billion, 2018-2032)

        • Aircraft Handling
        • Passenger Handling
        • Cargo Handling
      • Airside Services Platform Outlook (USD Billion, 2018-2032)

        • Hardware
        • Software
        • Service
      • Airside Services End Use Outlook (USD Billion, 2018-2032)

        • Commercial
        • Military
    • Asia-Pacific Outlook (USD Billion, 2018-2032)

      • Airside Services by Airport Class
        • Class A
        • Class B
        • Class C
        • Class D
      • Airside Services Operation Outlook (USD Billion, 2018-2032)

        • Aircraft Handling
        • Passenger Handling
        • Cargo Handling
      • Airside Services Platform Outlook (USD Billion, 2018-2032)

        • Hardware
        • Software
        • Service
      • Airside Services End Use Outlook (USD Billion, 2018-2032)

        • Commercial
        • Military
      • China Outlook (USD Billion, 2018-2032)

        • Class A
        • Class B
        • Class C
        • Class D
      • Airside Services Operation Outlook (USD Billion, 2018-2032)

        • Aircraft Handling
        • Passenger Handling
        • Cargo Handling
      • Airside Services Platform Outlook (USD Billion, 2018-2032)

        • Hardware
        • Software
        • Service
      • Airside Services End Use Outlook (USD Billion, 2018-2032)

        • Commercial
        • Military
      • Japan Outlook (USD Billion, 2018-2032)

      • Airside Services by Airport Class
        • Class A
        • Class B
        • Class C
        • Class D
      • Airside Services Operation Outlook (USD Billion, 2018-2032)

        • Aircraft Handling
        • Passenger Handling
        • Cargo Handling
      • Airside Services Platform Outlook (USD Billion, 2018-2032)

        • Hardware
        • Software
        • Service
      • Airside Services End Use Outlook (USD Billion, 2018-2032)

        • Commercial
        • Military
      • India Outlook (USD Billion, 2018-2032)

      • Airside Services by Airport Class
        • Class A
        • Class B
        • Class C
        • Class D
      • Airside Services Operation Outlook (USD Billion, 2018-2032)

        • Aircraft Handling
        • Passenger Handling
        • Cargo Handling
      • Airside Services Platform Outlook (USD Billion, 2018-2032)

        • Hardware
        • Software
        • Service
      • Airside Services End Use Outlook (USD Billion, 2018-2032)

        • Commercial
        • Military
      • Australia Outlook (USD Billion, 2018-2032)

      • Airside Services by Airport Class
        • Class A
        • Class B
        • Class C
        • Class D
      • Airside Services Operation Outlook (USD Billion, 2018-2032)

        • Aircraft Handling
        • Passenger Handling
        • Cargo Handling
      • Airside Services Platform Outlook (USD Billion, 2018-2032)

        • Hardware
        • Software
        • Service
      • Airside Services End Use Outlook (USD Billion, 2018-2032)

        • Commercial
        • Military
      • Rest of Asia-Pacific Outlook (USD Billion, 2018-2032)

      • Airside Services by Airport Class
        • Class A
        • Class B
        • Class C
        • Class D
      • Airside Services Operation Outlook (USD Billion, 2018-2032)

        • Aircraft Handling
        • Passenger Handling
        • Cargo Handling
      • Airside Services Platform Outlook (USD Billion, 2018-2032)

        • Hardware
        • Software
        • Service
      • Airside Services End Use Outlook (USD Billion, 2018-2032)

        • Commercial
        • Military
    • Rest of the World Outlook (USD Billion, 2018-2032)

      • Airside Services by Airport Class
        • Class A
        • Class B
        • Class C
        • Class D
      • Airside Services Operation Outlook (USD Billion, 2018-2032)

        • Aircraft Handling
        • Passenger Handling
        • Cargo Handling
      • Airside Services Platform Outlook (USD Billion, 2018-2032)

        • Hardware
        • Software
        • Service
      • Airside Services End Use Outlook (USD Billion, 2018-2032)

        • Commercial
        • Military
      • Middle East Outlook (USD Billion, 2018-2032)

      • Airside Services by Airport Class
        • Class A
        • Class B
        • Class C
        • Class D
      • Airside Services Operation Outlook (USD Billion, 2018-2032)

        • Aircraft Handling
        • Passenger Handling
        • Cargo Handling
      • Airside Services Platform Outlook (USD Billion, 2018-2032)

        • Hardware
        • Software
        • Service
      • Airside Services End Use Outlook (USD Billion, 2018-2032)

        • Commercial
        • Military
      • Africa Outlook (USD Billion, 2018-2032)

      • Airside Services by Airport Class
        • Class A
        • Class B
        • Class C
        • Class D
      • Airside Services Operation Outlook (USD Billion, 2018-2032)

        • Aircraft Handling
        • Passenger Handling
        • Cargo Handling
      • Airside Services Platform Outlook (USD Billion, 2018-2032)

        • Hardware
        • Software
        • Service
      • Airside Services End Use Outlook (USD Billion, 2018-2032)

        • Commercial
        • Military
      • Latin America Outlook (USD Billion, 2018-2032)

      • Airside Services by Airport Class
        • Class A
        • Class B
        • Class C
        • Class D
      • Airside Services Operation Outlook (USD Billion, 2018-2032)

        • Aircraft Handling
        • Passenger Handling
        • Cargo Handling
      • Airside Services Platform Outlook (USD Billion, 2018-2032)

        • Hardware
        • Software
        • Service
      • Airside Services End Use Outlook (USD Billion, 2018-2032)

        • Commercial
        • Military

    Infographic

    Free Sample Request

    Kindly complete the form below to receive a free sample of this Report

    Get Free Sample

    Customer Strories

    “I am very pleased with how market segments have been defined in a relevant way for my purposes (such as "Portable Freezers & refrigerators" and "last-mile"). In general the report is well structured. Thanks very much for your efforts.”

    Victoria Milne

    Founder
    Case Study
    Chemicals and Materials