Our Publications
Best Practices at Best Prices
Syndicate Report
Our chefs are constantly preparing with perfection as per your tastes.
Statistical Reports
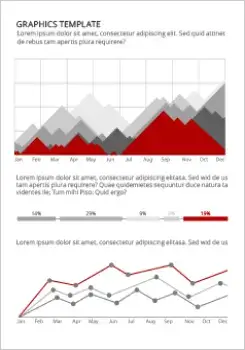
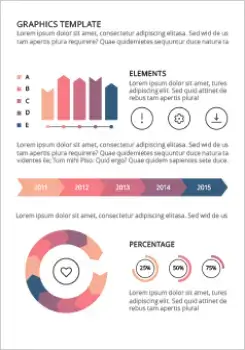
Complex topics visualized vividly.
Projected values of the specified segments for the Market Savvy. When the global numbers and market dynamics were irrelevant to your valued business and the fundamentals of a segment were not to be ignored, the need for sectional data was identified.
Projected values of the specified segments for the Market Savvy. When the global numbers and market dynamics were irrelevant to your valued business and the fundamentals of a segment were not to be ignored, the need for sectional data was identified.


Infographics
The best part of learning is sharing what you know. - The best part of learning is sharing
what
you know.
Continuous data analysis has left us with new revelations. They coincided with a range of
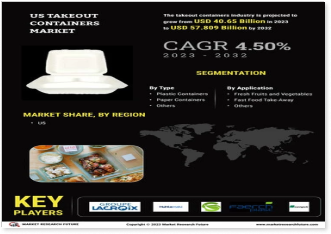
trending topics. A bit more analysis and the findings stood validated. So, the findings and numbers are represented graphically and pictorially, to be readily used as info-graphics.
Trending Infographics
How can we help you?
We help you with this process and guide you the exact way to look for with our studies and analysis related to the same.
 CR Reports
 HCR Research Reports


