• Cat-intel
  • MedIntelliX
  • Resources
  • About Us
  • English
    Chinese
    French
    Japanese
    Korean
    German
    Spanish

    Water Cut Monitors Market Size

    ID: MRFR/E&P/7546-HCR
    188 Pages
    Anshula Mandaokar
    September 2025

    Water Cut Monitors Market Research Report Information By Sector (Upstream, Midstream, Downstream), By Application (Well testing, Separation Vessel, Refinery, Others), By Location (Onshore, Offshore), And By Region (North America, Europe, Asia-Pacific, And Rest Of The World) –Market Forecast Till 2032

    Share:
    Download PDF ×

    We do not share your information with anyone. However, we may send you emails based on your report interest from time to time. You may contact us at any time to opt-out.

    Water Cut Monitors Market Research Report - Global Forecast till 2030 Infographic
    $ 4,950.0
    $ 5,950.0
    $ 7,250.0

    Water Cut Monitors Size

    Water Cut Monitors Market Growth Projections and Opportunities

    Recent times have witnessed a significant shift in market dynamics for water cut monitors, driven by various factors that show how industries based on water quality monitoring are changing. Water cut monitors play vital roles in various areas such as oil and gas where accurate measurement of water content in produced fluids is essential. The market has been advanced by the need to meet efficient and reliable monitoring solutions used to optimize production processes and comply with environmental regulations. Another important reason is the increasing focus on sustainability across different sectors which is driving demand for water cut monitors. With more emphasis placed on the environment, firms are seeking technologies to reduce their water waste and impact on nature. By giving real time information about the state of water within these substances, they help companies optimize their systems while using reduced amounts of this resource. This trend towards sustainability is making companies to invest in sophisticated surveillance systems thereby pushing up the water cut monitor’s market. Moreover, there is continuous expansion of oil and gas business being one of the major factors influencing market dynamics. Global exploration and production activities have led to a necessary requirement for accurate measurements and monitoring of oil well water cuts. They make sure that oil extraction procedures are efficient as possible by providing exact percentages about how much fluid manufactured contains it (water). The increase in oil & gas activities especially in emerging economies promotes rising demand for monitoring solutions that measure water cuts encouraging growth within this particular industry Furthermore, technological advancements have greatly transformed the landscape of water cut monitors as well. Use of modern technology like Internet Of Things (IoT) together with advanced sensors has increased capabilities associated with these devices enabling them to perform real time data analytics and remotely control operations among others. This not only improves measurement accuracy but also enables proactive decision-making from operators’ side. Changing technological scenario pulls users towards switching over their surveillance systems thus contributing to further rise in water-cut monitor’s market.
    Market Size Graph

    Market Summary

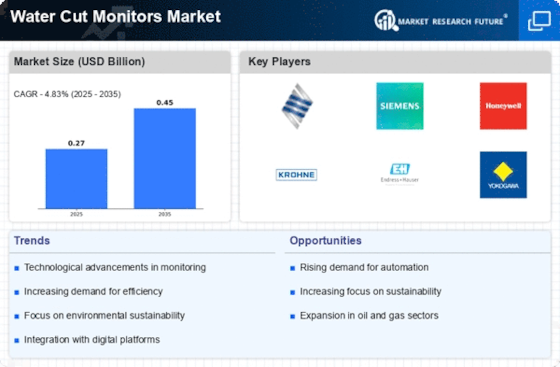
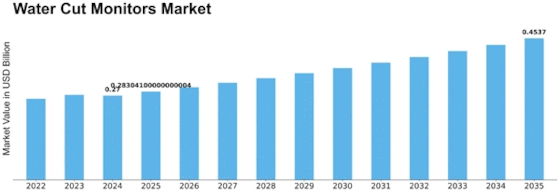
    The Global Water Cut Monitors Market is projected to grow from 0.27 USD Billion in 2024 to 0.46 USD Billion by 2035.

    Key Market Trends & Highlights

    Water Cut Monitors Key Trends and Highlights

    • The market is expected to witness a compound annual growth rate (CAGR) of 4.98% from 2025 to 2035.
    • By 2035, the market valuation is anticipated to reach 0.46 USD Billion, indicating a steady growth trajectory.
    • In 2024, the market is valued at 0.27 USD Billion, reflecting the current demand for water cut monitoring solutions.
    • Growing adoption of advanced monitoring technologies due to increasing regulatory compliance is a major market driver.

    Market Size & Forecast

    2024 Market Size 0.27 (USD Billion)
    2035 Market Size 0.46 (USD Billion)
    CAGR (2025-2035) 4.98%
    Largest Regional Market Share in 2024 latin_america)

    Major Players

    Weatherford, Emerson Electric Co, Schlumberger Limited, TechnipFMC plc, Siemens, Eesiflo, Ametek Inc, Aquasant Messtechnik AG, Haimo Technologies Group Corp, LEMIS Process, Agar Corporation, Sentech AS

    Market Trends

      • Growing offshore oil & gas explorationis driving the market growth

    The production of oil and gas is essential to the world's development. Heat and electricity are essential components of daily life, without which one would perish. The need for both has expanded as the population has grown exponentially. Conventional fuel is used to generate a significant amount of heat and power. Oil & gas have been widely used in power production, transportation, manufacturing, and other applications. However, due to globalization, urbanization, and tremendous economic expansion, the exponential demand for conventional fuel is expected to reduce the demand-supply ratio.

    In addition, both exporting and importing countries are increasing their refining capacity to meet the growing demand for refined products. The growing need for real-time flow monitoring equipment is one of the primary reasons propelling the water cut monitors market forward.

    Additionally, the increase in need and demand for real-time flow monitoring equipment. Further, economies across the globe increase their refining capacity to meet the growing demand for refined products. This positively impacts the growth of the international water cut monitor market. In addition, numerous countries depend on oil imports to meet their demand for hydrocarbon products, which is expected to drive the Water Cut Monitors market revenue.

    The increasing emphasis on efficient resource management and environmental sustainability is driving the adoption of advanced water cut monitoring technologies across various industries.

    U.S. Department of Energy

    Water Cut Monitors Market Market Drivers

    Regulatory Compliance

    Regulatory frameworks governing the oil and gas industry significantly influence the Global Water Cut Monitors Market Industry. Stricter environmental regulations necessitate accurate monitoring of water content in produced fluids to mitigate environmental impacts. Companies are compelled to invest in water cut monitoring solutions to ensure compliance with these regulations. This trend is particularly pronounced in regions with stringent environmental policies, where non-compliance can lead to substantial penalties. The increasing focus on sustainability and environmental responsibility is likely to propel the demand for water cut monitors in the coming years.

    Market Growth Projections

    The Global Water Cut Monitors Market Industry is poised for substantial growth, with projections indicating a market size of 0.27 USD Billion in 2024 and an anticipated increase to 0.46 USD Billion by 2035. This growth trajectory suggests a compound annual growth rate of 4.98% from 2025 to 2035, reflecting the increasing adoption of advanced monitoring technologies across the oil and gas sector. The rising demand for accurate water cut measurements, driven by regulatory compliance and operational efficiency, is likely to shape the market landscape in the coming years.

    Technological Advancements

    Technological innovations play a crucial role in shaping the Global Water Cut Monitors Market Industry. The introduction of advanced sensors and real-time monitoring systems enhances the accuracy and efficiency of water cut measurements. These innovations not only improve operational efficiency but also reduce costs associated with manual monitoring methods. As companies increasingly adopt automated solutions, the market is expected to witness substantial growth. By 2035, the market is anticipated to expand to 0.46 USD Billion, driven by the continuous evolution of monitoring technologies that cater to the specific needs of the oil and gas sector.

    Growing Focus on Efficiency

    The emphasis on operational efficiency within the oil and gas sector drives the Global Water Cut Monitors Market Industry. Companies are increasingly seeking ways to optimize production processes and reduce waste, making accurate water cut measurement essential. By minimizing water cut, operators can enhance the quality of crude oil and maximize profitability. This focus on efficiency is expected to contribute to a compound annual growth rate of 4.98% from 2025 to 2035, as organizations recognize the financial benefits of investing in advanced monitoring technologies that provide real-time data and insights.

    Rising Demand for Oil and Gas

    The Global Water Cut Monitors Market Industry experiences a notable surge in demand driven by the oil and gas sector. As exploration and production activities intensify, the need for accurate measurement of water content in crude oil becomes paramount. This is particularly relevant in regions where water cut can significantly impact the quality and value of oil. In 2024, the market is projected to reach 0.27 USD Billion, reflecting the industry's growing reliance on advanced monitoring technologies to optimize production processes and ensure compliance with environmental regulations.

    Expansion of Oil and Gas Exploration

    The expansion of oil and gas exploration activities globally serves as a significant driver for the Global Water Cut Monitors Market Industry. As new reserves are discovered and developed, the need for effective monitoring solutions becomes increasingly critical. Regions with untapped resources are particularly reliant on accurate water cut measurements to ensure optimal extraction processes. This trend is expected to sustain market growth, as companies invest in technologies that facilitate efficient resource management. The ongoing exploration efforts are likely to create a robust demand for water cut monitors in the foreseeable future.

    Market Segment Insights

    Water Cut Monitors Sector Insights

    Based on Sector, the Water Cut Monitors market segmentation including upstream, midstream, and downstream. The upstream segment dominated the market due to the growing demand for oil and gas. Due to real-time monitoring devices, the water cut monitor system is expected to grow during this period, escalating investments in developing additional refining capacity. 

    Water Cut Monitors Application Insights

    Based on Application, the Water Cut Monitors market segmentation includes well testing, separation vessel, refinery, and others. The separation vessel segment led the water cut monitors market. Separation vessels are pressure vessels installed to separate the produced crude into gas, oil, and water. Operators prioritize maintaining the quality of the oil obtained after separation while conforming to specifications and standards; this drives the demand for water-cut monitors at these separation vessels.

    Increasing dependence on unconventional resources has further boosted the demand for separation vessels as the crude obtained from them contains impurities and heavy water content, thereby making it necessary to measure the water content in the oil after the separation.

    Water Cut Monitors Location Insights

    The Water Cut Monitors market segmentation is based on location, onshore and offshore. The offshore sector segment is expected to grow at a high CAGR during the forecast period. The increasing demand for crude oil has led to an increase in offshore exploration & drilling operations because new oil fields in the offshore Sector are expected to drive the water cut monitors market. For instance, in June 2017, ONGC discovered an oil field with approximately 20 million tons of hydrocarbon reserves in Mumbai High offshore fields.

    Thus, rising shale oil and deep-water exploration activities are expected to drive the growth of the offshore water cut monitors market during the forecast period.

    Figure1: Water Cut Monitors Market, by Location, 2022 & 2032 (USD billion)

    Source: Secondary Research, Primary Research, Market Research Future Database, and Analyst Review

    Get more detailed insights about Water Cut Monitors Market Research Report - Global Forecast till 2030

    Regional Insights

    By Region, the study provides market insights into North America, Europe, Asia-Pacific, and the Rest of the World. The North American water cut monitors market area will dominate this market due to the Region's features of several companies that do high-seas exploration and extradition in the oil and gas business will boost the market growth in this Region.

    Further, the major countries studied in the market report are The U.S., Canada, German, France, the UK, Italy, Spain, China, Japan, India, Australia, South Korea, and Brazil.

    Figure2: Water Cut Monitors Market Share By Region 2022 (%)

    Water Cut Monitors Market Share By Region

    Source: Secondary Research, Primary Research, Market Research Future Database, and Analyst Review

    Europe's Water Cut Monitors market accounts for the second-largest market share due to the increasing need and demand for real-time flow monitoring equipment. Further, the German Water Cut Monitors market held the largest market share, and the UK Water Cut Monitors market was the fastest growing market in the European Region.

    The Asia-Pacific Water Cut Monitors Market is expected to grow at the fastest CAGR from 2023 to 2032. This is because the Region is seeing major increases in oil and gas investments and building several offshore exploration facilities, all expected to help the Region grow. Moreover, China’s Water Cut Monitors market held the largest market share, and the Indian Water Cut Monitors market was the fastest-growing market in the Asia-Pacific region.

    Key Players and Competitive Insights

    Leading market players are investing heavily in research and development to expand their product lines, which will help the water cut monitors market, grow even more. Market participants are also undertaking a variety of strategic activities to expand their footprint, with important market developments including new product launches, contractual agreements, mergers and acquisitions, higher investments, and collaboration with other organizations. The water cut monitors industry must offer cost-effective items to expand and survive in a more competitive and rising market climate.

    Manufacturing locally to minimize operational costs is one of the key business tactics manufacturers use in the Water Cut Monitors industry to benefit clients and increase the market sector. In recent years, the Water Cut Monitors industry has offered some of the most significant advantages to the oil & Petroleum industry.

    Major players in the Water Cut Monitors market, including Weatherford (US), Emerson Electric Co (US), Schlumberger Limited (US), TechnipFMC plc (UK), Siemens (Germany), Eesiflo (Czech Republic), Ametek Inc (US), Aquasant Messtechnik AG (Switzerland), Haimo Technologies Group Corp (UAE), LEMIS Process (US), Agar Corporation (UK), and Sentech AS (Norway), and others, are attempting to increase market demand by investing in research and development operations.

    M-Flow Technologies manufactures a game-changing line of water-cut analyzers and innovative multiphase measurement systems. Our focus is to deliver data to our customers that help them maximize production and improve asset value while minimizing their operating footprint and HSE exposure. Our unique approach to sensor packaging allows us to provide accurate, repeatable metering for the harshest environments. M-Flow measurement systems give our clients quality data assurance at a cost appropriate for multiple installations in a low oil price environment.

    M-Flow is demonstrating the value of our approach with field deployments that outperform current measurement solutions and require no maintenance.M-Flow Technologies Ltd, a provider of accurate and repeatable measurement systems, has been officially associated with Petrobras as a supplier of water cut monitors. Petrobras operates oil tankers, distribution pipelines, thermal power plants, fertilizer plants, petrochemical units, and marine, river, and lake terminals.

    Endress+Hauser is a Swiss-based globally operating process and laboratory instrumentation and automation supplier. The family company achieved net sales of approximately 2.9 billion euros in 2021, with a workforce of more than 15,000.Endress+Hauser introduced the Waterpilot FMX21 water cut monitor, which uses a multi-frequency measurement technique to measure the water content in crude oil and hydrocarbons accurately. The device also has an intuitive touchscreen display and a user-friendly interface for easy operation.

    Key Companies in the Water Cut Monitors Market market include

    Industry Developments

    September 2021: Endress+Hauser introduced the Waterpilot FMX21 water cut monitor, which uses a multi-frequency measurement technique to measure the water content in crude oil and hydrocarbons accurately. The device also has an intuitive touchscreen display and a user-friendly interface for easy operation.

    August 2021: Emerson announced the integration of its water cut monitors with its Roxar 2600 multiphase flow meters to provide real-time data on oil, gas, and water flows in oil and gas wells.

    Future Outlook

    Water Cut Monitors Market Future Outlook

    The Global Water Cut Monitors Market is poised for growth at 4.98% CAGR from 2024 to 2035, driven by technological advancements, rising demand for efficient resource management, and regulatory compliance.

    New opportunities lie in:

    • Develop AI-driven analytics for real-time monitoring and predictive maintenance.
    • Expand product lines to include portable water cut monitors for remote applications.
    • Leverage IoT integration to enhance data collection and operational efficiency.

    By 2035, the market is expected to achieve substantial growth, reflecting increased adoption and innovation.

    Market Segmentation

    Water cut monitors Sector Outlook

    • Upstream
    • Midstream
    • Downstream

    Water cut monitors Location Outlook

    • Onshore
    • Offshore

    Water cut monitors Regional Outlook

    • US
    • Canada

    Water cut monitors Application Outlook

    • Well testing
    • Separation Vessel
    • Refinery
    • Others

    Report Scope

    Report Attribute/Metric Details
    Market Size 2023 USD 0.26 billion
    Market Size 2024 USD 0.27 billion
    Market Size 2032 USD 0.4 billion
    Compound Annual Growth Rate (CAGR) 4.83% (2024-2032)
    Base Year 2023
    Market Forecast Period 2024-2032
    Historical Data 2019- 2021
    Market Forecast Units Value (USD Billion)
    Report Coverage Revenue Forecast, Market Competitive Landscape, Growth Factors, and Trends
    Segments Covered Sector, Application,Location, and Region
    Geographies Covered North America, Europe, AsiaPacific, and the Rest of the World
    Countries Covered The U.S., Canada, German, France, the UK, Italy, Spain, China, Japan, India, Australia, South Korea, and Brazil
    Key Companies Profiled  Weatherford (US), Emerson Electric Co (US), Schlumberger Limited (US), TechnipFMC plc (UK), Siemens (Germany), Eesiflo (Czech Republic), Ametek Inc (US), Aquasant Messtechnik AG (Switzerland), Haimo Technologies Group Corp (UAE), LEMIS Process (US), Agar Corporation (UK), and Sentech AS (Norway),
    Key Market Opportunities New product launches and R&D Amongst major key Players
    Key Market Dynamics Increasing demand for crude oil in developing countries.    Increasing need and demand for real-time flow monitoring equipment.

    Market Highlights

    Author

    Anshula Mandaokar
    Team Lead - Research

    She holds an experience of about 6+ years in market research and business consulting, working under the spectrum of information communication technology, telecommunications and semiconductor domains. aarti conceptualizes and implements a scalable business strategy and provides strategic leadership to the clients. her expertise lies in market estimation, competitive intelligence, pipeline analysis, customer assessment, etc.

    Leave a Comment

    Latest Comments

    John Doe

    This is a great article! Really helped me understand the topic better.

    Posted on July 23, 2025, 10:15 AM
    Jane Smith

    Thanks for sharing this. I’ve bookmarked it for later reference.

    Posted on July 22, 2025, 7:45 PM

    FAQs

    How much is the Water Cut Monitors market?

    The Water Cut Monitors market size was valued at USD 0.26 Billion in 2023.

    What is the growth rate of the Water Cut Monitors market?

    The market is projected to grow at a CAGR of 4.83% during the forecast period, 2024-2032.

    Which Region held the largest market share in the Water Cut Monitors market?

    North America had the largest share of the market

    Who are the key players in the Water Cut Monitors market?

    The key players in the market areWeatherford (US), Emerson Electric Co (US), Schlumberger Limited (US), TechnipFMC plc (UK), Siemens (Germany), Eesiflo (Czech Republic), Ametek Inc (US), Aquasant Messtechnik AG (Switzerland).

    Which Sector led the Water Cut Monitors market?

    The UpstreamWater Cut Monitors category dominated the market in 2022.

    Which Application had the largest market share in the Water Cut Monitors market?

    The Separation Vessel had the largest share of the market.

    1. 'Table
    2. of Contents
    3. Executive Summary
    4. Market Introduction
      1. Market Definition
    5. Scope of the Study
      1. Market Structure
    6. Research Methodology
    7. Primary Research
      1. Secondary Research
      2. Market Capacity Estimation
    8. Forecast Model
      1. List of Assumptions
      2. Limitations of the Study
    9. Market Insights
    10. Market Dynamics
      1. Introduction
      2. Market Drivers
    11. Market Restraints
      1. Market Opportunities
      2. Porter’s Five Forces
    12. Analysis
      1. Threat of New Entrants
        1. Bargaining Power of Buyers
    13. Bargaining Power of Suppliers
      1. Threat of Substitutes
        1. Rivalry
      2. Value
    14. Chain/Supply Chain Analysis
    15. Global Water Cut Monitors Market, by Sector
    16. Introduction
      1. Upstream
        1. Market Estimates & Forecast, 2023-2032
    17. Market Estimates & Forecast, by Region, 2023-2032
      1. Midstream
        1. Market
    18. Estimates & Forecast, 2023-2032
      1. Market Estimates & Forecast,
    19. by Region, 2023-2032
      1. Downstream
        1. Market Estimates & Forecast,
        2. Market Estimates & Forecast, by Region, 2023-2032
    20. Global Water Cut Monitors Market, by Application
      1. Introduction
      2. Well Testing
    21. Market Estimates & Forecast, 2023-2032
      1. Market Estimates & Forecast,
    22. by Region, 2023-2032
      1. Separation Vessel
        1. Market Estimates &
    23. Forecast, 2023-2032
      1. Market Estimates & Forecast, by Region, 2023-2032
    24. Refinery
      1. Market Estimates & Forecast, 2023-2032
        1. Market
    25. Estimates & Forecast, by Region, 2023-2032
      1. Others
        1. Market
    26. Estimates & Forecast, 2023-2032
      1. Market Estimates & Forecast,
    27. by Region, 2023-2032
    28. Global Water Cut Monitors Market, by Location
    29. Introduction
      1. Onshore
        1. Market Estimates & Forecast, 2023-2032
    30. Market Estimates & Forecast, by Region, 2023-2032
      1. Offshore
        1. Market
    31. Estimates & Forecast, 2023-2032
      1. Market Estimates & Forecast,
    32. by Region, 2023-2032
    33. Global Water Cut Monitors Market, by Region
    34. Introduction
      1. North America
        1. Market Estimates & Forecast, by Sector,
        2. Market Estimates & Forecast, by Application, 2023-2032
    35. Market Estimates & Forecast, by Location, 2023-2032
      1. Market Estimates &
    36. Forecast, by Country, 2023-2032
      1. US
        1. Market Estimates & Forecast,
    37. by Sector, 2023-2032
      1. Market Estimates & Forecast, by Application,
        1. Market Estimates & Forecast, by Location, 2023-2032
    38. Canada
      1. Market Estimates & Forecast, by Sector, 2023-2032
    39. Market Estimates & Forecast, by Application, 2023-2032
      1. Market Estimates &
    40. Forecast, by Location, 2023-2032
      1. Mexico
        1. Market Estimates &
    41. Forecast, by Sector, 2023-2032
      1. Market Estimates & Forecast, by Application,
        1. Market Estimates & Forecast, by Location, 2023-2032
    42. Europe
      1. Market Estimates & Forecast, by Sector, 2023-2032
    43. Market Estimates & Forecast, by Application, 2023-2032
      1. Market Estimates &
    44. Forecast, by Location, 2023-2032
      1. Market Estimates & Forecast, by Country,
        1. Norway
    45. Market Estimates & Forecast, by Location, 2023-2032
      1. UK
        1. Market Estimates &
    46. Forecast, by Sector, 2023-2032
      1. Market Estimates & Forecast, by Application,
        1. Market Estimates & Forecast, by Location, 2023-2032
    47. Russia
      1. Market Estimates & Forecast, by Sector, 2023-2032
    48. Market Estimates & Forecast, by Application, 2023-2032
      1. Market Estimates &
    49. Forecast, by Location, 2023-2032
      1. Rest of Europe
        1. Market Estimates &
    50. Forecast, by Sector, 2023-2032
      1. Market Estimates & Forecast, by Application,
        1. Market Estimates & Forecast, by Location, 2023-2032
    51. Asia-Pacific
      1. Market Estimates & Forecast, by Sector, 2023-2032
    52. Market Estimates & Forecast, by Application, 2023-2032
      1. Market Estimates &
    53. Forecast, by Location, 2023-2032
      1. Market Estimates & Forecast, by Country,
        1. China
    54. Market Estimates & Forecast, by Location, 2023-2032
      1. Malaysia
        1. Market
    55. Estimates & Forecast, by Sector, 2023-2032
      1. Market Estimates &
    56. Forecast, by Application, 2023-2032
      1. Market Estimates & Forecast,
    57. by Location, 2023-2032
      1. Indonesia
        1. Market Estimates &
    58. Forecast, by Sector, 2023-2032
      1. Market Estimates & Forecast, by Application,
        1. Market Estimates & Forecast, by Location, 2023-2032
    59. India
      1. Market Estimates & Forecast, by Sector, 2023-2032
    60. Market Estimates & Forecast, by Application, 2023-2032
      1. Market Estimates &
    61. Forecast, by Location, 2023-2032
      1. Rest of Asia-Pacific
        1. Market Estimates &
    62. Forecast, by Sector, 2023-2032
      1. Market Estimates & Forecast, by Application,
        1. Market Estimates & Forecast, by Location, 2023-2032
    63. Middle East & Africa
      1. Market Estimates & Forecast, by Sector,
        1. Market Estimates & Forecast, by Application, 2023-2032
    64. Market Estimates & Forecast, by Location, 2023-2032
      1. Market Estimates &
    65. Forecast, by Country, 2023-2032
      1. Saudi Arabia
        1. Market Estimates &
    66. Forecast, by Sector, 2023-2032
      1. Market Estimates & Forecast, by Application,
        1. Market Estimates & Forecast, by Location, 2023-2032
    67. UAE
    68. Market Estimates & Forecast, by Sector, 2023-2032
      1. Market Estimates &
    69. Forecast, by Application, 2023-2032
      1. Market Estimates & Forecast,
    70. by Location, 2023-2032
      1. South Africa
        1. Market Estimates &
    71. Forecast, by Sector, 2023-2032
      1. Market Estimates & Forecast, by Application,
        1. Market Estimates & Forecast, by Location, 2023-2032
    72. Rest of Middle East & Africa
      1. Market Estimates & Forecast, by Sector,
        1. Market Estimates & Forecast, by Application, 2023-2032
    73. Market Estimates & Forecast, by Location, 2023-2032
      1. South America
    74. Market Estimates & Forecast, by Sector, 2023-2032
      1. Market Estimates &
    75. Forecast, by Application, 2023-2032
      1. Market Estimates & Forecast,
    76. by Location, 2023-2032
      1. Market Estimates & Forecast, by Country,
        1. Argentina
    77. Market Estimates & Forecast, by Location, 2023-2032
      1. Brazil
        1. Market
    78. Estimates & Forecast, by Sector, 2023-2032
      1. Market Estimates &
    79. Forecast, by Application, 2023-2032
      1. Market Estimates & Forecast,
    80. by Location, 2023-2032
      1. Rest of South America
        1. Market Estimates &
    81. Forecast, by Sector, 2023-2032
      1. Market Estimates & Forecast, by Application,
        1. Market Estimates & Forecast, by Location, 2023-2032
    82. Competitive Landscape
      1. Competitive Scenario
      2. Competitive Benchmarking
    83. of the Global Water Cut Monitors Market
      1. Major Growth Key Strategies in
    84. the Global Water Cut Monitors Market
      1. Market Share Analysis: Global Water
    85. Cut Monitors Market
      1. Cymbet Corporation: The Leading Player in Terms of
    86. Number of Developments in Global Water Cut Monitors Market
      1. Product Development in
    87. Global Water Cut Monitors Market
      1. Mergers and Acquisitions in Global Water Cut
    88. Monitors Market
      1. Contracts and Agreements in Global Water Cut Monitors
    89. Market
      1. Expansions and Investments in Global Water Cut Monitors Market
    90. Company Profile
      1. Weatherford (US)
        1. Company Overview
    91. Products/Services Offered
      1. Financial Overview
        1. Key Developments
    92. Key Strategies
      1. SWOT Analysis
      2. Emerson Electric Co (US)
        1. Company Overview
    93. Products/Services Offered
      1. Financial Overview
        1. Key Developments
    94. Key Strategies
      1. SWOT Analysis
      2. Schlumberger Limited (US)
        1. Company
    95. Overview
      1. Products/Services Offered
        1. Financial Overview
    96. Key Developments
      1. Key Strategies
        1. SWOT Analysis
    97. TechnipFMC plc (UK)
      1. Company Overview
        1. Products/Services Offered
    98. Financial Overview
      1. Key Developments
        1. Key Strategies
    99. SWOT Analysis
      1. Siemens (Germany)
        1. Company Overview
        2. Products/Services
    100. Offered
      1. Financial Overview
        1. Key Developments
        2. Key
    101. Strategies
      1. SWOT Analysis
      2. Eesiflo (Czech Republic)
        1. Company Overview
    102. Products/Services Offered
      1. Financial Overview
        1. Key Developments
    103. Key Strategies
      1. SWOT Analysis
      2. Ametek Inc (US)
        1. Company Overview
    104. Products/Services Offered
      1. Financial Overview
        1. Key Developments
    105. Key Strategies
      1. SWOT Analysis
      2. Aquasant Messtechnik AG (Switzerland)
    106. Company Overview
      1. Products/Services Offered
        1. Financial Overview
    107. Key Developments
      1. Key Strategies
        1. SWOT Analysis
    108. Haimo Technologies Group Corp (UAE)
      1. Company Overview
        1. Products/Services
    109. Offered
      1. Financial Overview
        1. Key Developments
        2. Key
    110. Strategies
      1. SWOT Analysis
      2. LEMIS Process (US)
        1. Company Overview
    111. Products/Services Offered
      1. Financial Overview
        1. Key Developments
    112. Key Strategies
      1. SWOT Analysis
      2. Agar Corporation (UK)
        1. Company Overview
    113. Products/Services Offered
      1. Financial Overview
        1. Key Developments
    114. Key Strategies
      1. SWOT Analysis
      2. Sentech AS (Norway)
        1. Company Overview
    115. Products/Services Offered
      1. Financial Overview
        1. Key Developments
    116. Key Strategies
      1. SWOT Analysis
    117. Global Water Cut Monitors Market, by Region, 2023-2032 (USD Million)
    118. North America Water Cut Monitors Market, by Country, 2023-2032 (USD Million)
    119. Europe Water Cut Monitors Market, by Country, 2023-2032 (USD Million)
    120. Asia-Pacific Water Cut Monitors Market, by Country, 2023-2032 (USD Million)
    121. Middle East & Africa Water Cut Monitors Market, by Country, 2023-2032 (USD
    122. Million)
    123. (USD Million)
    124. Million)
    125. (USD Million)
    126. Million)
    127. (USD Million)
    128. 2032 (USD Million)
    129. by Sector, 2023-2032 (USD Million)
    130. 2032 (USD Million)
    131. by Application, 2023-2032 (USD Million)
    132. by Application, 2023-2032 (USD Million)
    133. Market, by Application, 2023-2032 (USD Million)
    134. Water Cut Monitors Market, by Application, 2023-2032 (USD Million)
    135. America Water Cut Monitors Market, by Application, 2023-2032 (USD Million)
    136. Global Water Cut Monitors Market, by Location, 2023-2032 (USD Million)
    137. North America Water Cut Monitors Market, by Location, 2023-2032 (USD Million)
    138. Europe Water Cut Monitors Market, by Location, 2023-2032 (USD Million)
    139. Asia-Pacific Water Cut Monitors Market, by Location, 2023-2032 (USD Million)
    140. Middle East & Africa Water Cut Monitors Market, by Location, 2023-2032 (USD
    141. Million)
    142. (USD Million)
    143. Million)
    144. (USD Million)
    145. (USD Million)
    146. (USD Million)
    147. (USD Million)
    148. US Water Cut Monitors Market, by Application, 2023-2032 (USD Million)
    149. US Water Cut Monitors Market, by Location, 2023-2032 (USD Million)
    150. Canada Water Cut Monitors Market, by Sector, 2023-2032 (USD Million)
    151. Canada Water Cut Monitors Market, by Application, 2023-2032 (USD Million)
    152. Canada Water Cut Monitors Market, by Location, 2023-2032 (USD Million)
    153. Mexico Water Cut Monitors Market, by Sector, 2023-2032 (USD Million)
    154. Mexico Water Cut Monitors Market, by Application, 2023-2032 (USD Million)
    155. Mexico Water Cut Monitors Market, by Location, 2023-2032 (USD Million)
    156. Europe Water Cut Monitors Market, by Country, 2023-2032 (USD Million)
    157. Europe Water Cut Monitors Market, by Sector, 2023-2032 (USD Million)
    158. Europe Water Cut Monitors Market, by Application, 2023-2032 (USD Million)
    159. Europe Water Cut Monitors Market, by Location, 2023-2032 (USD Million)
    160. Norway Water Cut Monitors Market, by Sector, 2023-2032 (USD Million)
    161. Norway Water Cut Monitors Market, by Application, 2023-2032 (USD Million)
    162. Norway Water Cut Monitors Market, by Location, 2023-2032 (USD Million)
    163. UK Water Cut Monitors Market, by Sector, 2023-2032 (USD Million)
    164. Water Cut Monitors Market, by Application, 2023-2032 (USD Million)
    165. Water Cut Monitors Market, by Location, 2023-2032 (USD Million)
    166. Water Cut Monitors Market, by Sector, 2023-2032 (USD Million)
    167. Water Cut Monitors Market, by Application, 2023-2032 (USD Million)
    168. Water Cut Monitors Market, by Location, 2023-2032 (USD Million)
    169. of Europe Water Cut Monitors Market, by Sector, 2023-2032 (USD Million)
    170. Rest of Europe Water Cut Monitors Market, by Application, 2023-2032 (USD Million)
    171. Rest of Europe Water Cut Monitors Market, by Location, 2023-2032 (USD Million)
    172. Asia-Pacific Water Cut Monitors Market, by Country, 2023-2032 (USD Million)
    173. Asia-Pacific Water Cut Monitors Market, by Sector, 2023-2032 (USD Million)
    174. Asia-Pacific Water Cut Monitors Market, by Application, 2023-2032 (USD Million)
    175. Asia-Pacific Water Cut Monitors Market, by Location, 2023-2032 (USD Million)
    176. China Water Cut Monitors Market, by Sector, 2023-2032 (USD Million)
    177. China Water Cut Monitors Market, by Application, 2023-2032 (USD Million)
    178. China Water Cut Monitors Market, by Location, 2023-2032 (USD Million)
    179. Malaysia Water Cut Monitors Market, by Sector, 2023-2032 (USD Million)
    180. Malaysia Water Cut Monitors Market, by Application, 2023-2032 (USD Million)
    181. Malaysia Water Cut Monitors Market, by Location, 2023-2032 (USD Million)
    182. India Water Cut Monitors Market, by Sector, 2023-2032 (USD Million)
    183. India Water Cut Monitors Market, by Application, 2023-2032 (USD Million)
    184. India Water Cut Monitors Market, by Location, 2023-2032 (USD Million)
    185. Indonesia Water Cut Monitors Market, by Sector, 2023-2032 (USD Million)
    186. Indonesia Water Cut Monitors Market, by Application, 2023-2032 (USD Million)
    187. Indonesia Water Cut Monitors Market, by Location, 2023-2032 (USD Million)
    188. Rest of Asia-Pacific Water Cut Monitors Market, by Sector, 2023-2032 (USD Million)
    189. Rest of Asia-Pacific Water Cut Monitors Market, by Application, 2023-2032 (USD
    190. Million)
    191. 2032 (USD Million)
    192. Country, 2023-2032 (USD Million)
    193. Sector, 2023-2032 (USD Million)
    194. Application, 2023-2032 (USD Million)
    195. Market, by Location, 2023-2032 (USD Million)
    196. Cut Monitors Market, by Sector, 2023-2032 (USD Million)
    197. Cut Monitors Market, by Application, 2023-2032 (USD Million)
    198. Cut Monitors Market, by Location, 2023-2032 (USD Million)
    199. Market, by Sector, 2023-2032 (USD Million)
    200. by Application, 2023-2032 (USD Million)
    201. by Location, 2023-2032 (USD Million)
    202. Market, by Sector, 2023-2032 (USD Million)
    203. Market, by Application, 2023-2032 (USD Million)
    204. Cut Monitors Market, by Location, 2023-2032 (USD Million)
    205. East & Africa Water Cut Monitors Market, by Sector, 2023-2032 (USD Million)
    206. Rest of the Middle East & Africa Water Cut Monitors Market, by Application,
    207. 2032 (USD Million)
    208. Cut Monitors Market, by Location, 2023-2032 (USD Million)
    209. Cut Monitors Market, by Country, 2023-2032 (USD Million)
    210. Cut Monitors Market, by Sector, 2023-2032 (USD Million)
    211. Cut Monitors Market, by Application, 2023-2032 (USD Million)
    212. Cut Monitors Market, by Location, 2023-2032 (USD Million)
    213. Market, by Sector, 2023-2032 (USD Million)
    214. by Application, 2023-2032 (USD Million)
    215. by Location, 2023-2032 (USD Million)
    216. Market, by Sector, 2023-2032 (USD Million)
    217. Market, by Application, 2023-2032 (USD Million)
    218. Monitors Market, by Location, 2023-2032 (USD Million)
    219. Water Cut Monitors Market, by Sector, 2023-2032 (USD Million)
    220. Rest of South America Water Cut Monitors Market, by Application, 2023-2032 (USD
    221. Million)
    222. 2032 (USD Million)
    223. by Country, 2023-2032 (USD Million)
    224. Market, by Sector, 2023-2032 (USD Million)
    225. Market, by Application, 2023-2032 (USD Million)
    226. Cut Monitors Market, by Location, 2023-2032 (USD Million)
    227. List
    228. of Figures
    229. Approach
    230. Impact Analysis: Market Restraints
    231. Analysis
    232. Share, by Sector, 2020 (%)
    233. 2032 (USD Million)
    234. by Application, 2020 (%)
    235. 2032 (USD Million)
    236. by Location, 2020 (%)
    237. 2032 (USD Million)
    238. Share (%), 2020
    239. 2032 (USD Million)
    240. Million)
    241. Asia-Pacific Water Cut Monitors Market, by Country, 2023-2032 (USD Million)
    242. Middle East & Africa Water Cut Monitors Market Share (%), 2020
    243. Middle East & Africa Water Cut Monitors Market, by Country, 2023-2032 (USD
    244. Million)
    245. South America Water Cut Monitors Market, by Country, 2023-2032 (USD Million)'

    Water Cut Monitors Market Segmentation

    Water Cut Monitors Sector Outlook (USD Billion, 2019-2032)

    • Upstream
    • Midstream
    • Downstream

    Water Cut Monitors Application Outlook (USD Billion, 2019-2032)

    • Well testing
    • Separation Vessel
    • Refinery
    • Others

    Water Cut Monitors Location Outlook (USD Billion, 2019-2032)

    • Onshore
    • Offshore

    Water Cut Monitors Regional Outlook (USD Billion, 2019-2032)

    • North America Outlook (USD Billion, 2019-2032)

      • North America Water Cut Monitors by Sector
        • Upstream
        • Midstream
        • Downstream
      • North America Water Cut Monitors by Application
        • Well testing
        • Separation Vessel
        • Refinery
        • Others
      • North America Water Cut Monitors by Location
        • Onshore
        • Offshore
      • US Outlook (USD Billion, 2019-2032)

      • US Water Cut Monitors by Sector
        • Upstream
        • Midstream
        • Downstream
      • US Water Cut Monitors by Application
        • Well testing
        • Separation Vessel
        • Refinery
        • Others
      • US Water Cut Monitors by Location
        • Onshore
        • Offshore
      • CANADA Outlook (USD Billion, 2019-2032)

      • CANADA Water Cut Monitors by Sector
        • Upstream
        • Midstream
        • Downstream
      • CANADA Water Cut Monitors by Application
        • Well testing
        • Separation Vessel
        • Refinery
        • Others
      • CANADA Water Cut Monitors by Location
        • Onshore
        • Offshore
    • Europe Outlook (USD Billion, 2019-2032)

      • Europe Water Cut Monitors by Sector
        • Upstream
        • Midstream
        • Downstream
      • Europe Water Cut Monitors by Application
        • Well testing
        • Separation Vessel
        • Refinery
        • Others
      • Europe Water Cut Monitors by Location
        • Onshore
        • Offshore
      • Germany Outlook (USD Billion, 2019-2032)

      • Germany Water Cut Monitors by Sector
        • Upstream
        • Midstream
        • Downstream
      • Germany Water Cut Monitors by Application
        • Well testing
        • Separation Vessel
        • Refinery
        • Others
      • Germany Water Cut Monitors by Location
        • Onshore
        • Offshore
      • France Outlook (USD Billion, 2019-2032)

      • France Water Cut Monitors by Sector
        • Upstream
        • Midstream
        • Downstream
      • France Water Cut Monitors by Application
        • Well testing
        • Separation Vessel
        • Refinery
        • Others
      • France Water Cut Monitors by Location
        • Onshore
        • Offshore
      • UK Outlook (USD Billion, 2019-2032)

      • UK Water Cut Monitors by Sector
        • Upstream
        • Midstream
        • Downstream
      • UK Water Cut Monitors by Application
        • Well testing
        • Separation Vessel
        • Refinery
        • Others
      • UK Water Cut Monitors by Location
        • Onshore
        • Offshore
      • ITALY Outlook (USD Billion, 2019-2032)

      • ITALY Water Cut Monitors by Sector
        • Upstream
        • Midstream
        • Downstream
      • ITALY Water Cut Monitors by Application
        • Well testing
        • Separation Vessel
        • Refinery
        • Others
      • ITALY Water Cut Monitors by Location
        • Onshore
        • Offshore
      • SPAIN Outlook (USD Billion, 2019-2032)

      • Spain Water Cut Monitors by Sector
        • Upstream
        • Midstream
        • Downstream
      • Spain Water Cut Monitors by Application
        • Well testing
        • Separation Vessel
        • Refinery
        • Others
      • Spain Water Cut Monitors by Location
        • Onshore
        • Offshore
      • Rest Of Europe Outlook (USD Billion, 2019-2032)

      • Rest Of Europe Water Cut Monitors by Sector
        • Upstream
        • Midstream
        • Downstream
      • REST OF EUROPE Water Cut Monitors by Application
        • Well testing
        • Separation Vessel
        • Refinery
        • Others
      • Rest Of Europe Water Cut Monitors by Location
        • Onshore
        • Offshore
    • Asia-Pacific Outlook (USD Billion, 2019-2032)

      • Asia-Pacific Water Cut Monitors by Sector
        • Upstream
        • Midstream
        • Downstream
      • Asia-Pacific Water Cut Monitors by Application
        • Well testing
        • Separation Vessel
        • Refinery
        • Others
      • Asia-Pacific Water Cut Monitors by Location
        • Onshore
        • Offshore
      • China Outlook (USD Billion, 2019-2032)

      • China Water Cut Monitors by Sector
        • Upstream
        • Midstream
        • Downstream
      • China Water Cut Monitors by Application
        • Well testing
        • Separation Vessel
        • Refinery
        • Others
      • China Water Cut Monitors by Location
        • Onshore
        • Offshore
      • Japan Outlook (USD Billion, 2019-2032)

      • Japan Water Cut Monitors by Sector
        • Upstream
        • Midstream
        • Downstream
      • Japan Water Cut Monitors by Application
        • Well testing
        • Separation Vessel
        • Refinery
        • Others
      • Japan Water Cut Monitors by Location
        • Onshore
        • Offshore
      • India Outlook (USD Billion, 2019-2032)

      • India Water Cut Monitors by Sector
        • Upstream
        • Midstream
        • Downstream
      • India Water Cut Monitors by Application
        • Well testing
        • Separation Vessel
        • Refinery
        • Others
      • India Water Cut Monitors by Location
        • Onshore
        • Offshore
      • Australia Outlook (USD Billion, 2019-2032)

      • Australia Water Cut Monitors by Sector
        • Upstream
        • Midstream
        • Downstream
      • Australia Water Cut Monitors by Application
        • Well testing
        • Separation Vessel
        • Refinery
        • Others
      • Australia Water Cut Monitors by Location
        • Onshore
        • Offshore
      • Rest of Asia-Pacific Outlook (USD Billion, 2019-2032)

      • Rest of Asia-Pacific Water Cut Monitors by Sector
        • Upstream
        • Midstream
        • Downstream
      • Rest of Asia-Pacific Water Cut Monitors by Application
        • Well testing
        • Separation Vessel
        • Refinery
        • Others
      • Rest of Asia-Pacific Water Cut Monitors by Location
        • Onshore
        • Offshore
    • Rest of the World Outlook (USD Billion, 2019-2032)

      • Rest of the World Water Cut Monitors by Sector
        • Upstream
        • Midstream
        • Downstream
      • Rest of the World Water Cut Monitors by Application
        • Well testing
        • Separation Vessel
        • Refinery
        • Others
      • Rest of the World Water Cut Monitors by Location
        • Onshore
        • Offshore
      • Middle East Outlook (USD Billion, 2019-2032)

      • Middle East Water Cut Monitors by Sector
        • Upstream
        • Midstream
        • Downstream
      • Middle East Water Cut Monitors by Application
        • Well testing
        • Separation Vessel
        • Refinery
        • Others
      • Middle East Water Cut Monitors by Location
        • Onshore
        • Offshore
      • Africa Outlook (USD Billion, 2019-2032)

      • Africa Water Cut Monitors by Sector
        • Upstream
        • Midstream
        • Downstream
      • Africa Water Cut Monitors by Application
        • Well testing
        • Separation Vessel
        • Refinery
        • Others
      • Africa Water Cut Monitors by Location
        • Onshore
        • Offshore
      • Latin America Outlook (USD Billion, 2019-2032)

      • Latin America Water Cut Monitors by Sector
        • Upstream
        • Midstream
        • Downstream
      • Latin America Water Cut Monitors by Application
        • Well testing
        • Separation Vessel
        • Refinery
        • Others
      • Latin America Water Cut Monitors by Location
        • Onshore
        • Offshore
    Infographic

    Free Sample Request

    Kindly complete the form below to receive a free sample of this Report

    Get Free Sample

    Customer Strories

    “I am very pleased with how market segments have been defined in a relevant way for my purposes (such as "Portable Freezers & refrigerators" and "last-mile"). In general the report is well structured. Thanks very much for your efforts.”

    Victoria Milne

    Founder
    Case Study

    Smartphone Motherboard Parts Manufacturing Research