• Cat-intel
  • MedIntelliX
  • Resources
  • About Us
  • Hero Background
    English
    Chinese
    French
    Japanese
    Korean
    German
    Spanish

    UK Processed Eggs Market Size

    ID: MRFR/F-B & N/12426-HCR
    128 Pages
    Snehal Singh
    October 2025

    UK Processed Eggs Market Research Report Information By Product Type (Dried Egg Products, Liquid Egg Products, and Frozen Egg Products), By Application (Bakery & Confectionery, Food Processing, Diary Production, Ready to Eat, Soups and Sauces, and Others), - Market Forecast Till 2035

    Share:
    Download PDF ×

    We do not share your information with anyone. However, we may send you emails based on your report interest from time to time. You may contact us at any time to opt-out.

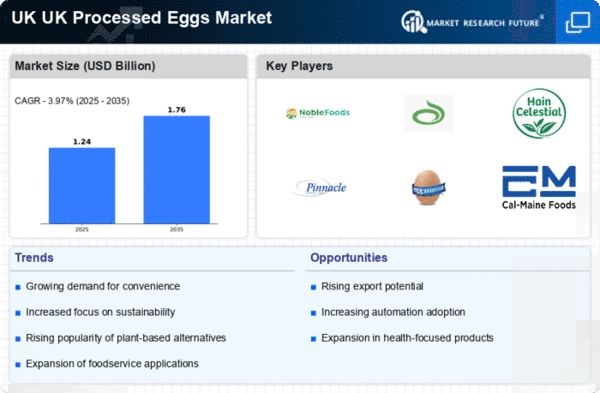
    UK Processed Eggs Market Infographic
    Purchase Options

    Uk Processed Eggs Size

    UK Processed Eggs Market Growth Projections and Opportunities

    The UK processed eggs market is influenced by a variety of factors that collectively shape its growth and dynamics. One of the primary drivers is the convenience and versatility offered by processed eggs in various food applications. Processed eggs, including liquid eggs, powdered eggs, and pre-cooked eggs, provide a convenient solution for consumers and food manufacturers, saving time and effort in food preparation. The demand for quick and easy meal options has contributed to the steady growth of the processed eggs market in the UK, as consumers seek convenient and ready-to-use egg products.

    Changing consumer preferences and dietary habits also play a crucial role in shaping the UK processed eggs market. With a growing focus on protein-rich diets and the recognition of eggs as a valuable source of protein, processed egg products have gained popularity. The versatility of processed eggs in both sweet and savory dishes, along with their extended shelf life, appeals to consumers looking for healthy and convenient protein options. This shift in consumer preferences towards healthier and protein-packed foods has positively influenced the demand for processed eggs.

    The food industry's emphasis on product innovation and convenience further contributes to the market trends in the UK processed eggs segment. Manufacturers are continually developing new and innovative processed egg products, such as pre-made omelets, egg-based snacks, and protein-rich breakfast options. These innovations cater to the evolving tastes and preferences of consumers, enhancing the market's overall growth and expanding the range of processed egg offerings available in the market.

    Supply chain dynamics, including egg production, processing facilities, and distribution networks, significantly impact the UK processed eggs market. The availability of high-quality eggs, efficient processing facilities, and reliable distribution channels are crucial for meeting consumer demand. Changes in egg production practices, such as cage-free or organic egg production, can influence the sourcing and pricing of eggs used in processed egg products. Market participants need to navigate these supply chain complexities to ensure a stable and reliable source of raw materials for processed eggs.

    Regulatory considerations and quality standards also play a vital role in the processed eggs market. Stringent regulations govern food safety, labeling, and production practices in the UK. Compliance with these standards is essential for building consumer trust and ensuring the safety and quality of processed egg products. Companies that prioritize and communicate their adherence to these regulations often establish a positive brand image, gaining a competitive edge in the market.

    Economic conditions and consumer purchasing power contribute to market dynamics. In periods of economic stability, consumers may be more willing to spend on convenient and premium processed egg products. Conversely, during economic downturns, there may be a shift towards more cost-conscious choices. Market participants need to consider these economic dynamics and adjust pricing strategies and product offerings accordingly.

    The impact of sustainability and ethical considerations is increasingly influencing consumer choices in the UK processed eggs market. Consumers are more conscious of the environmental and ethical aspects of food production, leading to a preference for products with sustainable and humane sourcing practices. Companies adopting eco-friendly packaging, ethical sourcing of eggs, and transparent supply chain practices may attract consumers who prioritize sustainability, contributing to market growth.

    Distribution channels and retail partnerships are critical elements in the UK processed eggs market. The accessibility of processed egg products through supermarkets, convenience stores, and online platforms impacts consumer reach and market penetration. Collaborations with retailers and effective distribution strategies contribute to the visibility and availability of processed eggs, influencing purchasing decisions and brand loyalty.
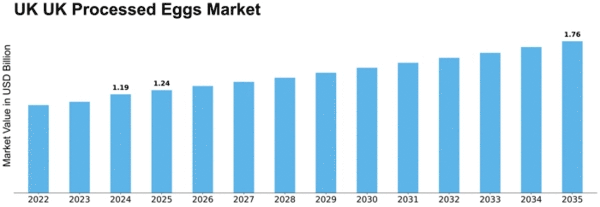
    UK Processed Eggs Market Size Graph
    Author
    Snehal Singh
    Assistant Manager - Research

    High acumen in analyzing complex macro & micro markets with more than 6 years of work experience in the field of market research. By implementing her analytical skills in forecasting and estimation into market research reports, she has expertise in Packaging, Construction, and Equipment domains. She handles a team size of 20-25 resources and ensures smooth running of the projects, associated marketing activities, and client servicing.

    Leave a Comment

    FAQs

    How much is the processed eggs market?

    The UK Processed Eggs market size was valued at USD 1.30 Billion in 2023.

    What is the growth rate of the processed eggs market?

    The market is projected to grow at a CAGR of 3.8% during the forecast period, 2025-2034.

    Who are the key players in the processed eggs market?

    The key players in the market are Actini Group, Avril SCA, Interovo Egg Group B.V., Rose Acre Farms, Ballas Egg Products Corporation, Cal-Marine Foods Inc., Igreca S.A., Rembrandt Enterprises Inc., Bouwhuis Enthoven BV, Sanovo Technology Group, Moba B.V., SKM Egg Products Export, Tyson Foods Inc., Dakota Layers, and Glon Group.

    Which product type led the processed eggs market?

    The dried egg products category dominated the market in 2023.

    Which application had the largest market share in the processed eggs market?

    The bakery & confectionery category had the largest share in the market.

    Market Summary

    The United Kingdom processed eggs market is projected to grow from 1.35 USD billion in 2024 to 2.03 USD billion by 2035.

    Key Market Trends & Highlights

    UK Processed Eggs Key Trends and Highlights

    • The market valuation for processed eggs in the United Kingdom is expected to reach 1.35 USD billion in 2024. By 2035, the processed eggs market in the UK is anticipated to grow to 2.03 USD billion. The compound annual growth rate (CAGR) for the UK processed eggs market is estimated at 3.8 percent from 2025 to 2035. Growing adoption of processed egg products due to increasing consumer demand for convenience is a major market driver.

    Market Size & Forecast

    2024 Market Size 1.35 (USD Billion)
    2035 Market Size 2.03 (USD Billion)
    CAGR (2025-2035) 3.80%
    Largest Regional Market Share in 2024 latin_america)

    Major Players

    <p>Actini Group, Avril SCA, Interovo Egg Group B.V., Rose Acre Farms, Ballas Egg Products Corporation, Cal-Marine Foods Inc., Igreca S.A., Rembrandt Enterprises Inc., Bouwhuis Enthoven BV, Sanovo Technology Group, Moba B.V., SKM Egg Products Export, Tyson Foods Inc., Dakota Layers, Glon Group</p>

    Market Trends

    Rising demand for processed food to boost the market growth

    Thus, the market for processed eggs will become more necessary as consumer demand for eggs grows. For instance, in April 2022, the UK government's Department for Environment, Food, and Rural Affairs released statistics showing that UK egg processors bought 1,113 thousand cases (or 24.4 thousand tonnes) of eggs in Q3 2021—a 22% increase over the same period in 2020 and a return to pre-2020 levels. 72% of the eggs produced in Q3 2021 were liquid; this was a 19% increase in output over the same quarter in 2020.

    Growing spending on food and drink, the introduction of items with extended shelf lives, an increase in impulsive purchases, and the growing need for quick-to-prepare convenience foods due to time constraints are the main factors driving the market. These elements have made it necessary to store food in homes so that it wouldn't spoil for an extended period of time, which has increased the need for frozen food. Additionally, there is a growing need for convenience food as a result of people's hectic lifestyles and growing urban population.

    Because they lack the time or expertise to prepare meals at home, many consumers are ready to spend money on convenience foods. Convenience food retail has become more necessary as a result. Broken shells and hand egg component separation are no longer necessary with processed eggs. Moreover, processed eggs have a chance to be used in innovative and new food products including healthcare items and processed eggs. Thus, driving the processed eggs market revenue.

    UK Processed Eggs Market Market Drivers

    Market Segment Insights

    Processed Eggs Product Type Insights

    <p>The UK Processed Eggs market segmentation, based on product type includes Dried Egg Products, Liquid Egg Products, and Frozen Egg Products. The dried egg products segment dominated the market mostly because some products have a longer shelf life and are more stable than others. Due to their exceptional emulsifying capabilities and widespread use as a fresh egg substitute in a variety of bakery items, including cookies, cakes, ice cream, sauces, and doughnuts, these egg products are expected to contribute to the segment's growth.</p>

    <p>Figure 1: UK Processed Eggs Market, by Product Type, 2022 &amp; 2032 (USD Billion)</p>

    <p>Source: Secondary Research, Primary Research, Market Research Future Database and Analyst Review</p>

    Processed Eggs Application Insights

    <p>The UK Processed Eggs market segmentation, based on application, includes Bakery &amp; Confectionery, Food Processing, Diary Production, Ready to Eat, Soups and Sauces, and Others. The bakery &amp; confectionery category generated the most income. The increasing use of processed eggs to add taste, nutrition, and color to baked goods including cakes, cookies, and ice cream is responsible for the category market's growth. Furthermore, the growing prevalence of social media marketing initiatives and the appeal of various e-commerce sites due to increased internet accessibility are anticipated to generate profitable expansion prospects for this market segment in the coming years.</p>

    Processed Eggs Country Insights

    <p>The UK is expected to maintain its substantial market revenue share in 2022 and see steady growth in the upcoming years due to the availability of a wide variety of processed egg products and increased product innovation in the area. Furthermore, a major portion of the increase in the regional market is anticipated to come from the growing number of people leading hectic lives and looking for meals that satisfy their health requirements, as well as from the UK's thriving bakery industry. Additionally, the consumption of processed eggs is rising due to technological developments, which is driving market expansion.</p>

    <p>The UK's egg consumption is rising, which is driving up processed egg production and encouraging the growth of the processed egg market.</p>

    Get more detailed insights about UK Processed Eggs Market Research Report— Forecast till 2035

    Regional Insights

    Key Players and Competitive Insights

    Leading market players are investing heavily in research and development in order to expand their product lines, which will help the processed eggs market, grow even more. Market participants are also undertaking a variety of strategic activities to expand their  footprint, with important market developments including new product launches, contractual agreements, mergers and acquisitions, higher investments, and collaboration with other organizations. To expand and survive in a more competitive and rising market climate, processed eggs industry must offer cost-effective items.

    Major players in the processed eggs market are attempting to increase market demand by investing in research and development operations includes Actini Group, Avril SCA, Interovo Egg Group B.V., Rose Acre Farms, Ballas Egg Products Corporation, Cal-Marine Foods Inc., Igreca S.A., Rembrandt Enterprises Inc., Bouwhuis Enthoven BV, Sanovo Technology Group, Moba B.V., SKM Egg Products Export, Tyson Foods Inc., Dakota Layers, and Glon Group.

    Key Companies in the UK Processed Eggs Market market include

    Industry Developments

    July 2022: A strategic investment in Ovotrack Holding, a top provider of inventory management and traceability systems for egg processing facilities, grading centers, and hatcheries, has been agreed to by Sanovo Technology and Ovotrack.

    July 2021: A brand of bottled egg whites was introduced by Cornish egg company St Ewe's in Morrisons stores around the nation. The Super Egg Whites are 100% pasteurized free-range egg whites, zero grams of fat, zero grams of protein per 100 milliliters, and devoid of gluten and cholesterol, according to the producer.

    Future Outlook

    UK Processed Eggs Market Future Outlook

    Market Segmentation

    Processed Eggs Application Outlook

    • Bakery & Confectionery
    • Food Processing
    • Diary Production
    • Ready to Eat
    • Soups and Sauces
    • Others

    Processed Eggs Product Type Outlook

    • Dried Egg Products
    • Liquid Egg Products
    • Frozen Egg Products

    Report Scope

    Report Attribute/MetricDetails
    Market Size 2024USD 1.35 Billion
    Market Size 2025USD 1.40 Billion
    Market Size 20352.03 (Value (USD Billion))
    Compound Annual Growth Rate (CAGR)3.80% (2025 - 2035)
    Base Year2024
    Market Forecast Period2025 - 2035
    Historical Data2019- 2023
    Market Forecast UnitsValue (USD Billion)
    Report CoverageRevenue Forecast, Market Competitive Landscape, Growth Factors, and Trends
    Segments CoveredProduct Type, Application, and Region
    Countries CoveredUK
    Key Companies ProfiledActini Group, Avril SCA, Interovo Egg Group B.V., Rose Acre Farms, Ballas Egg Products Corporation, Cal-Marine Foods Inc., Igreca S.A., Rembrandt Enterprises Inc., Bouwhuis Enthoven BV, Sanovo Technology Group, Moba B.V., SKM Egg Products Export, Tyson Foods Inc., Dakota Layers, and Glon Group
    Key Market OpportunitiesDevelopment of fresh and inventive methods for processing eggs throughout production Altering customer tastes in favor of processed foods
    Key Market DynamicsDemand for meals high in protein and dietary supplements Significant increase in the use of processed eggs across a number of industries, including baking & confectionery and dairy

    FAQs

    How much is the processed eggs market?

    The UK Processed Eggs market size was valued at USD 1.30 Billion in 2023.

    What is the growth rate of the processed eggs market?

    The market is projected to grow at a CAGR of 3.8% during the forecast period, 2025-2034.

    Who are the key players in the processed eggs market?

    The key players in the market are Actini Group, Avril SCA, Interovo Egg Group B.V., Rose Acre Farms, Ballas Egg Products Corporation, Cal-Marine Foods Inc., Igreca S.A., Rembrandt Enterprises Inc., Bouwhuis Enthoven BV, Sanovo Technology Group, Moba B.V., SKM Egg Products Export, Tyson Foods Inc., Dakota Layers, and Glon Group.

    Which product type led the processed eggs market?

    The dried egg products category dominated the market in 2023.

    Which application had the largest market share in the processed eggs market?

    The bakery &amp; confectionery category had the largest share in the market.

    1. SECTION I: EXECUTIVE SUMMARY AND KEY HIGHLIGHTS
      1. | 1.1 EXECUTIVE SUMMARY
      2. | | 1.1.1 Market Overview
      3. | | 1.1.2 Key Findings
      4. | | 1.1.3 Market Segmentation
      5. | | 1.1.4 Competitive Landscape
      6. | | 1.1.5 Challenges and Opportunities
      7. | | 1.1.6 Future Outlook
    2. SECTION II: SCOPING, METHODOLOGY AND MARKET STRUCTURE
      1. | 2.1 MARKET INTRODUCTION
      2. | | 2.1.1 Definition
      3. | | 2.1.2 Scope of the study
      4. | | | 2.1.2.1 Research Objective
      5. | | | 2.1.2.2 Assumption
      6. | | | 2.1.2.3 Limitations
      7. | 2.2 RESEARCH METHODOLOGY
      8. | | 2.2.1 Overview
      9. | | 2.2.2 Data Mining
      10. | | 2.2.3 Secondary Research
      11. | | 2.2.4 Primary Research
      12. | | | 2.2.4.1 Primary Interviews and Information Gathering Process
      13. | | | 2.2.4.2 Breakdown of Primary Respondents
      14. | | 2.2.5 Forecasting Model
      15. | | 2.2.6 Market Size Estimation
      16. | | | 2.2.6.1 Bottom-Up Approach
      17. | | | 2.2.6.2 Top-Down Approach
      18. | | 2.2.7 Data Triangulation
      19. | | 2.2.8 Validation
    3. SECTION III: QUALITATIVE ANALYSIS
      1. | 3.1 MARKET DYNAMICS
      2. | | 3.1.1 Overview
      3. | | 3.1.2 Drivers
      4. | | 3.1.3 Restraints
      5. | | 3.1.4 Opportunities
      6. | 3.2 MARKET FACTOR ANALYSIS
      7. | | 3.2.1 Value chain Analysis
      8. | | 3.2.2 Porter's Five Forces Analysis
      9. | | | 3.2.2.1 Bargaining Power of Suppliers
      10. | | | 3.2.2.2 Bargaining Power of Buyers
      11. | | | 3.2.2.3 Threat of New Entrants
      12. | | | 3.2.2.4 Threat of Substitutes
      13. | | | 3.2.2.5 Intensity of Rivalry
      14. | | 3.2.3 COVID-19 Impact Analysis
      15. | | | 3.2.3.1 Market Impact Analysis
      16. | | | 3.2.3.2 Regional Impact
      17. | | | 3.2.3.3 Opportunity and Threat Analysis
    4. SECTION IV: QUANTITATIVE ANALYSIS
      1. | 4.1 Food, Beverages & Nutrition, BY Type (USD Billion)
      2. | | 4.1.1 Dried Egg Products
      3. | | 4.1.2 Liquid Egg Products
      4. | | 4.1.3 Frozen Egg Products
      5. | 4.2 Food, Beverages & Nutrition, BY Application (USD Billion)
      6. | | 4.2.1 Bakery & Confectionery
      7. | | 4.2.2 Food Processing
      8. | | 4.2.3 Diary Production
      9. | | 4.2.4 Ready to Eat
      10. | | 4.2.5 Soups and Sauces
      11. | | 4.2.6 Others
      12. | 4.3 Food, Beverages & Nutrition, BY Region (USD Billion)
      13. | | 4.3.1 North America
      14. | | | 4.3.1.1 US
      15. | | | 4.3.1.2 Canada
      16. | | 4.3.2 Europe
      17. | | | 4.3.2.1 Germany
      18. | | | 4.3.2.2 UK
      19. | | | 4.3.2.3 France
      20. | | | 4.3.2.4 Russia
      21. | | | 4.3.2.5 Italy
      22. | | | 4.3.2.6 Spain
      23. | | | 4.3.2.7 Rest of Europe
      24. | | 4.3.3 APAC
      25. | | | 4.3.3.1 China
      26. | | | 4.3.3.2 India
      27. | | | 4.3.3.3 Japan
      28. | | | 4.3.3.4 South Korea
      29. | | | 4.3.3.5 Malaysia
      30. | | | 4.3.3.6 Thailand
      31. | | | 4.3.3.7 Indonesia
      32. | | | 4.3.3.8 Rest of APAC
      33. | | 4.3.4 South America
      34. | | | 4.3.4.1 Brazil
      35. | | | 4.3.4.2 Mexico
      36. | | | 4.3.4.3 Argentina
      37. | | | 4.3.4.4 Rest of South America
      38. | | 4.3.5 MEA
      39. | | | 4.3.5.1 GCC Countries
      40. | | | 4.3.5.2 South Africa
      41. | | | 4.3.5.3 Rest of MEA
    5. SECTION V: COMPETITIVE ANALYSIS
      1. | 5.1 Competitive Landscape
      2. | | 5.1.1 Overview
      3. | | 5.1.2 Competitive Analysis
      4. | | 5.1.3 Market share Analysis
      5. | | 5.1.4 Major Growth Strategy in the Food, Beverages & Nutrition
      6. | | 5.1.5 Competitive Benchmarking
      7. | | 5.1.6 Leading Players in Terms of Number of Developments in the Food, Beverages & Nutrition
      8. | | 5.1.7 Key developments and growth strategies
      9. | | | 5.1.7.1 New Product Launch/Service Deployment
      10. | | | 5.1.7.2 Merger & Acquisitions
      11. | | | 5.1.7.3 Joint Ventures
      12. | | 5.1.8 Major Players Financial Matrix
      13. | | | 5.1.8.1 Sales and Operating Income
      14. | | | 5.1.8.2 Major Players R&D Expenditure. 2023
      15. | 5.2 Company Profiles
      16. | | 5.2.1 Noble Foods (GB)
      17. | | | 5.2.1.1 Financial Overview
      18. | | | 5.2.1.2 Products Offered
      19. | | | 5.2.1.3 Key Developments
      20. | | | 5.2.1.4 SWOT Analysis
      21. | | | 5.2.1.5 Key Strategies
      22. | | 5.2.2 Pinnacle Foods (GB)
      23. | | | 5.2.2.1 Financial Overview
      24. | | | 5.2.2.2 Products Offered
      25. | | | 5.2.2.3 Key Developments
      26. | | | 5.2.2.4 SWOT Analysis
      27. | | | 5.2.2.5 Key Strategies
      28. | | 5.2.3 Hickmans (GB)
      29. | | | 5.2.3.1 Financial Overview
      30. | | | 5.2.3.2 Products Offered
      31. | | | 5.2.3.3 Key Developments
      32. | | | 5.2.3.4 SWOT Analysis
      33. | | | 5.2.3.5 Key Strategies
      34. | | 5.2.4 Lakeside Foods (GB)
      35. | | | 5.2.4.1 Financial Overview
      36. | | | 5.2.4.2 Products Offered
      37. | | | 5.2.4.3 Key Developments
      38. | | | 5.2.4.4 SWOT Analysis
      39. | | | 5.2.4.5 Key Strategies
      40. | | 5.2.5 The Happy Egg Co (GB)
      41. | | | 5.2.5.1 Financial Overview
      42. | | | 5.2.5.2 Products Offered
      43. | | | 5.2.5.3 Key Developments
      44. | | | 5.2.5.4 SWOT Analysis
      45. | | | 5.2.5.5 Key Strategies
      46. | | 5.2.6 Eggs by Ella (GB)
      47. | | | 5.2.6.1 Financial Overview
      48. | | | 5.2.6.2 Products Offered
      49. | | | 5.2.6.3 Key Developments
      50. | | | 5.2.6.4 SWOT Analysis
      51. | | | 5.2.6.5 Key Strategies
      52. | | 5.2.7 Cotswold Eggs (GB)
      53. | | | 5.2.7.1 Financial Overview
      54. | | | 5.2.7.2 Products Offered
      55. | | | 5.2.7.3 Key Developments
      56. | | | 5.2.7.4 SWOT Analysis
      57. | | | 5.2.7.5 Key Strategies
      58. | | 5.2.8 Dale Farm (GB)
      59. | | | 5.2.8.1 Financial Overview
      60. | | | 5.2.8.2 Products Offered
      61. | | | 5.2.8.3 Key Developments
      62. | | | 5.2.8.4 SWOT Analysis
      63. | | | 5.2.8.5 Key Strategies
      64. | | 5.2.9 Moy Park (GB)
      65. | | | 5.2.9.1 Financial Overview
      66. | | | 5.2.9.2 Products Offered
      67. | | | 5.2.9.3 Key Developments
      68. | | | 5.2.9.4 SWOT Analysis
      69. | | | 5.2.9.5 Key Strategies
      70. | 5.3 Appendix
      71. | | 5.3.1 References
      72. | | 5.3.2 Related Reports
    6. LIST OF FIGURES
      1. | 6.1 MARKET SYNOPSIS
      2. | 6.2 NORTH AMERICA MARKET ANALYSIS
      3. | 6.3 US MARKET ANALYSIS BY TYPE
      4. | 6.4 US MARKET ANALYSIS BY APPLICATION
      5. | 6.5 CANADA MARKET ANALYSIS BY TYPE
      6. | 6.6 CANADA MARKET ANALYSIS BY APPLICATION
      7. | 6.7 EUROPE MARKET ANALYSIS
      8. | 6.8 GERMANY MARKET ANALYSIS BY TYPE
      9. | 6.9 GERMANY MARKET ANALYSIS BY APPLICATION
      10. | 6.10 UK MARKET ANALYSIS BY TYPE
      11. | 6.11 UK MARKET ANALYSIS BY APPLICATION
      12. | 6.12 FRANCE MARKET ANALYSIS BY TYPE
      13. | 6.13 FRANCE MARKET ANALYSIS BY APPLICATION
      14. | 6.14 RUSSIA MARKET ANALYSIS BY TYPE
      15. | 6.15 RUSSIA MARKET ANALYSIS BY APPLICATION
      16. | 6.16 ITALY MARKET ANALYSIS BY TYPE
      17. | 6.17 ITALY MARKET ANALYSIS BY APPLICATION
      18. | 6.18 SPAIN MARKET ANALYSIS BY TYPE
      19. | 6.19 SPAIN MARKET ANALYSIS BY APPLICATION
      20. | 6.20 REST OF EUROPE MARKET ANALYSIS BY TYPE
      21. | 6.21 REST OF EUROPE MARKET ANALYSIS BY APPLICATION
      22. | 6.22 APAC MARKET ANALYSIS
      23. | 6.23 CHINA MARKET ANALYSIS BY TYPE
      24. | 6.24 CHINA MARKET ANALYSIS BY APPLICATION
      25. | 6.25 INDIA MARKET ANALYSIS BY TYPE
      26. | 6.26 INDIA MARKET ANALYSIS BY APPLICATION
      27. | 6.27 JAPAN MARKET ANALYSIS BY TYPE
      28. | 6.28 JAPAN MARKET ANALYSIS BY APPLICATION
      29. | 6.29 SOUTH KOREA MARKET ANALYSIS BY TYPE
      30. | 6.30 SOUTH KOREA MARKET ANALYSIS BY APPLICATION
      31. | 6.31 MALAYSIA MARKET ANALYSIS BY TYPE
      32. | 6.32 MALAYSIA MARKET ANALYSIS BY APPLICATION
      33. | 6.33 THAILAND MARKET ANALYSIS BY TYPE
      34. | 6.34 THAILAND MARKET ANALYSIS BY APPLICATION
      35. | 6.35 INDONESIA MARKET ANALYSIS BY TYPE
      36. | 6.36 INDONESIA MARKET ANALYSIS BY APPLICATION
      37. | 6.37 REST OF APAC MARKET ANALYSIS BY TYPE
      38. | 6.38 REST OF APAC MARKET ANALYSIS BY APPLICATION
      39. | 6.39 SOUTH AMERICA MARKET ANALYSIS
      40. | 6.40 BRAZIL MARKET ANALYSIS BY TYPE
      41. | 6.41 BRAZIL MARKET ANALYSIS BY APPLICATION
      42. | 6.42 MEXICO MARKET ANALYSIS BY TYPE
      43. | 6.43 MEXICO MARKET ANALYSIS BY APPLICATION
      44. | 6.44 ARGENTINA MARKET ANALYSIS BY TYPE
      45. | 6.45 ARGENTINA MARKET ANALYSIS BY APPLICATION
      46. | 6.46 REST OF SOUTH AMERICA MARKET ANALYSIS BY TYPE
      47. | 6.47 REST OF SOUTH AMERICA MARKET ANALYSIS BY APPLICATION
      48. | 6.48 MEA MARKET ANALYSIS
      49. | 6.49 GCC COUNTRIES MARKET ANALYSIS BY TYPE
      50. | 6.50 GCC COUNTRIES MARKET ANALYSIS BY APPLICATION
      51. | 6.51 SOUTH AFRICA MARKET ANALYSIS BY TYPE
      52. | 6.52 SOUTH AFRICA MARKET ANALYSIS BY APPLICATION
      53. | 6.53 REST OF MEA MARKET ANALYSIS BY TYPE
      54. | 6.54 REST OF MEA MARKET ANALYSIS BY APPLICATION
      55. | 6.55 KEY BUYING CRITERIA OF FOOD, BEVERAGES & NUTRITION
      56. | 6.56 RESEARCH PROCESS OF MRFR
      57. | 6.57 DRO ANALYSIS OF FOOD, BEVERAGES & NUTRITION
      58. | 6.58 DRIVERS IMPACT ANALYSIS: FOOD, BEVERAGES & NUTRITION
      59. | 6.59 RESTRAINTS IMPACT ANALYSIS: FOOD, BEVERAGES & NUTRITION
      60. | 6.60 SUPPLY / VALUE CHAIN: FOOD, BEVERAGES & NUTRITION
      61. | 6.61 FOOD, BEVERAGES & NUTRITION, BY TYPE, 2024 (% SHARE)
      62. | 6.62 FOOD, BEVERAGES & NUTRITION, BY TYPE, 2024 TO 2035 (USD Billion)
      63. | 6.63 FOOD, BEVERAGES & NUTRITION, BY APPLICATION, 2024 (% SHARE)
      64. | 6.64 FOOD, BEVERAGES & NUTRITION, BY APPLICATION, 2024 TO 2035 (USD Billion)
      65. | 6.65 BENCHMARKING OF MAJOR COMPETITORS
    7. LIST OF TABLES
      1. | 7.1 LIST OF ASSUMPTIONS
      2. | | 7.1.1
      3. | 7.2 North America MARKET SIZE ESTIMATES; FORECAST
      4. | | 7.2.1 BY TYPE, 2025-2035 (USD Billion)
      5. | | 7.2.2 BY APPLICATION, 2025-2035 (USD Billion)
      6. | 7.3 US MARKET SIZE ESTIMATES; FORECAST
      7. | | 7.3.1 BY TYPE, 2025-2035 (USD Billion)
      8. | | 7.3.2 BY APPLICATION, 2025-2035 (USD Billion)
      9. | 7.4 Canada MARKET SIZE ESTIMATES; FORECAST
      10. | | 7.4.1 BY TYPE, 2025-2035 (USD Billion)
      11. | | 7.4.2 BY APPLICATION, 2025-2035 (USD Billion)
      12. | 7.5 Europe MARKET SIZE ESTIMATES; FORECAST
      13. | | 7.5.1 BY TYPE, 2025-2035 (USD Billion)
      14. | | 7.5.2 BY APPLICATION, 2025-2035 (USD Billion)
      15. | 7.6 Germany MARKET SIZE ESTIMATES; FORECAST
      16. | | 7.6.1 BY TYPE, 2025-2035 (USD Billion)
      17. | | 7.6.2 BY APPLICATION, 2025-2035 (USD Billion)
      18. | 7.7 UK MARKET SIZE ESTIMATES; FORECAST
      19. | | 7.7.1 BY TYPE, 2025-2035 (USD Billion)
      20. | | 7.7.2 BY APPLICATION, 2025-2035 (USD Billion)
      21. | 7.8 France MARKET SIZE ESTIMATES; FORECAST
      22. | | 7.8.1 BY TYPE, 2025-2035 (USD Billion)
      23. | | 7.8.2 BY APPLICATION, 2025-2035 (USD Billion)
      24. | 7.9 Russia MARKET SIZE ESTIMATES; FORECAST
      25. | | 7.9.1 BY TYPE, 2025-2035 (USD Billion)
      26. | | 7.9.2 BY APPLICATION, 2025-2035 (USD Billion)
      27. | 7.10 Italy MARKET SIZE ESTIMATES; FORECAST
      28. | | 7.10.1 BY TYPE, 2025-2035 (USD Billion)
      29. | | 7.10.2 BY APPLICATION, 2025-2035 (USD Billion)
      30. | 7.11 Spain MARKET SIZE ESTIMATES; FORECAST
      31. | | 7.11.1 BY TYPE, 2025-2035 (USD Billion)
      32. | | 7.11.2 BY APPLICATION, 2025-2035 (USD Billion)
      33. | 7.12 Rest of Europe MARKET SIZE ESTIMATES; FORECAST
      34. | | 7.12.1 BY TYPE, 2025-2035 (USD Billion)
      35. | | 7.12.2 BY APPLICATION, 2025-2035 (USD Billion)
      36. | 7.13 APAC MARKET SIZE ESTIMATES; FORECAST
      37. | | 7.13.1 BY TYPE, 2025-2035 (USD Billion)
      38. | | 7.13.2 BY APPLICATION, 2025-2035 (USD Billion)
      39. | 7.14 China MARKET SIZE ESTIMATES; FORECAST
      40. | | 7.14.1 BY TYPE, 2025-2035 (USD Billion)
      41. | | 7.14.2 BY APPLICATION, 2025-2035 (USD Billion)
      42. | 7.15 India MARKET SIZE ESTIMATES; FORECAST
      43. | | 7.15.1 BY TYPE, 2025-2035 (USD Billion)
      44. | | 7.15.2 BY APPLICATION, 2025-2035 (USD Billion)
      45. | 7.16 Japan MARKET SIZE ESTIMATES; FORECAST
      46. | | 7.16.1 BY TYPE, 2025-2035 (USD Billion)
      47. | | 7.16.2 BY APPLICATION, 2025-2035 (USD Billion)
      48. | 7.17 South Korea MARKET SIZE ESTIMATES; FORECAST
      49. | | 7.17.1 BY TYPE, 2025-2035 (USD Billion)
      50. | | 7.17.2 BY APPLICATION, 2025-2035 (USD Billion)
      51. | 7.18 Malaysia MARKET SIZE ESTIMATES; FORECAST
      52. | | 7.18.1 BY TYPE, 2025-2035 (USD Billion)
      53. | | 7.18.2 BY APPLICATION, 2025-2035 (USD Billion)
      54. | 7.19 Thailand MARKET SIZE ESTIMATES; FORECAST
      55. | | 7.19.1 BY TYPE, 2025-2035 (USD Billion)
      56. | | 7.19.2 BY APPLICATION, 2025-2035 (USD Billion)
      57. | 7.20 Indonesia MARKET SIZE ESTIMATES; FORECAST
      58. | | 7.20.1 BY TYPE, 2025-2035 (USD Billion)
      59. | | 7.20.2 BY APPLICATION, 2025-2035 (USD Billion)
      60. | 7.21 Rest of APAC MARKET SIZE ESTIMATES; FORECAST
      61. | | 7.21.1 BY TYPE, 2025-2035 (USD Billion)
      62. | | 7.21.2 BY APPLICATION, 2025-2035 (USD Billion)
      63. | 7.22 South America MARKET SIZE ESTIMATES; FORECAST
      64. | | 7.22.1 BY TYPE, 2025-2035 (USD Billion)
      65. | | 7.22.2 BY APPLICATION, 2025-2035 (USD Billion)
      66. | 7.23 Brazil MARKET SIZE ESTIMATES; FORECAST
      67. | | 7.23.1 BY TYPE, 2025-2035 (USD Billion)
      68. | | 7.23.2 BY APPLICATION, 2025-2035 (USD Billion)
      69. | 7.24 Mexico MARKET SIZE ESTIMATES; FORECAST
      70. | | 7.24.1 BY TYPE, 2025-2035 (USD Billion)
      71. | | 7.24.2 BY APPLICATION, 2025-2035 (USD Billion)
      72. | 7.25 Argentina MARKET SIZE ESTIMATES; FORECAST
      73. | | 7.25.1 BY TYPE, 2025-2035 (USD Billion)
      74. | | 7.25.2 BY APPLICATION, 2025-2035 (USD Billion)
      75. | 7.26 Rest of South America MARKET SIZE ESTIMATES; FORECAST
      76. | | 7.26.1 BY TYPE, 2025-2035 (USD Billion)
      77. | | 7.26.2 BY APPLICATION, 2025-2035 (USD Billion)
      78. | 7.27 MEA MARKET SIZE ESTIMATES; FORECAST
      79. | | 7.27.1 BY TYPE, 2025-2035 (USD Billion)
      80. | | 7.27.2 BY APPLICATION, 2025-2035 (USD Billion)
      81. | 7.28 GCC Countries MARKET SIZE ESTIMATES; FORECAST
      82. | | 7.28.1 BY TYPE, 2025-2035 (USD Billion)
      83. | | 7.28.2 BY APPLICATION, 2025-2035 (USD Billion)
      84. | 7.29 South Africa MARKET SIZE ESTIMATES; FORECAST
      85. | | 7.29.1 BY TYPE, 2025-2035 (USD Billion)
      86. | | 7.29.2 BY APPLICATION, 2025-2035 (USD Billion)
      87. | 7.30 Rest of MEA MARKET SIZE ESTIMATES; FORECAST
      88. | | 7.30.1 BY TYPE, 2025-2035 (USD Billion)
      89. | | 7.30.2 BY APPLICATION, 2025-2035 (USD Billion)
      90. | 7.31 PRODUCT LAUNCH/PRODUCT DEVELOPMENT/APPROVAL
      91. | | 7.31.1
      92. | 7.32 ACQUISITION/PARTNERSHIP
      93. | | 7.32.1

    UK Processed Eggs Market Segmentation

    Market Segmentation Overview

    • Detailed segmentation data will be available in the full report
    • Comprehensive analysis by multiple parameters
    • Regional and country-level breakdowns
    • Market size forecasts by segment
    Infographic

    Free Sample Request

    Kindly complete the form below to receive a free sample of this Report

    Get Free Sample

    Customer Strories

    “I am very pleased with how market segments have been defined in a relevant way for my purposes (such as "Portable Freezers & refrigerators" and "last-mile"). In general the report is well structured. Thanks very much for your efforts.”

    Victoria Milne

    Founder
    Case Study
    Chemicals and Materials

    Compare Licence

    ×
    Features License Type
    Single User Multiuser License Enterprise User
    Price $4,950 $5,950 $7,250
    Maximum User Access Limit 1 User Upto 10 Users Unrestricted Access Throughout the Organization
    Free Customization
    Direct Access to Analyst
    Deliverable Format
    Platform Access
    Discount on Next Purchase 10% 15% 15%
    Printable Versions