• Cat-intel
  • MedIntelliX
  • Resources
  • About Us
  • Hero Background
    English
    Chinese
    French
    Japanese
    Korean
    German
    Spanish

    Turpentine Market Analysis

    ID: MRFR/CnM/17347-HCR
    128 Pages
    Anshula Mandaokar
    October 2025

    Turpentine Market Research Report Information By Application (Cosmetics, Fragrance, Food, Paints & Coatings and Others), And By Region (North America, Europe, Asia-Pacific, And Rest Of The World) –Market Forecast Till 2035

    Share:
    Download PDF ×

    We do not share your information with anyone. However, we may send you emails based on your report interest from time to time. You may contact us at any time to opt-out.

    Turpentine Market Infographic
    Purchase Options

    Market Analysis

    In-depth Analysis of Turpentine Market Industry Landscape

    The turpentine market is subject to various dynamics that shape its demand, supply, and overall growth trajectory. Market dynamics in this industry are influenced by factors such as changes in raw material availability, technological advancements, evolving end-user preferences, regulatory policies, and competitive pressures. Turpentine, derived primarily from pine trees, is widely used in various applications such as paints, varnishes, adhesives, fragrances, and solvents, making its market dynamics closely tied to the performance of these industries.

    One of the primary drivers of market dynamics in the turpentine industry is the availability and pricing of raw materials, particularly pine resin. Turpentine production heavily relies on the extraction of resin from pine trees, which can be affected by factors such as weather conditions, disease outbreaks, and forestry management practices. Any disruptions in the supply of pine resin can lead to fluctuations in turpentine production, impacting market prices and supply chain stability. Moreover, increasing demand for sustainable and environmentally friendly sourcing practices has prompted companies to explore alternative sources of raw materials, such as plantation-grown pine trees, to mitigate supply risks and meet consumer expectations.

    Technological advancements also play a significant role in shaping the dynamics of the turpentine market. Innovations in extraction methods, purification processes, and product formulation have led to improvements in product quality, efficiency, and cost-effectiveness. For example, the development of advanced distillation techniques and solvent recovery systems has enabled manufacturers to enhance the yield and purity of turpentine while reducing energy consumption and waste generation. Additionally, the emergence of biorefinery technologies has opened up new opportunities for the utilization of pine biomass to produce a wide range of value-added products, including bio-based chemicals and renewable fuels, thereby diversifying the revenue streams of industry players and driving market growth.

    Furthermore, regulatory policies and standards have a significant impact on the dynamics of the turpentine market. Environmental regulations aimed at reducing emissions, promoting sustainable forestry practices, and ensuring worker safety can influence production processes, product labeling, and market access. Compliance with these regulations is not only essential for maintaining legal and ethical standards but also for safeguarding the reputation and market competitiveness of companies operating in the turpentine industry. Moreover, government initiatives and incentives to promote the use of bio-based materials and support the development of renewable energy sources can create opportunities for market expansion and innovation in the turpentine sector.

    Market dynamics in the turpentine industry are also influenced by changing consumer preferences and market trends. Increasing awareness of environmental issues, health concerns, and the shift towards eco-friendly and natural products have led to growing demand for bio-based solvents and renewable chemicals derived from sustainable sources such as pine trees. Manufacturers are responding to these trends by introducing eco-friendly turpentine formulations, promoting sustainable sourcing practices, and emphasizing the environmental benefits of their products to attract environmentally conscious consumers and gain a competitive edge in the market.

    Moreover, competitive pressures and market consolidation are shaping the dynamics of the turpentine industry. The market is characterized by the presence of numerous small and large players competing for market share through product differentiation, pricing strategies, and market expansion efforts. Mergers, acquisitions, and strategic partnerships are common in the industry as companies seek to strengthen their market position, enhance their product portfolios, and achieve economies of scale. Additionally, globalization and international trade play a significant role in the turpentine market, with companies expanding their operations across regions to access new markets, resources, and growth opportunities.

    Author
    Anshula Mandaokar
    Team Lead - Research

    Anshula Mandaokar holds an academic degree in Chemical Engineering and has been contributing to the field for more than 5 years. She has expertise in Market Research and Business Consulting and serves as a Team Lead for a reputed Market Research firm under the Chemicals and Materials domain spectrum. She has worked on multiple projects, generating explicit results in a quick turnaround time. Her understanding of data interpretation justifies her role as a leader.

    Leave a Comment

    FAQs

    How much is the Turpentine market?

    The Turpentine market size was valued at USD 0.68 Billion in 2024.

    What is the growth rate of the Turpentine market?

    Turpentine Market is projected to register a CAGR of 5.6% from 2025-2035

    Which region held the largest market share in the Turpentine market?

    North America had the largest share in the market

    Who are the key players in the Turpentine market?

    The key players in the market are Dujodwala Resins and Terpenes Limited, Arakawa Chemical Industries, Ltd., Mentha & Allied Products Pvt. Ltd., Lawter Inc., Harting SpA, International Flavors & Fragrances Inc. (IFF), Symrise AG, DRT (Dérivés Résiniques et Terpéniques), Georgia-Pacific Chemicals LLC and Kraton Corporation Company.

    Which application led the Turpentine market?

    The cosmetics category dominated the market in 2024.

    Market Summary

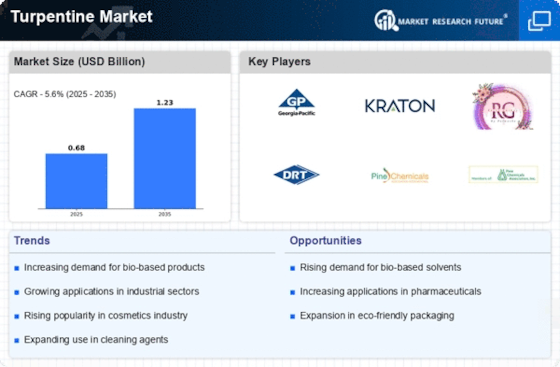
    The Global Turpentine Market is projected to grow from 0.68 USD Billion in 2024 to 1.23 USD Billion by 2035, reflecting a robust growth trajectory.

    Key Market Trends & Highlights

    Turpentine Key Trends and Highlights

    • The market is expected to witness a compound annual growth rate (CAGR) of 5.58% from 2025 to 2035.
    • By 2035, the market valuation is anticipated to reach 1.24 USD Billion, indicating a substantial increase from the base year.
    • in 2024, the market is valued at 0.68 USD Billion, laying the foundation for future growth.
    • Growing adoption of natural solvents due to increasing environmental regulations is a major market driver.

    Market Size & Forecast

    2024 Market Size 0.68 (USD Billion)
    2035 Market Size 1.23 (USD Billion)
    CAGR (2025-2035) 5.60%
    Largest Regional Market Share in 2024 latin_america)

    Major Players

    Dujodwala Resins and Terpenes Limited, Arakawa Chemical Industries, Ltd., Mentha & Allied Products Pvt. Ltd., Lawter Inc., Harting SpA, International Flavors & Fragrances Inc. (IFF), Symrise AG, DRT (Dérivés Résiniques et Terpéniques), Georgia-Pacific Chemicals LLC, Kraton Corporation

    Market Trends

    Growing demand in paints is driving the market growth

    The growing demand in end-use industries, such as paints, coatings, adhesives, and fragrances, is a primary driver for the Turpentine market. Turpentine, derived from pine trees, serves as a crucial ingredient in these applications, contributing to the formulation of various products. The expansion of construction, automotive, and other manufacturing sectors globally amplifies the need for Turpentine in adhesives, coatings, and sealants. Additionally, the natural and renewable characteristics of Turpentine align with the increasing preference for sustainable and bio-based raw materials in manufacturing processes.

    As a result, the rising demand for end-products across diverse industries significantly propels the growth of the Turpentine market.

    Research and development (R&D) for new applications play a pivotal role in driving the Turpentine market. Ongoing exploration of innovative uses, such as biofuels, pharmaceuticals, and flavoring agents, expands the market beyond traditional applications. Turpentine's natural and renewable attributes make it an attractive candidate for diverse industries seeking sustainable alternatives. The emphasis on R&D fosters product diversification and opens avenues for Turpentine in emerging sectors. This proactive approach not only broadens the market scope but also addresses evolving consumer preferences for eco-friendly and bio-based solutions.

    market dynamics are instrumental in propelling the Turpentine market, especially with a focus on new applications. Turpentine, derived from pine trees, has witnessed increased demand worldwide due to its diverse applications. The globalization of industries and the interconnectedness of economies contribute to the expansion of the Turpentine market. As emerging economies experience industrial growth and established markets adapt to changing consumer preferences, the demand for Turpentine in various applications continues to rise.

    The global turpentine market appears to be experiencing a resurgence, driven by increasing demand in the paint and coatings industry, alongside a growing interest in natural and sustainable products.

    U.S. Department of Agriculture

    Turpentine Market Market Drivers

    Rising Demand for Natural Solvents

    The Global Turpentine Market Industry experiences a notable increase in demand for natural solvents, driven by the growing preference for eco-friendly products. Industries such as paints, coatings, and adhesives are increasingly adopting turpentine due to its biodegradable properties. This shift towards sustainable alternatives is projected to elevate the market's value to 0.68 USD Billion in 2024. As consumers and manufacturers alike prioritize environmental considerations, the adoption of turpentine as a natural solvent is likely to expand, fostering growth in the Global Turpentine Market Industry.

    Expansion of the Paints and Coatings Sector

    The Global Turpentine Market Industry benefits from the expansion of the paints and coatings sector, which is anticipated to witness substantial growth in the coming years. Turpentine serves as a key ingredient in the formulation of various paints and coatings, enhancing their performance and drying properties. With the market projected to reach 1.24 USD Billion by 2035, the increasing construction activities and rising demand for decorative paints are likely to drive the consumption of turpentine. This trend underscores the importance of the paints and coatings industry in shaping the future of the Global Turpentine Market Industry.

    Growth in the Fragrance and Flavor Industry

    The Global Turpentine Market Industry is significantly influenced by the growth in the fragrance and flavor industry, where turpentine is utilized as a key raw material. The increasing consumer inclination towards natural and organic products is propelling the demand for turpentine in the production of perfumes and flavorings. As the market evolves, the fragrance and flavor sector is expected to contribute to the overall growth of the Global Turpentine Market Industry, with a projected CAGR of 5.58% from 2025 to 2035. This trend indicates a robust future for turpentine in these applications.

    Regulatory Support for Sustainable Products

    Regulatory support for sustainable products is becoming increasingly prominent, positively impacting the Global Turpentine Market Industry. Governments worldwide are implementing policies that encourage the use of renewable resources and environmentally friendly materials. This regulatory landscape is likely to bolster the demand for turpentine, as it aligns with global sustainability goals. As such, the market may witness a favorable shift, with an increasing number of industries adopting turpentine as a viable alternative to synthetic chemicals, thereby enhancing its market presence.

    Technological Advancements in Extraction Processes

    Technological advancements in the extraction processes of turpentine are poised to enhance the efficiency and yield of production. Innovations in distillation and separation techniques are likely to reduce costs and improve the quality of turpentine, making it more competitive in the market. These advancements could potentially lead to increased production capacities, thereby supporting the growth of the Global Turpentine Market Industry. As manufacturers adopt these technologies, the overall market dynamics may shift, fostering a more favorable environment for turpentine.

    Market Segment Insights

    Turpentine Application Insights

    The Turpentine market segmentation, based on application includes Cosmetics, Fragrance, Food, Paints & Coatings and Others. The Cosmetics segment dominated the market, accounting for 25% of market revenue due to its increased utilization in fragrance formulations. Turpentine serves as a natural solvent and carrier in the production of perfumes and fragrances. The rising demand for natural and sustainable ingredients in cosmetic products has led to the growing popularity of Turpentine as a key component in the fragrance industry.

    Figure 1: Turpentine Market, by Application, 2022 & 2032 (USD Billion)Source: Secondary Research, Primary Research, Market Research Future Database and Analyst Review

    Get more detailed insights about Turpentine Market Research Report - Global Forecast 2035

    Regional Insights

    By region, the study provides the market insights into North America, Europe, Asia-Pacific and Rest of the World. North America has captured the largest market share in the Turpentine industry due to several factors. The region exhibits significant demand for Turpentine, driven by the thriving construction, paints and coatings, and adhesive industries. Additionally, the presence of key market players, well-established infrastructure, and a robust industrial sector contribute to the dominance of North America in the Turpentine market.

    The region's emphasis on sustainable and bio-based products further supports the demand for Turpentine, solidifying its position as a key market player in North America.

    Further, the major countries studied in the market report are The US, Canada, German, France, the UK, Italy, Spain, China, Japan, India, Australia, South Korea, and Brazil.

    Figure 2: TURPENTINE MARKET SHARE BY REGION 2022 (USD Billion)TURPENTINE MARKET SHARE BY REGION 2022Source: Secondary Research, Primary Research, Market Research Future Database and Analyst Review

    Europe Turpentine market accounts for the second-largest market share due to , the focus on bio-based products aligns with the natural and renewable characteristics of Turpentine. Europe has secured the second-largest market share in the Turpentine industry due to its thriving chemical and coatings sector. The region's well-established industrial infrastructure, stringent environmental regulations promoting the use of eco-friendly raw materials, and the growing demand for sustainable solutions contribute to the increased adoption of Turpentine. Additionally, the focus on bio-based products aligns with the natural and renewable characteristics of Turpentine, bolstering its prominence in various applications.

    Europe's commitment to eco-friendly practices and the versatility of Turpentine contribute to its position as a key player in the Turpentine market.

    Further, the German Turpentine market held the largest market share, and the UK Turpentine market was the fastest growing market in the European region

    The Asia-Pacific Turpentine Market is expected to grow at the fastest CAGR from 2023 to 2032. This is due to along with the rise in consumer awareness of sustainable products. The Asia Pacific region is experiencing the highest Compound Annual Growth Rate (CAGR) in the Turpentine market due to expanding industrialization, a burgeoning population, and increased demand for Turpentine in various applications. The region's growing construction, paints and coatings, and adhesives industries, along with the rise in consumer awareness of sustainable products, contribute to the surging demand for Turpentine.

    Additionally, the economic development and infrastructure projects in countries within the Asia Pacific further drive the market's growth, leading to the highest CAGR in the Turpentine industry.

    Moreover, China’s Turpentine market held the largest market share, and the Indian Turpentine market was the fastest growing market in the Asia-Pacific region.

    Key Players and Competitive Insights

    Leading players in the Turpentine market are actively engaged in strategic initiatives to strengthen their market positions. This includes investments in research and development for new applications, product innovation, and other market developments. Companies are focusing on expanding their geographical presence, forming partnerships, and mergers to enhance their market reach. The competitive landscape is characterized by a commitment to environmental sustainability, product diversification, and addressing evolving consumer preferences for bio-based and eco-friendly solutions, contributing to the overall growth and competitiveness in the Turpentine market.

    Manufacturing locally to minimize operational costs is one of the key business tactics used by manufacturers in the Turpentine industry to benefit clients and increase the market sector. In recent years, the Turpentine industry has offered some of the most significant advantages to cosmetics. Major players in the Turpentine market, including Dujodwala Resins and Terpenes Limited, Arakawa Chemical Industries, Ltd., Mentha & Allied Products Pvt.

    Ltd., Lawter Inc., Harting SpA, International Flavors & Fragrances Inc. (IFF), Symrise AG, DRT (Dérivés Résiniques et Terpéniques), Georgia-Pacific Chemicals LLC and Kraton Corporation and others, are attempting to increase market demand by investing in research and development operations.

    Kraton Corporation is a key player in the Turpentine market, recognized for its innovative solutions in specialty chemicals. Leveraging a diverse portfolio, Kraton produces high-quality Turpentine derivatives for applications in adhesives, coatings, and fragrance formulations. The company's commitment to sustainability and bio-based solutions aligns with the evolving preferences of industries seeking eco-friendly raw materials. Kraton Corporation's business strategy emphasizes research and development, fostering continuous innovation in the Turpentine market.

    With a presence and a focus on meeting the diverse needs of its customers, Kraton remains a prominent contributor to the growth and development of the Turpentine industry, catering to various sectors through its advanced chemical solutions.

    Mentha & Allied Products Pvt. Ltd. holds a significant position in the Turpentine market, specializing in the production of Turpentine and its derivatives. Renowned for its expertise in mint and pine-based products, the company plays a key role in the fragrance, flavor, and chemical industries. With a commitment to quality, sustainability, and innovation, Mentha & Allied Products Pvt. Ltd. has established itself as a reliable supplier of Turpentine, catering to diverse applications such as adhesives, paints, and coatings.

    The company's customer-centric approach, combined with a presence, positions it as a leading player contributing to the growth and dynamics of the Turpentine market.

    Key Companies in the Turpentine Market market include

    Industry Developments

    May 2022: Weyerhaeuser Company successfully concluded the purchase of 80,800 acres of premium timberlands, featuring diverse pine trees in North and South Carolina. The acquisition, valued at approximately USD 265 million, was facilitated through collaboration with a fund managed by Campbell Global.

    May 2022: Kraton Corporation, a prominent producer of sustainable biobased products sourced from pine wood pulping co-products, has partnered with Tree-Nation for a collaborative initiative. The joint effort aims to plant thousands of pine trees throughout 2022, underscoring Kraton's ongoing commitment to sustainability, environmental responsibility, and the mitigation of its carbon footprint.

    Future Outlook

    Turpentine Market Future Outlook

    The Global Turpentine Market is projected to grow at a 5.60% CAGR from 2025 to 2035, driven by increasing demand in the fragrance and paint industries.

    New opportunities lie in:

    • Develop eco-friendly turpentine products to meet sustainability demands.
    • Expand distribution channels in emerging markets for increased reach.
    • Invest in R&D for innovative applications in pharmaceuticals and cosmetics.

    By 2035, the Turpentine Market is expected to achieve substantial growth, reflecting evolving consumer preferences and industrial applications.

    Market Segmentation

    Turpentine Regional Outlook

    North America
    • US
    • Canada

    Turpentine Application Outlook

    • Cosmetics
    • Fragrance
    • Food
    • Paints
    • Coatings
    • Others

    Report Scope

    Report Attribute/Metric Details 
    Market Size 2024 USD 0.68 Billion
    Market Size 2025 USD 0.71 Billion
    Market Size 2035 1.23 (Value (USD Billion))
    Compound Annual Growth Rate (CAGR) 5.60% (2025 - 2035)
    Base Year 2024
    Market Forecast Period 2025 - 2035
    Historical Data 2020- 2024
    Market Forecast Units Value (USD Billion)
    Report Coverage Revenue Forecast, Market Competitive Landscape, Growth Factors, and Trends
    Segments Covered Application, and Region
    Geographies Covered North America, Europe, Asia Pacific, and the Rest of the World
    Countries Covered The US, Canada, German, France, UK, Italy, Spain, China, Japan, India, Australia, South Korea, and Brazil
    Key Companies Profiled Dujodwala Resins and Terpenes Limited, Arakawa Chemical Industries, Ltd., Mentha & Allied Products Pvt. Ltd., Lawter Inc., Harting SpA, International Flavors & Fragrances Inc. (IFF), Symrise AG, DRT (Dérivés Résiniques et Terpéniques), Georgia-Pacific Chemicals LLC and Kraton Corporation
    Key Market Opportunities Growing demand in paints industry
    Key Market Dynamics Increase demand in end-use industries

    FAQs

    How much is the Turpentine market?

    The Turpentine market size was valued at USD 0.68 Billion in 2024.

    What is the growth rate of the Turpentine market?

    Turpentine Market is projected to register a CAGR of 5.6% from 2025-2035

    Which region held the largest market share in the Turpentine market?

    North America had the largest share in the market

    Who are the key players in the Turpentine market?

    The key players in the market are Dujodwala Resins and Terpenes Limited, Arakawa Chemical Industries, Ltd., Mentha & Allied Products Pvt. Ltd., Lawter Inc., Harting SpA, International Flavors & Fragrances Inc. (IFF), Symrise AG, DRT (Dérivés Résiniques et Terpéniques), Georgia-Pacific Chemicals LLC and Kraton Corporation Company.

    Which application led the Turpentine market?

    The cosmetics category dominated the market in 2024.

    1. SECTION I: EXECUTIVE SUMMARY AND KEY HIGHLIGHTS
      1. | 1.1 EXECUTIVE SUMMARY
      2. | | 1.1.1 Market Overview
      3. | | 1.1.2 Key Findings
      4. | | 1.1.3 Market Segmentation
      5. | | 1.1.4 Competitive Landscape
      6. | | 1.1.5 Challenges and Opportunities
      7. | | 1.1.6 Future Outlook
    2. SECTION II: SCOPING, METHODOLOGY AND MARKET STRUCTURE
      1. | 2.1 MARKET INTRODUCTION
      2. | | 2.1.1 Definition
      3. | | 2.1.2 Scope of the study
      4. | | | 2.1.2.1 Research Objective
      5. | | | 2.1.2.2 Assumption
      6. | | | 2.1.2.3 Limitations
      7. | 2.2 RESEARCH METHODOLOGY
      8. | | 2.2.1 Overview
      9. | | 2.2.2 Data Mining
      10. | | 2.2.3 Secondary Research
      11. | | 2.2.4 Primary Research
      12. | | | 2.2.4.1 Primary Interviews and Information Gathering Process
      13. | | | 2.2.4.2 Breakdown of Primary Respondents
      14. | | 2.2.5 Forecasting Model
      15. | | 2.2.6 Market Size Estimation
      16. | | | 2.2.6.1 Bottom-Up Approach
      17. | | | 2.2.6.2 Top-Down Approach
      18. | | 2.2.7 Data Triangulation
      19. | | 2.2.8 Validation
    3. SECTION III: QUALITATIVE ANALYSIS
      1. | 3.1 MARKET DYNAMICS
      2. | | 3.1.1 Overview
      3. | | 3.1.2 Drivers
      4. | | 3.1.3 Restraints
      5. | | 3.1.4 Opportunities
      6. | 3.2 MARKET FACTOR ANALYSIS
      7. | | 3.2.1 Value chain Analysis
      8. | | 3.2.2 Porter's Five Forces Analysis
      9. | | | 3.2.2.1 Bargaining Power of Suppliers
      10. | | | 3.2.2.2 Bargaining Power of Buyers
      11. | | | 3.2.2.3 Threat of New Entrants
      12. | | | 3.2.2.4 Threat of Substitutes
      13. | | | 3.2.2.5 Intensity of Rivalry
      14. | | 3.2.3 COVID-19 Impact Analysis
      15. | | | 3.2.3.1 Market Impact Analysis
      16. | | | 3.2.3.2 Regional Impact
      17. | | | 3.2.3.3 Opportunity and Threat Analysis
    4. SECTION IV: QUANTITATIVE ANALYSIS
      1. | 4.1 Chemicals and Materials, BY Application (USD Billion)
      2. | | 4.1.1 Cosmetics
      3. | | 4.1.2 Fragrance
      4. | | 4.1.3 Food
      5. | | 4.1.4 Paints & Coatings
      6. | | 4.1.5 Others
      7. | 4.2 Chemicals and Materials, BY Region (USD Billion)
      8. | | 4.2.1 North America
      9. | | | 4.2.1.1 US
      10. | | | 4.2.1.2 Canada
      11. | | 4.2.2 Europe
      12. | | | 4.2.2.1 Germany
      13. | | | 4.2.2.2 UK
      14. | | | 4.2.2.3 France
      15. | | | 4.2.2.4 Russia
      16. | | | 4.2.2.5 Italy
      17. | | | 4.2.2.6 Spain
      18. | | | 4.2.2.7 Rest of Europe
      19. | | 4.2.3 APAC
      20. | | | 4.2.3.1 China
      21. | | | 4.2.3.2 India
      22. | | | 4.2.3.3 Japan
      23. | | | 4.2.3.4 South Korea
      24. | | | 4.2.3.5 Malaysia
      25. | | | 4.2.3.6 Thailand
      26. | | | 4.2.3.7 Indonesia
      27. | | | 4.2.3.8 Rest of APAC
      28. | | 4.2.4 South America
      29. | | | 4.2.4.1 Brazil
      30. | | | 4.2.4.2 Mexico
      31. | | | 4.2.4.3 Argentina
      32. | | | 4.2.4.4 Rest of South America
      33. | | 4.2.5 MEA
      34. | | | 4.2.5.1 GCC Countries
      35. | | | 4.2.5.2 South Africa
      36. | | | 4.2.5.3 Rest of MEA
    5. SECTION V: COMPETITIVE ANALYSIS
      1. | 5.1 Competitive Landscape
      2. | | 5.1.1 Overview
      3. | | 5.1.2 Competitive Analysis
      4. | | 5.1.3 Market share Analysis
      5. | | 5.1.4 Major Growth Strategy in the Chemicals and Materials
      6. | | 5.1.5 Competitive Benchmarking
      7. | | 5.1.6 Leading Players in Terms of Number of Developments in the Chemicals and Materials
      8. | | 5.1.7 Key developments and growth strategies
      9. | | | 5.1.7.1 New Product Launch/Service Deployment
      10. | | | 5.1.7.2 Merger & Acquisitions
      11. | | | 5.1.7.3 Joint Ventures
      12. | | 5.1.8 Major Players Financial Matrix
      13. | | | 5.1.8.1 Sales and Operating Income
      14. | | | 5.1.8.2 Major Players R&D Expenditure. 2023
      15. | 5.2 Company Profiles
      16. | | 5.2.1 Georgia-Pacific LLC (US)
      17. | | | 5.2.1.1 Financial Overview
      18. | | | 5.2.1.2 Products Offered
      19. | | | 5.2.1.3 Key Developments
      20. | | | 5.2.1.4 SWOT Analysis
      21. | | | 5.2.1.5 Key Strategies
      22. | | 5.2.2 Kraton Corporation (US)
      23. | | | 5.2.2.1 Financial Overview
      24. | | | 5.2.2.2 Products Offered
      25. | | | 5.2.2.3 Key Developments
      26. | | | 5.2.2.4 SWOT Analysis
      27. | | | 5.2.2.5 Key Strategies
      28. | | 5.2.3 Resin & Pitch (US)
      29. | | | 5.2.3.1 Financial Overview
      30. | | | 5.2.3.2 Products Offered
      31. | | | 5.2.3.3 Key Developments
      32. | | | 5.2.3.4 SWOT Analysis
      33. | | | 5.2.3.5 Key Strategies
      34. | | 5.2.4 DRT (FR)
      35. | | | 5.2.4.1 Financial Overview
      36. | | | 5.2.4.2 Products Offered
      37. | | | 5.2.4.3 Key Developments
      38. | | | 5.2.4.4 SWOT Analysis
      39. | | | 5.2.4.5 Key Strategies
      40. | | 5.2.5 Wuzhou Pine Chemicals (CN)
      41. | | | 5.2.5.1 Financial Overview
      42. | | | 5.2.5.2 Products Offered
      43. | | | 5.2.5.3 Key Developments
      44. | | | 5.2.5.4 SWOT Analysis
      45. | | | 5.2.5.5 Key Strategies
      46. | | 5.2.6 Sundar Chemicals (IN)
      47. | | | 5.2.6.1 Financial Overview
      48. | | | 5.2.6.2 Products Offered
      49. | | | 5.2.6.3 Key Developments
      50. | | | 5.2.6.4 SWOT Analysis
      51. | | | 5.2.6.5 Key Strategies
      52. | | 5.2.7 Pine Chemical Group (US)
      53. | | | 5.2.7.1 Financial Overview
      54. | | | 5.2.7.2 Products Offered
      55. | | | 5.2.7.3 Key Developments
      56. | | | 5.2.7.4 SWOT Analysis
      57. | | | 5.2.7.5 Key Strategies
      58. | | 5.2.8 Eastman Chemical Company (US)
      59. | | | 5.2.8.1 Financial Overview
      60. | | | 5.2.8.2 Products Offered
      61. | | | 5.2.8.3 Key Developments
      62. | | | 5.2.8.4 SWOT Analysis
      63. | | | 5.2.8.5 Key Strategies
      64. | | 5.2.9 Forestar Group (US)
      65. | | | 5.2.9.1 Financial Overview
      66. | | | 5.2.9.2 Products Offered
      67. | | | 5.2.9.3 Key Developments
      68. | | | 5.2.9.4 SWOT Analysis
      69. | | | 5.2.9.5 Key Strategies
      70. | 5.3 Appendix
      71. | | 5.3.1 References
      72. | | 5.3.2 Related Reports
    6. LIST OF FIGURES
      1. | 6.1 MARKET SYNOPSIS
      2. | 6.2 NORTH AMERICA MARKET ANALYSIS
      3. | 6.3 US MARKET ANALYSIS BY APPLICATION
      4. | 6.4 CANADA MARKET ANALYSIS BY APPLICATION
      5. | 6.5 EUROPE MARKET ANALYSIS
      6. | 6.6 GERMANY MARKET ANALYSIS BY APPLICATION
      7. | 6.7 UK MARKET ANALYSIS BY APPLICATION
      8. | 6.8 FRANCE MARKET ANALYSIS BY APPLICATION
      9. | 6.9 RUSSIA MARKET ANALYSIS BY APPLICATION
      10. | 6.10 ITALY MARKET ANALYSIS BY APPLICATION
      11. | 6.11 SPAIN MARKET ANALYSIS BY APPLICATION
      12. | 6.12 REST OF EUROPE MARKET ANALYSIS BY APPLICATION
      13. | 6.13 APAC MARKET ANALYSIS
      14. | 6.14 CHINA MARKET ANALYSIS BY APPLICATION
      15. | 6.15 INDIA MARKET ANALYSIS BY APPLICATION
      16. | 6.16 JAPAN MARKET ANALYSIS BY APPLICATION
      17. | 6.17 SOUTH KOREA MARKET ANALYSIS BY APPLICATION
      18. | 6.18 MALAYSIA MARKET ANALYSIS BY APPLICATION
      19. | 6.19 THAILAND MARKET ANALYSIS BY APPLICATION
      20. | 6.20 INDONESIA MARKET ANALYSIS BY APPLICATION
      21. | 6.21 REST OF APAC MARKET ANALYSIS BY APPLICATION
      22. | 6.22 SOUTH AMERICA MARKET ANALYSIS
      23. | 6.23 BRAZIL MARKET ANALYSIS BY APPLICATION
      24. | 6.24 MEXICO MARKET ANALYSIS BY APPLICATION
      25. | 6.25 ARGENTINA MARKET ANALYSIS BY APPLICATION
      26. | 6.26 REST OF SOUTH AMERICA MARKET ANALYSIS BY APPLICATION
      27. | 6.27 MEA MARKET ANALYSIS
      28. | 6.28 GCC COUNTRIES MARKET ANALYSIS BY APPLICATION
      29. | 6.29 SOUTH AFRICA MARKET ANALYSIS BY APPLICATION
      30. | 6.30 REST OF MEA MARKET ANALYSIS BY APPLICATION
      31. | 6.31 KEY BUYING CRITERIA OF CHEMICALS AND MATERIALS
      32. | 6.32 RESEARCH PROCESS OF MRFR
      33. | 6.33 DRO ANALYSIS OF CHEMICALS AND MATERIALS
      34. | 6.34 DRIVERS IMPACT ANALYSIS: CHEMICALS AND MATERIALS
      35. | 6.35 RESTRAINTS IMPACT ANALYSIS: CHEMICALS AND MATERIALS
      36. | 6.36 SUPPLY / VALUE CHAIN: CHEMICALS AND MATERIALS
      37. | 6.37 CHEMICALS AND MATERIALS, BY APPLICATION, 2024 (% SHARE)
      38. | 6.38 CHEMICALS AND MATERIALS, BY APPLICATION, 2024 TO 2035 (USD Billion)
      39. | 6.39 BENCHMARKING OF MAJOR COMPETITORS
    7. LIST OF TABLES
      1. | 7.1 LIST OF ASSUMPTIONS
      2. | | 7.1.1
      3. | 7.2 North America MARKET SIZE ESTIMATES; FORECAST
      4. | | 7.2.1 BY APPLICATION, 2025-2035 (USD Billion)
      5. | 7.3 US MARKET SIZE ESTIMATES; FORECAST
      6. | | 7.3.1 BY APPLICATION, 2025-2035 (USD Billion)
      7. | 7.4 Canada MARKET SIZE ESTIMATES; FORECAST
      8. | | 7.4.1 BY APPLICATION, 2025-2035 (USD Billion)
      9. | 7.5 Europe MARKET SIZE ESTIMATES; FORECAST
      10. | | 7.5.1 BY APPLICATION, 2025-2035 (USD Billion)
      11. | 7.6 Germany MARKET SIZE ESTIMATES; FORECAST
      12. | | 7.6.1 BY APPLICATION, 2025-2035 (USD Billion)
      13. | 7.7 UK MARKET SIZE ESTIMATES; FORECAST
      14. | | 7.7.1 BY APPLICATION, 2025-2035 (USD Billion)
      15. | 7.8 France MARKET SIZE ESTIMATES; FORECAST
      16. | | 7.8.1 BY APPLICATION, 2025-2035 (USD Billion)
      17. | 7.9 Russia MARKET SIZE ESTIMATES; FORECAST
      18. | | 7.9.1 BY APPLICATION, 2025-2035 (USD Billion)
      19. | 7.10 Italy MARKET SIZE ESTIMATES; FORECAST
      20. | | 7.10.1 BY APPLICATION, 2025-2035 (USD Billion)
      21. | 7.11 Spain MARKET SIZE ESTIMATES; FORECAST
      22. | | 7.11.1 BY APPLICATION, 2025-2035 (USD Billion)
      23. | 7.12 Rest of Europe MARKET SIZE ESTIMATES; FORECAST
      24. | | 7.12.1 BY APPLICATION, 2025-2035 (USD Billion)
      25. | 7.13 APAC MARKET SIZE ESTIMATES; FORECAST
      26. | | 7.13.1 BY APPLICATION, 2025-2035 (USD Billion)
      27. | 7.14 China MARKET SIZE ESTIMATES; FORECAST
      28. | | 7.14.1 BY APPLICATION, 2025-2035 (USD Billion)
      29. | 7.15 India MARKET SIZE ESTIMATES; FORECAST
      30. | | 7.15.1 BY APPLICATION, 2025-2035 (USD Billion)
      31. | 7.16 Japan MARKET SIZE ESTIMATES; FORECAST
      32. | | 7.16.1 BY APPLICATION, 2025-2035 (USD Billion)
      33. | 7.17 South Korea MARKET SIZE ESTIMATES; FORECAST
      34. | | 7.17.1 BY APPLICATION, 2025-2035 (USD Billion)
      35. | 7.18 Malaysia MARKET SIZE ESTIMATES; FORECAST
      36. | | 7.18.1 BY APPLICATION, 2025-2035 (USD Billion)
      37. | 7.19 Thailand MARKET SIZE ESTIMATES; FORECAST
      38. | | 7.19.1 BY APPLICATION, 2025-2035 (USD Billion)
      39. | 7.20 Indonesia MARKET SIZE ESTIMATES; FORECAST
      40. | | 7.20.1 BY APPLICATION, 2025-2035 (USD Billion)
      41. | 7.21 Rest of APAC MARKET SIZE ESTIMATES; FORECAST
      42. | | 7.21.1 BY APPLICATION, 2025-2035 (USD Billion)
      43. | 7.22 South America MARKET SIZE ESTIMATES; FORECAST
      44. | | 7.22.1 BY APPLICATION, 2025-2035 (USD Billion)
      45. | 7.23 Brazil MARKET SIZE ESTIMATES; FORECAST
      46. | | 7.23.1 BY APPLICATION, 2025-2035 (USD Billion)
      47. | 7.24 Mexico MARKET SIZE ESTIMATES; FORECAST
      48. | | 7.24.1 BY APPLICATION, 2025-2035 (USD Billion)
      49. | 7.25 Argentina MARKET SIZE ESTIMATES; FORECAST
      50. | | 7.25.1 BY APPLICATION, 2025-2035 (USD Billion)
      51. | 7.26 Rest of South America MARKET SIZE ESTIMATES; FORECAST
      52. | | 7.26.1 BY APPLICATION, 2025-2035 (USD Billion)
      53. | 7.27 MEA MARKET SIZE ESTIMATES; FORECAST
      54. | | 7.27.1 BY APPLICATION, 2025-2035 (USD Billion)
      55. | 7.28 GCC Countries MARKET SIZE ESTIMATES; FORECAST
      56. | | 7.28.1 BY APPLICATION, 2025-2035 (USD Billion)
      57. | 7.29 South Africa MARKET SIZE ESTIMATES; FORECAST
      58. | | 7.29.1 BY APPLICATION, 2025-2035 (USD Billion)
      59. | 7.30 Rest of MEA MARKET SIZE ESTIMATES; FORECAST
      60. | | 7.30.1 BY APPLICATION, 2025-2035 (USD Billion)
      61. | 7.31 PRODUCT LAUNCH/PRODUCT DEVELOPMENT/APPROVAL
      62. | | 7.31.1
      63. | 7.32 ACQUISITION/PARTNERSHIP
      64. | | 7.32.1


    Market Segmentation

    Turpentine Application Outlook (USD Billion, 2018-2032)

    • Cosmetics
    • Fragrance
    • Food
    • Paints
    • Coatings
    • Others

    Turpentine Regional Outlook (USD Billion, 2018-2032)

    • North America Outlook (USD Billion, 2018-2032)

      • North America Turpentine by Application
        • Cosmetics
        • Fragrance
        • Food
        • Paints
        • Coatings
        • Others
      • US Outlook (USD Billion, 2018-2032)

      • US Turpentine by Application
        • Cosmetics
        • Fragrance
        • Food
        • Paints
        • Coatings
        • Others
      • CANADA Outlook (USD Billion, 2018-2032)

      • Canada Turpentine by Application
        • Cosmetics
        • Fragrance
        • Food
        • Paints
        • Coatings
        • Others
    • Europe Outlook (USD Billion, 2018-2032)

      • Europe Turpentine by Application
        • Cosmetics
        • Fragrance
        • Food
        • Paints
        • Coatings
        • Others
      • Germany Outlook (USD Billion, 2018-2032)

      • Germany Turpentine by Application
        • Cosmetics
        • Fragrance
        • Food
        • Paints
        • Coatings
        • Others
      • France Outlook (USD Billion, 2018-2032)

      • France Turpentine by Application
        • Cosmetics
        • Fragrance
        • Food
        • Paints
        • Coatings
        • Others
      • UK Outlook (USD Billion, 2018-2032)

      • UK Turpentine by Application
        • Cosmetics
        • Fragrance
        • Food
        • Paints
        • Coatings
        • Others
      • ITALY Outlook (USD Billion, 2018-2032)

      • Italy Turpentine by Application
        • Cosmetics
        • Fragrance
        • Food
        • Paints
        • Coatings
        • Others
      • SPAIN Outlook (USD Billion, 2018-2032)

      • Spain Turpentine by Application
        • Cosmetics
        • Fragrance
        • Food
        • Paints
        • Coatings
        • Others
      • Rest Of Europe Outlook (USD Billion, 2018-2032)

      • Rest of Europe Turpentine by Application
        • Cosmetics
        • Fragrance
        • Food
        • Paints
        • Coatings
        • Others
    • Asia-Pacific Outlook (USD Billion, 2018-2032)

      • Asia-Pacific Turpentine by Application
        • Cosmetics
        • Fragrance
        • Food
        • Paints
        • Coatings
        • Others
      • China Outlook (USD Billion, 2018-2032)

      • China Turpentine by Application
        • Cosmetics
        • Fragrance
        • Food
        • Paints
        • Coatings
        • Others
      • Japan Outlook (USD Billion, 2018-2032)

      • Japan Turpentine by Application
        • Cosmetics
        • Fragrance
        • Food
        • Paints
        • Coatings
        • Others
      • India Outlook (USD Billion, 2018-2032)

      • India Turpentine by Application
        • Cosmetics
        • Fragrance
        • Food
        • Paints
        • Coatings
        • Others
      • Australia Outlook (USD Billion, 2018-2032)

      • Australia Turpentine by Application
        • Cosmetics
        • Fragrance
        • Food
        • Paints
        • Coatings
        • Others
      • Rest of Asia-Pacific Outlook (USD Billion, 2018-2032)

      • Rest of Asia-Pacific Turpentine by Application
        • Cosmetics
        • Fragrance
        • Food
        • Paints
        • Coatings
        • Others
    • Rest of the World Outlook (USD Billion, 2018-2032)

      • Rest of the World Turpentine by Application
        • Cosmetics
        • Fragrance
        • Food
        • Paints
        • Coatings
        • Others
      • Middle East Outlook (USD Billion, 2018-2032)

      • Middle East Turpentine by Application
        • Cosmetics
        • Fragrance
        • Food
        • Paints
        • Coatings
        • Others
      • Africa Outlook (USD Billion, 2018-2032)

      • Africa Turpentine by Application
        • Cosmetics
        • Fragrance
        • Food
        • Paints
        • Coatings
        • Others
      • Latin America Outlook (USD Billion, 2018-2032)

      • Latin America Turpentine by Application
        • Cosmetics
        • Fragrance
        • Food
        • Paints
        • Coatings
        • Others


    Infographic

    Free Sample Request

    Kindly complete the form below to receive a free sample of this Report

    Get Free Sample

    Customer Strories

    “I am very pleased with how market segments have been defined in a relevant way for my purposes (such as "Portable Freezers & refrigerators" and "last-mile"). In general the report is well structured. Thanks very much for your efforts.”

    Victoria Milne

    Founder
    Case Study
    Chemicals and Materials

    Compare Licence

    ×
    Features License Type
    Single User Multiuser License Enterprise User
    Price $4,950 $5,950 $7,250
    Maximum User Access Limit 1 User Upto 10 Users Unrestricted Access Throughout the Organization
    Free Customization
    Direct Access to Analyst
    Deliverable Format
    Platform Access
    Discount on Next Purchase 10% 15% 15%
    Printable Versions