• Cat-intel
  • MedIntelliX
  • Resources
  • About Us
  • Hero Background
    English
    Chinese
    French
    Japanese
    Korean
    German
    Spanish

    Trash Bags Market Trends

    ID: MRFR/CR/10520-CR
    317 Pages
    Pradeep Nandi
    July 2025

    Trash Bags Market Research Report Information by Product Type (Drawstring Trash Bags, Star-Sealed Trash Bags, Flat-Sealed Trash Bags, T-Shirt Bags, Twist Tie Bags), by Material Type (High-Density Polyethylene (HDPE), Low-Density Polyethylene (LDPE), Linear Low-Density Polyethylene (LLDPE), Biodegradable Polyethylene), by Capacity (Small, Medium, Large), by Distribution Channel (Supermarkets &am...

    Share:
    Download PDF ×

    We do not share your information with anyone. However, we may send you emails based on your report interest from time to time. You may contact us at any time to opt-out.

    Trash Bags Market Infographic
    Purchase Options

    Market Trends

    Key Emerging Trends in the Trash Bags Market

    The market for recycled plastic is being created by strict government rules and policies that promote recycling. To illustrate, several nations are working to lower the amount of plastic trash, encourage recycling, and set objectives for the usefulness of recycled materials in various areas. These efforts by the government are a big part of why recycled plastic is growing in popularity. Businesses and people are changing how they do things now that they know how plastic trash hurts the world. Recycling plastic makes people want to buy things made from recovered plastic because they know how trashed plastic affects the earth. People are changing what they buy and how businesses try to be better for the world because of this information. The market for reclaimed plastic is growing because it is getting easier to process plastic thanks to progress in technology. Some changes to the ways we recycle, like better sorting, chemical recycling, and mechanical recycling, make recycled plastic more useful in many ways by making it better and more efficient. Lots of people are using closed-loop recycling systems. People collect used plastic, process it, and then use it to make new things in closed-loop models. Along the lines of the green economy, this way cuts down on trash and makes plastic last longer. Companies are finding more and more ways to use used plastic. People are making use of recycled plastic for buildings, cars, clothes, as well as technology. Plastic is a lot easier to utilize in various things since it can easily be shaped in diverse ways and is easier handle. More and more people want recycled plastics that are also of good quality. People and businesses alike are looking for good plastics that can be recovered. Used plastics can now be made to work just as well as new ones thanks to better ways to recycle. This means that they can be used in more applications. In addition to the old ways, new products that can be recycled and used again are helping people recycle. There aren't always recycled plastics that break down naturally, but bio-based plastics that do are getting better, which is good news for people who are worried about plastic trash. Many consumer brands are working to move to packing ways that are better for the earth. Numerous big companies have big plans to package their goods with more recycled plastic. This will change the green norms for the whole business and make more people want to reuse products. People who use plastic should know about the market for recovered plastic and take part in it. People can make choices that are good for the earth because they are learning more and getting more education. Building sites to recycle plastic is being paid for by both public and private groups. For example, funding and support for recycling sites, pickup methods, and research and development are making the market for recycled plastic bigger overall. Recycling is becoming more and more popular. People and businesses want to buy used things because they help the world have less garbage. More and more people are buying things that can be returned after they are used. Efforts around the world to make less plastic trash are changing how markets work. Governments, international agreements, and groups are working together to stop plastic trash around the world. As part of these efforts, businesses have promised to use more recycled plastic and do other things to make plastic goods in general less bad for the environment.

    Author
    Pradeep Nandi
    Senior Research Analyst

    I have a bachelor's degree in mechanical engineering and an MBA. I have more than two years of expertise in the retail, food, and beverage, chemical, and material industries, and hence have developed a sound cross-domain expertise. A firm believer in lifelong learning and sharing of knowledge. Having a proclivity for hatching ideas and trying to absorb as much information as possible in a short amount of time. Introducing corporates to the data and insight, which enables them to move from probability to possibility, has been my key areas of interest. 

    Leave a Comment

    FAQs

    What is the current valuation of the Trash Bags Market in 2024?

    The Trash Bags Market was valued at 14.16 USD Billion in 2024.

    Market Summary

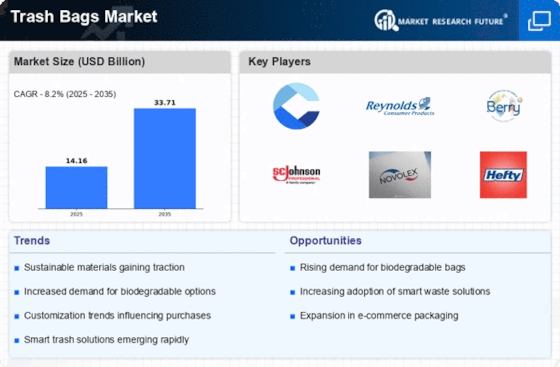
    As per MRFR analysis, the Trash Bags Market Size was estimated at 14.16 USD Billion in 2024. The Trash Bags industry is projected to grow from 15.33 USD Billion in 2025 to 33.71 USD Billion by 2035, exhibiting a compound annual growth rate (CAGR) of 8.2 during the forecast period 2025 - 2035.

    Key Market Trends & Highlights

    The Trash Bags Market is experiencing a shift towards sustainability and innovation, driven by changing consumer preferences and regulatory pressures.

    • Sustainable materials adoption is becoming increasingly prevalent, particularly in North America, as consumers demand eco-friendly options.
    • Product innovation and functionality are key trends, with manufacturers focusing on enhancing the performance of drawstring trash bags, which remain the largest segment.
    • Specialized product segmentation is evident, with t-shirt bags emerging as the fastest-growing category in the Asia-Pacific region.
    • Rising environmental awareness and urbanization are major drivers, influencing the demand for biodegradable polyethylene and innovative waste management solutions.

    Market Size & Forecast

    2024 Market Size 14.16 (USD Billion)
    2035 Market Size 33.71 (USD Billion)
    CAGR (2025 - 2035) 8.2%
    Largest Regional Market Share in 2024 Asia Pacific

    Major Players

    <p>The Clorox Company (US), Reynolds Consumer Products LLC (US), Berry Global Inc. (US), SC Johnson Professional (US), Novolex Holdings, LLC (US), Hefty (US), Ecovessel (US), Kirkland Signature (US), Glad (US)</p>

    Market Trends

    The Trash Bags Market is currently experiencing a dynamic evolution, driven by various factors including environmental concerns and consumer preferences. As sustainability becomes a focal point for many industries, manufacturers are increasingly exploring biodegradable and compostable materials for trash bags. This shift not only aligns with global efforts to reduce plastic waste but also caters to a growing demographic of eco-conscious consumers. Furthermore, innovations in product design and functionality are emerging, with features such as odor control and enhanced durability gaining traction. These developments suggest a market that is adapting to meet the diverse needs of its users while addressing pressing environmental issues. In addition to sustainability, the Trash Bags Market is witnessing a rise in demand for specialized products tailored to specific applications. For instance, heavy-duty bags for industrial use and smaller, more convenient options for household purposes are becoming more prevalent. This segmentation indicates a nuanced understanding of consumer requirements, as different settings necessitate varying levels of strength and capacity. Overall, the Trash Bags Market appears poised for continued growth, driven by innovation and a commitment to sustainability, while also catering to the specific needs of diverse consumer segments.

    Sustainable Materials Adoption

    The Trash Bags Market is increasingly leaning towards the use of sustainable materials. Manufacturers are exploring biodegradable and compostable options, reflecting a broader commitment to environmental responsibility. This trend aligns with consumer preferences for eco-friendly products, suggesting a shift in production practices.

    Product Innovation and Functionality

    Innovation within the Trash Bags Market is evident as companies introduce products with enhanced features. Options such as odor control, puncture resistance, and varying sizes cater to specific consumer needs. This focus on functionality indicates a response to diverse market demands.

    Specialized Product Segmentation

    The market is witnessing a trend towards specialized trash bags designed for particular applications. Heavy-duty bags for industrial use and smaller bags for household tasks are becoming more common. This segmentation highlights an understanding of varying consumer requirements across different environments.

    The ongoing shift towards sustainable materials in the trash bags market reflects a growing consumer preference for environmentally friendly products, which may reshape industry standards and practices.

    U.S. Environmental Protection Agency

    Trash Bags Market Market Drivers

    Rising Environmental Awareness

    The increasing awareness regarding environmental issues appears to be a pivotal driver in the Trash Bags Market. Consumers are becoming more conscious of their ecological footprint, leading to a growing demand for eco-friendly trash bags. This trend is reflected in the rising sales of biodegradable and compostable options, which are projected to account for a significant share of the market. As more individuals and businesses seek sustainable alternatives, manufacturers are compelled to innovate and expand their product lines. The shift towards environmentally responsible products not only caters to consumer preferences but also aligns with regulatory pressures aimed at reducing plastic waste. Consequently, this heightened environmental consciousness is likely to shape the future landscape of the Trash Bags Market.

    Urbanization and Population Growth

    Urbanization and population growth are driving forces in the Trash Bags Market. As urban areas expand, the demand for waste management solutions intensifies. The United Nations projects that by 2050, nearly 68 percent of the world’s population will reside in urban areas, which could lead to increased waste generation. This demographic shift necessitates efficient waste disposal methods, thereby boosting the demand for trash bags. Furthermore, with rising disposable incomes, consumers are more inclined to purchase higher-quality trash bags that offer better durability and functionality. This trend indicates a potential increase in market value, as urban centers require more sophisticated waste management solutions to handle the growing volume of refuse.

    E-commerce Growth and Online Retailing

    The rapid growth of e-commerce and online retailing is reshaping the Trash Bags Market. With more consumers opting for online shopping, the demand for packaging and waste disposal products, including trash bags, is on the rise. E-commerce platforms provide convenience and accessibility, allowing consumers to purchase trash bags in bulk, which may lead to increased sales volumes. Additionally, online retailers often offer a wider variety of products, including specialized trash bags for different applications, catering to diverse consumer needs. This trend suggests that the Trash Bags Market could experience significant growth as e-commerce continues to expand, providing opportunities for manufacturers to reach a broader audience.

    Technological Advancements in Manufacturing

    Technological advancements in manufacturing processes are playing a crucial role in the Trash Bags Market. Innovations such as improved polymer technology and automated production techniques are enhancing the efficiency and quality of trash bag production. These advancements allow manufacturers to produce stronger, more durable bags while potentially reducing costs. Moreover, the integration of smart technologies in production lines may lead to more sustainable practices, such as minimizing waste during manufacturing. As technology continues to evolve, it is likely that the Trash Bags Market will witness a transformation in product offerings, with an emphasis on quality, sustainability, and cost-effectiveness.

    Regulatory Compliance and Waste Management Policies

    Regulatory compliance and waste management policies are increasingly influencing the Trash Bags Market. Governments worldwide are implementing stricter regulations regarding waste disposal and recycling, which necessitates the use of specific types of trash bags. For instance, many regions are mandating the use of biodegradable or recyclable materials in waste management practices. This regulatory landscape compels manufacturers to adapt their product offerings to meet compliance standards, potentially leading to innovation in materials and designs. As municipalities enforce these regulations, the demand for compliant trash bags is likely to rise, thereby shaping the market dynamics and encouraging sustainable practices within the Trash Bags Market.

    Market Segment Insights

    By Product Type: Drawstring Trash Bags (Largest) vs. T-Shirt Bags (Fastest-Growing)

    <p>The Trash Bags Market is diverse, with several product types competing for consumer preference. Drawstring trash bags hold the largest share, favored for their convenience and reliability. Their design allows for easy sealing and carrying, making them a staple in households and commercial settings. In contrast, T-shirt bags have witnessed rapid growth due to their affordability and lightweight nature, making them popular for various waste disposal needs. They are particularly appealing in urban environments where convenience is paramount. As eco-friendly alternatives gain traction, the market dynamics are shifting, pushing T-shirt bags further into the limelight.</p>

    <p>Drawstring Trash Bags (Dominant) vs. T-Shirt Bags (Emerging)</p>

    <p>Drawstring trash bags are recognized for their practicality and robust design, making them the preferred choice for consumers looking for a reliable waste management solution. Their ability to close securely and carry easily sets them apart in performance and user experience. On the other hand, T-shirt bags, while considered emerging, are gaining popularity due to their cost-effectiveness and versatility in various applications, such as retail and grocery shopping. These lightweight bags are increasingly adopted in convenience-driven markets, offering an appealing solution for quick waste disposal. As environmental concerns grow, both types are expected to evolve, with manufacturers focusing on sustainable materials to enhance their market positioning.</p>

    By Material Type: Low-Density Polyethylene (LDPE) (Largest) vs. Biodegradable Polyethylene (Fastest-Growing)

    <p>In the Trash Bags Market, the material type segment showcases a diverse distribution among various bag options. Low-Density Polyethylene (LDPE) holds the largest share, becoming the go-to choice for households and businesses alike due to its flexibility and durability. High-Density Polyethylene (HDPE) also plays a vital role but lags behind LDPE in popularity. Meanwhile, Linear Low-Density Polyethylene (LLDPE) is carving out its niche with enhanced strength and stretch properties, gaining traction among specific consumer demographics.</p>

    <p>Low-Density Polyethylene (LDPE) (Dominant) vs. Biodegradable Polyethylene (Emerging)</p>

    <p>Low-Density Polyethylene (LDPE) is recognized for its excellent tensile strength and puncture resistance, making it the dominant force in the Trash Bags Market. Its lightweight nature and versatility contribute to its widespread use across various sectors, including residential and commercial applications. On the other hand, Biodegradable Polyethylene is emerging as a compelling alternative, driven by increasing environmental awareness among consumers. This segment appeals to eco-conscious buyers looking for sustainable solutions, prompting manufacturers to innovate and expand product lines to meet this growing demand. As sustainability takes center stage, the market for biodegradable products is expected to witness significant growth.</p>

    By Capacity: Large (Largest) vs. Small (Fastest-Growing)

    <p>In the Trash Bags Market, the capacity segment displays a diverse distribution in market share among the small, medium, and large categories. Large trash bags dominate this segment due to their utility for heavy-duty waste disposal in both residential and commercial settings. Meanwhile, small trash bags are gaining momentum, particularly in urban areas, as they cater to the rising need for convenient and compact waste solutions in households and offices that require frequent disposal without taking up excessive space.</p>

    <p>Capacity: Large (Dominant) vs. Small (Emerging)</p>

    <p>The large capacity trash bags are predominantly used in construction, landscaping, and other industrial applications, making them a staple in the market. Their strong hold on the market can be attributed to their robustness and ability to handle substantial waste loads. Conversely, small trash bags are increasingly becoming the choice for eco-conscious consumers seeking convenient solutions for daily waste. With a focus on ease of use and sustainability, small bags are catering to a growing demographic that prefers efficient disposal systems, thus positioning them as a burgeoning segment with significant growth potential.</p>

    By Distribution Channel: Supermarkets & Hypermarkets (Largest) vs. Online Retail (Fastest-Growing)

    <p>In the Trash Bags Market, the distribution of market share among segments reveals that Supermarkets and Hypermarkets hold the largest share, attributed to their wide reach and consumer accessibility. Convenience Stores and Specialty Stores follow. Online Retail, however, is rapidly gaining traction, appealing to the convenience-seeking consumer and benefiting from the digital shift in shopping habits. This growth across different channels showcases the diverse purchasing preferences of consumers in the Trash Bags Market, enabling retailers to craft targeted strategies.</p>

    <p>Supermarkets & Hypermarkets: Dominant vs. Online Retail: Emerging</p>

    <p>Supermarkets and Hypermarkets establish a dominant position in the Trash Bags Market, primarily due to their expansive physical presence and the ability to offer a comprehensive range of products. They cater to a broad customer base and often leverage promotions and displays to encourage bulk purchases. In contrast, Online Retail is an emerging segment that has surged ahead, particularly amid the rise of e-commerce, providing a convenient shopping experience with home delivery. This channel attracts tech-savvy consumers who appreciate the ease of ordering trash bags online, thus creating a competitive landscape for traditional retail formats.</p>

    By End-Use Industry: Residential (Largest) vs. Commercial (Fastest-Growing)

    <p>The Trash Bags Market is primarily divided into three end-use segments: Residential, Commercial, and Industrial. Among these, the Residential segment holds the largest share as it encompasses a wide range of consumers using trash bags for everyday waste disposal. The Commercial segment is notable for its rapid growth, spurred by the increasing demand from businesses looking for environmentally friendly waste management solutions. The recent trend towards sustainability in consumer choices further solidifies the Residential segment's dominance while pushing Commercial applications to expand rapidly.</p>

    <p>Residential (Dominant) vs. Commercial (Emerging)</p>

    <p>The Residential segment is recognized as the dominant player in the Trash Bags Market, characterized by a diverse range of products catering to consumers' evolving waste disposal needs. This segment benefits from a broad customer base that relies on trash bags for regular household waste, recycling, and yard cleanup. The rising awareness of eco-friendly bags is also influencing consumer preferences. Conversely, the Commercial segment is emerging significantly, focusing on businesses that require specialized trash bags for various applications, including food waste, industrial cleaning, and office waste. The demand for stronger, more sustainable options is driving innovation and expansion in this segment, positioning it as a key player in the future growth of the market.</p>

    Get more detailed insights about Trash Bags Market Research Report – Forecast Till 2035

    Regional Insights

    North America : Market Leader in Trash Bags

    North America dominates the trash bags market, accounting for approximately 45% of the global share. The region's growth is driven by increasing consumer awareness regarding waste management and sustainability. Regulatory initiatives aimed at reducing plastic waste further catalyze demand for eco-friendly alternatives. The U.S. is the largest market, followed by Canada, which holds around 15% of the market share. The competitive landscape is characterized by major players such as The Clorox Company, Reynolds Consumer Products, and Berry Global. These companies are focusing on innovation and sustainability, introducing biodegradable and recyclable options to meet consumer demand. The presence of established brands ensures a robust distribution network, enhancing market penetration across various retail channels.

    Europe : Emerging Eco-Friendly Trends

    Europe is witnessing a significant shift towards sustainable trash bag solutions, holding approximately 30% of the global market share. The region's growth is propelled by stringent regulations aimed at reducing plastic waste and promoting recycling. Countries like Germany and France are leading the charge, with Germany holding the largest share at around 12%. The European Union's directives on single-use plastics are key drivers of this trend. Leading countries in the European market include Germany, France, and the UK, with a competitive landscape featuring companies like Novolex and SC Johnson Professional. The focus on eco-friendly products is reshaping the market, as consumers increasingly prefer biodegradable options. This shift is supported by government initiatives that encourage sustainable practices among manufacturers and consumers alike.

    Asia-Pacific : Rapid Growth and Urbanization

    Asia-Pacific is rapidly emerging as a significant player in the trash bags market, accounting for approximately 20% of the global share. The region's growth is driven by urbanization, increasing disposable incomes, and a growing focus on waste management solutions. Countries like China and India are the largest markets, with China holding around 10% of the market share. The rising population and urban development are key factors fueling demand. The competitive landscape is evolving, with local manufacturers gaining traction alongside global players. Companies like Hefty and Ecovessel are expanding their presence in the region. The increasing awareness of environmental issues is prompting consumers to seek sustainable options, leading to a rise in biodegradable and compostable trash bags. This trend is supported by government initiatives promoting waste reduction and recycling.

    Middle East and Africa : Untapped Market Potential

    The Middle East and Africa region is gradually emerging in the trash bags market, holding approximately 5% of the global share. The growth is primarily driven by rapid urbanization, increasing population, and a rising awareness of waste management practices. Countries like South Africa and the UAE are leading the market, with South Africa accounting for about 3% of the share. The region's potential is significant, as waste management infrastructure continues to develop. The competitive landscape is characterized by a mix of local and international players. Companies are increasingly focusing on introducing innovative products tailored to regional needs. The presence of key players like Kirkland Signature and Glad is enhancing market dynamics. As governments implement stricter waste management regulations, the demand for efficient trash bag solutions is expected to rise, paving the way for future growth.

    Key Players and Competitive Insights

    The Trash Bags Market is currently characterized by a dynamic competitive landscape, driven by increasing consumer demand for sustainable and innovative waste management solutions. Key players such as The Clorox Company (US), Reynolds Consumer Products LLC (US), and Berry Global Inc. (US) are strategically positioning themselves through a combination of product innovation, sustainability initiatives, and regional expansion. These companies are not only focusing on enhancing their product offerings but are also investing in eco-friendly materials and technologies, which collectively shape a competitive environment that increasingly prioritizes environmental responsibility alongside performance.

    In terms of business tactics, companies are localizing manufacturing to reduce costs and improve supply chain efficiency. The market appears moderately fragmented, with several players vying for market share. However, the collective influence of major companies like SC Johnson Professional (US) and Novolex Holdings, LLC (US) is notable, as they leverage their extensive distribution networks and brand recognition to maintain a competitive edge.

    In August 2025, The Clorox Company (US) announced a new line of biodegradable trash bags, which aligns with the growing consumer preference for sustainable products. This strategic move not only enhances their product portfolio but also positions the company as a leader in eco-friendly waste management solutions. The introduction of these bags is likely to attract environmentally conscious consumers, thereby expanding their market share in a competitive landscape increasingly focused on sustainability.

    Similarly, in September 2025, Reynolds Consumer Products LLC (US) launched a partnership with a leading recycling technology firm to develop advanced recycling processes for their trash bags. This collaboration is significant as it underscores the company's commitment to circular economy principles, potentially reducing waste and enhancing the recyclability of their products. Such initiatives may strengthen their brand reputation and appeal to a broader audience concerned with environmental impact.

    Moreover, in July 2025, Berry Global Inc. (US) expanded its manufacturing capabilities by investing in a new facility dedicated to producing high-performance trash bags made from recycled materials. This strategic investment not only enhances their production capacity but also aligns with the increasing regulatory pressures for sustainable manufacturing practices. By focusing on recycled content, Berry The Trash Bags, appealing to both consumers and regulatory bodies.

    As of October 2025, the Trash Bags Market is witnessing trends that emphasize digitalization, sustainability, and the integration of artificial intelligence in production processes. Strategic alliances among key players are shaping the competitive landscape, fostering innovation and efficiency. The shift from price-based competition to a focus on technological advancement and supply chain reliability is evident, suggesting that future competitive differentiation will hinge on the ability to innovate and respond to evolving consumer preferences.

    Key Companies in the Trash Bags Market market include

    Industry Developments

    • Q2 2024: Berry Global Group, Inc. Announces Opening of New Recycling Facility in Indiana Berry Global Group, a major producer of trash bags and flexible packaging, opened a new state-of-the-art recycling facility in Indiana to increase the use of recycled content in its trash bag products.
    • Q2 2024: Reynolds Consumer Products Appoints Michael Graham as Chief Financial Officer Reynolds Consumer Products, a leading manufacturer of trash bags under the Hefty brand, announced the appointment of Michael Graham as its new Chief Financial Officer, effective May 2024.
    • Q2 2024: Novolex Launches New Line of Compostable Trash Bags Novolex, a prominent packaging and trash bag manufacturer, launched a new line of compostable trash bags designed for both residential and commercial use, expanding its sustainable product portfolio.
    • Q1 2024: Glad Partners with TerraCycle to Launch National Recycling Program for Trash Bags Glad, a major trash bag brand, announced a partnership with TerraCycle to launch a nationwide recycling program, allowing consumers to recycle used trash bags at participating locations.
    • Q3 2024: Inteplast Group Expands Trash Bag Production with New Facility in Texas Inteplast Group, a significant player in the trash bags market, opened a new manufacturing facility in Texas to increase production capacity and meet growing demand in North America.
    • Q2 2024: Heritage Bag Company Receives EPA Approval for Recycled Content Trash Bags Heritage Bag Company announced it received approval from the U.S. Environmental Protection Agency (EPA) for its new line of trash bags made with 60% post-consumer recycled content.
    • Q1 2024: Aluf Plastics Announces $20 Million Investment to Expand Trash Bag Manufacturing Aluf Plastics, a U.S.-based trash bag manufacturer, announced a $20 million investment to expand its manufacturing operations and increase output of both traditional and eco-friendly trash bags.
    • Q2 2024: Poly-America Launches Heavy-Duty Contractor Trash Bags Poly-America, a leading producer of trash bags, launched a new line of heavy-duty contractor trash bags targeting the construction and industrial sectors.
    • Q3 2024: Novolex Acquires EcoSafe Zero Waste to Expand Sustainable Trash Bag Offerings Novolex announced the acquisition of EcoSafe Zero Waste, a company specializing in compostable and biodegradable trash bags, to strengthen its position in the sustainable waste management sector.
    • Q1 2025: Reynolds Consumer Products Announces $50 Million Expansion of Hefty Trash Bag Plant Reynolds Consumer Products announced a $50 million expansion of its Hefty trash bag manufacturing plant in Illinois to boost production capacity and support new product lines.
    • Q2 2025: Berry Global Secures Multi-Year Contract to Supply Trash Bags to Major U.S. Retailer Berry Global announced it secured a multi-year contract to supply private label trash bags to a major U.S. retail chain, strengthening its presence in the retail sector.
    • Q2 2025: Inteplast Group Launches Biodegradable Trash Bags for Commercial Markets Inteplast Group launched a new line of biodegradable trash bags aimed at commercial customers, expanding its sustainable product offerings.

    Trash Bags Market Segmentation

    Trash Bags by Product Type Outlook

    • Drawstring Trash Bags
    • Star-Sealed Trash Bags
    • Flat-Sealed Trash Bags
    • T-Shirt Bags
    • Twist Tie Bags

    Trash Bags by Material Type Outlook

    • High-Density Polyethylene (HDPE)
    • Low-Density Polyethylene (LDPE)
    • Linear Low-Density Polyethylene (LLDPE)
    • Biodegradable Polyethylene

    Trash Bags by Capacity Outlook

    • Small
    • Medium
    • Large

    Trash Bags by Distribution Channel Outlook

    • Supermarkets & Hypermarkets
    • Convenience Stores
    • Online Retail
    • Specialty Stores

    Trash Bags by End-Use Industry Outlook

    • Residential
    • Commercial
    • Industrial

    Trash Bags Regional Outlook

    • North America
      • US
      • Canada
      • Mexico
    • Europe
      • Russia
      • Germany
      • United Kingdom (Uk)
      • France
      • Italy
      • Spain
      • Switzerland
      • Belgium
      • Czech Republic
      • Portugal
      • Rest of Europe
    • Asia-Pacific
      • India
      • Japan
      • South Korea
      • Malaysia
      • Thailand
      • Indonesia
      • Rest Of Asia-Pacific
    • Latin America (Latam)
      • Brazil
      • Colombia
      • Argentina
      • Peru
      • Venezuela
      • Chile
      • Panama
      • Rest Of Latam
    • Africa
      • Nigeria
      • Ethiopia
      • Egypt
      • Democratic Republic of the Congo (DRC)
      • Tanzania
      • South Africa
      • Morocco
      • Algeria
      • Tunisia
      • Rest Of Africa

    Future Outlook

    Trash Bags Market Future Outlook

    <p>The Trash Bags Market is projected to grow at an 8.2% CAGR from 2024 to 2035, driven by increasing urbanization, environmental regulations, and demand for sustainable products.</p>

    New opportunities lie in:

    • <p>Development of biodegradable trash bags for eco-conscious consumers.</p>
    • <p>Expansion into smart waste management solutions integrating IoT technology.</p>
    • <p>Partnerships with municipalities for large-scale waste collection contracts.</p>

    <p>By 2035, the Trash Bags Market is expected to achieve substantial growth, reflecting evolving consumer preferences and technological advancements.</p>

    Market Segmentation

    Trash Bags Market Capacity Outlook

    • Small
    • Medium
    • Large

    Trash Bags Market Product Type Outlook

    • Drawstring Trash Bags
    • Star-Sealed Trash Bags
    • Flat-Sealed Trash Bags
    • T-Shirt Bags
    • Twist Tie Bags

    Trash Bags Market Material Type Outlook

    • High-Density Polyethylene (HDPE)
    • Low-Density Polyethylene (LDPE)
    • Linear Low-Density Polyethylene (LLDPE)
    • Biodegradable Polyethylene

    Trash Bags Market End-Use Industry Outlook

    • Residential
    • Commercial
    • Industrial

    Trash Bags Market Distribution Channel Outlook

    • Supermarkets & Hypermarkets
    • Convenience Stores
    • Online Retail
    • Specialty Stores

    Report Scope

    MARKET SIZE 202414.16(USD Billion)
    MARKET SIZE 202515.33(USD Billion)
    MARKET SIZE 203533.71(USD Billion)
    COMPOUND ANNUAL GROWTH RATE (CAGR)8.2% (2024 - 2035)
    REPORT COVERAGERevenue Forecast, Competitive Landscape, Growth Factors, and Trends
    BASE YEAR2024
    Market Forecast Period2025 - 2035
    Historical Data2019 - 2024
    Market Forecast UnitsUSD Billion
    Key Companies ProfiledMarket analysis in progress
    Segments CoveredMarket segmentation analysis in progress
    Key Market OpportunitiesGrowing demand for eco-friendly materials in the Trash Bags Market presents significant innovation opportunities.
    Key Market DynamicsRising consumer preference for eco-friendly trash bags drives innovation and competition among manufacturers.
    Countries CoveredNorth America, Europe, APAC, South America, MEA

    FAQs

    What is the current valuation of the Trash Bags Market in 2024?

    The Trash Bags Market was valued at 14.16 USD Billion in 2024.

    1. EXECUTIVE SUMMARY
    2. MARKET INTRODUCTION
      1. 2.1
      2. DEFINITION
      3. SCOPE OF THE STUDY
      4. RESEARCH OBJECTIVE
      5. MARKET
      6. STRUCTURE
    3. RESEARCH METHODOLOGY
      1. OVERVIEW
      2. DATA FLOW
      3. 3.2.1
      4. DATA MINING PROCESS
      5. PURCHASED DATABASE:
      6. SECONDARY SOURCES:
        1. SECONDARY RESEARCH DATA FLOW:
      7. PRIMARY RESEARCH:
        1. PRIMARY
        2. PRIMARY RESEARCH: NUMBER OF INTERVIEWS CONDUCTED
        3. PRIMARY RESEARCH: REGIONAL COVERAGE
      8. RESEARCH DATA FLOW:
      9. APPROACHES FOR MARKET SIZE
        1. CONSUMPTION & NET TRADE APPROACH
        2. REVENUE ANALYSIS
      10. ESTIMATION:
      11. APPROACH
      12. DATA FORECASTING
        1. DATA FORECASTING TECHNIQUE
        2. MICROECONOMIC FACTOR ANALYSIS:
        3. DATA MODELING:
      13. 3.8
      14. DATA MODELING
      15. TEAMS AND ANALYST CONTRIBUTION
      16. S
    4. MARKET DYNAMICS
      1. INTRODUCTION
      2. MARKET TRENDS AND GROWTH AFFECTING FACTORS
      3. DRIVERS
        1. INCREASING
        2. GROWING ENVIRONMENTAL CONCERNS
        3. RISING DISPOSABLE
        4. E-COMMERCE GROWTH
        5. PRODUCT INNOVATION AND CUSTOMIZATION
      4. URBANIZATION
      5. INCOME
      6. RESTRAINTS
        1. HIGH PRODUCTION COSTS
        2. ENVIRONMENTAL REGULATIONS
        3. COMPETITION FROM ALTERNATIVE PRODUCTS
        4. MARKET SATURATION IN DEVELOPED
        5. FLUCTUATING RAW MATERIAL PRICES
      7. REGIONS
      8. OPPORTUNITY
        1. SUSTAINABLE PRODUCT DEVELOPMENT
        2. PARTNERSHIPS WITH LOCAL GOVERNMENTS
      9. 4.5.1
      10. EXPANSION INTO EMERGING MARKETS
      11. 4.5.3
      12. SMART TRASH BAG SOLUTIONS
      13. 4.5.5
      14. ENHANCED BRANDING AND MARKETING STRATEGIES
      15. IMPACT ANALYSIS OF COVID-19
        1. IMPACT ON OVERALL CONSUMER RETAIL
        2. IMPACT ON GLOBAL TRASH BAG
        3. IMPACT ON SUPPLY CHAIN OF TRASH BAG MARKET
        4. IMPACT ON
      16. MARKET
    5. MARKET DEMAND OF TRASH BAG MARKET
    6. IMPACT ON PRICING OF TRASH BAG MARKET
    7. MARKET FACTOR ANALYSIS
      1. VALUE CHAIN ANALYSIS
        1. RAW MATERIALS
        2. MANUFACTURING / PRODUCTION/ PROCESSING
        3. PACKING
        4. DISTRIBUTION
        5. END-USER
      2. SUPPLY CHAIN ANALYSIS
        1. PARTICIPANTS (AT DIFFERENT
      3. NODES)
      4. 5.2.1.3
      5. DISTRIBUTION CHANNEL
      6. PORTER’S FIVE FORCES MODEL
        1. BARGAINING POWER OF SUPPLIERS
        2. BARGAINING POWER OF BUYERS
        3. THREAT OF SUBSTITUTES
        4. INTENSITY OF
      7. 5.3.3
      8. THREAT OF NEW ENTRANTS
      9. RIVALRY
      10. CONSUMER BEHAVIOUR ANALYSIS
      11. STRATEGIC INSIGHTS
      12. 5.6
    8. COST STRUCTURE ANALYSIS
      1. & LOGISTICS COSTS
      2. ANALYSIS
      3. 5.10
      4. REGULATORY UPDATE
      5. COSTS
      6. 6
    9. PRODUCTION COST ANALYSIS
    10. TRANSPORT
    11. REGULATORY & COMPLIANCE COSTS
      1. PRICING
        1. REGIONAL PRICE COMPARISONS
        2. FACTORS INFLUENCING PRICING
        3. COST OF RAW MATERIALS
        4. SUPPLY CHAIN FACTORS AND DISTRIBUTION COSTS
      2. ANALYSIS ON PACKAGING BAGS AND INDUSTRIAL BAGS
      3. MARKET TRENDS
      4. REGIONAL-LEVEL INFORMATION ON PRODUCTION COSTS AND REGULATORY
      5. REGIONAL-LEVEL DETAILS ON SPECIFIC APPLICABLE REGULATIONS
    12. GLOBAL TRASH BAG MARKET, BY PRODUCT TYPE
      1. INTRODUCTION
      2. DRAWSTRING
      3. TRASH BAGS
      4. STAR-SEALED TRASH BAGS
      5. FLAT-SEALED TRASH BAGS
      6. 6.5
      7. T-SHIRT BAGS
      8. TWIST TIE BAGS
    13. GLOBAL TRASH BAG MARKET, BY MATERIAL
      1. TYPE
      2. INTRODUCTION
      3. HIGH-DENSITY POLYETHYLENE (HDPE)
      4. LOW-DENSITY
      5. POLYETHYLENE (LDPE)
      6. LINEAR LOW-DENSITY POLYETHYLENE (LLDPE)
      7. BIODEGRADABLE
      8. POLYETHYLENE
    14. GLOBAL TRASH BAG MARKET, BY CAPACITY
      1. INTRODUCTION
      2. SMALL (UP TO 10 GALLONS)
      3. MEDIUM (10–40 GALLONS)
      4. LARGE
      5. (ABOVE 40 GALLONS)
    15. GLOBAL TRASH BAG MARKET, BY DISTRIBUTION CHANNEL
      1. 9.1
      2. INTRODUCTION
      3. SUPERMARKETS & HYPERMARKETS
      4. CONVENIENCE STORES
      5. SPECIALTY STORES
      6. ONLINE RETAIL
    16. GLOBAL TRASH BAG MARKET, BY
      1. END USE INDUSTRY
      2. INTRODUCTION
      3. RESIDENTIAL
      4. COMMERCIAL
      5. INDUSTRIAL
    17. GLOBAL TRASH BAGS MARKET, BY REGION
      1. NORTH AMERICA
        1. US
        2. CANADA
        3. MEXICO
      2. EUROPE
        1. RUSSIA
        2. GERMANY
        3. UNITED KINGDOM (UK)
        4. FRANCE
        5. SPAIN
        6. SWITZERLAND
        7. BELGIUM
        8. PORTUGAL
        9. ROE
      3. 11.2.5
      4. ITALY
      5. 11.2.9
      6. CZECH REPUBLIC
      7. ASIA-PACIFIC
        1. INDIA
        2. JAPAN
        3. SOUTH KOREA
        4. MALAYSIA
        5. THAILAND
        6. INDONESIA
        7. REST OF ASIA-PACIFIC
        8. BRAZIL
        9. COLOMBIA
        10. ARGENTINA
        11. PERU
        12. VENEZUELA
        13. CHILE
        14. PANAMA
      8. 11.4
      9. LATIN AMERICA (LATAM)
      10. 11.4.8
      11. REST OF LATAM
      12. AFRICA
        1. NIGERIA
        2. ETHIOPIA
        3. DEMOCRATIC REPUBLIC OF THE CONGO (DRC)
        4. TANZANIA
        5. SOUTH AFRICA
        6. MOROCCO
        7. ALGERIA
        8. TUNISIA
        9. REST OF AFRICA
      13. 11.5.3
      14. EGYPT
    18. COMPETITIVE LANDSCAPE
      1. INTRODUCTION
      2. COMPETITION DASHBOARD
        1. PRODUCT PORTFOLIO
        2. REGIONAL
        3. STRATEGIC ALLIANCES
        4. INDUSTRY EXPERIENCES
      3. PRESENCE
      4. 12.3
    19. MARKET SHARE ANALYSIS
      1. WHO ARE THE MAJOR DISRUPTORS & INNOVATORS
      2. WHAT STRATEGIES ARE BEING ADOPTED BY MARKET LEADERS
      3. KEY DEVELOPMENTS
        1. MERGER & ACQUISITION
        2. EXPANSION
        3. LAUNCH
      4. & GROWTH STRATEGIES
      5. COMPETITIVE MAPPING
    20. COMPANY PROFILES
      1. 13.1
      2. BERRY GLOBAL INC.
      3. 13.2.2
      4. PRODUCTS OFFERED
      5. 13.2.5
      6. KEY STRATEGY
      7. 13.3.2
      8. PRODUCTS OFFERED
      9. 13.3.5
      10. KEY STRATEGY
      11. 13.4.2
      12. FINANCIAL OVERVIEW
      13. INC.
      14. 13.6.1
      15. COMPANY OVERVIEW
      16. 13.6.4
    21. COMPANY OVERVIEW
    22. FINANCIAL OVERVIEW
    23. PRODUCTS OFFERED
    24. KEY DEVELOPMENTS
    25. SWOT ANALYSIS
    26. KEY STRATEGY
      1. COSMOPLAST UAE
        1. COMPANY OVERVIEW
        2. KEY DEVELOPMENTS
        3. SWOT ANALYSIS
      2. ACTION PACKAGING
        1. COMPANY OVERVIEW
        2. KEY DEVELOPMENTS
        3. SWOT ANALYSIS
      3. THE CLOROX COMPANY
        1. COMPANY OVERVIEW
        2. PRODUCTS OFFERED
        3. KEY DEVELOPMENTS
        4. SWOT ANALYSIS
        5. KEY STRATEGY
      4. INTERNATIONAL PLASTICS
        1. COMPANY OVERVIEW
        2. PRODUCTS OFFERED
        3. KEY DEVELOPMENTS
        4. SWOT ANALYSIS
        5. KEY STRATEGY
      5. NOVOLEX (US)
        1. PRODUCTS OFFERED
        2. KEY DEVELOPMENTS
    27. SWOT ANALYSIS
      1. OVERVIEW
      2. ANALYSIS
      3. OVERVIEW
      4. ANALYSIS
      5. OVERVIEW
      6. ANALYSIS
      7. 13.10.1
      8. COMPANY OVERVIEW
      9. 13.11.1
      10. COMPANY OVERVIEW
      11. AS
      12. DEVELOPMENTS
      13. INDUSTRIES INC.
      14. 13.13.3
      15. KEY DEVELOPMENTS
      16. 13.14
      17. UNIVERSAL PLASTIC & METAL MANUFACTURING LIMITED
      18. OVERVIEW
      19. 13.15.4
    28. KEY STRATEGY
      1. NOVPLASTA, S.R.O
        1. COMPANY
        2. PRODUCTS OFFERED
        3. KEY DEVELOPMENTS
        4. SWOT
        5. KEY STRATEGY
      2. INTEPLAST GROUP
        1. COMPANY
        2. PRODUCTS OFFERED
        3. KEY DEVELOPMENTS
        4. SWOT
        5. KEY STRATEGY
      3. POLY-AMERICA, L.P
        1. COMPANY
        2. PRODUCTS OFFERED
        3. KEY DEVELOPMENTS
        4. SWOT
        5. KEY STRATEGY
      4. REYNOLDS CONSUMER PRODUCTS LLC
        1. PRODUCTS OFFERED
        2. KEY DEVELOPMENTS
        3. SWOT ANALYSIS
        4. KEY STRATEGY
      5. PLASTA GROUP
        1. PRODUCTS OFFERED
        2. KEY DEVELOPMENTS
        3. SWOT ANALYSIS
        4. KEY STRATEGY
      6. BIOBAG INTERNATIONAL
        1. COMPANY OVERVIEW
        2. PRODUCTS OFFERED
        3. KEY
        4. SWOT ANALYSIS
        5. KEY STRATEGY
      7. POLYKAR
        1. COMPANY OVERVIEW
        2. PRODUCTS OFFERED
        3. SWOT ANALYSIS
        4. KEY STRATEGY
        5. COMPANY OVERVIEW
        6. PRODUCTS OFFERED
        7. KEY DEVELOPMENTS
        8. SWOT ANALYSIS
        9. KEY STRATEGY
      8. ALPHA OMEGA PACK FACTORY L.L.C
        1. COMPANY
        2. PRODUCTS OFFERED
        3. KEY DEVELOPMENTS
    29. SWOT ANALYSIS
    30. KEY STRATEGY
    31. LIST OF TABLES
      1. TABLE
    32. QFD MODELING FOR MARKET SHARE ASSESSMENT
    33. GLOBAL TRASH BAG MARKET,
      1. BY PRODUCT TYPE, 2019-2035 (USD BILLION)
    34. GLOBAL TRASH BAG MARKET, BY
      1. PRODUCT TYPE, 2019-2035 (BILLION KG)
    35. GLOBAL TRASH BAG MARKET, BY MATERIAL,
    36. GLOBAL TRASH BAG MARKET, BY MATERIAL, 2019-2035
      1. (BILLION KG)
    37. GLOBAL TRASH BAG MARKET, BY CAPACITY, 2019-2035 (USD BILLION)
    38. GLOBAL TRASH BAG MARKET, BY CAPACITY, 2019-2035 (BILLION KG)
      1. TABLE
    39. GLOBAL TRASH BAG MARKET, BY DISTRIBUTION CHANNEL, 2019-2035 (USD BILLION)
      1. TABLE
    40. GLOBAL TRASH BAG MARKET, BY DISTRIBUTION CHANNEL, 2019-2035 (BILLION KG)
      1. TABLE
    41. GLOBAL TRASH BAG MARKET, BY END-USE INDUSTRY, 2019-2035 (USD BILLION)
      1. TABLE
    42. GLOBAL TRASH BAG MARKET, BY END-USE INDUSTRY, 2019-2035 (BILLION KG)
      1. TABLE
    43. GLOBAL TRASH BAG MARKET, BY REGION, 2019-2035 (USD BILLION)
    44. GLOBAL
    45. TRASH BAG MARKET, BY REGION, 2019-2035 (BILLION KG)
    46. NORTH AMERICA
    47. TRASH BAG MARKET, BY PRODUCT TYPE, 2019-2035 (USD BILLION)
    48. NORTH AMERICA
    49. TRASH BAG MARKET, BY PRODUCT TYPE, 2019-2035 (BILLION KG)
    50. NORTH AMERICA
    51. TRASH BAG MARKET, BY MATERIAL, 2019-2035 (USD BILLION)
    52. NORTH AMERICA
    53. TRASH BAG MARKET, BY MATERIAL, 2019-2035 (BILLION KG)
    54. NORTH AMERICA
    55. TRASH BAG MARKET, BY CAPACITY, 2019-2035 (USD BILLION)
    56. NORTH AMERICA
    57. TRASH BAG MARKET, BY CAPACITY, 2019-2035 (BILLION KG)
    58. NORTH AMERICA
    59. TRASH BAG MARKET, BY DISTRIBUTION CHANNEL, 2019-2035 (USD BILLION)
      1. TABLE 21
    60. NORTH AMERICA TRASH BAG MARKET, BY DISTRIBUTION CHANNEL, 2019-2035 (BILLION KG)
    61. NORTH AMERICA TRASH BAG MARKET, BY END-USE INDUSTRY, 2019-2035 (USD BILLION)
    62. NORTH AMERICA TRASH BAG MARKET, BY END-USE INDUSTRY, 2019-2035 (BILLION
      1. KG)
    63. US TRASH BAG MARKET, BY PRODUCT TYPE, 2019-2035 (USD BILLION)
    64. US TRASH BAG MARKET, BY PRODUCT TYPE, 2019-2035 (BILLION KG)
      1. TABLE
    65. US TRASH BAG MARKET, BY MATERIAL, 2019-2035 (USD BILLION)
    66. US TRASH
    67. BAG MARKET, BY MATERIAL, 2019-2035 (BILLION KG)
    68. US TRASH BAG MARKET,
      1. BY CAPACITY, 2019-2035 (USD BILLION)
    69. US TRASH BAG MARKET, BY CAPACITY,
    70. US TRASH BAG MARKET, BY DISTRIBUTION CHANNEL,
    71. US TRASH BAG MARKET, BY DISTRIBUTION CHANNEL,
    72. US TRASH BAG MARKET, BY END-USE INDUSTRY, 2019-2035
      1. (USD BILLION)
    73. US TRASH BAG MARKET, BY END-USE INDUSTRY, 2019-2035
      1. (BILLION KG)
    74. CANADA TRASH BAG MARKET, BY PRODUCT TYPE, 2019-2035 (USD
      1. BILLION)
    75. CANADA TRASH BAG MARKET, BY PRODUCT TYPE, 2019-2035 (BILLION
      1. KG)
    76. CANADA TRASH BAG MARKET, BY MATERIAL, 2019-2035 (USD BILLION)
    77. CANADA TRASH BAG MARKET, BY MATERIAL, 2019-2035 (BILLION KG)
      1. TABLE
    78. CANADA TRASH BAG MARKET, BY CAPACITY, 2019-2035 (USD BILLION)
    79. CANADA
    80. TRASH BAG MARKET, BY CAPACITY, 2019-2035 (BILLION KG)
    81. CANADA TRASH
    82. BAG MARKET, BY DISTRIBUTION CHANNEL, 2019-2035 (USD BILLION)
    83. CANADA
    84. TRASH BAG MARKET, BY DISTRIBUTION CHANNEL, 2019-2035 (BILLION KG)
      1. TABLE 42
    85. CANADA TRASH BAG MARKET, BY END-USE INDUSTRY, 2019-2035 (USD BILLION)
      1. TABLE
    86. CANADA TRASH BAG MARKET, BY END-USE INDUSTRY, 2019-2035 (BILLION KG)
      1. TABLE
    87. MEXICO TRASH BAG MARKET, BY PRODUCT TYPE, 2019-2035 (USD BILLION)
      1. TABLE
    88. MEXICO TRASH BAG MARKET, BY PRODUCT TYPE, 2019-2035 (BILLION KG)
      1. TABLE 46
    89. MEXICO TRASH BAG MARKET, BY MATERIAL, 2019-2035 (USD BILLION)
    90. MEXICO
    91. TRASH BAG MARKET, BY MATERIAL, 2019-2035 (BILLION KG)
    92. MEXICO TRASH
    93. BAG MARKET, BY CAPACITY, 2019-2035 (USD BILLION)
    94. MEXICO TRASH BAG
    95. MARKET, BY CAPACITY, 2019-2035 (BILLION KG)
    96. MEXICO TRASH BAG MARKET,
      1. BY DISTRIBUTION CHANNEL, 2019-2035 (USD BILLION)
    97. MEXICO TRASH BAG
    98. MARKET, BY DISTRIBUTION CHANNEL, 2019-2035 (BILLION KG)
    99. MEXICO TRASH
    100. BAG MARKET, BY END-USE INDUSTRY, 2019-2035 (USD BILLION)
    101. MEXICO TRASH
    102. BAG MARKET, BY END-USE INDUSTRY, 2019-2035 (BILLION KG)
    103. EUROPE TRASH
    104. BAG MARKET, BY PRODUCT TYPE, 2019-2035 (USD BILLION)
    105. EUROPE TRASH
    106. BAG MARKET, BY PRODUCT TYPE, 2019-2035 (BILLION KG)
    107. EUROPE TRASH BAG
    108. MARKET, BY MATERIAL, 2019-2035 (USD BILLION)
    109. EUROPE TRASH BAG MARKET,
      1. BY MATERIAL, 2019-2035 (BILLION KG)
    110. EUROPE TRASH BAG MARKET, BY CAPACITY,
    111. EUROPE TRASH BAG MARKET, BY CAPACITY, 2019-2035
      1. (BILLION KG)
    112. EUROPE TRASH BAG MARKET, BY DISTRIBUTION CHANNEL, 2019-2035
      1. (USD BILLION)
    113. EUROPE TRASH BAG MARKET, BY DISTRIBUTION CHANNEL, 2019-2035
      1. (BILLION KG)
    114. EUROPE TRASH BAG MARKET, BY END-USE INDUSTRY, 2019-2035
      1. (USD BILLION)
    115. EUROPE TRASH BAG MARKET, BY END-USE INDUSTRY, 2019-2035
      1. (BILLION KG)
    116. RUSSIA TRASH BAG MARKET, BY PRODUCT TYPE, 2019-2035 (USD
      1. BILLION)
    117. RUSSIA TRASH BAG MARKET, BY PRODUCT TYPE, 2019-2035 (BILLION
      1. KG)
    118. RUSSIA TRASH BAG MARKET, BY MATERIAL, 2019-2035 (USD BILLION)
    119. RUSSIA TRASH BAG MARKET, BY MATERIAL, 2019-2035 (BILLION KG)
      1. TABLE
    120. RUSSIA TRASH BAG MARKET, BY CAPACITY, 2019-2035 (USD BILLION)
    121. RUSSIA
    122. TRASH BAG MARKET, BY CAPACITY, 2019-2035 (BILLION KG)
    123. RUSSIA TRASH
    124. BAG MARKET, BY DISTRIBUTION CHANNEL, 2019-2035 (USD BILLION)
    125. RUSSIA
    126. TRASH BAG MARKET, BY DISTRIBUTION CHANNEL, 2019-2035 (BILLION KG)
      1. TABLE 72
    127. RUSSIA TRASH BAG MARKET, BY END-USE INDUSTRY, 2019-2035 (USD BILLION)
      1. TABLE
    128. RUSSIA TRASH BAG MARKET, BY END-USE INDUSTRY, 2019-2035 (BILLION KG)
      1. TABLE
    129. GERMANY TRASH BAG MARKET, BY PRODUCT TYPE, 2019-2035 (USD BILLION)
      1. TABLE
    130. GERMANY TRASH BAG MARKET, BY PRODUCT TYPE, 2019-2035 (BILLION KG)
      1. TABLE
    131. GERMANY TRASH BAG MARKET, BY MATERIAL, 2019-2035 (USD BILLION)
      1. TABLE 77
    132. GERMANY TRASH BAG MARKET, BY MATERIAL, 2019-2035 (BILLION KG)
    133. GERMANY
    134. TRASH BAG MARKET, BY CAPACITY, 2019-2035 (USD BILLION)
    135. GERMANY TRASH
    136. BAG MARKET, BY CAPACITY, 2019-2035 (BILLION KG)
    137. GERMANY TRASH BAG
    138. MARKET, BY DISTRIBUTION CHANNEL, 2019-2035 (USD BILLION)
    139. GERMANY TRASH
    140. BAG MARKET, BY DISTRIBUTION CHANNEL, 2019-2035 (BILLION KG)
    141. GERMANY
    142. TRASH BAG MARKET, BY END-USE INDUSTRY, 2019-2035 (USD BILLION)
    143. GERMANY
    144. TRASH BAG MARKET, BY END-USE INDUSTRY, 2019-2035 (BILLION KG)
    145. UNITED
    146. KINGDOM (UK) TRASH BAG MARKET, BY PRODUCT TYPE, 2019-2035 (USD BILLION)
      1. TABLE
    147. UNITED KINGDOM (UK) TRASH BAG MARKET, BY PRODUCT TYPE, 2019-2035 (BILLION KG)
    148. UNITED KINGDOM (UK) TRASH BAG MARKET, BY MATERIAL, 2019-2035 (USD BILLION)
    149. UNITED KINGDOM (UK) TRASH BAG MARKET, BY MATERIAL, 2019-2035 (BILLION
      1. KG)
    150. UNITED KINGDOM (UK) TRASH BAG MARKET, BY CAPACITY, 2019-2035 (USD
      1. BILLION)
    151. UNITED KINGDOM (UK) TRASH BAG MARKET, BY CAPACITY, 2019-2035
      1. (BILLION KG)
    152. UNITED KINGDOM (UK) TRASH BAG MARKET, BY DISTRIBUTION
      1. CHANNEL, 2019-2035 (USD BILLION)
    153. UNITED KINGDOM (UK) TRASH BAG MARKET,
      1. BY DISTRIBUTION CHANNEL, 2019-2035 (BILLION KG)
    154. UNITED KINGDOM (UK)
    155. TRASH BAG MARKET, BY END-USE INDUSTRY, 2019-2035 (USD BILLION)
    156. UNITED
    157. KINGDOM (UK) TRASH BAG MARKET, BY END-USE INDUSTRY, 2019-2035 (BILLION KG)
      1. TABLE
    158. FRANCE TRASH BAG MARKET, BY PRODUCT TYPE, 2019-2035 (USD BILLION)
      1. TABLE
    159. FRANCE TRASH BAG MARKET, BY PRODUCT TYPE, 2019-2035 (BILLION KG)
      1. TABLE 96
    160. FRANCE TRASH BAG MARKET, BY MATERIAL, 2019-2035 (USD BILLION)
    161. FRANCE
    162. TRASH BAG MARKET, BY MATERIAL, 2019-2035 (BILLION KG)
    163. FRANCE TRASH
    164. BAG MARKET, BY CAPACITY, 2019-2035 (USD BILLION)
    165. FRANCE TRASH BAG
    166. MARKET, BY CAPACITY, 2019-2035 (BILLION KG)
    167. FRANCE TRASH BAG MARKET,
      1. BY DISTRIBUTION CHANNEL, 2019-2035 (USD BILLION)
    168. FRANCE TRASH BAG
    169. MARKET, BY DISTRIBUTION CHANNEL, 2019-2035 (BILLION KG)
    170. FRANCE TRASH
    171. BAG MARKET, BY END-USE INDUSTRY, 2019-2035 (USD BILLION)
    172. FRANCE TRASH
    173. BAG MARKET, BY END-USE INDUSTRY, 2019-2035 (BILLION KG)
    174. ITALY TRASH
    175. BAG MARKET, BY PRODUCT TYPE, 2019-2035 (USD BILLION)
    176. ITALY TRASH
    177. BAG MARKET, BY PRODUCT TYPE, 2019-2035 (BILLION KG)
    178. ITALY TRASH BAG
    179. MARKET, BY MATERIAL, 2019-2035 (USD BILLION)
    180. ITALY TRASH BAG MARKET,
      1. BY MATERIAL, 2019-2035 (BILLION KG)
    181. ITALY TRASH BAG MARKET, BY CAPACITY,
    182. ITALY TRASH BAG MARKET, BY CAPACITY, 2019-2035
      1. (BILLION KG)
    183. ITALY TRASH BAG MARKET, BY DISTRIBUTION CHANNEL, 2019-2035
      1. (USD BILLION)
    184. ITALY TRASH BAG MARKET, BY DISTRIBUTION CHANNEL, 2019-2035
      1. (BILLION KG)
    185. ITALY TRASH BAG MARKET, BY END-USE INDUSTRY, 2019-2035
      1. (USD BILLION)
    186. ITALY TRASH BAG MARKET, BY END-USE INDUSTRY, 2019-2035
      1. (BILLION KG)
    187. SPAIN TRASH BAG MARKET, BY PRODUCT TYPE, 2019-2035 (USD
      1. BILLION)
    188. SPAIN TRASH BAG MARKET, BY PRODUCT TYPE, 2019-2035 (BILLION
      1. KG)
    189. SPAIN TRASH BAG MARKET, BY MATERIAL, 2019-2035 (USD BILLION)
    190. SPAIN TRASH BAG MARKET, BY MATERIAL, 2019-2035 (BILLION KG)
      1. TABLE
    191. SPAIN TRASH BAG MARKET, BY CAPACITY, 2019-2035 (USD BILLION)
      1. TABLE 119
    192. SPAIN TRASH BAG MARKET, BY CAPACITY, 2019-2035 (BILLION KG)
    193. SPAIN
    194. TRASH BAG MARKET, BY DISTRIBUTION CHANNEL, 2019-2035 (USD BILLION)
      1. TABLE 121
    195. SPAIN TRASH BAG MARKET, BY DISTRIBUTION CHANNEL, 2019-2035 (BILLION KG)
      1. TABLE
    196. SPAIN TRASH BAG MARKET, BY END-USE INDUSTRY, 2019-2035 (USD BILLION)
      1. TABLE
    197. SPAIN TRASH BAG MARKET, BY END-USE INDUSTRY, 2019-2035 (BILLION KG)
      1. TABLE
    198. SWITZERLAND TRASH BAG MARKET, BY PRODUCT TYPE, 2019-2035 (USD BILLION)
      1. TABLE
    199. SWITZERLAND TRASH BAG MARKET, BY PRODUCT TYPE, 2019-2035 (BILLION KG)
      1. TABLE
    200. SWITZERLAND TRASH BAG MARKET, BY MATERIAL, 2019-2035 (USD BILLION)
      1. TABLE
    201. SWITZERLAND TRASH BAG MARKET, BY MATERIAL, 2019-2035 (BILLION KG)
      1. TABLE
    202. SWITZERLAND TRASH BAG MARKET, BY CAPACITY, 2019-2035 (USD BILLION)
      1. TABLE
    203. SWITZERLAND TRASH BAG MARKET, BY CAPACITY, 2019-2035 (BILLION KG)
      1. TABLE
    204. SWITZERLAND TRASH BAG MARKET, BY DISTRIBUTION CHANNEL, 2019-2035 (USD BILLION)
    205. SWITZERLAND TRASH BAG MARKET, BY DISTRIBUTION CHANNEL, 2019-2035 (BILLION
      1. KG)
    206. SWITZERLAND TRASH BAG MARKET, BY END-USE INDUSTRY, 2019-2035
      1. (USD BILLION)
    207. SWITZERLAND TRASH BAG MARKET, BY END-USE INDUSTRY,
    208. BELGIUM TRASH BAG MARKET, BY PRODUCT TYPE,
    209. BELGIUM TRASH BAG MARKET, BY PRODUCT TYPE,
    210. BELGIUM TRASH BAG MARKET, BY MATERIAL, 2019-2035
      1. (USD BILLION)
    211. BELGIUM TRASH BAG MARKET, BY MATERIAL, 2019-2035 (BILLION
      1. KG)
    212. BELGIUM TRASH BAG MARKET, BY CAPACITY, 2019-2035 (USD BILLION)
    213. BELGIUM TRASH BAG MARKET, BY CAPACITY, 2019-2035 (BILLION KG)
      1. TABLE
    214. BELGIUM TRASH BAG MARKET, BY DISTRIBUTION CHANNEL, 2019-2035 (USD BILLION)
    215. BELGIUM TRASH BAG MARKET, BY DISTRIBUTION CHANNEL, 2019-2035 (BILLION
      1. KG)
    216. BELGIUM TRASH BAG MARKET, BY END-USE INDUSTRY, 2019-2035 (USD
      1. BILLION)
    217. BELGIUM TRASH BAG MARKET, BY END-USE INDUSTRY, 2019-2035
      1. (BILLION KG)
    218. CZECH REPUBLIC TRASH BAG MARKET, BY PRODUCT TYPE, 2019-2035
      1. (USD BILLION)
    219. CZECH REPUBLIC TRASH BAG MARKET, BY PRODUCT TYPE, 2019-2035
      1. (BILLION KG)
    220. CZECH REPUBLIC TRASH BAG MARKET, BY MATERIAL, 2019-2035
      1. (USD BILLION)
    221. CZECH REPUBLIC TRASH BAG MARKET, BY MATERIAL, 2019-2035
      1. (BILLION KG)
    222. CZECH REPUBLIC TRASH BAG MARKET, BY CAPACITY, 2019-2035
      1. (USD BILLION)
    223. CZECH REPUBLIC TRASH BAG MARKET, BY CAPACITY, 2019-2035
      1. (BILLION KG)
    224. CZECH REPUBLIC TRASH BAG MARKET, BY DISTRIBUTION CHANNEL,
    225. CZECH REPUBLIC TRASH BAG MARKET, BY DISTRIBUTION
      1. CHANNEL, 2019-2035 (BILLION KG)
    226. CZECH REPUBLIC TRASH BAG MARKET,
      1. BY END-USE INDUSTRY, 2019-2035 (USD BILLION)
    227. CZECH REPUBLIC TRASH
    228. BAG MARKET, BY END-USE INDUSTRY, 2019-2035 (BILLION KG)
    229. PORTUGAL
    230. TRASH BAG MARKET, BY PRODUCT TYPE, 2019-2035 (USD BILLION)
    231. PORTUGAL
    232. TRASH BAG MARKET, BY PRODUCT TYPE, 2019-2035 (BILLION KG)
    233. PORTUGAL
    234. TRASH BAG MARKET, BY MATERIAL, 2019-2035 (USD BILLION)
    235. PORTUGAL TRASH
    236. BAG MARKET, BY MATERIAL, 2019-2035 (BILLION KG)
    237. PORTUGAL TRASH BAG
    238. MARKET, BY CAPACITY, 2019-2035 (USD BILLION)
    239. PORTUGAL TRASH BAG MARKET,
      1. BY CAPACITY, 2019-2035 (BILLION KG)
    240. PORTUGAL TRASH BAG MARKET, BY
      1. DISTRIBUTION CHANNEL, 2019-2035 (USD BILLION)
    241. PORTUGAL TRASH BAG
    242. MARKET, BY DISTRIBUTION CHANNEL, 2019-2035 (BILLION KG)
    243. PORTUGAL
    244. TRASH BAG MARKET, BY END-USE INDUSTRY, 2019-2035 (USD BILLION)
    245. PORTUGAL
    246. TRASH BAG MARKET, BY END-USE INDUSTRY, 2019-2035 (BILLION KG)
    247. ROE
    248. TRASH BAG MARKET, BY PRODUCT TYPE, 2019-2035 (USD BILLION)
    249. ROE TRASH
    250. BAG MARKET, BY PRODUCT TYPE, 2019-2035 (BILLION KG)
    251. ROE TRASH BAG
    252. MARKET, BY MATERIAL, 2019-2035 (USD BILLION)
    253. ROE TRASH BAG MARKET,
      1. BY MATERIAL, 2019-2035 (BILLION KG)
    254. ROE TRASH BAG MARKET, BY CAPACITY,
    255. ROE TRASH BAG MARKET, BY CAPACITY, 2019-2035
      1. (BILLION KG)
    256. ROE TRASH BAG MARKET, BY DISTRIBUTION CHANNEL, 2019-2035
      1. (USD BILLION)
    257. ROE TRASH BAG MARKET, BY DISTRIBUTION CHANNEL, 2019-2035
      1. (BILLION KG)
    258. ROE TRASH BAG MARKET, BY END-USE INDUSTRY, 2019-2035
      1. (USD BILLION)
    259. ROE TRASH BAG MARKET, BY END-USE INDUSTRY, 2019-2035
      1. (BILLION KG)
    260. ASIA-PACIFIC TRASH BAG MARKET, BY PRODUCT TYPE, 2019-2035
      1. (USD BILLION)
    261. ASIA-PACIFIC TRASH BAG MARKET, BY PRODUCT TYPE, 2019-2035
      1. (BILLION KG)
    262. ASIA-PACIFIC TRASH BAG MARKET, BY MATERIAL, 2019-2035
      1. (USD BILLION)
    263. ASIA-PACIFIC TRASH BAG MARKET, BY MATERIAL, 2019-2035
      1. (BILLION KG)
    264. ASIA-PACIFIC TRASH BAG MARKET, BY CAPACITY, 2019-2035
      1. (USD BILLION)
    265. ASIA-PACIFIC TRASH BAG MARKET, BY CAPACITY, 2019-2035
      1. (BILLION KG)
    266. ASIA-PACIFIC TRASH BAG MARKET, BY DISTRIBUTION CHANNEL,
    267. ASIA-PACIFIC TRASH BAG MARKET, BY DISTRIBUTION
      1. CHANNEL, 2019-2035 (BILLION KG)
    268. ASIA-PACIFIC TRASH BAG MARKET, BY
      1. END-USE INDUSTRY, 2019-2035 (USD BILLION)
    269. ASIA-PACIFIC TRASH BAG
    270. MARKET, BY END-USE INDUSTRY, 2019-2035 (BILLION KG)
    271. INDIA TRASH BAG
    272. MARKET, BY PRODUCT TYPE, 2019-2035 (USD BILLION)
    273. INDIA TRASH BAG
    274. MARKET, BY PRODUCT TYPE, 2019-2035 (BILLION KG)
    275. INDIA TRASH BAG MARKET,
      1. BY MATERIAL, 2019-2035 (USD BILLION)
    276. INDIA TRASH BAG MARKET, BY MATERIAL,
    277. INDIA TRASH BAG MARKET, BY CAPACITY, 2019-2035
      1. (USD BILLION)
    278. INDIA TRASH BAG MARKET, BY CAPACITY, 2019-2035 (BILLION
      1. KG)
    279. INDIA TRASH BAG MARKET, BY DISTRIBUTION CHANNEL, 2019-2035 (USD
      1. BILLION)
    280. INDIA TRASH BAG MARKET, BY DISTRIBUTION CHANNEL, 2019-2035
      1. (BILLION KG)
    281. INDIA TRASH BAG MARKET, BY END-USE INDUSTRY, 2019-2035
      1. (USD BILLION)
    282. INDIA TRASH BAG MARKET, BY END-USE INDUSTRY, 2019-2035
      1. (BILLION KG)
    283. JAPAN TRASH BAG MARKET, BY PRODUCT TYPE, 2019-2035 (USD
      1. BILLION)
    284. JAPAN TRASH BAG MARKET, BY PRODUCT TYPE, 2019-2035 (BILLION
      1. KG)
    285. JAPAN TRASH BAG MARKET, BY MATERIAL, 2019-2035 (USD BILLION)
    286. JAPAN TRASH BAG MARKET, BY MATERIAL, 2019-2035 (BILLION KG)
      1. TABLE
    287. JAPAN TRASH BAG MARKET, BY CAPACITY, 2019-2035 (USD BILLION)
      1. TABLE 199
    288. JAPAN TRASH BAG MARKET, BY CAPACITY, 2019-2035 (BILLION KG)
    289. JAPAN
    290. TRASH BAG MARKET, BY DISTRIBUTION CHANNEL, 2019-2035 (USD BILLION)
      1. TABLE 201
    291. JAPAN TRASH BAG MARKET, BY DISTRIBUTION CHANNEL, 2019-2035 (BILLION KG)
      1. TABLE
    292. JAPAN TRASH BAG MARKET, BY END-USE INDUSTRY, 2019-2035 (USD BILLION)
      1. TABLE
    293. JAPAN TRASH BAG MARKET, BY END-USE INDUSTRY, 2019-2035 (BILLION KG)
      1. TABLE
    294. SOUTH KOREA TRASH BAG MARKET, BY PRODUCT TYPE, 2019-2035 (USD BILLION)
      1. TABLE
    295. SOUTH KOREA TRASH BAG MARKET, BY PRODUCT TYPE, 2019-2035 (BILLION KG)
      1. TABLE
    296. SOUTH KOREA TRASH BAG MARKET, BY MATERIAL, 2019-2035 (USD BILLION)
      1. TABLE
    297. SOUTH KOREA TRASH BAG MARKET, BY MATERIAL, 2019-2035 (BILLION KG)
      1. TABLE
    298. SOUTH KOREA TRASH BAG MARKET, BY CAPACITY, 2019-2035 (USD BILLION)
      1. TABLE
    299. SOUTH KOREA TRASH BAG MARKET, BY CAPACITY, 2019-2035 (BILLION KG)
      1. TABLE
    300. SOUTH KOREA TRASH BAG MARKET, BY DISTRIBUTION CHANNEL, 2019-2035 (USD BILLION)
    301. SOUTH KOREA TRASH BAG MARKET, BY DISTRIBUTION CHANNEL, 2019-2035 (BILLION
      1. KG)
    302. SOUTH KOREA TRASH BAG MARKET, BY END-USE INDUSTRY, 2019-2035
      1. (USD BILLION)
    303. SOUTH KOREA TRASH BAG MARKET, BY END-USE INDUSTRY,
    304. MALAYSIA TRASH BAG MARKET, BY PRODUCT TYPE,
    305. MALAYSIA TRASH BAG MARKET, BY PRODUCT TYPE,
    306. MALAYSIA TRASH BAG MARKET, BY MATERIAL, 2019-2035
      1. (USD BILLION)
    307. MALAYSIA TRASH BAG MARKET, BY MATERIAL, 2019-2035 (BILLION
      1. KG)
    308. MALAYSIA TRASH BAG MARKET, BY CAPACITY, 2019-2035 (USD BILLION)
    309. MALAYSIA TRASH BAG MARKET, BY CAPACITY, 2019-2035 (BILLION KG)
      1. TABLE
    310. MALAYSIA TRASH BAG MARKET, BY DISTRIBUTION CHANNEL, 2019-2035 (USD BILLION)
    311. MALAYSIA TRASH BAG MARKET, BY DISTRIBUTION CHANNEL, 2019-2035 (BILLION
      1. KG)
    312. MALAYSIA TRASH BAG MARKET, BY END-USE INDUSTRY, 2019-2035 (USD
      1. BILLION)
    313. MALAYSIA TRASH BAG MARKET, BY END-USE INDUSTRY, 2019-2035
      1. (BILLION KG)
    314. THAILAND TRASH BAG MARKET, BY PRODUCT TYPE, 2019-2035
      1. (USD BILLION)
    315. THAILAND TRASH BAG MARKET, BY PRODUCT TYPE, 2019-2035
      1. (BILLION KG)
    316. THAILAND TRASH BAG MARKET, BY MATERIAL, 2019-2035 (USD
      1. BILLION)
    317. THAILAND TRASH BAG MARKET, BY MATERIAL, 2019-2035 (BILLION
      1. KG)
    318. THAILAND TRASH BAG MARKET, BY CAPACITY, 2019-2035 (USD BILLION)
    319. THAILAND TRASH BAG MARKET, BY CAPACITY, 2019-2035 (BILLION KG)
      1. TABLE
    320. THAILAND TRASH BAG MARKET, BY DISTRIBUTION CHANNEL, 2019-2035 (USD BILLION)
    321. THAILAND TRASH BAG MARKET, BY DISTRIBUTION CHANNEL, 2019-2035 (BILLION
      1. KG)
    322. THAILAND TRASH BAG MARKET, BY END-USE INDUSTRY, 2019-2035 (USD
      1. BILLION)
    323. THAILAND TRASH BAG MARKET, BY END-USE INDUSTRY, 2019-2035
      1. (BILLION KG)
    324. INDONESIA TRASH BAG MARKET, BY PRODUCT TYPE, 2019-2035
      1. (USD BILLION)
    325. INDONESIA TRASH BAG MARKET, BY PRODUCT TYPE, 2019-2035
      1. (BILLION KG)
    326. INDONESIA TRASH BAG MARKET, BY MATERIAL, 2019-2035 (USD
      1. BILLION)
    327. INDONESIA TRASH BAG MARKET, BY MATERIAL, 2019-2035 (BILLION
      1. KG)
    328. INDONESIA TRASH BAG MARKET, BY CAPACITY, 2019-2035 (USD BILLION)
    329. INDONESIA TRASH BAG MARKET, BY CAPACITY, 2019-2035 (BILLION KG)
      1. TABLE
    330. INDONESIA TRASH BAG MARKET, BY DISTRIBUTION CHANNEL, 2019-2035 (USD BILLION)
    331. INDONESIA TRASH BAG MARKET, BY DISTRIBUTION CHANNEL, 2019-2035 (BILLION
      1. KG)
    332. INDONESIA TRASH BAG MARKET, BY END-USE INDUSTRY, 2019-2035 (USD
      1. BILLION)
    333. INDONESIA TRASH BAG MARKET, BY END-USE INDUSTRY, 2019-2035
      1. (BILLION KG)
    334. REST OF ASIA-PACIFIC TRASH BAG MARKET, BY PRODUCT TYPE,
    335. REST OF ASIA-PACIFIC TRASH BAG MARKET, BY
      1. PRODUCT TYPE, 2019-2035 (BILLION KG)
    336. REST OF ASIA-PACIFIC TRASH BAG
    337. MARKET, BY MATERIAL, 2019-2035 (USD BILLION)
    338. REST OF ASIA-PACIFIC
    339. TRASH BAG MARKET, BY MATERIAL, 2019-2035 (BILLION KG)
    340. REST OF ASIA-PACIFIC
    341. TRASH BAG MARKET, BY CAPACITY, 2019-2035 (USD BILLION)
    342. REST OF ASIA-PACIFIC
    343. TRASH BAG MARKET, BY CAPACITY, 2019-2035 (BILLION KG)
    344. REST OF ASIA-PACIFIC
    345. TRASH BAG MARKET, BY DISTRIBUTION CHANNEL, 2019-2035 (USD BILLION)
      1. TABLE 251
    346. REST OF ASIA-PACIFIC TRASH BAG MARKET, BY DISTRIBUTION CHANNEL, 2019-2035 (BILLION
      1. KG)
    347. REST OF ASIA-PACIFIC TRASH BAG MARKET, BY END-USE INDUSTRY, 2019-2035
      1. (USD BILLION)
    348. REST OF ASIA-PACIFIC TRASH BAG MARKET, BY END-USE INDUSTRY,
    349. LATIN AMERICA TRASH BAG MARKET, BY PRODUCT
      1. TYPE, 2019-2035 (USD BILLION)
    350. LATIN AMERICA TRASH BAG MARKET, BY
      1. PRODUCT TYPE, 2019-2035 (BILLION KG)
    351. LATIN AMERICA TRASH BAG MARKET,
      1. BY MATERIAL, 2019-2035 (USD BILLION)
    352. LATIN AMERICA TRASH BAG MARKET,
      1. BY MATERIAL, 2019-2035 (BILLION KG)
    353. LATIN AMERICA TRASH BAG MARKET,
      1. BY CAPACITY, 2019-2035 (USD BILLION)
    354. LATIN AMERICA TRASH BAG MARKET,
      1. BY CAPACITY, 2019-2035 (BILLION KG)
    355. LATIN AMERICA TRASH BAG MARKET,
      1. BY DISTRIBUTION CHANNEL, 2019-2035 (USD BILLION)
    356. LATIN AMERICA TRASH
    357. BAG MARKET, BY DISTRIBUTION CHANNEL, 2019-2035 (BILLION KG)
    358. LATIN
    359. AMERICA TRASH BAG MARKET, BY END-USE INDUSTRY, 2019-2035 (USD BILLION)
      1. TABLE
    360. LATIN AMERICA TRASH BAG MARKET, BY END-USE INDUSTRY, 2019-2035 (BILLION KG)
    361. BRAZIL TRASH BAG MARKET, BY PRODUCT TYPE, 2019-2035 (USD BILLION)
    362. BRAZIL TRASH BAG MARKET, BY PRODUCT TYPE, 2019-2035 (BILLION KG)
    363. BRAZIL TRASH BAG MARKET, BY MATERIAL, 2019-2035 (USD BILLION)
      1. TABLE
    364. BRAZIL TRASH BAG MARKET, BY MATERIAL, 2019-2035 (BILLION KG)
      1. TABLE 268
    365. BRAZIL TRASH BAG MARKET, BY CAPACITY, 2019-2035 (USD BILLION)
    366. BRAZIL
    367. TRASH BAG MARKET, BY CAPACITY, 2019-2035 (BILLION KG)
    368. BRAZIL TRASH
    369. BAG MARKET, BY DISTRIBUTION CHANNEL, 2019-2035 (USD BILLION)
    370. BRAZIL
    371. TRASH BAG MARKET, BY DISTRIBUTION CHANNEL, 2019-2035 (BILLION KG)
      1. TABLE 272
    372. BRAZIL TRASH BAG MARKET, BY END-USE INDUSTRY, 2019-2035 (USD BILLION)
      1. TABLE
    373. BRAZIL TRASH BAG MARKET, BY END-USE INDUSTRY, 2019-2035 (BILLION KG)
      1. TABLE
    374. COLOMBIA TRASH BAG MARKET, BY PRODUCT TYPE, 2019-2035 (USD BILLION)
      1. TABLE
    375. COLOMBIA TRASH BAG MARKET, BY PRODUCT TYPE, 2019-2035 (BILLION KG)
      1. TABLE
    376. COLOMBIA TRASH BAG MARKET, BY MATERIAL, 2019-2035 (USD BILLION)
      1. TABLE 277
    377. COLOMBIA TRASH BAG MARKET, BY MATERIAL, 2019-2035 (BILLION KG)
    378. COLOMBIA
    379. TRASH BAG MARKET, BY CAPACITY, 2019-2035 (USD BILLION)
    380. COLOMBIA TRASH
    381. BAG MARKET, BY CAPACITY, 2019-2035 (BILLION KG)
    382. COLOMBIA TRASH BAG
    383. MARKET, BY DISTRIBUTION CHANNEL, 2019-2035 (USD BILLION)
    384. COLOMBIA
    385. TRASH BAG MARKET, BY DISTRIBUTION CHANNEL, 2019-2035 (BILLION KG)
      1. TABLE 282
    386. COLOMBIA TRASH BAG MARKET, BY END-USE INDUSTRY, 2019-2035 (USD BILLION)
      1. TABLE
    387. COLOMBIA TRASH BAG MARKET, BY END-USE INDUSTRY, 2019-2035 (BILLION KG)
      1. TABLE
    388. ARGENTINA TRASH BAG MARKET, BY PRODUCT TYPE, 2019-2035 (USD BILLION)
      1. TABLE
    389. ARGENTINA TRASH BAG MARKET, BY PRODUCT TYPE, 2019-2035 (BILLION KG)
      1. TABLE
    390. ARGENTINA TRASH BAG MARKET, BY MATERIAL, 2019-2035 (USD BILLION)
      1. TABLE
    391. ARGENTINA TRASH BAG MARKET, BY MATERIAL, 2019-2035 (BILLION KG)
      1. TABLE 288
    392. ARGENTINA TRASH BAG MARKET, BY CAPACITY, 2019-2035 (USD BILLION)
      1. TABLE 289
    393. ARGENTINA TRASH BAG MARKET, BY CAPACITY, 2019-2035 (BILLION KG)
    394. ARGENTINA
    395. TRASH BAG MARKET, BY DISTRIBUTION CHANNEL, 2019-2035 (USD BILLION)
      1. TABLE 291
    396. ARGENTINA TRASH BAG MARKET, BY DISTRIBUTION CHANNEL, 2019-2035 (BILLION KG)
      1. TABLE
    397. ARGENTINA TRASH BAG MARKET, BY END-USE INDUSTRY, 2019-2035 (USD BILLION)
    398. ARGENTINA TRASH BAG MARKET, BY END-USE INDUSTRY, 2019-2035 (BILLION
      1. KG)
    399. PERU TRASH BAG MARKET, BY PRODUCT TYPE, 2019-2035 (USD BILLION)
    400. PERU TRASH BAG MARKET, BY PRODUCT TYPE, 2019-2035 (BILLION KG)
      1. TABLE
    401. PERU TRASH BAG MARKET, BY MATERIAL, 2019-2035 (USD BILLION)
    402. PERU
    403. TRASH BAG MARKET, BY MATERIAL, 2019-2035 (BILLION KG)
    404. PERU TRASH
    405. BAG MARKET, BY CAPACITY, 2019-2035 (USD BILLION)
    406. PERU TRASH BAG MARKET,
      1. BY CAPACITY, 2019-2035 (BILLION KG)
    407. PERU TRASH BAG MARKET, BY DISTRIBUTION
      1. CHANNEL, 2019-2035 (USD BILLION)
    408. PERU TRASH BAG MARKET, BY DISTRIBUTION
      1. CHANNEL, 2019-2035 (BILLION KG)
    409. PERU TRASH BAG MARKET, BY END-USE
      1. INDUSTRY, 2019-2035 (USD BILLION)
    410. PERU TRASH BAG MARKET, BY END-USE
      1. INDUSTRY, 2019-2035 (BILLION KG)
    411. VENEZUELA TRASH BAG MARKET, BY PRODUCT
      1. TYPE, 2019-2035 (USD BILLION)
    412. VENEZUELA TRASH BAG MARKET, BY PRODUCT
      1. TYPE, 2019-2035 (BILLION KG)
    413. VENEZUELA TRASH BAG MARKET, BY MATERIAL,
    414. VENEZUELA TRASH BAG MARKET, BY MATERIAL,
    415. VENEZUELA TRASH BAG MARKET, BY CAPACITY, 2019-2035
      1. (USD BILLION)
    416. VENEZUELA TRASH BAG MARKET, BY CAPACITY, 2019-2035
      1. (BILLION KG)
    417. VENEZUELA TRASH BAG MARKET, BY DISTRIBUTION CHANNEL,
    418. VENEZUELA TRASH BAG MARKET, BY DISTRIBUTION
      1. CHANNEL, 2019-2035 (BILLION KG)
    419. VENEZUELA TRASH BAG MARKET, BY END-USE
      1. INDUSTRY, 2019-2035 (USD BILLION)
    420. VENEZUELA TRASH BAG MARKET, BY
      1. END-USE INDUSTRY, 2019-2035 (BILLION KG)
    421. CHILE TRASH BAG MARKET,
      1. BY PRODUCT TYPE, 2019-2035 (USD BILLION)
    422. CHILE TRASH BAG MARKET,
      1. BY PRODUCT TYPE, 2019-2035 (BILLION KG)
    423. CHILE TRASH BAG MARKET, BY
      1. MATERIAL, 2019-2035 (USD BILLION)
    424. CHILE TRASH BAG MARKET, BY MATERIAL,
    425. CHILE TRASH BAG MARKET, BY CAPACITY, 2019-2035
      1. (USD BILLION)
    426. CHILE TRASH BAG MARKET, BY CAPACITY, 2019-2035 (BILLION
      1. KG)
    427. CHILE TRASH BAG MARKET, BY DISTRIBUTION CHANNEL, 2019-2035 (USD
      1. BILLION)
    428. CHILE TRASH BAG MARKET, BY DISTRIBUTION CHANNEL, 2019-2035
      1. (BILLION KG)
    429. CHILE TRASH BAG MARKET, BY END-USE INDUSTRY, 2019-2035
      1. (USD BILLION)
    430. CHILE TRASH BAG MARKET, BY END-USE INDUSTRY, 2019-2035
      1. (BILLION KG)
    431. PANAMA TRASH BAG MARKET, BY PRODUCT TYPE, 2019-2035
      1. (USD BILLION)
    432. PANAMA TRASH BAG MARKET, BY PRODUCT TYPE, 2019-2035
      1. (BILLION KG)
    433. PANAMA TRASH BAG MARKET, BY MATERIAL, 2019-2035 (USD
      1. BILLION)
    434. PANAMA TRASH BAG MARKET, BY MATERIAL, 2019-2035 (BILLION
      1. KG)
    435. PANAMA TRASH BAG MARKET, BY CAPACITY, 2019-2035 (USD BILLION)
    436. PANAMA TRASH BAG MARKET, BY CAPACITY, 2019-2035 (BILLION KG)
      1. TABLE
    437. PANAMA TRASH BAG MARKET, BY DISTRIBUTION CHANNEL, 2019-2035 (USD BILLION)
    438. PANAMA TRASH BAG MARKET, BY DISTRIBUTION CHANNEL, 2019-2035 (BILLION
      1. KG)
    439. PANAMA TRASH BAG MARKET, BY END-USE INDUSTRY, 2019-2035 (USD
      1. BILLION)
    440. PANAMA TRASH BAG MARKET, BY END-USE INDUSTRY, 2019-2035
      1. (BILLION KG)
    441. REST OF LATAM TRASH BAG MARKET, BY PRODUCT TYPE, 2019-2035
      1. (USD BILLION)
    442. REST OF LATAM TRASH BAG MARKET, BY PRODUCT TYPE, 2019-2035
      1. (BILLION KG)
    443. REST OF LATAM TRASH BAG MARKET, BY MATERIAL, 2019-2035
      1. (USD BILLION)
    444. REST OF LATAM TRASH BAG MARKET, BY MATERIAL, 2019-2035
      1. (BILLION KG)
    445. REST OF LATAM TRASH BAG MARKET, BY CAPACITY, 2019-2035
      1. (USD BILLION)
    446. REST OF LATAM TRASH BAG MARKET, BY CAPACITY, 2019-2035
      1. (BILLION KG)
    447. REST OF LATAM TRASH BAG MARKET, BY DISTRIBUTION CHANNEL,
    448. REST OF LATAM TRASH BAG MARKET, BY DISTRIBUTION
      1. CHANNEL, 2019-2035 (BILLION KG)
    449. REST OF LATAM TRASH BAG MARKET, BY
      1. END-USE INDUSTRY, 2019-2035 (USD BILLION)
    450. REST OF LATAM TRASH BAG
    451. MARKET, BY END-USE INDUSTRY, 2019-2035 (BILLION KG)
    452. AFRICA TRASH
    453. BAG MARKET, BY PRODUCT TYPE, 2019-2035 (USD BILLION)
    454. AFRICA TRASH
    455. BAG MARKET, BY PRODUCT TYPE, 2019-2035 (BILLION KG)
    456. AFRICA TRASH
    457. BAG MARKET, BY MATERIAL, 2019-2035 (USD BILLION)
    458. AFRICA TRASH BAG
    459. MARKET, BY MATERIAL, 2019-2035 (BILLION KG)
    460. AFRICA TRASH BAG MARKET,
      1. BY CAPACITY, 2019-2035 (USD BILLION)
    461. AFRICA TRASH BAG MARKET, BY
      1. CAPACITY, 2019-2035 (BILLION KG)
    462. AFRICA TRASH BAG MARKET, BY DISTRIBUTION
      1. CHANNEL, 2019-2035 (USD BILLION)
    463. AFRICA TRASH BAG MARKET, BY DISTRIBUTION
      1. CHANNEL, 2019-2035 (BILLION KG)
    464. AFRICA TRASH BAG MARKET, BY END-USE
      1. INDUSTRY, 2019-2035 (USD BILLION)
    465. AFRICA TRASH BAG MARKET, BY END-USE
      1. INDUSTRY, 2019-2035 (BILLION KG)
    466. NIGERIA TRASH BAG MARKET, BY PRODUCT
      1. TYPE, 2019-2035 (USD BILLION)
    467. NIGERIA TRASH BAG MARKET, BY PRODUCT
      1. TYPE, 2019-2035 (BILLION KG)
    468. NIGERIA TRASH BAG MARKET, BY MATERIAL,
    469. NIGERIA TRASH BAG MARKET, BY MATERIAL, 2019-2035
      1. (BILLION KG)
    470. NIGERIA TRASH BAG MARKET, BY CAPACITY, 2019-2035 (USD
      1. BILLION)
    471. NIGERIA TRASH BAG MARKET, BY CAPACITY, 2019-2035 (BILLION
      1. KG)
    472. NIGERIA TRASH BAG MARKET, BY DISTRIBUTION CHANNEL, 2019-2035
      1. (USD BILLION)
    473. NIGERIA TRASH BAG MARKET, BY DISTRIBUTION CHANNEL,
    474. NIGERIA TRASH BAG MARKET, BY END-USE INDUSTRY,
    475. NIGERIA TRASH BAG MARKET, BY END-USE INDUSTRY,
    476. ETHIOPIA TRASH BAG MARKET, BY PRODUCT TYPE,
    477. ETHIOPIA TRASH BAG MARKET, BY PRODUCT TYPE,
    478. ETHIOPIA TRASH BAG MARKET, BY MATERIAL, 2019-2035
      1. (USD BILLION)
    479. ETHIOPIA TRASH BAG MARKET, BY MATERIAL, 2019-2035 (BILLION
      1. KG)
    480. ETHIOPIA TRASH BAG MARKET, BY CAPACITY, 2019-2035 (USD BILLION)
    481. ETHIOPIA TRASH BAG MARKET, BY CAPACITY, 2019-2035 (BILLION KG)
      1. TABLE
    482. ETHIOPIA TRASH BAG MARKET, BY DISTRIBUTION CHANNEL, 2019-2035 (USD BILLION)
    483. ETHIOPIA TRASH BAG MARKET, BY DISTRIBUTION CHANNEL, 2019-2035 (BILLION
      1. KG)
    484. ETHIOPIA TRASH BAG MARKET, BY END-USE INDUSTRY, 2019-2035 (USD
      1. BILLION)
    485. ETHIOPIA TRASH BAG MARKET, BY END-USE INDUSTRY, 2019-2035
      1. (BILLION KG)
    486. EGYPT TRASH BAG MARKET, BY PRODUCT TYPE, 2019-2035 (USD
      1. BILLION)
    487. EGYPT TRASH BAG MARKET, BY PRODUCT TYPE, 2019-2035 (BILLION
      1. KG)
    488. EGYPT TRASH BAG MARKET, BY MATERIAL, 2019-2035 (USD BILLION)
    489. EGYPT TRASH BAG MARKET, BY MATERIAL, 2019-2035 (BILLION KG)
      1. TABLE
    490. EGYPT TRASH BAG MARKET, BY CAPACITY, 2019-2035 (USD BILLION)
      1. TABLE 379
    491. EGYPT TRASH BAG MARKET, BY CAPACITY, 2019-2035 (BILLION KG)
    492. EGYPT
    493. TRASH BAG MARKET, BY DISTRIBUTION CHANNEL, 2019-2035 (USD BILLION)
      1. TABLE 381
    494. EGYPT TRASH BAG MARKET, BY DISTRIBUTION CHANNEL, 2019-2035 (BILLION KG)
      1. TABLE
    495. EGYPT TRASH BAG MARKET, BY END-USE INDUSTRY, 2019-2035 (USD BILLION)
      1. TABLE
    496. EGYPT TRASH BAG MARKET, BY END-USE INDUSTRY, 2019-2035 (BILLION KG)
      1. TABLE
    497. DEMOCRATIC REPUBLIC OF THE CONGO (DRC) TRASH BAG MARKET, BY PRODUCT TYPE, 2019-2035
      1. (USD BILLION)
    498. DEMOCRATIC REPUBLIC OF THE CONGO (DRC) TRASH BAG MARKET,
      1. BY PRODUCT TYPE, 2019-2035 (BILLION KG)
    499. DEMOCRATIC REPUBLIC OF THE
    500. CONGO (DRC) TRASH BAG MARKET, BY MATERIAL, 2019-2035 (USD BILLION)
      1. TABLE 387
    501. DEMOCRATIC REPUBLIC OF THE CONGO (DRC) TRASH BAG MARKET, BY MATERIAL, 2019-2035
      1. (BILLION KG)
    502. DEMOCRATIC REPUBLIC OF THE CONGO (DRC) TRASH BAG MARKET,
      1. BY CAPACITY, 2019-2035 (USD BILLION)
    503. DEMOCRATIC REPUBLIC OF THE CONGO
    504. (DRC) TRASH BAG MARKET, BY CAPACITY, 2019-2035 (BILLION KG)
    505. DEMOCRATIC
    506. REPUBLIC OF THE CONGO (DRC) TRASH BAG MARKET, BY DISTRIBUTION CHANNEL, 2019-2035
      1. (USD BILLION)
    507. DEMOCRATIC REPUBLIC OF THE CONGO (DRC) TRASH BAG MARKET,
      1. BY DISTRIBUTION CHANNEL, 2019-2035 (BILLION KG)
    508. DEMOCRATIC REPUBLIC
    509. OF THE CONGO (DRC) TRASH BAG MARKET, BY END-USE INDUSTRY, 2019-2035 (USD BILLION)
    510. DEMOCRATIC REPUBLIC OF THE CONGO (DRC) TRASH BAG MARKET, BY END-USE
      1. INDUSTRY, 2019-2035 (BILLION KG)
    511. TANZANIA TRASH BAG MARKET, BY PRODUCT
      1. TYPE, 2019-2035 (USD BILLION)
    512. TANZANIA TRASH BAG MARKET, BY PRODUCT
      1. TYPE, 2019-2035 (BILLION KG)
    513. TANZANIA TRASH BAG MARKET, BY MATERIAL,
    514. TANZANIA TRASH BAG MARKET, BY MATERIAL, 2019-2035
      1. (BILLION KG)
    515. TANZANIA TRASH BAG MARKET, BY CAPACITY, 2019-2035 (USD
      1. BILLION)
    516. TANZANIA TRASH BAG MARKET, BY CAPACITY, 2019-2035 (BILLION
      1. KG)
    517. TANZANIA TRASH BAG MARKET, BY DISTRIBUTION CHANNEL, 2019-2035
      1. (USD BILLION)
    518. TANZANIA TRASH BAG MARKET, BY DISTRIBUTION CHANNEL,
    519. TANZANIA TRASH BAG MARKET, BY END-USE INDUSTRY,
    520. TANZANIA TRASH BAG MARKET, BY END-USE INDUSTRY,
    521. SOUTH AFRICA TRASH BAG MARKET, BY PRODUCT
      1. TYPE, 2019-2035 (USD BILLION)
    522. SOUTH AFRICA TRASH BAG MARKET, BY PRODUCT
      1. TYPE, 2019-2035 (BILLION KG)
    523. SOUTH AFRICA TRASH BAG MARKET, BY MATERIAL,
    524. SOUTH AFRICA TRASH BAG MARKET, BY MATERIAL,
    525. SOUTH AFRICA TRASH BAG MARKET, BY CAPACITY,
    526. SOUTH AFRICA TRASH BAG MARKET, BY CAPACITY,
    527. SOUTH AFRICA TRASH BAG MARKET, BY DISTRIBUTION
      1. CHANNEL, 2019-2035 (USD BILLION)
    528. SOUTH AFRICA TRASH BAG MARKET, BY
      1. DISTRIBUTION CHANNEL, 2019-2035 (BILLION KG)
    529. SOUTH AFRICA TRASH BAG
    530. MARKET, BY END-USE INDUSTRY, 2019-2035 (USD BILLION)
    531. SOUTH AFRICA
    532. TRASH BAG MARKET, BY END-USE INDUSTRY, 2019-2035 (BILLION KG)
    533. MOROCCO
    534. TRASH BAG MARKET, BY PRODUCT TYPE, 2019-2035 (USD BILLION)
    535. MOROCCO
    536. TRASH BAG MARKET, BY PRODUCT TYPE, 2019-2035 (BILLION KG)
    537. MOROCCO
    538. TRASH BAG MARKET, BY MATERIAL, 2019-2035 (USD BILLION)
    539. MOROCCO TRASH
    540. BAG MARKET, BY MATERIAL, 2019-2035 (BILLION KG)
    541. MOROCCO TRASH BAG
    542. MARKET, BY CAPACITY, 2019-2035 (USD BILLION)
    543. MOROCCO TRASH BAG MARKET,
      1. BY CAPACITY, 2019-2035 (BILLION KG)
    544. MOROCCO TRASH BAG MARKET, BY
      1. DISTRIBUTION CHANNEL, 2019-2035 (USD BILLION)
    545. MOROCCO TRASH BAG MARKET,
      1. BY DISTRIBUTION CHANNEL, 2019-2035 (BILLION KG)
    546. MOROCCO TRASH BAG
    547. MARKET, BY END-USE INDUSTRY, 2019-2035 (USD BILLION)
    548. MOROCCO TRASH
    549. BAG MARKET, BY END-USE INDUSTRY, 2019-2035 (BILLION KG)
    550. ALGERIA TRASH
    551. BAG MARKET, BY PRODUCT TYPE, 2019-2035 (USD BILLION)
    552. ALGERIA TRASH
    553. BAG MARKET, BY PRODUCT TYPE, 2019-2035 (BILLION KG)
    554. ALGERIA TRASH
    555. BAG MARKET, BY MATERIAL, 2019-2035 (USD BILLION)
    556. ALGERIA TRASH BAG
    557. MARKET, BY MATERIAL, 2019-2035 (BILLION KG)
    558. ALGERIA TRASH BAG MARKET,
      1. BY CAPACITY, 2019-2035 (USD BILLION)
    559. ALGERIA TRASH BAG MARKET, BY
      1. CAPACITY, 2019-2035 (BILLION KG)
    560. ALGERIA TRASH BAG MARKET, BY DISTRIBUTION
      1. CHANNEL, 2019-2035 (USD BILLION)
    561. ALGERIA TRASH BAG MARKET, BY DISTRIBUTION
      1. CHANNEL, 2019-2035 (BILLION KG)
    562. ALGERIA TRASH BAG MARKET, BY END-USE
      1. INDUSTRY, 2019-2035 (USD BILLION)
    563. ALGERIA TRASH BAG MARKET, BY END-USE
      1. INDUSTRY, 2019-2035 (BILLION KG)
    564. TUNISIA TRASH BAG MARKET, BY PRODUCT
      1. TYPE, 2019-2035 (USD BILLION)
    565. TUNISIA TRASH BAG MARKET, BY PRODUCT
      1. TYPE, 2019-2035 (BILLION KG)
    566. TUNISIA TRASH BAG MARKET, BY MATERIAL,
    567. TUNISIA TRASH BAG MARKET, BY MATERIAL, 2019-2035
      1. (BILLION KG)
    568. TUNISIA TRASH BAG MARKET, BY CAPACITY, 2019-2035 (USD
      1. BILLION)
    569. TUNISIA TRASH BAG MARKET, BY CAPACITY, 2019-2035 (BILLION
      1. KG)
    570. TUNISIA TRASH BAG MARKET, BY DISTRIBUTION CHANNEL, 2019-2035
      1. (USD BILLION)
    571. TUNISIA TRASH BAG MARKET, BY DISTRIBUTION CHANNEL,
    572. TUNISIA TRASH BAG MARKET, BY END-USE INDUSTRY,
    573. TUNISIA TRASH BAG MARKET, BY END-USE INDUSTRY,
    574. REST OF AFRICA TRASH BAG MARKET, BY PRODUCT
      1. TYPE, 2019-2035 (USD BILLION)
    575. REST OF AFRICA TRASH BAG MARKET, BY
      1. PRODUCT TYPE, 2019-2035 (BILLION KG)
    576. REST OF AFRICA TRASH BAG MARKET,
      1. BY MATERIAL, 2019-2035 (USD BILLION)
    577. REST OF AFRICA TRASH BAG MARKET,
      1. BY MATERIAL, 2019-2035 (BILLION KG)
    578. REST OF AFRICA TRASH BAG MARKET,
      1. BY CAPACITY, 2019-2035 (USD BILLION)
    579. REST OF AFRICA TRASH BAG MARKET,
      1. BY CAPACITY, 2019-2035 (BILLION KG)
    580. REST OF AFRICA TRASH BAG MARKET,
      1. BY DISTRIBUTION CHANNEL, 2019-2035 (USD BILLION)
    581. REST OF AFRICA TRASH
    582. BAG MARKET, BY DISTRIBUTION CHANNEL, 2019-2035 (BILLION KG)
    583. REST
    584. OF AFRICA TRASH BAG MARKET, BY END-USE INDUSTRY, 2019-2035 (USD BILLION)
      1. TABLE
    585. REST OF AFRICA TRASH BAG MARKET, BY END-USE INDUSTRY, 2019-2035 (BILLION KG)
    586. MERGER & ACQUISITION
    587. EXPANSION
    588. LAUNCH
    589. COMPETITIVE MAPPING: TRASH BAGS MARKET
    590. BERRY GLOBAL INC.:
      1. PRODUCTS OFFERED
    591. COSMOPLAST UAE: PRODUCTS OFFERED
      1. TABLE 460
      2. ACTION PACKAGING: PRODUCTS OFFERED
    592. THE CLOROX COMPANY: PRODUCTS OFFERED
    593. INTERNATIONAL PLASTICS INC.: PRODUCTS OFFERED
    594. NOVOLEX
      1. (US): PRODUCTS OFFERED
    595. NOVPLASTA, S.R.O: PRODUCTS OFFERED
      1. TABLE
    596. INTEPLAST GROUP: PRODUCTS OFFERED
    597. POLY-AMERICA, L.P: PRODUCTS
      1. OFFERED
    598. REYNOLDS CONSUMER PRODUCTS LLC: PRODUCTS OFFERED
      1. TABLE
    599. PLASTA GROUP: PRODUCTS OFFERED
    600. BIOBAG INTERNATIONAL AS: PRODUCTS
      1. OFFERED
    601. POLYKAR INDUSTRIES INC: PRODUCTS OFFERED
    602. UNIVERSAL
      1. PLASTIC & METAL MANUFACTURING LIMITED: PRODUCTS OFFERED
    603. ALPHA
      1. OMEGA PACK FACTORY L.L.C: PRODUCTS OFFERED
    604. LIST OF FIGURES
      1. FIGURE
    605. GLOBAL TRASH BAG MARKET: STRUCTURE
    606. GLOBAL TRASH BAG MARKET: MARKET
      1. GROWTH FACTOR ANALYSIS (2022-2035)
    607. DRIVER IMPACT ANALYSIS (2024-2035)
    608. RESTRAINT IMPACT ANALYSIS (2022-2035)
    609. VALUE CHAIN ANALYSIS:
    610. GLOBAL TRASH BAG MARKET
    611. SUPPLY CHAIN ANALYSIS: GLOBAL TRASH BAG MARKET
    612. PORTER’S FIVE FORCES MODEL: GLOBAL TRASH BAG MARKET
      1. FIGURE
    613. GLOBAL TRASH BAG MARKET, BY PRODUCT TYPE, SEGMENT ATTRACTIVENESS ANALYSIS
      1. FIGURE
    614. GLOBAL TRASH BAG MARKET, BY MATERIAL TYPE, SEGMENT ATTRACTIVENESS ANALYSIS
    615. GLOBAL TRASH BAG MARKET, BY CAPACITY, SEGMENT ATTRACTIVENESS ANALYSIS
    616. GLOBAL TRASH BAG MARKET, BY DISTRIBUTION CHANNEL, SEGMENT ATTRACTIVENESS
      1. ANALYSIS
    617. GLOBAL TRASH BAG MARKET, BY END USE INDUSTRY, SEGMENT ATTRACTIVENESS
      1. ANALYSIS
    618. COMPETITOR DASHBOARD: GLOBAL TRASH BAGS MARKET
      1. FIGURE
    619. GLOBAL TRASH BAGS MARKET: COMPETITIVE ANALYSIS
    620. BERRY GLOBAL INC.:
    621. SWOT ANALYSIS
    622. COSMOPLAST UAE: SWOT ANALYSIS
    623. ACTION
      1. PACKAGING: SWOT ANALYSIS
    624. THE CLOROX COMPANY: SWOT ANALYSIS
      1. FIGURE
    625. INTERNATIONAL PLASTICS INC.: SWOT ANALYSIS
    626. NOVOLEX (US): SWOT
      1. ANALYSIS
    627. NOVPLASTA, S.R.O: SWOT ANALYSIS
    628. INTEPLAST
      1. GROUP: SWOT ANALYSIS
    629. POLY-AMERICA, L.P: SWOT ANALYSIS
      1. FIGURE
    630. REYNOLDS CONSUMER PRODUCTS LLC: SWOT ANALYSIS
    631. PLASTA GROUP: SWOT
      1. ANALYSIS
    632. BIOBAG INTERNATIONAL AS: SWOT ANALYSIS
    633. POLYKAR
      1. INDUSTRIES INC.: SWOT ANALYSIS
    634. UNIVERSAL PLASTIC & METAL MANUFACTURING
      1. LIMITED: SWOT ANALYSIS
    635. ALPHA OMEGA PACK FACTORY L.L.C: SWOT ANALYSIS
      1. \r\n

    Global Outlook (USD Billion,Thousand Units,2019-2035)

    Global Trash Bags, By Product Type (USD Billion,Thousand Units,2019-2035)

    • Drawstring Trash Bags
    • Star-Sealed Trash Bags
    • Flat-Sealed Trash Bags
    • T-Shirt Bags
    • Twist Tie Bags

    Global Trash Bags, By Material Type (USD Billion,Thousand Units,2019-2035)

    • High-Density Polyethylene (HDPE)
    • Low-Density Polyethylene (LDPE)
    • Linear Low-Density Polyethylene (LLDPE)
    • Biodegradable Polyethylene

    Global Trash Bags, By Capacity (USD Billion,Thousand Units,2019-2035)

    • Small
    • Medium
    • Large

    Global Trash Bags, By Distribution Channel (USD Billion,Thousand Units,2019-2035)

    • Supermarkets & Hypermarkets
    • Convenience Stores
    • Online Retail
    • Specialty Stores

    Global Trash Bags, By End-Use Industry (USD Billion,Thousand Units,2019-2035)

    • Residential
    • Commercial
    • Industrial

    North America Outlook (USD Billion,Thousand Units,2019-2035)

    North America Trash Bags, By Product Type (USD Billion,Thousand Units,2019-2035)

    • Drawstring Trash Bags
    • Star-Sealed Trash Bags
    • Flat-Sealed Trash Bags
    • T-Shirt Bags
    • Twist Tie Bags

    North America Trash Bags, By Material Type (USD Billion,Thousand Units,2019-2035)

    • High-Density Polyethylene (HDPE)
    • Low-Density Polyethylene (LDPE)
    • Linear Low-Density Polyethylene (LLDPE)
    • Biodegradable Polyethylene

    North America Trash Bags, By Capacity (USD Billion,Thousand Units,2019-2035)

    • Small
    • Medium
    • Large

    North America Trash Bags, By Distribution Channel (USD Billion,Thousand Units,2019-2035)

    • Supermarkets & Hypermarkets
    • Convenience Stores
    • Online Retail
    • Specialty Stores

    North America Trash Bags, By End-Use Industry (USD Billion,Thousand Units,2019-2035)

    • Residential
    • Commercial
    • Industrial

    US Outlook (USD Billion,Thousand Units,2019-2035)

    US Trash Bags, By Product Type (USD Billion,Thousand Units,2019-2035)

    • Drawstring Trash Bags
    • Star-Sealed Trash Bags
    • Flat-Sealed Trash Bags
    • T-Shirt Bags
    • Twist Tie Bags

    US Trash Bags, By Material Type (USD Billion,Thousand Units,2019-2035)

    • High-Density Polyethylene (HDPE)
    • Low-Density Polyethylene (LDPE)
    • Linear Low-Density Polyethylene (LLDPE)
    • Biodegradable Polyethylene

    US Trash Bags, By Capacity (USD Billion,Thousand Units,2019-2035)

    • Small
    • Medium
    • Large

    US Trash Bags, By Distribution Channel (USD Billion,Thousand Units,2019-2035)

    • Supermarkets & Hypermarkets
    • Convenience Stores
    • Online Retail
    • Specialty Stores

    US Trash Bags, By End-Use Industry (USD Billion,Thousand Units,2019-2035)

    • Residential
    • Commercial
    • Industrial

    Canada Outlook (USD Billion,Thousand Units,2019-2035)

    Canada Trash Bags, By Product Type (USD Billion,Thousand Units,2019-2035)

    • Drawstring Trash Bags
    • Star-Sealed Trash Bags
    • Flat-Sealed Trash Bags
    • T-Shirt Bags
    • Twist Tie Bags

    Canada Trash Bags, By Material Type (USD Billion,Thousand Units,2019-2035)

    • High-Density Polyethylene (HDPE)
    • Low-Density Polyethylene (LDPE)
    • Linear Low-Density Polyethylene (LLDPE)
    • Biodegradable Polyethylene

    Canada Trash Bags, By Capacity (USD Billion,Thousand Units,2019-2035)

    • Small
    • Medium
    • Large

    Canada Trash Bags, By Distribution Channel (USD Billion,Thousand Units,2019-2035)

    • Supermarkets & Hypermarkets
    • Convenience Stores
    • Online Retail
    • Specialty Stores

    Canada Trash Bags, By End-Use Industry (USD Billion,Thousand Units,2019-2035)

    • Residential
    • Commercial
    • Industrial

    Mexico Outlook (USD Billion,Thousand Units,2019-2035)

    Mexico Trash Bags, By Product Type (USD Billion,Thousand Units,2019-2035)

    • Drawstring Trash Bags
    • Star-Sealed Trash Bags
    • Flat-Sealed Trash Bags
    • T-Shirt Bags
    • Twist Tie Bags

    Mexico Trash Bags, By Material Type (USD Billion,Thousand Units,2019-2035)

    • High-Density Polyethylene (HDPE)
    • Low-Density Polyethylene (LDPE)
    • Linear Low-Density Polyethylene (LLDPE)
    • Biodegradable Polyethylene

    Mexico Trash Bags, By Capacity (USD Billion,Thousand Units,2019-2035)

    • Small
    • Medium
    • Large

    Mexico Trash Bags, By Distribution Channel (USD Billion,Thousand Units,2019-2035)

    • Supermarkets & Hypermarkets
    • Convenience Stores
    • Online Retail
    • Specialty Stores

    Mexico Trash Bags, By End-Use Industry (USD Billion,Thousand Units,2019-2035)

    • Residential
    • Commercial
    • Industrial

    Europe Outlook (USD Billion,Thousand Units,2019-2035)

    Europe Trash Bags, By Product Type (USD Billion,Thousand Units,2019-2035)

    • Drawstring Trash Bags
    • Star-Sealed Trash Bags
    • Flat-Sealed Trash Bags
    • T-Shirt Bags
    • Twist Tie Bags

    Europe Trash Bags, By Material Type (USD Billion,Thousand Units,2019-2035)

    • High-Density Polyethylene (HDPE)
    • Low-Density Polyethylene (LDPE)
    • Linear Low-Density Polyethylene (LLDPE)
    • Biodegradable Polyethylene

    Europe Trash Bags, By Capacity (USD Billion,Thousand Units,2019-2035)

    • Small
    • Medium
    • Large

    Europe Trash Bags, By Distribution Channel (USD Billion,Thousand Units,2019-2035)

    • Supermarkets & Hypermarkets
    • Convenience Stores
    • Online Retail
    • Specialty Stores

    Europe Trash Bags, By End-Use Industry (USD Billion,Thousand Units,2019-2035)

    • Residential
    • Commercial
    • Industrial

    Russia Outlook (USD Billion,Thousand Units,2019-2035)

    Russia Trash Bags, By Product Type (USD Billion,Thousand Units,2019-2035)

    • Drawstring Trash Bags
    • Star-Sealed Trash Bags
    • Flat-Sealed Trash Bags
    • T-Shirt Bags
    • Twist Tie Bags

    Russia Trash Bags, By Material Type (USD Billion,Thousand Units,2019-2035)

    • High-Density Polyethylene (HDPE)
    • Low-Density Polyethylene (LDPE)
    • Linear Low-Density Polyethylene (LLDPE)
    • Biodegradable Polyethylene

    Russia Trash Bags, By Capacity (USD Billion,Thousand Units,2019-2035)

    • Small
    • Medium
    • Large

    Russia Trash Bags, By Distribution Channel (USD Billion,Thousand Units,2019-2035)

    • Supermarkets & Hypermarkets
    • Convenience Stores
    • Online Retail
    • Specialty Stores

    Russia Trash Bags, By End-Use Industry (USD Billion,Thousand Units,2019-2035)

    • Residential
    • Commercial
    • Industrial

    Germany Outlook (USD Billion,Thousand Units,2019-2035)

    Germany Trash Bags, By Product Type (USD Billion,Thousand Units,2019-2035)

    • Drawstring Trash Bags
    • Star-Sealed Trash Bags
    • Flat-Sealed Trash Bags
    • T-Shirt Bags
    • Twist Tie Bags

    Germany Trash Bags, By Material Type (USD Billion,Thousand Units,2019-2035)

    • High-Density Polyethylene (HDPE)
    • Low-Density Polyethylene (LDPE)
    • Linear Low-Density Polyethylene (LLDPE)
    • Biodegradable Polyethylene

    Germany Trash Bags, By Capacity (USD Billion,Thousand Units,2019-2035)

    • Small
    • Medium
    • Large

    Germany Trash Bags, By Distribution Channel (USD Billion,Thousand Units,2019-2035)

    • Supermarkets & Hypermarkets
    • Convenience Stores
    • Online Retail
    • Specialty Stores

    Germany Trash Bags, By End-Use Industry (USD Billion,Thousand Units,2019-2035)

    • Residential
    • Commercial
    • Industrial

    UK Outlook (USD Billion,Thousand Units,2019-2035)

    UK Trash Bags, By Product Type (USD Billion,Thousand Units,2019-2035)

    • Drawstring Trash Bags
    • Star-Sealed Trash Bags
    • Flat-Sealed Trash Bags
    • T-Shirt Bags
    • Twist Tie Bags

    UK Trash Bags, By Material Type (USD Billion,Thousand Units,2019-2035)

    • High-Density Polyethylene (HDPE)
    • Low-Density Polyethylene (LDPE)
    • Linear Low-Density Polyethylene (LLDPE)
    • Biodegradable Polyethylene

    UK Trash Bags, By Capacity (USD Billion,Thousand Units,2019-2035)

    • Small
    • Medium
    • Large

    UK Trash Bags, By Distribution Channel (USD Billion,Thousand Units,2019-2035)

    • Supermarkets & Hypermarkets
    • Convenience Stores
    • Online Retail
    • Specialty Stores

    UK Trash Bags, By End-Use Industry (USD Billion,Thousand Units,2019-2035)

    • Residential
    • Commercial
    • Industrial

    France Outlook (USD Billion,Thousand Units,2019-2035)

    France Trash Bags, By Product Type (USD Billion,Thousand Units,2019-2035)

    • Drawstring Trash Bags
    • Star-Sealed Trash Bags
    • Flat-Sealed Trash Bags
    • T-Shirt Bags
    • Twist Tie Bags

    France Trash Bags, By Material Type (USD Billion,Thousand Units,2019-2035)

    • High-Density Polyethylene (HDPE)
    • Low-Density Polyethylene (LDPE)
    • Linear Low-Density Polyethylene (LLDPE)
    • Biodegradable Polyethylene

    France Trash Bags, By Capacity (USD Billion,Thousand Units,2019-2035)

    • Small
    • Medium
    • Large

    France Trash Bags, By Distribution Channel (USD Billion,Thousand Units,2019-2035)

    • Supermarkets & Hypermarkets
    • Convenience Stores
    • Online Retail
    • Specialty Stores

    France Trash Bags, By End-Use Industry (USD Billion,Thousand Units,2019-2035)

    • Residential
    • Commercial
    • Industrial

    Italy Outlook (USD Billion,Thousand Units,2019-2035)

    Italy Trash Bags, By Product Type (USD Billion,Thousand Units,2019-2035)

    • Drawstring Trash Bags
    • Star-Sealed Trash Bags
    • Flat-Sealed Trash Bags
    • T-Shirt Bags
    • Twist Tie Bags

    Italy Trash Bags, By Material Type (USD Billion,Thousand Units,2019-2035)

    • High-Density Polyethylene (HDPE)
    • Low-Density Polyethylene (LDPE)
    • Linear Low-Density Polyethylene (LLDPE)
    • Biodegradable Polyethylene

    Italy Trash Bags, By Capacity (USD Billion,Thousand Units,2019-2035)

    • Small
    • Medium
    • Large

    Italy Trash Bags, By Distribution Channel (USD Billion,Thousand Units,2019-2035)

    • Supermarkets & Hypermarkets
    • Convenience Stores
    • Online Retail
    • Specialty Stores

    Italy Trash Bags, By End-Use Industry (USD Billion,Thousand Units,2019-2035)

    • Residential
    • Commercial
    • Industrial

    Spain Outlook (USD Billion,Thousand Units,2019-2035)

    Spain Trash Bags, By Product Type (USD Billion,Thousand Units,2019-2035)

    • Drawstring Trash Bags
    • Star-Sealed Trash Bags
    • Flat-Sealed Trash Bags
    • T-Shirt Bags
    • Twist Tie Bags

    Spain Trash Bags, By Material Type (USD Billion,Thousand Units,2019-2035)

    • High-Density Polyethylene (HDPE)
    • Low-Density Polyethylene (LDPE)
    • Linear Low-Density Polyethylene (LLDPE)
    • Biodegradable Polyethylene

    Spain Trash Bags, By Capacity (USD Billion,Thousand Units,2019-2035)

    • Small
    • Medium
    • Large

    Spain Trash Bags, By Distribution Channel (USD Billion,Thousand Units,2019-2035)

    • Supermarkets & Hypermarkets
    • Convenience Stores
    • Online Retail
    • Specialty Stores

    Spain Trash Bags, By End-Use Industry (USD Billion,Thousand Units,2019-2035)

    • Residential
    • Commercial
    • Industrial

    Switzerland Outlook (USD Billion,Thousand Units,2019-2035)

    Switzerland Trash Bags, By Product Type (USD Billion,Thousand Units,2019-2035)

    • Drawstring Trash Bags
    • Star-Sealed Trash Bags
    • Flat-Sealed Trash Bags
    • T-Shirt Bags
    • Twist Tie Bags

    Switzerland Trash Bags, By Material Type (USD Billion,Thousand Units,2019-2035)

    • High-Density Polyethylene (HDPE)
    • Low-Density Polyethylene (LDPE)
    • Linear Low-Density Polyethylene (LLDPE)
    • Biodegradable Polyethylene

    Switzerland Trash Bags, By Capacity (USD Billion,Thousand Units,2019-2035)

    • Small
    • Medium
    • Large

    Switzerland Trash Bags, By Distribution Channel (USD Billion,Thousand Units,2019-2035)

    • Supermarkets & Hypermarkets
    • Convenience Stores
    • Online Retail
    • Specialty Stores

    Switzerland Trash Bags, By End-Use Industry (USD Billion,Thousand Units,2019-2035)

    • Residential
    • Commercial
    • Industrial

    Belgium Outlook (USD Billion,Thousand Units,2019-2035)

    Belgium Trash Bags, By Product Type (USD Billion,Thousand Units,2019-2035)

    • Drawstring Trash Bags
    • Star-Sealed Trash Bags
    • Flat-Sealed Trash Bags
    • T-Shirt Bags
    • Twist Tie Bags

    Belgium Trash Bags, By Material Type (USD Billion,Thousand Units,2019-2035)

    • High-Density Polyethylene (HDPE)
    • Low-Density Polyethylene (LDPE)
    • Linear Low-Density Polyethylene (LLDPE)
    • Biodegradable Polyethylene

    Belgium Trash Bags, By Capacity (USD Billion,Thousand Units,2019-2035)

    • Small
    • Medium
    • Large

    Belgium Trash Bags, By Distribution Channel (USD Billion,Thousand Units,2019-2035)

    • Supermarkets & Hypermarkets
    • Convenience Stores
    • Online Retail
    • Specialty Stores

    Belgium Trash Bags, By End-Use Industry (USD Billion,Thousand Units,2019-2035)

    • Residential
    • Commercial
    • Industrial

    Czech Republic Outlook (USD Billion,Thousand Units,2019-2035)

    Czech Republic Trash Bags, By Product Type (USD Billion,Thousand Units,2019-2035)

    • Drawstring Trash Bags
    • Star-Sealed Trash Bags
    • Flat-Sealed Trash Bags
    • T-Shirt Bags
    • Twist Tie Bags

    Czech Republic Trash Bags, By Material Type (USD Billion,Thousand Units,2019-2035)

    • High-Density Polyethylene (HDPE)
    • Low-Density Polyethylene (LDPE)
    • Linear Low-Density Polyethylene (LLDPE)
    • Biodegradable Polyethylene

    Czech Republic Trash Bags, By Capacity (USD Billion,Thousand Units,2019-2035)

    • Small
    • Medium
    • Large

    Czech Republic Trash Bags, By Distribution Channel (USD Billion,Thousand Units,2019-2035)

    • Supermarkets & Hypermarkets
    • Convenience Stores
    • Online Retail
    • Specialty Stores

    Czech Republic Trash Bags, By End-Use Industry (USD Billion,Thousand Units,2019-2035)

    • Residential
    • Commercial
    • Industrial

    Portugal Outlook (USD Billion,Thousand Units,2019-2035)

    Portugal Trash Bags, By Product Type (USD Billion,Thousand Units,2019-2035)

    • Drawstring Trash Bags
    • Star-Sealed Trash Bags
    • Flat-Sealed Trash Bags
    • T-Shirt Bags
    • Twist Tie Bags

    Portugal Trash Bags, By Material Type (USD Billion,Thousand Units,2019-2035)

    • High-Density Polyethylene (HDPE)
    • Low-Density Polyethylene (LDPE)
    • Linear Low-Density Polyethylene (LLDPE)
    • Biodegradable Polyethylene

    Portugal Trash Bags, By Capacity (USD Billion,Thousand Units,2019-2035)

    • Small
    • Medium
    • Large

    Portugal Trash Bags, By Distribution Channel (USD Billion,Thousand Units,2019-2035)

    • Supermarkets & Hypermarkets
    • Convenience Stores
    • Online Retail
    • Specialty Stores

    Portugal Trash Bags, By End-Use Industry (USD Billion,Thousand Units,2019-2035)

    • Residential
    • Commercial
    • Industrial

    Rest of Europe Outlook (USD Billion,Thousand Units,2019-2035)

    Rest of Europe Trash Bags, By Product Type (USD Billion,Thousand Units,2019-2035)

    • Drawstring Trash Bags
    • Star-Sealed Trash Bags
    • Flat-Sealed Trash Bags
    • T-Shirt Bags
    • Twist Tie Bags

    Rest of Europe Trash Bags, By Material Type (USD Billion,Thousand Units,2019-2035)

    • High-Density Polyethylene (HDPE)
    • Low-Density Polyethylene (LDPE)
    • Linear Low-Density Polyethylene (LLDPE)
    • Biodegradable Polyethylene

    Rest of Europe Trash Bags, By Capacity (USD Billion,Thousand Units,2019-2035)

    • Small
    • Medium
    • Large

    Rest of Europe Trash Bags, By Distribution Channel (USD Billion,Thousand Units,2019-2035)

    • Supermarkets & Hypermarkets
    • Convenience Stores
    • Online Retail
    • Specialty Stores

    Rest of Europe Trash Bags, By End-Use Industry (USD Billion,Thousand Units,2019-2035)

    • Residential
    • Commercial
    • Industrial

    Asia-Pacific Outlook (USD Billion,Thousand Units,2019-2035)

    Asia-Pacific Trash Bags, By Product Type (USD Billion,Thousand Units,2019-2035)

    • Drawstring Trash Bags
    • Star-Sealed Trash Bags
    • Flat-Sealed Trash Bags
    • T-Shirt Bags
    • Twist Tie Bags

    Asia-Pacific Trash Bags, By Material Type (USD Billion,Thousand Units,2019-2035)

    • High-Density Polyethylene (HDPE)
    • Low-Density Polyethylene (LDPE)
    • Linear Low-Density Polyethylene (LLDPE)
    • Biodegradable Polyethylene

    Asia-Pacific Trash Bags, By Capacity (USD Billion,Thousand Units,2019-2035)

    • Small
    • Medium
    • Large

    Asia-Pacific Trash Bags, By Distribution Channel (USD Billion,Thousand Units,2019-2035)

    • Supermarkets & Hypermarkets
    • Convenience Stores
    • Online Retail
    • Specialty Stores

    Asia-Pacific Trash Bags, By End-Use Industry (USD Billion,Thousand Units,2019-2035)

    • Residential
    • Commercial
    • Industrial

    India Outlook (USD Billion,Thousand Units,2019-2035)

    India Trash Bags, By Product Type (USD Billion,Thousand Units,2019-2035)

    • Drawstring Trash Bags
    • Star-Sealed Trash Bags
    • Flat-Sealed Trash Bags
    • T-Shirt Bags
    • Twist Tie Bags

    India Trash Bags, By Material Type (USD Billion,Thousand Units,2019-2035)

    • High-Density Polyethylene (HDPE)
    • Low-Density Polyethylene (LDPE)
    • Linear Low-Density Polyethylene (LLDPE)
    • Biodegradable Polyethylene

    India Trash Bags, By Capacity (USD Billion,Thousand Units,2019-2035)

    • Small
    • Medium
    • Large

    India Trash Bags, By Distribution Channel (USD Billion,Thousand Units,2019-2035)

    • Supermarkets & Hypermarkets
    • Convenience Stores
    • Online Retail
    • Specialty Stores

    India Trash Bags, By End-Use Industry (USD Billion,Thousand Units,2019-2035)

    • Residential
    • Commercial
    • Industrial

    Japan Outlook (USD Billion,Thousand Units,2019-2035)

    Japan Trash Bags, By Product Type (USD Billion,Thousand Units,2019-2035)

    • Drawstring Trash Bags
    • Star-Sealed Trash Bags
    • Flat-Sealed Trash Bags
    • T-Shirt Bags
    • Twist Tie Bags

    Japan Trash Bags, By Material Type (USD Billion,Thousand Units,2019-2035)

    • High-Density Polyethylene (HDPE)
    • Low-Density Polyethylene (LDPE)
    • Linear Low-Density Polyethylene (LLDPE)
    • Biodegradable Polyethylene

    Japan Trash Bags, By Capacity (USD Billion,Thousand Units,2019-2035)

    • Small
    • Medium
    • Large

    Japan Trash Bags, By Distribution Channel (USD Billion,Thousand Units,2019-2035)

    • Supermarkets & Hypermarkets
    • Convenience Stores
    • Online Retail
    • Specialty Stores

    Japan Trash Bags, By End-Use Industry (USD Billion,Thousand Units,2019-2035)

    • Residential
    • Commercial
    • Industrial

    South Korea Outlook (USD Billion,Thousand Units,2019-2035)

    South Korea Trash Bags, By Product Type (USD Billion,Thousand Units,2019-2035)

    • Drawstring Trash Bags
    • Star-Sealed Trash Bags
    • Flat-Sealed Trash Bags
    • T-Shirt Bags
    • Twist Tie Bags

    South Korea Trash Bags, By Material Type (USD Billion,Thousand Units,2019-2035)

    • High-Density Polyethylene (HDPE)
    • Low-Density Polyethylene (LDPE)
    • Linear Low-Density Polyethylene (LLDPE)
    • Biodegradable Polyethylene

    South Korea Trash Bags, By Capacity (USD Billion,Thousand Units,2019-2035)

    • Small
    • Medium
    • Large

    South Korea Trash Bags, By Distribution Channel (USD Billion,Thousand Units,2019-2035)

    • Supermarkets & Hypermarkets
    • Convenience Stores
    • Online Retail
    • Specialty Stores

    South Korea Trash Bags, By End-Use Industry (USD Billion,Thousand Units,2019-2035)

    • Residential
    • Commercial
    • Industrial

    Malaysia Outlook (USD Billion,Thousand Units,2019-2035)

    Malaysia Trash Bags, By Product Type (USD Billion,Thousand Units,2019-2035)

    • Drawstring Trash Bags
    • Star-Sealed Trash Bags
    • Flat-Sealed Trash Bags
    • T-Shirt Bags
    • Twist Tie Bags

    Malaysia Trash Bags, By Material Type (USD Billion,Thousand Units,2019-2035)

    • High-Density Polyethylene (HDPE)
    • Low-Density Polyethylene (LDPE)
    • Linear Low-Density Polyethylene (LLDPE)
    • Biodegradable Polyethylene

    Malaysia Trash Bags, By Capacity (USD Billion,Thousand Units,2019-2035)

    • Small
    • Medium
    • Large

    Malaysia Trash Bags, By Distribution Channel (USD Billion,Thousand Units,2019-2035)

    • Supermarkets & Hypermarkets
    • Convenience Stores
    • Online Retail
    • Specialty Stores

    Malaysia Trash Bags, By End-Use Industry (USD Billion,Thousand Units,2019-2035)

    • Residential
    • Commercial
    • Industrial

    Thailand Outlook (USD Billion,Thousand Units,2019-2035)

    Thailand Trash Bags, By Product Type (USD Billion,Thousand Units,2019-2035)

    • Drawstring Trash Bags
    • Star-Sealed Trash Bags
    • Flat-Sealed Trash Bags
    • T-Shirt Bags
    • Twist Tie Bags

    Thailand Trash Bags, By Material Type (USD Billion,Thousand Units,2019-2035)

    • High-Density Polyethylene (HDPE)
    • Low-Density Polyethylene (LDPE)
    • Linear Low-Density Polyethylene (LLDPE)
    • Biodegradable Polyethylene

    Thailand Trash Bags, By Capacity (USD Billion,Thousand Units,2019-2035)

    • Small
    • Medium
    • Large

    Thailand Trash Bags, By Distribution Channel (USD Billion,Thousand Units,2019-2035)

    • Supermarkets & Hypermarkets
    • Convenience Stores
    • Online Retail
    • Specialty Stores

    Thailand Trash Bags, By End-Use Industry (USD Billion,Thousand Units,2019-2035)

    • Residential
    • Commercial
    • Industrial

    Rest of Asia-Pacific Outlook (USD Billion,Thousand Units,2019-2035)

    Rest of Asia-Pacific Trash Bags, By Product Type (USD Billion,Thousand Units,2019-2035)

    • Drawstring Trash Bags
    • Star-Sealed Trash Bags
    • Flat-Sealed Trash Bags
    • T-Shirt Bags
    • Twist Tie Bags

    Rest of Asia-Pacific Trash Bags, By Material Type (USD Billion,Thousand Units,2019-2035)

    • High-Density Polyethylene (HDPE)
    • Low-Density Polyethylene (LDPE)
    • Linear Low-Density Polyethylene (LLDPE)
    • Biodegradable Polyethylene

    Rest of Asia-Pacific Trash Bags, By Capacity (USD Billion,Thousand Units,2019-2035)

    • Small
    • Medium
    • Large

    Rest of Asia-Pacific Trash Bags, By Distribution Channel (USD Billion,Thousand Units,2019-2035)

    • Supermarkets & Hypermarkets
    • Convenience Stores
    • Online Retail
    • Specialty Stores

    Rest of Asia-Pacific Trash Bags, By End-Use Industry (USD Billion,Thousand Units,2019-2035)

    • Residential
    • Commercial
    • Industrial

    Latin America Outlook (USD Billion,Thousand Units,2019-2035)

    Latin America Trash Bags, By Product Type (USD Billion,Thousand Units,2019-2035)

    • Drawstring Trash Bags
    • Star-Sealed Trash Bags
    • Flat-Sealed Trash Bags
    • T-Shirt Bags
    • Twist Tie Bags

    Latin America Trash Bags, By Material Type (USD Billion,Thousand Units,2019-2035)

    • High-Density Polyethylene (HDPE)
    • Low-Density Polyethylene (LDPE)
    • Linear Low-Density Polyethylene (LLDPE)
    • Biodegradable Polyethylene

    Latin America Trash Bags, By Capacity (USD Billion,Thousand Units,2019-2035)

    • Small
    • Medium
    • Large

    Latin America Trash Bags, By Distribution Channel (USD Billion,Thousand Units,2019-2035)

    • Supermarkets & Hypermarkets
    • Convenience Stores
    • Online Retail
    • Specialty Stores

    Latin America Trash Bags, By End-Use Industry (USD Billion,Thousand Units,2019-2035)

    • Residential
    • Commercial
    • Industrial

    Brazil Outlook (USD Billion,Thousand Units,2019-2035)

    Brazil Trash Bags, By Product Type (USD Billion,Thousand Units,2019-2035)

    • Drawstring Trash Bags
    • Star-Sealed Trash Bags
    • Flat-Sealed Trash Bags
    • T-Shirt Bags
    • Twist Tie Bags

    Brazil Trash Bags, By Material Type (USD Billion,Thousand Units,2019-2035)

    • High-Density Polyethylene (HDPE)
    • Low-Density Polyethylene (LDPE)
    • Linear Low-Density Polyethylene (LLDPE)
    • Biodegradable Polyethylene

    Brazil Trash Bags, By Capacity (USD Billion,Thousand Units,2019-2035)

    • Small
    • Medium
    • Large

    Brazil Trash Bags, By Distribution Channel (USD Billion,Thousand Units,2019-2035)

    • Supermarkets & Hypermarkets
    • Convenience Stores
    • Online Retail
    • Specialty Stores

    Brazil Trash Bags, By End-Use Industry (USD Billion,Thousand Units,2019-2035)

    • Residential
    • Commercial
    • Industrial

    Colombia Outlook (USD Billion,Thousand Units,2019-2035)

    Colombia Trash Bags, By Product Type (USD Billion,Thousand Units,2019-2035)

    • Drawstring Trash Bags
    • Star-Sealed Trash Bags
    • Flat-Sealed Trash Bags
    • T-Shirt Bags
    • Twist Tie Bags

    Colombia Trash Bags, By Material Type (USD Billion,Thousand Units,2019-2035)

    • High-Density Polyethylene (HDPE)
    • Low-Density Polyethylene (LDPE)
    • Linear Low-Density Polyethylene (LLDPE)
    • Biodegradable Polyethylene

    Colombia Trash Bags, By Capacity (USD Billion,Thousand Units,2019-2035)

    • Small
    • Medium
    • Large

    Colombia Trash Bags, By Distribution Channel (USD Billion,Thousand Units,2019-2035)

    • Supermarkets & Hypermarkets
    • Convenience Stores
    • Online Retail
    • Specialty Stores

    Colombia Trash Bags, By End-Use Industry (USD Billion,Thousand Units,2019-2035)

    • Residential
    • Commercial
    • Industrial

    Argentina Outlook (USD Billion,Thousand Units,2019-2035)

    Argentina Trash Bags, By Product Type (USD Billion,Thousand Units,2019-2035)

    • Drawstring Trash Bags
    • Star-Sealed Trash Bags
    • Flat-Sealed Trash Bags
    • T-Shirt Bags
    • Twist Tie Bags

    Argentina Trash Bags, By Material Type (USD Billion,Thousand Units,2019-2035)

    • High-Density Polyethylene (HDPE)
    • Low-Density Polyethylene (LDPE)
    • Linear Low-Density Polyethylene (LLDPE)
    • Biodegradable Polyethylene

    Argentina Trash Bags, By Capacity (USD Billion,Thousand Units,2019-2035)

    • Small
    • Medium
    • Large

    Argentina Trash Bags, By Distribution Channel (USD Billion,Thousand Units,2019-2035)

    • Supermarkets & Hypermarkets
    • Convenience Stores
    • Online Retail
    • Specialty Stores

    Argentina Trash Bags, By End-Use Industry (USD Billion,Thousand Units,2019-2035)

    • Residential
    • Commercial
    • Industrial

    Peru Outlook (USD Billion,Thousand Units,2019-2035)

    Peru Trash Bags, By Product Type (USD Billion,Thousand Units,2019-2035)

    • Drawstring Trash Bags
    • Star-Sealed Trash Bags
    • Flat-Sealed Trash Bags
    • T-Shirt Bags
    • Twist Tie Bags

    Peru Trash Bags, By Material Type (USD Billion,Thousand Units,2019-2035)

    • High-Density Polyethylene (HDPE)
    • Low-Density Polyethylene (LDPE)
    • Linear Low-Density Polyethylene (LLDPE)
    • Biodegradable Polyethylene

    Peru Trash Bags, By Capacity (USD Billion,Thousand Units,2019-2035)

    • Small
    • Medium
    • Large

    Peru Trash Bags, By Distribution Channel (USD Billion,Thousand Units,2019-2035)

    • Supermarkets & Hypermarkets
    • Convenience Stores
    • Online Retail
    • Specialty Stores

    Peru Trash Bags, By End-Use Industry (USD Billion,Thousand Units,2019-2035)

    • Residential
    • Commercial
    • Industrial

    Venezuela Outlook (USD Billion,Thousand Units,2019-2035)

    Venezuela Trash Bags, By Product Type (USD Billion,Thousand Units,2019-2035)

    • Drawstring Trash Bags
    • Star-Sealed Trash Bags
    • Flat-Sealed Trash Bags
    • T-Shirt Bags
    • Twist Tie Bags

    Venezuela Trash Bags, By Material Type (USD Billion,Thousand Units,2019-2035)

    • High-Density Polyethylene (HDPE)
    • Low-Density Polyethylene (LDPE)
    • Linear Low-Density Polyethylene (LLDPE)
    • Biodegradable Polyethylene

    Venezuela Trash Bags, By Capacity (USD Billion,Thousand Units,2019-2035)

    • Small
    • Medium
    • Large

    Venezuela Trash Bags, By Distribution Channel (USD Billion,Thousand Units,2019-2035)

    • Supermarkets & Hypermarkets
    • Convenience Stores
    • Online Retail
    • Specialty Stores

    Venezuela Trash Bags, By End-Use Industry (USD Billion,Thousand Units,2019-2035)

    • Residential
    • Commercial
    • Industrial

    Chile Outlook (USD Billion,Thousand Units,2019-2035)

    Chile Trash Bags, By Product Type (USD Billion,Thousand Units,2019-2035)

    • Drawstring Trash Bags
    • Star-Sealed Trash Bags
    • Flat-Sealed Trash Bags
    • T-Shirt Bags
    • Twist Tie Bags

    Chile Trash Bags, By Material Type (USD Billion,Thousand Units,2019-2035)

    • High-Density Polyethylene (HDPE)
    • Low-Density Polyethylene (LDPE)
    • Linear Low-Density Polyethylene (LLDPE)
    • Biodegradable Polyethylene

    Chile Trash Bags, By Capacity (USD Billion,Thousand Units,2019-2035)

    • Small
    • Medium
    • Large

    Chile Trash Bags, By Distribution Channel (USD Billion,Thousand Units,2019-2035)

    • Supermarkets & Hypermarkets
    • Convenience Stores
    • Online Retail
    • Specialty Stores

    Chile Trash Bags, By End-Use Industry (USD Billion,Thousand Units,2019-2035)

    • Residential
    • Commercial
    • Industrial

    Panama Outlook (USD Billion,Thousand Units,2019-2035)

    Panama Trash Bags, By Product Type (USD Billion,Thousand Units,2019-2035)

    • Drawstring Trash Bags
    • Star-Sealed Trash Bags
    • Flat-Sealed Trash Bags
    • T-Shirt Bags
    • Twist Tie Bags

    Panama Trash Bags, By Material Type (USD Billion,Thousand Units,2019-2035)

    • High-Density Polyethylene (HDPE)
    • Low-Density Polyethylene (LDPE)
    • Linear Low-Density Polyethylene (LLDPE)
    • Biodegradable Polyethylene

    Panama Trash Bags, By Capacity (USD Billion,Thousand Units,2019-2035)

    • Small
    • Medium
    • Large

    Panama Trash Bags, By Distribution Channel (USD Billion,Thousand Units,2019-2035)

    • Supermarkets & Hypermarkets
    • Convenience Stores
    • Online Retail
    • Specialty Stores

    Panama Trash Bags, By End-Use Industry (USD Billion,Thousand Units,2019-2035)

    • Residential
    • Commercial
    • Industrial

    Rest of Latin America Outlook (USD Billion,Thousand Units,2019-2035)

    Rest of Latin America Trash Bags, By Product Type (USD Billion,Thousand Units,2019-2035)

    • Drawstring Trash Bags
    • Star-Sealed Trash Bags
    • Flat-Sealed Trash Bags
    • T-Shirt Bags
    • Twist Tie Bags

    Rest of Latin America Trash Bags, By Material Type (USD Billion,Thousand Units,2019-2035)

    • High-Density Polyethylene (HDPE)
    • Low-Density Polyethylene (LDPE)
    • Linear Low-Density Polyethylene (LLDPE)
    • Biodegradable Polyethylene

    Rest of Latin America Trash Bags, By Capacity (USD Billion,Thousand Units,2019-2035)

    • Small
    • Medium
    • Large

    Rest of Latin America Trash Bags, By Distribution Channel (USD Billion,Thousand Units,2019-2035)

    • Supermarkets & Hypermarkets
    • Convenience Stores
    • Online Retail
    • Specialty Stores

    Rest of Latin America Trash Bags, By End-Use Industry (USD Billion,Thousand Units,2019-2035)

    • Residential
    • Commercial
    • Industrial

    Africa Outlook (USD Billion,Thousand Units,2019-2035)

    Africa Trash Bags, By Product Type (USD Billion,Thousand Units,2019-2035)

    • Drawstring Trash Bags
    • Star-Sealed Trash Bags
    • Flat-Sealed Trash Bags
    • T-Shirt Bags
    • Twist Tie Bags

    Africa Trash Bags, By Material Type (USD Billion,Thousand Units,2019-2035)

    • High-Density Polyethylene (HDPE)
    • Low-Density Polyethylene (LDPE)
    • Linear Low-Density Polyethylene (LLDPE)
    • Biodegradable Polyethylene

    Africa Trash Bags, By Capacity (USD Billion,Thousand Units,2019-2035)

    • Small
    • Medium
    • Large

    Africa Trash Bags, By Distribution Channel (USD Billion,Thousand Units,2019-2035)

    • Supermarkets & Hypermarkets
    • Convenience Stores
    • Online Retail
    • Specialty Stores

    Africa Trash Bags, By End-Use Industry (USD Billion,Thousand Units,2019-2035)

    • Residential
    • Commercial
    • Industrial

    Nigeria Outlook (USD Billion,Thousand Units,2019-2035)

    Nigeria Trash Bags, By Product Type (USD Billion,Thousand Units,2019-2035)

    • Drawstring Trash Bags
    • Star-Sealed Trash Bags
    • Flat-Sealed Trash Bags
    • T-Shirt Bags
    • Twist Tie Bags

    Nigeria Trash Bags, By Material Type (USD Billion,Thousand Units,2019-2035)

    • High-Density Polyethylene (HDPE)
    • Low-Density Polyethylene (LDPE)
    • Linear Low-Density Polyethylene (LLDPE)
    • Biodegradable Polyethylene

    Nigeria Trash Bags, By Capacity (USD Billion,Thousand Units,2019-2035)

    • Small
    • Medium
    • Large

    Nigeria Trash Bags, By Distribution Channel (USD Billion,Thousand Units,2019-2035)

    • Supermarkets & Hypermarkets
    • Convenience Stores
    • Online Retail
    • Specialty Stores

    Nigeria Trash Bags, By End-Use Industry (USD Billion,Thousand Units,2019-2035)

    • Residential
    • Commercial
    • Industrial

    Ethiopia Outlook (USD Billion,Thousand Units,2019-2035)

    Ethiopia Trash Bags, By Product Type (USD Billion,Thousand Units,2019-2035)

    • Drawstring Trash Bags
    • Star-Sealed Trash Bags
    • Flat-Sealed Trash Bags
    • T-Shirt Bags
    • Twist Tie Bags

    Ethiopia Trash Bags, By Material Type (USD Billion,Thousand Units,2019-2035)

    • High-Density Polyethylene (HDPE)
    • Low-Density Polyethylene (LDPE)
    • Linear Low-Density Polyethylene (LLDPE)
    • Biodegradable Polyethylene

    Ethiopia Trash Bags, By Capacity (USD Billion,Thousand Units,2019-2035)

    • Small
    • Medium
    • Large

    Ethiopia Trash Bags, By Distribution Channel (USD Billion,Thousand Units,2019-2035)

    • Supermarkets & Hypermarkets
    • Convenience Stores
    • Online Retail
    • Specialty Stores

    Ethiopia Trash Bags, By End-Use Industry (USD Billion,Thousand Units,2019-2035)

    • Residential
    • Commercial
    • Industrial

    Egypt Outlook (USD Billion,Thousand Units,2019-2035)

    Egypt Trash Bags, By Product Type (USD Billion,Thousand Units,2019-2035)

    • Drawstring Trash Bags
    • Star-Sealed Trash Bags
    • Flat-Sealed Trash Bags
    • T-Shirt Bags
    • Twist Tie Bags

    Egypt Trash Bags, By Material Type (USD Billion,Thousand Units,2019-2035)

    • High-Density Polyethylene (HDPE)
    • Low-Density Polyethylene (LDPE)
    • Linear Low-Density Polyethylene (LLDPE)
    • Biodegradable Polyethylene

    Egypt Trash Bags, By Capacity (USD Billion,Thousand Units,2019-2035)

    • Small
    • Medium
    • Large

    Egypt Trash Bags, By Distribution Channel (USD Billion,Thousand Units,2019-2035)

    • Supermarkets & Hypermarkets
    • Convenience Stores
    • Online Retail
    • Specialty Stores

    Egypt Trash Bags, By End-Use Industry (USD Billion,Thousand Units,2019-2035)

    • Residential
    • Commercial
    • Industrial

    Democratic Republic of the Congo (DRC) Outlook (USD Billion,Thousand Units,2019-2035)

    Democratic Republic of the Congo (DRC) Trash Bags, By Product Type (USD Billion,Thousand Units,2019-2035)

    • Drawstring Trash Bags
    • Star-Sealed Trash Bags
    • Flat-Sealed Trash Bags
    • T-Shirt Bags
    • Twist Tie Bags

    Democratic Republic of the Congo (DRC) Trash Bags, By Material Type (USD Billion,Thousand Units,2019-2035)

    • High-Density Polyethylene (HDPE)
    • Low-Density Polyethylene (LDPE)
    • Linear Low-Density Polyethylene (LLDPE)
    • Biodegradable Polyethylene

    Democratic Republic of the Congo (DRC) Trash Bags, By Capacity (USD Billion,Thousand Units,2019-2035)

    • Small
    • Medium
    • Large

    Democratic Republic of the Congo (DRC) Trash Bags, By Distribution Channel (USD Billion,Thousand Units,2019-2035)

    • Supermarkets & Hypermarkets
    • Convenience Stores
    • Online Retail
    • Specialty Stores

    Democratic Republic of the Congo (DRC) Trash Bags, By End-Use Industry (USD Billion,Thousand Units,2019-2035)

    • Residential
    • Commercial
    • Industrial

    Tanzania Outlook (USD Billion,Thousand Units,2019-2035)

    Tanzania Trash Bags, By Product Type (USD Billion,Thousand Units,2019-2035)

    • Drawstring Trash Bags
    • Star-Sealed Trash Bags
    • Flat-Sealed Trash Bags
    • T-Shirt Bags
    • Twist Tie Bags

    Tanzania Trash Bags, By Material Type (USD Billion,Thousand Units,2019-2035)

    • High-Density Polyethylene (HDPE)
    • Low-Density Polyethylene (LDPE)
    • Linear Low-Density Polyethylene (LLDPE)
    • Biodegradable Polyethylene

    Tanzania Trash Bags, By Capacity (USD Billion,Thousand Units,2019-2035)

    • Small
    • Medium
    • Large

    Tanzania Trash Bags, By Distribution Channel (USD Billion,Thousand Units,2019-2035)

    • Supermarkets & Hypermarkets
    • Convenience Stores
    • Online Retail
    • Specialty Stores

    Tanzania Trash Bags, By End-Use Industry (USD Billion,Thousand Units,2019-2035)

    • Residential
    • Commercial
    • Industrial

    South Africa Outlook (USD Billion,Thousand Units,2019-2035)

    South Africa Trash Bags, By Product Type (USD Billion,Thousand Units,2019-2035)

    • Drawstring Trash Bags
    • Star-Sealed Trash Bags
    • Flat-Sealed Trash Bags
    • T-Shirt Bags
    • Twist Tie Bags

    South Africa Trash Bags, By Material Type (USD Billion,Thousand Units,2019-2035)

    • High-Density Polyethylene (HDPE)
    • Low-Density Polyethylene (LDPE)
    • Linear Low-Density Polyethylene (LLDPE)
    • Biodegradable Polyethylene

    South Africa Trash Bags, By Capacity (USD Billion,Thousand Units,2019-2035)

    • Small
    • Medium
    • Large

    South Africa Trash Bags, By Distribution Channel (USD Billion,Thousand Units,2019-2035)

    • Supermarkets & Hypermarkets
    • Convenience Stores
    • Online Retail
    • Specialty Stores

    South Africa Trash Bags, By End-Use Industry (USD Billion,Thousand Units,2019-2035)

    • Residential
    • Commercial
    • Industrial

    Morocco Outlook (USD Billion,Thousand Units,2019-2035)

    Morocco Trash Bags, By Product Type (USD Billion,Thousand Units,2019-2035)

    • Drawstring Trash Bags
    • Star-Sealed Trash Bags
    • Flat-Sealed Trash Bags
    • T-Shirt Bags
    • Twist Tie Bags

    Morocco Trash Bags, By Material Type (USD Billion,Thousand Units,2019-2035)

    • High-Density Polyethylene (HDPE)
    • Low-Density Polyethylene (LDPE)
    • Linear Low-Density Polyethylene (LLDPE)
    • Biodegradable Polyethylene

    Morocco Trash Bags, By Capacity (USD Billion,Thousand Units,2019-2035)

    • Small
    • Medium
    • Large

    Morocco Trash Bags, By Distribution Channel (USD Billion,Thousand Units,2019-2035)

    • Supermarkets & Hypermarkets
    • Convenience Stores
    • Online Retail
    • Specialty Stores

    Morocco Trash Bags, By End-Use Industry (USD Billion,Thousand Units,2019-2035)

    • Residential
    • Commercial
    • Industrial

    Algeria Outlook (USD Billion,Thousand Units,2019-2035)

    Algeria Trash Bags, By Product Type (USD Billion,Thousand Units,2019-2035)

    • Drawstring Trash Bags
    • Star-Sealed Trash Bags
    • Flat-Sealed Trash Bags
    • T-Shirt Bags
    • Twist Tie Bags

    Algeria Trash Bags, By Material Type (USD Billion,Thousand Units,2019-2035)

    • High-Density Polyethylene (HDPE)
    • Low-Density Polyethylene (LDPE)
    • Linear Low-Density Polyethylene (LLDPE)
    • Biodegradable Polyethylene

    Algeria Trash Bags, By Capacity (USD Billion,Thousand Units,2019-2035)

    • Small
    • Medium
    • Large

    Algeria Trash Bags, By Distribution Channel (USD Billion,Thousand Units,2019-2035)

    • Supermarkets & Hypermarkets
    • Convenience Stores
    • Online Retail
    • Specialty Stores

    Algeria Trash Bags, By End-Use Industry (USD Billion,Thousand Units,2019-2035)

    • Residential
    • Commercial
    • Industrial

    Tunisia Outlook (USD Billion,Thousand Units,2019-2035)

    Tunisia Trash Bags, By Product Type (USD Billion,Thousand Units,2019-2035)

    • Drawstring Trash Bags
    • Star-Sealed Trash Bags
    • Flat-Sealed Trash Bags
    • T-Shirt Bags
    • Twist Tie Bags

    Tunisia Trash Bags, By Material Type (USD Billion,Thousand Units,2019-2035)

    • High-Density Polyethylene (HDPE)
    • Low-Density Polyethylene (LDPE)
    • Linear Low-Density Polyethylene (LLDPE)
    • Biodegradable Polyethylene

    Tunisia Trash Bags, By Capacity (USD Billion,Thousand Units,2019-2035)

    • Small
    • Medium
    • Large

    Tunisia Trash Bags, By Distribution Channel (USD Billion,Thousand Units,2019-2035)

    • Supermarkets & Hypermarkets
    • Convenience Stores
    • Online Retail
    • Specialty Stores

    Tunisia Trash Bags, By End-Use Industry (USD Billion,Thousand Units,2019-2035)

    • Residential
    • Commercial
    • Industrial

    Rest of Africa Outlook (USD Billion,Thousand Units,2019-2035)

    Rest of Africa Trash Bags, By Product Type (USD Billion,Thousand Units,2019-2035)

    • Drawstring Trash Bags
    • Star-Sealed Trash Bags
    • Flat-Sealed Trash Bags
    • T-Shirt Bags
    • Twist Tie Bags

    Rest of Africa Trash Bags, By Material Type (USD Billion,Thousand Units,2019-2035)

    • High-Density Polyethylene (HDPE)
    • Low-Density Polyethylene (LDPE)
    • Linear Low-Density Polyethylene (LLDPE)
    • Biodegradable Polyethylene

    Rest of Africa Trash Bags, By Capacity (USD Billion,Thousand Units,2019-2035)

    • Small
    • Medium
    • Large

    Rest of Africa Trash Bags, By Distribution Channel (USD Billion,Thousand Units,2019-2035)

    • Supermarkets & Hypermarkets
    • Convenience Stores
    • Online Retail
    • Specialty Stores

    Rest of Africa Trash Bags, By End-Use Industry (USD Billion,Thousand Units,2019-2035)

    • Residential
    • Commercial
    • Industrial
    Infographic

    Free Sample Request

    Kindly complete the form below to receive a free sample of this Report

    Get Free Sample

    Customer Strories

    “I am very pleased with how market segments have been defined in a relevant way for my purposes (such as "Portable Freezers & refrigerators" and "last-mile"). In general the report is well structured. Thanks very much for your efforts.”

    Victoria Milne

    Founder
    Case Study
    Chemicals and Materials

    Compare Licence

    ×
    Features License Type
    Single User Multiuser License Enterprise User
    Price $4,950 $5,950 $7,250
    Maximum User Access Limit 1 User Upto 10 Users Unrestricted Access Throughout the Organization
    Free Customization
    Direct Access to Analyst
    Deliverable Format
    Platform Access
    Discount on Next Purchase 10% 15% 15%
    Printable Versions