• Cat-intel
  • MedIntelliX
  • Resources
  • About Us
  • Hero Background
    English
    Chinese
    French
    Japanese
    Korean
    German
    Spanish

    Sugar Reducing Ingredients Market Analysis

    ID: MRFR/F-B & N/10308-CR
    250 Pages
    Snehal Singh
    June 2023

    Sugar Reducing Ingredients Market Research Report Information By Function (Sweeteners, Bulking Agents, and Texturants), Application (Food & Beverage and Pharmaceuticals & Nutraceuticals), Distribution Channel (B2B and B2C), and By Region (North America, Europe, Asia-Pacific, South America, Middle East & Africa) - Forecast Till 2035

    Share:
    Download PDF ×

    We do not share your information with anyone. However, we may send you emails based on your report interest from time to time. You may contact us at any time to opt-out.

    Sugar Reducing Ingredients Market Infographic
    $ 4,950.0
    $ 5,950.0
    $ 7,250.0

    Market Analysis

    In-depth Analysis of Sugar Reducing Ingredients Market Industry Landscape

    The Sugar Reducing Ingredients Market is witnessing substantial trends, propelled by the global shift towards healthier eating habits and increased awareness of the detrimental effects of excessive sugar consumption. One pivotal trend in this market is the growing demand for sugar reduction solutions due to rising concerns about obesity, diabetes, and other diet-related health issues. Consumers are actively seeking products that retain sweetness but with reduced sugar content. This trend is driving the adoption of various sugar reducing ingredients by food and beverage manufacturers, aiming to provide healthier alternatives without compromising on taste. As the health and wellness movement gains momentum, the Sugar Reducing Ingredients Market is seeing increased interest in natural sweeteners and sugar substitutes. Stevia, monk fruit, erythritol, and other plant-based sweeteners are becoming popular choices as they offer sweetness without the caloric impact of traditional sugars. These natural alternatives cater to consumers who are not only looking to reduce their sugar intake but also prefer clean-label products with recognizable and minimally processed ingredients. The market is experiencing a surge in innovation as food scientists and manufacturers seek effective ways to reduce sugar content without sacrificing taste and texture. Ingredients like polyols, soluble fibers, and novel sweetening agents are being developed and incorporated into a wide range of products, from beverages and snacks to baked goods and dairy items. This trend reflects the industry's commitment to providing diverse options for consumers seeking reduced sugar alternatives across various food categories. A significant driver in the Sugar Reducing Ingredients Market is the implementation of sugar reduction initiatives by regulatory bodies and health organizations. Governments and health agencies worldwide are advocating for reduced sugar consumption to address public health concerns. This has led to increased pressure on food and beverage manufacturers to reformulate their products, creating opportunities for the incorporation of sugar reducing ingredients. As a result, the market is witnessing a higher demand for ingredients that can help achieve sugar reduction targets without compromising product quality. Consumer education and awareness campaigns are influencing purchasing decisions, driving the demand for products with sugar reducing ingredients. With access to information about the health risks associated with high sugar intake, consumers are actively seeking healthier options. Brands that transparently communicate their commitment to sugar reduction and the use of innovative ingredients are gaining favor among health-conscious consumers, contributing to the overall growth of the market. The Sugar Reducing Ingredients Market is also benefitting from the rise of personalized nutrition. As consumers become more mindful of their individual health needs and preferences, there is a growing demand for products that can be tailored to specific dietary requirements. Sugar reducing ingredients play a crucial role in meeting these demands by enabling the development of customized, low-sugar, or sugar-free products that cater to diverse dietary lifestyles. Sustainability is emerging as a key consideration in the Sugar Reducing Ingredients Market. Manufacturers are increasingly focusing on sourcing sustainable raw materials and adopting eco-friendly production practices. This trend aligns with the broader sustainability movement in the food industry, where consumers are not only concerned about their health but also about the environmental impact of the products they choose. Sustainable practices contribute to the overall appeal of sugar reducing ingredients in the market.

    Market Summary

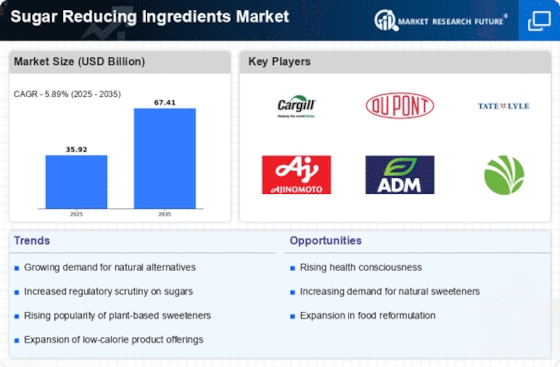
    The Global Sugar Reducing Ingredients Market is projected to grow from 35.2 USD Billion in 2024 to 66.0 USD Billion by 2035, reflecting a robust CAGR of 5.89%.

    Key Market Trends & Highlights

    Sugar Reducing Ingredients Key Trends and Highlights

    • The market valuation is expected to increase from 35.2 USD Billion in 2024 to 66.0 USD Billion by 2035.
    • A compound annual growth rate of 5.89% is anticipated for the period between 2025 and 2035.
    • The growing health consciousness among consumers is likely to drive the demand for sugar reducing ingredients.
    • Growing adoption of sugar reducing technologies due to increasing health awareness is a major market driver.

    Market Size & Forecast

    2024 Market Size 35.2 (USD Billion)
    2035 Market Size 66.0 (USD Billion)
    CAGR (2025-2035) 5.89%
    Largest Regional Market Share in 2024 south_america)

    Major Players

    Ingredion Incorporated, Cargill Incorporated, Roquette Frères, DuPont, International Flavors & Fragrances Inc., GLG LIFE TECH CORP., Tate & Lyle, Kerry Group, Südzucker AG

    Market Trends

    A large pool of people suffering from cardiovascular disease as well as diabetes

    The growing geriatric population coupled with the large pool of people suffering from cardiovascular disease as well as diabetes across the U.S. has increased the demand for sugar reducing ingredients owing to the health benefits provided by them. For example, according to the FDA, aspartame is a non-nutritive artificial sweetener that is 200 times sweeter than sugar. Sometimes, it is sold as Equal and NutraSweet in blue packets. Although aspartame is not zero-calorie like some other artificial sweeteners, it nevertheless has a low-calorie count.

    Furthermore, as part of this, according to the Centers for Disease Control and Prevention, in the United States, heart disease is the leading cause of death for both sexes and members of most racial and ethnic groups. In the United States, cardiovascular disease claims one life every 34 seconds.

    Almost 697,000 Americans died from heart disease in 2020, making up 1 in 5 fatalities in the country. Furthermore, various initiatives were taken by organizations across the country to educate the patients suffering from chronic which in turn are likely to contribute to its overall market growth. For example, the Administration for Community Living provides Chronic Disease Self-Management Education (CDSME) programs which provide education and tools to help them better manage chronic conditions and age-related diseases including diabetes, heart disease, arthritis, chronic pain, as well as depression.

    Through competitive funds in the form of cooperation agreements, the Administration on Aging (AoA) has supported the dissemination of CDSME programs since 2003.

    The increasing consumer demand for healthier food options is driving innovation in sugar-reducing ingredients, suggesting a transformative shift in the food industry towards lower sugar formulations.

    U.S. Department of Agriculture

    Sugar Reducing Ingredients Market Market Drivers

    Market Growth Chart

    Market Growth Projections

    The Global Sugar Reducing Ingredients Market Industry is experiencing robust growth, with projections indicating a market size of 35.2 USD Billion in 2024 and an anticipated increase to 66.0 USD Billion by 2035. This growth trajectory suggests a compound annual growth rate (CAGR) of 5.89% from 2025 to 2035. Such figures reflect the escalating demand for sugar alternatives driven by health trends, regulatory changes, and consumer preferences for healthier food options. As the market evolves, stakeholders are likely to invest in research and development to enhance product offerings and capitalize on emerging opportunities.

    Rising Health Consciousness

    The increasing awareness of health and wellness among consumers is a pivotal driver for the Global Sugar Reducing Ingredients Market Industry. As individuals become more informed about the adverse effects of excessive sugar consumption, there is a noticeable shift towards healthier alternatives. This trend is particularly evident in regions such as North America and Europe, where consumers actively seek products with reduced sugar content. The market is projected to reach 35.2 USD Billion in 2024, reflecting the growing demand for sugar substitutes that align with healthier lifestyles. Consequently, manufacturers are innovating to create appealing products that cater to this health-conscious demographic.

    Innovation in Sugar Alternatives

    The continuous innovation in sugar alternatives is a crucial driver for the Global Sugar Reducing Ingredients Market Industry. Advances in food technology have led to the development of a variety of natural and artificial sweeteners, such as stevia, monk fruit, and erythritol, which provide sweetness without the calories associated with traditional sugar. These innovations not only cater to the growing demand for low-calorie products but also address consumer preferences for natural ingredients. As manufacturers increasingly incorporate these alternatives into their formulations, the market is poised for substantial growth, with a projected CAGR of 5.89% from 2025 to 2035.

    Regulatory Support for Sugar Reduction

    Government initiatives aimed at reducing sugar intake are significantly influencing the Global Sugar Reducing Ingredients Market Industry. Various countries have implemented policies and regulations to curb sugar consumption, including taxes on sugary beverages and mandatory labeling of sugar content. These measures are designed to combat rising obesity rates and related health issues. For instance, the implementation of sugar taxes in several countries has prompted food and beverage companies to reformulate their products, leading to an increased demand for sugar-reducing ingredients. This regulatory environment is expected to bolster market growth, with projections indicating a market size of 66.0 USD Billion by 2035.

    Consumer Demand for Low-Calorie Products

    The rising consumer demand for low-calorie and sugar-free products is a significant driver of the Global Sugar Reducing Ingredients Market Industry. As more individuals seek to manage their weight and improve their overall health, the appeal of low-calorie options continues to grow. This trend is particularly pronounced in the snack and beverage sectors, where consumers are actively searching for products that offer indulgence without the associated guilt of high sugar content. The market's expansion is further supported by the increasing availability of sugar-reducing ingredients in various food categories, thereby enhancing product offerings and meeting consumer expectations.

    Market Segment Insights

    Sugar Reducing Ingredients Market Segment Insights

    Sugar Reducing Ingredients Market Segment Insights

    Sugar Reducing Ingredients Function Insights

    Sugar Reducing Ingredients Function Insights

    Based on function, the Sugar Reducing Ingredients Market segmentation includes Sweeteners, Bulking Agents, and others. The bulking agents' segment held the majority share in 2023 contributing to around a market value of USD 16.24 Billion (2023) of Sugar Reducing Ingredients Market revenue. Bulking agents, a carbohydrate ingredient that provides calories and adds bulk to the food. Sugar’s role is not only constrained to sweetening functionality in the products but also provides bulk to the products like calories and fiber. Bulking agents also help in restoring the missing sugar properties like water solubility, viscosity, etc.

    Fructo-oligosaccharides, allulose, inulin, maltodextrins, polydextrose, sugar alcohols, tagatose, honey, and resistant starch are a few of the most commonly used bulking agents. This type of sugar-reducing ingredient is used in the manufacturing of various food products including desserts, confections, and baked goods, and helps maintain the overall volume and flavor. For instance, allulose and erythritol are used as sugar-reducing ingredients in ice cream. Honey as sugar reducing agent is used quite extensively owing to its easy marketability, natural source, lesser glycemic index value compared to sugar, and its ability to reduce the off-flavor notes used in bakery products.

    Another example is polydextrose’s use in dairy products as a bulking agent and it also helps in increasing the fiber content of the final product. 

    Figure 2: Sugar Reducing Ingredients Market, by Function, 2023 & 2032 (USD Billion)

    Sugar Reducing Ingredients Application Insights

    Sugar Reducing Ingredients Application Insights

    Based on application, the Sugar Reducing Ingredients Market has been segmented into food & beverage and pharmaceuticals & nutraceuticals. The food & beverage segment is further segmented into bakery & confectionery, beverages, dairy & desserts, and snacks & savory. The food & beverage segment is the largest segment accounting for a share of 79.73% and is likely to grow at a rate of 5.63% during the forecast period. The food & beverage sector is the leading user of sugar-reducing ingredients in various products.

    Sugars are one of the key ingredients of a range of food & beverage products and have several properties including palatability, flavor, texture, mouthfeel, volume, color, etc. making them an indispensable part of product development. However, excessive sugar consumption has several health implications which have resulted in governments implementing several initiatives to reduce sugar consumption and a shift in consumer preference. The above-said factors are pushing the food & beverage manufacturers to innovate and launch sugar-reduced products with no compromise in other factors of the final product.

    The Food & Beverage segment is expected to grow at a market CAGR of 5.94%. 

    Figure 2: Sugar Reducing Ingredients Market, by Application, 2023 & 2032 (USD Billion)

    Sugar Reducing Ingredients Distribution Channel Insights

    Sugar Reducing Ingredients Distribution Channel Insights

    Based on the distribution channel, the Sugar Reducing Ingredients Market has been segmented into B2B and B2C. The B2B segment accounted for the largest market share of 70.31% in 2021 and is likely to grow at a rate of 5.30% during the projected period whereas the B2C segment is likely to grow at a higher CAGR of 5.62% during the forecast period.

    B2B stands for the business-to-business transaction, is a type of trade of products between two business units meaning both the suppliers and buyer of the product are business firms where the buyer firm uses the product or service procured from the supplier as ingredients in the product development or a product for further businesses. The trade between businesses and retailers/wholesalers instead of directly to the consumer is a type of B2B transaction. Another example of a B2B transaction in the global market is the purchase of sugar-reducing ingredients by bakery & confectionery manufacturing units.

    Figure 2: Sugar Reducing Ingredients Market, by Distribution Channel, 2023 & 2032 (USD Billion)

    Source: Secondary Research, Primary Research, Market Research Future Database, and Analyst Review

    Get more detailed insights about Sugar Reducing Ingredients Market Research Report—Global Forecast till 2032

    Regional Insights

    Based on region, the Sugar Reducing Ingredients Market has been segmented into North America, Europe, Asia-Pacific, and the South America. The Asia-Pacific region accounted for the largest market share of 37.64% in 2023 and is likely to register a CAGR of 5.97% during the projected period. The North America region is the second largest market with a share of 26.59% in 2023.

    Around 227 million people in Asia-Pacific are diagnosed with type 2 diabetes, and 50% among them aren’t aware of the long-term implications of the disease, stated the managing director of BENO, Asia Pacific in the Food & Beverage Asia magazine. However, consumers are shifting to healthy lifestyle habits, the article further elaborated that the survey conducted among Singapore consumers has highlighted that around 66.67% of them are inclined towards adopting a healthier lifestyle and consumption habits. This trend is further fueled by the outbreak of the COVID-19 pandemic, making consumers conscious of the ingredients in food and drink products.

    The Asia-Pacific region consists of China, India, Japan, Australia & New Zealand, and the Rest of Asia-Pacific. Around 227 million people in Asia-Pacific are diagnosed with type 2 diabetes, and 50% among them aren’t aware of the long-term implications of the disease, stated the managing director of BENO, Asia Pacific in the Food & Beverage Asia magazine. However, consumers are shifting to healthy lifestyle habits, the article further elaborated that the survey conducted among Singapore consumers has highlighted that around 66.67% of them are inclined towards adopting a healthier lifestyle and consumption habits.

    This trend is further fueled by the outbreak of the COVID-19 pandemic, making consumers conscious of the ingredients in food and drink products.

    The major countries studied are the U.S., Canada, Mexico, Germany, France, the UK, Italy, Spain,  China, Japan, India, Australia and New Zealand, South America, the Middle East, and Africa.

    Figure 3: SUGAR REDUCING INGREDIENTS MARKET SHARE, BY REGION, 2023 & 2032 (USD Billion)

    SUGAR REDUCING INGREDIENTS MARKET SHARE, BY REGION, 2023 & 2032

    Source: Secondary Research, Primary Research, MRFR Database, and Analyst Review

    Key Players and Competitive Insights

    The Sugar Reducing Ingredients Market is projected to register a CAGR of 5.70% during the review period. The market's growth can be attributed to the surging demand for sugar reducing ingredients from food, beverages, and functional food industries. The sugar reducing ingredients market is facing higher competition, as the key players are continuously focusing on the adoption of growth strategies to enhance their market position. The growth strategies adopted by the manufacturers include product launches, re-innovation in their existing products, acquisition, and strategic collaboration to uplift their revenue.

    The companies are also focusing on the expansion of their operations across the regions, augmenting their production, sales, and distribution capabilities. However, the growth of market players is primarily dependent on market conditions, the development of industry, along with government support. Moreover, the increasing incidences of CVDs (Cardiovascular Disorders), obesity, and diabetes among consumers across the globe driving the demand for sugar reducing ingredients market. Moreover, the increasing government initiatives for the production of commodity-based ingredients are set to open up huge prospects for the manufacturers operating their business in sugar reducing ingredients market in the upcoming years.

    Key Companies in the Sugar Reducing Ingredients Market market include

    Industry Developments

    November 2022: Cargill Incorporated introduced its ingredients at the Food Ingredients Europe (FIE), such as a series of plant-based ingredients along with its soluble fiber sugar-reduction offerings for bakery and confectionery applications.

    November 2022: Tate & Lyle announced the expansion of its product portfolio of reduced sugar alternatives as it launched Erytesse Erythritol – which contains 70% of the sweetness of sucrose and has zero calories.

    Future Outlook

    Sugar Reducing Ingredients Market Future Outlook

    The Sugar Reducing Ingredients Market is projected to grow at a 5.89% CAGR from 2024 to 2035, driven by rising health consciousness, regulatory support, and innovation in sweetener technologies.

    New opportunities lie in:

    • Develop low-calorie sweeteners targeting health-conscious consumers.
    • Invest in R&D for natural sugar substitutes to meet clean label demands.
    • Expand distribution channels in emerging markets to capture new customer segments.

    By 2035, the Sugar Reducing Ingredients Market is expected to achieve substantial growth, reflecting evolving consumer preferences and industry advancements.

    Market Segmentation

    Sugar Reducing Ingredients Type Outlook

    • Sweeteners
    • Bulking Agents
    • Texturants

    Sugar Reducing Ingredients Regional Outlook

    • US
    • Canada
    • Mexico

    Sugar Reducing Ingredients Application Outlook

    • Bakery & Confectionery
    • Beverages
    • Dairy & Desserts
    • Snacks & Savory

    Sugar Reducing Ingredients Distribution Channel Outlook

    • B2B
    • B2C

    Report Scope

    Report Attribute/Metric Details
    Market Size 2023 USD 33.92 Billion
    Market Size 2024 USD 35.18 Billion
    Market Size 2032 USD 55.88 Billion
    Compound Annual Growth Rate (CAGR) 5.70 % (2024-2032)
    Base Year 2023
    Forecast Period 2024-2032
    Historical Data 2018-2022
    Forecast Units Value (USD Billion)
    Report Coverage Revenue Forecast, Competitive Landscape, Growth Factors, and Trends
    Segments Covered Function, Application, Distribution Channel, and Region
    Geographies Covered North America, Europe, Asia Pacific, and the Rest of the World
    Countries Covered USA, Canada, Mexico, UK, Germany, France, Italy Spain, Russia, China, India, Japan, Australia & New Zealand, Brazil, Argentina, South Africa, Turkey, GCC countries, North Africa,
    Key Companies Profiled Ingredion Incorporated (US), ADM (US), Cargill, Incorporated (US), Roquette Frères (France), DuPont (Denmark), International Flavors & Fragrances Inc. (US), GLG LIFE TECH CORP (Canada), Tate & Lyle (UK), Kerry Group (Ireland), and Südzucker AG (Germany)
    Key Market Opportunities ·       Growing expansion policies adopted by key players
    Key Market Dynamics ·       A large pool of people suffering from cardiovascular disease as well as diabetes ·       Favorable policies aid down by the government bodies

    Market Highlights

    Author

    Snehal Singh
    Assistant Manager - Research

    She holds an experience of about 6+ years in market research and business consulting, working under the spectrum of information communication technology, telecommunications and semiconductor domains. aarti conceptualizes and implements a scalable business strategy and provides strategic leadership to the clients. her expertise lies in market estimation, competitive intelligence, pipeline analysis, customer assessment, etc.

    Leave a Comment

    Latest Comments

    John Doe
    john@example.com

    This is a great article! Really helped me understand the topic better.

    Posted on July 23, 2025, 10:15 AM
    Jane Smith
    jane@domain.com

    Thanks for sharing this. I’ve bookmarked it for later reference.

    Posted on July 22, 2025, 7:45 PM

    FAQs

    How much is the sugar reducing ingredients market?

    The sugar reducing ingredients market is valued at USD 35.18 Billion in 2024

    What is the key driving factor for the Processed meat market?

    A large pool of people suffering from cardiovascular disease as well as diabetes, Favorable policies aid down by the government bodies

    What is the growth rate of the sugar reducing ingredients market?

    The sugar reducing ingredients market is expected to grow at a CAGR of 5.70% during the forecast period

    Which region held the largest market share in the sugar reducing ingredients market?

    Asia-Pacific held the largest share market in the sugar reducing ingredients market

    Who are the key players in the sugar reducing ingredients market?

    The key players include ADM, Cargill Incorporated, Roquette Frères, DuPont, International Flavors & Fragrances Inc., GLG LIFE TECH CORP, Tate & Lyle, Kerry Group, and Südzucker AG.

    1. Table of Contents
    2. Executive Summary 16
      1. GLOBAL SUGAR REDUCING INGREDIENTS MARKET, BY FUNCTION 18
      2. GLOBAL SUGAR REDUCING INGREDIENTS MARKET, BY APPLICATION 19
      3. GLOBAL SUGAR REDUCING INGREDIENTS MARKET, BY DISTRIBUTION CHANNEL 20
      4. GLOBAL SUGAR REDUCING INGREDIENTS MARKET, BY REGION 21
    3. Market Introduction 22
      1. DEFINITION 22
      2. Scope of the Study 22
      3. RESEARCH OBJECTIVE 22
      4. MARKET STRUCTURE 23
    4. Research Methodology 24
      1. RESEARCH PROCESS 24
      2. PRIMARY RESEARCH 25
      3. SECONDARY RESEARCH 26
      4. MARKET SIZE ESTIMATION 27
      5. FORECAST MODEL 28
      6. LIST OF ASSUMPTIONS & LIMITATIONS 29
    5. MARKET DYNAMICS 30
      1. INTRODUCTION 30
      2. DRIVERS 31
        1. LARGE POOL OF PEOPLE SUFFERING FROM CARDIOVASCULAR DISEASE AS WELL AS DIABETES 31
        2. FAVORABLE POLICIES LAID DOWN BY THE GOVERNMENT BODIES 32
        3. DRIVER IMPACT ANALYSIS 33
      3. RESTRAINTS 33
        1. CONTRADICTORY RESULTS OF SUGAR REDUCING INGREDIENTS IN CLINICAL TRIALS 33
        2. RESTRAINT IMPACT ANALYSIS 34
      4. OPPORTUNITIES 34
        1. GROWING EXPANSION POLICIES ADOPTED BY KEY PLAYERS 34
      5. CHALLENGES 35
        1. STRINGENT GOVERNMENT REGULATION 35
    6. MARKET FACTOR ANALYSIS 36
      1. VALUE CHAIN ANALYSIS 36
        1. RAW MATERIAL PROCUREMENT 37
        2. MANUFACTURING 37
        3. PACKAGING 38
      2. SUPPLY CHAIN ANALYSIS 39
        1. RAW MATERIALS SOURCING 39
        2. MANUFACTURING 40
        3. DISTRIBUTION 40
        4. END-USER 40
      3. PORTER''S FIVE FORCES MODEL 41
        1. BARGAINING POWER OF SUPPLIERS 42
        2. BARGAINING POWER OF BUYERS 42
        3. THREAT OF NEW ENTRANTS 42
        4. THREAT OF SUBSTITUTES 43
        5. INTENSITY OF RIVALRY 43
      4. IMPACT OF INFLATION ON GLOBAL SUGAR REDUCING INGREDIENTS MARKET 43
      5. SUSTAINABILITY IN SUGAR REDUCING INGREDIENTS MARKET 44
      6. IMPACT OF COVID-19 OUTBREAK ON GLOBAL SUGAR REDUCING INGREDIENTS MARKET 45
        1. IMPACT ON PRODUCTION 45
        2. IMPACT ON SUPPLY CHAIN 45
        3. IMPACT ON PRICING 45
        4. IMPACT ON CONSUMER BUYING BEHAVIOUR 46
        5. IMPACT ON OFFLINE VS ONLINE SALES 46
    7. GLOBAL SUGAR REDUCING INGREDIENTS MARKET, BY FUNCTION 47
      1. OVERVIEW 47
        1. GLOBAL SUGAR REDUCING INGREDIENTS MARKET ESTIMATES & FORECAST, BY FUNCTION, 2020–2030 48
      2. SWEETENERS 48
        1. SWEETENERS: MARKET ESTIMATES & FORECAST, BY REGION, 2020–2030 48
      3. BULKING AGENTS 49
        1. BULKING AGENTS: MARKET ESTIMATES & FORECAST, BY REGION, 2020–2030 49
      4. TEXTURANTS 50
        1. TEXTURANTS: MARKET ESTIMATES & FORECAST, BY REGION, 2020–2030 50
    8. GLOBAL SUGAR REDUCING INGREDIENTS MARKET, BY APPLICATION 51
      1. OVERVIEW 51
        1. GLOBAL SUGAR REDUCING INGREDIENTS MARKET ESTIMATES & FORECAST, BY APPLICATION, 2020–2030 52
      2. FOOD & BEVERAGE 52
        1. BAKERY & CONFECTIONERY 52
        2. BEVERAGES 52
        3. DAIRY & DESSERTS 53
        4. SNACKS & SAVORY 53
        5. FOOD & BEVERAGE: MARKET ESTIMATES & FORECAST, BY REGION, 2020–2030 53
      3. PHARMACEUTICALS & NUTRACEUTICALS 54
        1. PHARMACEUTICALS & NUTRACEUTICALS: MARKET ESTIMATES & FORECAST, BY REGION, 2020–2030 54
    9. GLOBAL SUGAR REDUCING INGREDIENTS MARKET, BY DISTRIBUTION CHANNEL 55
      1. OVERVIEW 55
        1. GLOBAL SUGAR REDUCING INGREDIENTS MARKET ESTIMATES & FORECAST, BY DISTRIBUTION CHANNEL, 2020–2030 56
      2. B2B 57
        1. B2B: MARKET ESTIMATES & FORECAST, BY REGION, 2020–2030 57
      3. B2C 57
        1. B2C: MARKET ESTIMATES & FORECAST, BY REGION, 2020–2030 57
    10. GLOBAL SUGAR REDUCING INGREDIENTS MARKET, BY REGION 59
      1. OVERVIEW 59
        1. GLOBAL SUGAR REDUCING INGREDIENTS MARKET ESTIMATES & FORECAST, BY REGION, 2020–2030 60
      2. NORTH AMERICA 60
        1. NORTH AMERICA SUGAR REDUCING INGREDIENTS MARKET ESTIMATES & FORECAST, BY COUNTRY, 2020–2030 61
        2. NORTH AMERICA SUGAR REDUCING INGREDIENTS MARKET ESTIMATES & FORECAST, BY FUNCTION, 2020–2030 62
        3. NORTH AMERICA SUGAR REDUCING INGREDIENTS MARKET ESTIMATES & FORECAST, BY APPLICATION, 2020–2030 62
        4. NORTH AMERICA SUGAR REDUCING INGREDIENTS MARKET ESTIMATES & FORECAST, BY DISTRIBUTION CHANNEL, 2020–2030 62
        5. US 63
        6. CANADA 64
        7. MEXICO 65
      3. EUROPE 66
        1. EUROPE SUGAR REDUCING INGREDIENTS MARKET ESTIMATES & FORECAST, BY COUNTRY, 2020–2030 67
        2. EUROPE SUGAR REDUCING INGREDIENTS MARKET ESTIMATES & FORECAST, BY FUNCTION, 2020–2030 67
        3. EUROPE SUGAR REDUCING INGREDIENTS MARKET ESTIMATES & FORECAST, BY APPLICATION, 2020–2030 67
        4. EUROPE SUGAR REDUCING INGREDIENTS MARKET ESTIMATES & FORECAST, BY DISTRIBUTION CHANNEL, 2020–2030 68
        5. GERMANY 68
        6. UK 69
        7. FRANCE 70
        8. SPAIN 71
        9. ITALY 72
        10. REST OF EUROPE 73
      4. ASIA-PACIFIC 74
        1. ASIA-PACIFIC SUGAR REDUCING INGREDIENTS MARKET ESTIMATES & FORECAST, BY COUNTRY, 2020–2030 75
        2. ASIA-PACIFIC SUGAR REDUCING INGREDIENTS MARKET ESTIMATES & FORECAST, BY FUNCTION, 2020–2030 75
        3. ASIA-PACIFIC SUGAR REDUCING INGREDIENTS MARKET ESTIMATES & FORECAST, BY APPLICATION, 2020–2030 75
        4. ASIA-PACIFIC SUGAR REDUCING INGREDIENTS MARKET ESTIMATES & FORECAST, BY DISTRIBUTION CHANNEL, 2020–2030 76
        5. CHINA 76
        6. INDIA 77
        7. JAPAN 78
        8. AUSTRALIA & NEW ZEALAND 79
        9. REST OF ASIA-PACIFIC 80
      5. REST OF THE WORLD 81
        1. REST OF THE WORLD SUGAR REDUCING INGREDIENTS MARKET ESTIMATES & FORECAST, BY COUNTRY, 2020–2030 81
        2. REST OF THE WORLD SUGAR REDUCING INGREDIENTS MARKET ESTIMATES & FORECAST, BY FUNCTION, 2020–2030 82
        3. REST OF THE WORLD SUGAR REDUCING INGREDIENTS MARKET ESTIMATES & FORECAST, BY APPLICATION, 2020–2030 82
        4. REST OF THE WORLD SUGAR REDUCING INGREDIENTS MARKET ESTIMATES & FORECAST, BY DISTRIBUTION CHANNEL, 2020–2030 82
        5. SOUTH AMERICA 83
        6. MIDDLE EAST 84
        7. AFRICA 85
    11. Competitive Landscape 86
      1. INTRODUCTION 86
      2. MARKET STRATEGY ANALYSIS 86
      3. COMPETITIVE BENCHMARKING 87
      4. KEY DEVELOPMENTS & GROWTH STRATEGIES 88
        1. NEW PRODUCT LAUNCH 88
    12. COMPANY PROFILES- SUGAR REDUCING INGREDIENTS MANUFACTURERS 90
      1. INGREDION INCORPORATED 90
        1. COMPANY OVERVIEW 90
        2. FINANCIAL OVERVIEW 91
        3. PRODUCTS OFFERED 92
        4. KEY DEVELOPMENTS 92
        5. SWOT ANALYSIS 93
        6. KEY STRATEGIES 93
      2. ADM 94
        1. COMPANY OVERVIEW 94
        2. FINANCIAL OVERVIEW 95
        3. PRODUCTS OFFERED 95
        4. KEY DEVELOPMENTS 96
        5. SWOT ANALYSIS 96
        6. KEY STRATEGIES 97
      3. ROQUETTE FRÈRES 98
        1. COMPANY OVERVIEW 98
        2. FINANCIAL OVERVIEW 98
        3. PRODUCTS OFFERED 98
        4. KEY DEVELOPMENTS 98
        5. KEY STRATEGIES 99
      4. DUPONT 100
        1. COMPANY OVERVIEW 100
        2. FINANCIAL OVERVIEW 100
        3. PRODUCTS OFFERED 101
        4. KEY DEVELOPMENTS 101
        5. SWOT ANALYSIS 101
        6. KEY STRATEGIES 102
      5. CARGILL INCORPORATED 103
        1. COMPANY OVERVIEW 103
        2. FINANCIAL OVERVIEW 103
        3. PRODUCTS OFFERED 104
        4. KEY DEVELOPMENTS 104
        5. SWOT ANALYSIS 105
        6. KEY STRATEGIES 105
      6. TATE & LYLE 106
        1. COMPANY OVERVIEW 106
        2. FINANCIAL OVERVIEW 106
        3. PRODUCTS OFFERED 107
        4. KEY DEVELOPMENTS 107
        5. SWOT ANALYSIS 108
        6. KEY STRATEGIES 108
      7. KERRY GROUP 109
        1. COMPANY OVERVIEW 109
        2. FINANCIAL OVERVIEW 109
        3. PRODUCTS OFFERED 109
        4. KEY DEVELOPMENTS 110
        5. SWOT ANALYSIS 110
        6. KEY STRATEGIES 110
      8. INTERNATIONAL FLAVORS & FRAGRANCES, INC. 111
        1. COMPANY OVERVIEW 111
        2. FINANCIAL OVERVIEW 111
        3. PRODUCTS OFFERED 112
        4. KEY DEVELOPMENTS 112
        5. SWOT ANALYSIS 113
        6. KEY STRATEGIES 113
      9. GLG LIFE TECH CORP. 114
        1. COMPANY OVERVIEW 114
        2. FINANCIAL OVERVIEW 115
        3. PRODUCTS OFFERED 115
        4. KEY DEVELOPMENTS 116
        5. KEY STRATEGIES 116
      10. SÜDZUCKER AG 117
        1. COMPANY OVERVIEW 117
        2. FINANCIAL OVERVIEW 118
        3. PRODUCTS OFFERED 118
        4. KEY DEVELOPMENTS 119
        5. KEY STRATEGIES 119
    13. List of Tables and Figures
      1. LIST OF TABLES
      2. TABLE 1 PRIMARY INTERVIEWS 25
      3. TABLE 2 LIST OF ASSUMPTIONS & LIMITATIONS 29
      4. TABLE 3 GLOBAL SUGAR REDUCING INGREDIENTS MARKET ESTIMATES & FORECAST, BY FUNCTION, 2020–2030 (USD MILLION) 48
      5. TABLE 4 SWEETENERS: MARKET ESTIMATES & FORECAST, BY REGION, 2020–2030 (USD MILLION) 48
      6. TABLE 5 BULKING AGENTS: MARKET ESTIMATES & FORECAST, BY REGION, 2020–2030 (USD MILLION) 49
      7. TABLE 6 TEXTURANTS: MARKET ESTIMATES & FORECAST, BY REGION, 2020–2030 (USD MILLION) 50
      8. TABLE 7 GLOBAL SUGAR REDUCING INGREDIENTS MARKET ESTIMATES & FORECAST, BY APPLICATION, 2020–2030 (USD MILLION) 52
      9. TABLE 8 FOOD & BEVERAGE: MARKET ESTIMATES & FORECAST, BY REGION, 2020–2030 (USD MILLION) 53
      10. TABLE 9 PHARMACEUTICALS & NUTRACEUTICALS: MARKET ESTIMATES & FORECAST, BY REGION, 2020–2030 (USD MILLION) 54
      11. TABLE 10 GLOBAL SUGAR REDUCING INGREDIENTS MARKET ESTIMATES & FORECAST, BY DISTRIBUTION CHANNEL, 2020–2030 (USD MILLION) 56
      12. TABLE 11 B2B: MARKET ESTIMATES & FORECAST, BY REGION, 2020–2030 (USD MILLION) 57
      13. TABLE 12 B2C: MARKET ESTIMATES & FORECAST, BY REGION, 2020–2030 (USD MILLION) 57
      14. TABLE 13 GLOBAL SUGAR REDUCING INGREDIENTS MARKET ESTIMATES & FORECAST, BY REGION, 2020–2030 (USD MILLION) 60
      15. TABLE 14 NORTH AMERICA: MARKET ESTIMATES & FORECAST, BY COUNTRY, 2020–2030 (USD MILLION) 61
      16. TABLE 15 NORTH AMERICA: MARKET ESTIMATES, BY FUNCTION, 2020–2030 (USD MILLION) 62
      17. TABLE 16 NORTH AMERICA: MARKET ESTIMATES, BY APPLICATION, 2020–2030 (USD MILLION) 62
      18. TABLE 17 NORTH AMERICA: MARKET ESTIMATES, BY DISTRIBUTION CHANNEL, 2020–2030 (USD MILLION) 62
      19. TABLE 18 US: MARKET ESTIMATES, BY FUNCTION, 2020–2030 (USD MILLION) 63
      20. TABLE 19 US: MARKET ESTIMATES, BY APPLICATION, 2020–2030 (USD MILLION) 63
      21. TABLE 20 US: MARKET ESTIMATES, BY DISTRIBUTION CHANNEL, 2020–2030 (USD MILLION) 63
      22. TABLE 21 CANADA: MARKET ESTIMATES, BY FUNCTION, 2020–2030 (USD MILLION) 64
      23. TABLE 22 CANADA: MARKET ESTIMATES, BY APPLICATION, 2020–2030 (USD MILLION) 64
      24. TABLE 23 CANADA: MARKET ESTIMATES, BY DISTRIBUTION CHANNEL, 2020–2030 (USD MILLION) 64
      25. TABLE 24 MEXICO: MARKET ESTIMATES, BY FUNCTION, 2020–2030 (USD MILLION) 65
      26. TABLE 25 MEXICO: MARKET ESTIMATES, BY APPLICATION, 2020–2030 (USD MILLION) 65
      27. TABLE 26 MEXICO: MARKET ESTIMATES, BY DISTRIBUTION CHANNEL, 2020–2030 (USD MILLION) 65
      28. TABLE 27 EUROPE: MARKET ESTIMATES & FORECAST, BY COUNTRY, 2020–2030 (USD MILLION) 67
      29. TABLE 28 EUROPE: MARKET ESTIMATES, BY FUNCTION, 2020–2030 (USD MILLION) 67
      30. TABLE 29 EUROPE: MARKET ESTIMATES, BY APPLICATION, 2020–2030 (USD MILLION) 67
      31. TABLE 30 EUROPE: MARKET ESTIMATES, BY DISTRIBUTION CHANNEL, 2020–2030 (USD MILLION) 68
      32. TABLE 31 GERMANY: MARKET ESTIMATES, BY FUNCTION, 2020–2030 (USD MILLION) 68
      33. TABLE 32 GERMANY: MARKET ESTIMATES, BY APPLICATION, 2020–2030 (USD MILLION) 68
      34. TABLE 33 GERMANY: MARKET ESTIMATES, BY DISTRIBUTION CHANNEL, 2020–2030 (USD MILLION) 68
      35. TABLE 34 UK: MARKET ESTIMATES, BY FUNCTION, 2020–2030 (USD MILLION) 69
      36. TABLE 35 UK: MARKET ESTIMATES, BY APPLICATION, 2020–2030 (USD MILLION) 69
      37. TABLE 36 UK: MARKET ESTIMATES, BY DISTRIBUTION CHANNEL, 2020–2030 (USD MILLION) 69
      38. TABLE 37 FRANCE: MARKET ESTIMATES, BY FUNCTION, 2020–2030 (USD MILLION) 70
      39. TABLE 38 FRANCE: MARKET ESTIMATES, BY APPLICATION, 2020–2030 (USD MILLION) 70
      40. TABLE 39 FRANCE: MARKET ESTIMATES, BY DISTRIBUTION CHANNEL, 2020–2030 (USD MILLION) 70
      41. TABLE 40 SPAIN: MARKET ESTIMATES, BY FUNCTION, 2020–2030 (USD MILLION) 71
      42. TABLE 41 SPAIN: MARKET ESTIMATES, BY APPLICATION, 2020–2030 (USD MILLION) 71
      43. TABLE 42 SPAIN: MARKET ESTIMATES, BY DISTRIBUTION CHANNEL, 2020–2030 (USD MILLION) 71
      44. TABLE 43 ITALY: MARKET ESTIMATES, BY FUNCTION, 2020–2030 (USD MILLION) 72
      45. TABLE 44 ITALY: MARKET ESTIMATES, BY APPLICATION, 2020–2030 (USD MILLION) 72
      46. TABLE 45 ITALY: MARKET ESTIMATES, BY DISTRIBUTION CHANNEL, 2020–2030 (USD MILLION) 72
      47. TABLE 46 REST OF EUROPE: MARKET ESTIMATES, BY FUNCTION, 2020–2030 (USD MILLION) 73
      48. TABLE 47 REST OF EUROPE: MARKET ESTIMATES, BY APPLICATION, 2020–2030 (USD MILLION) 73
      49. TABLE 48 REST OF EUROPE: MARKET ESTIMATES, BY DISTRIBUTION CHANNEL, 2020–2030 (USD MILLION) 73
      50. TABLE 49 ASIA-PACIFIC: MARKET ESTIMATES & FORECAST, BY COUNTRY, 2020–2030 (USD MILLION) 75
      51. TABLE 50 ASIA-PACIFIC: MARKET ESTIMATES, BY FUNCTION, 2020–2030 (USD MILLION) 75
      52. TABLE 51 ASIA-PACIFIC: MARKET ESTIMATES, BY APPLICATION, 2020–2030 (USD MILLION) 75
      53. TABLE 52 ASIA-PACIFIC: MARKET ESTIMATES, BY DISTRIBUTION CHANNEL, 2020–2030 (USD MILLION) 76
      54. TABLE 53 CHINA: MARKET ESTIMATES, BY FUNCTION, 2020–2030 (USD MILLION) 76
      55. TABLE 54 CHINA: MARKET ESTIMATES, BY APPLICATION, 2020–2030 (USD MILLION) 76
      56. TABLE 55 CHINA: MARKET ESTIMATES, BY DISTRIBUTION CHANNEL, 2020–2030 (USD MILLION) 76
      57. TABLE 56 INDIA: MARKET ESTIMATES, BY FUNCTION, 2020–2030 (USD MILLION) 77
      58. TABLE 57 INDIA: MARKET ESTIMATES, BY APPLICATION, 2020–2030 (USD MILLION) 77
      59. TABLE 58 INDIA: MARKET ESTIMATES, BY DISTRIBUTION CHANNEL, 2020–2030 (USD MILLION) 77
      60. TABLE 59 JAPAN: MARKET ESTIMATES, BY FUNCTION, 2020–2030 (USD MILLION) 78
      61. TABLE 60 JAPAN: MARKET ESTIMATES, BY APPLICATION, 2020–2030 (USD MILLION) 78
      62. TABLE 61 JAPAN: MARKET ESTIMATES, BY DISTRIBUTION CHANNEL, 2020–2030 (USD MILLION) 78
      63. TABLE 62 AUSTRALIA & NEW ZEALAND: MARKET ESTIMATES, BY FUNCTION, 2020–2030 (USD MILLION) 79
      64. TABLE 63 AUSTRALIA & NEW ZEALAND: MARKET ESTIMATES, BY APPLICATION, 2020–2030 (USD MILLION) 79
      65. TABLE 64 AUSTRALIA & NEW ZEALAND: MARKET ESTIMATES, BY DISTRIBUTION CHANNEL, 2020–2030 (USD MILLION) 79
      66. TABLE 65 REST OF ASIA-PACIFIC: MARKET ESTIMATES, BY FUNCTION, 2020–2030 (USD MILLION) 80
      67. TABLE 66 REST OF ASIA-PACIFIC: MARKET ESTIMATES, BY APPLICATION, 2020–2030 (USD MILLION) 80
      68. TABLE 67 REST OF ASIA-PACIFIC: MARKET ESTIMATES, BY DISTRIBUTION CHANNEL, 2020–2030 (USD MILLION) 80
      69. TABLE 68 REST OF THE WORLD: MARKET ESTIMATES & FORECAST, BY REGION, 2020–2030 (USD MILLION) 81
      70. TABLE 69 REST OF THE WORLD: MARKET ESTIMATES, BY FUNCTION, 2020–2030 (USD MILLION) 82
      71. TABLE 70 REST OF THE WORLD: MARKET ESTIMATES, BY APPLICATION, 2020–2030 (USD MILLION) 82
      72. TABLE 71 REST OF THE WORLD: MARKET ESTIMATES, BY DISTRIBUTION CHANNEL, 2020–2030 (USD MILLION) 82
      73. TABLE 72 SOUTH AMERICA: MARKET ESTIMATES, BY FUNCTION, 2020–2030 (USD MILLION) 83
      74. TABLE 73 SOUTH AMERICA: MARKET ESTIMATES, BY APPLICATION, 2020–2030 (USD MILLION) 83
      75. TABLE 74 SOUTH AMERICA: MARKET ESTIMATES, BY DISTRIBUTION CHANNEL, 2020–2030 (USD MILLION) 83
      76. TABLE 75 MIDDLE EAST: MARKET ESTIMATES, BY FUNCTION, 2020–2030 (USD MILLION) 84
      77. TABLE 76 MIDDLE EAST: MARKET ESTIMATES, BY APPLICATION, 2020–2030 (USD MILLION) 84
      78. TABLE 77 MIDDLE EAST: MARKET ESTIMATES, BY DISTRIBUTION CHANNEL, 2020–2030 (USD MILLION) 84
      79. TABLE 78 AFRICA: MARKET ESTIMATES, BY FUNCTION, 2020–2030 (USD MILLION) 85
      80. TABLE 79 AFRICA: MARKET ESTIMATES, BY APPLICATION, 2020–2030 (USD MILLION) 85
      81. TABLE 80 AFRICA: MARKET ESTIMATES, BY DISTRIBUTION CHANNEL, 2020–2030 (USD MILLION) 85
      82. TABLE 81 NEW PRODUCT LAUNCH 88
      83. TABLE 82 INGREDION INCORPORATED: PRODUCTS OFFERED 92
      84. TABLE 83 INGREDION INCORPORATED: KEY DEVELOPMENTS 92
      85. TABLE 84 ADM: PRODUCTS OFFERED 95
      86. TABLE 85 ADM: KEY DEVELOPMENTS 96
      87. TABLE 86 ROQUETTE FRÈRES: PRODUCTS OFFERED 98
      88. TABLE 87 ROQUETTE FRÈRES: KEY DEVELOPMENTS 98
      89. TABLE 88 DUPONT: PRODUCTS OFFERED 101
      90. TABLE 89 DUPONT: KEY DEVELOPMENTS 101
      91. TABLE 90 CARGILL INCORPORATED: PRODUCTS OFFERED 104
      92. TABLE 91 CARGILL INCORPORATED: KEY DEVELOPMENTS 104
      93. TABLE 92 TATE & LYLE: PRODUCTS OFFERED 107
      94. TABLE 93 TATE & LYLE: KEY DEVELOPMENTS 107
      95. TABLE 94 KERRY GROUP: PRODUCTS OFFERED 109
      96. TABLE 95 INTERNATIONAL FLAVORS & FRAGRANCES, INC.: PRODUCTS OFFERED 112
      97. TABLE 96 INTERNATIONAL FLAVORS & FRAGRANCES, INC.: KEY DEVELOPMENTS 112
      98. TABLE 97 GLG LIFE TECH CORP.: PRODUCTS OFFERED 115
      99. TABLE 98 GLG LIFE TECH CORP.: KEY DEVELOPMENTS 116
      100. TABLE 99 SÜDZUCKER AG: PRODUCTS OFFERED 118
      101. TABLE 100 SÜDZUCKER AG: KEY DEVELOPMENTS 119   LIST OF FIGURES
      102. FIGURE 1 MARKET SYNOPSIS 17
      103. FIGURE 2 GLOBAL SUGAR REDUCING INGREDIENTS MARKET ANALYSIS BY FUNCTION 18
      104. FIGURE 3 GLOBAL SUGAR REDUCING INGREDIENTS MARKET ANALYSIS BY APPLICATION 19
      105. FIGURE 4 GLOBAL SUGAR REDUCING INGREDIENTS MARKET ANALYSIS BY DISTRIBUTION CHANNEL 20
      106. FIGURE 5 GLOBAL SUGAR REDUCING INGREDIENTS MARKET ANALYSIS BY REGION 21
      107. FIGURE 6 GLOBAL SUGAR REDUCING INGREDIENTS MARKET: STRUCTURE 23
      108. FIGURE 7 RESEARCH PROCESS 24
      109. FIGURE 8 TOP-DOWN & Bottom-up ApproachES 27
      110. FIGURE 9 MARKET DYNAMIC ANALYSIS OF THE GLOBAL SUGAR REDUCING INGREDIENTS MARKET 30
      111. FIGURE 10 PERCENTAGE OF ADULTS IN THE U.S. WHO WERE TOLD BY A DOCTOR THEY HAD A STROKE AS OF 2018, BY REGION 31
      112. FIGURE 11 COUNTRIES WITH THE HIGHEST NUMBER OF DIABETICS WORLDWIDE IN 2021 32
      113. FIGURE 12 VALUE CHAIN: GLOBAL SUGAR REDUCING INGREDIENTS MARKET 36
      114. FIGURE 13 GLOBAL SUGAR REDUCING INGREDIENTS MARKET: SUPPLY CHAIN ANALYSIS 39
      115. FIGURE 14 PORTER''S FIVE FORCES ANALYSIS OF THE GLOBAL SUGAR REDUCING INGREDIENTS MARKET 41
      116. FIGURE 15 GLOBAL SUGAR REDUCING INGREDIENTS MARKET, BY FUNCTION, 2021 (% SHARE) 47
      117. FIGURE 16 GLOBAL SUGAR REDUCING INGREDIENTS MARKET, BY FUNCTION, 2020–2030 (USD MILLION) 47
      118. FIGURE 17 GLOBAL SUGAR REDUCING INGREDIENTS MARKET, BY APPLICATION, 2021 (% SHARE) 51
      119. FIGURE 18 GLOBAL SUGAR REDUCING INGREDIENTS MARKET, BY APPLICATION, 2020–2030 (USD MILLION) 51
      120. FIGURE 19 GLOBAL SUGAR REDUCING INGREDIENTS MARKET, BY DISTRIBUTION CHANNEL, 2021 (% SHARE) 55
      121. FIGURE 20 GLOBAL SUGAR REDUCING INGREDIENTS MARKET, BY DISTRIBUTION CHANNEL, 2020–2030 (USD MILLION) 56
      122. FIGURE 21 GLOBAL SUGAR REDUCING INGREDIENTS MARKET, BY REGION, 2021 (% SHARE) 59
      123. FIGURE 22 GLOBAL SUGAR REDUCING INGREDIENTS MARKET, BY REGION, 2020–2030 (USD MILLION) 59
      124. FIGURE 23 NORTH AMERICA: SUGAR REDUCING INGREDIENTS MARKET SHARE, BY COUNTRY, 2021 (% SHARE) 61
      125. FIGURE 24 EUROPE: SUGAR REDUCING INGREDIENTS MARKET SHARE, BY COUNTRY, 2021 (% SHARE) 66
      126. FIGURE 25 ASIA-PACIFIC: SUGAR REDUCING INGREDIENTS MARKET SHARE, BY COUNTRY, 2021 (% SHARE) 74
      127. FIGURE 26 REST OF THE WORLD: SUGAR REDUCING INGREDIENTS MARKET SHARE, BY COUNTRY, 2021 (% SHARE) 81
      128. FIGURE 27 BENCHMARKING OF MAJOR COMPETITORS 87
      129. FIGURE 28 INGREDION INCORPORATED: FINANCIAL OVERVIEW SNAPSHOT 91
      130. FIGURE 29 INGREDION INCORPORATED: SWOT ANALYSIS 93
      131. FIGURE 30 ADM: FINANCIAL OVERVIEW SNAPSHOT 95
      132. FIGURE 31 ADM: SWOT ANALYSIS 96
      133. FIGURE 32 DUPONT: FINANCIAL OVERVIEW SNAPSHOT 100
      134. FIGURE 33 DUPONT: SWOT ANALYSIS 101
      135. FIGURE 34 CARGILL INCORPORATED: FINANCIAL OVERVIEW SNAPSHOT 103
      136. FIGURE 35 CARGILL INCORPORATED: SWOT ANALYSIS 105
      137. FIGURE 36 TATE & LYLE: FINANCIAL OVERVIEW SNAPSHOT 106
      138. FIGURE 37 TATE & LYLE: SWOT ANALYSIS 108
      139. FIGURE 38 KERRY GROUP: FINANCIAL OVERVIEW SNAPSHOT 109
      140. FIGURE 39 KERRY GROUP: SWOT ANALYSIS 110
      141. FIGURE 40 INTERNATIONAL FLAVORS & FRAGRANCES, INC.: FINANCIAL OVERVIEW SNAPSHOT 111
      142. FIGURE 41 INTERNATIONAL FLAVORS & FRAGRANCES, INC.: SWOT ANALYSIS 113
      143. FIGURE 42 GLG LIFE TECH CORP.: FINANCIAL OVERVIEW SNAPSHOT 115
      144. FIGURE 43 SÜDZUCKER AG: FINANCIAL OVERVIEW SNAPSHOT 118   LIST OF ABBREVIATION Abbreviation Full Form US United States UK United Kingdom ME&A Middle East & Africa RoW Rest of the World CAGR Compound Annual Growth Rate   1 Executive Summary The global sugar reducing ingredients market is projected to witness significant growth during the review period, exhibiting a CAGR of 5.39%. The market was estimated to be USD 31,947.79 million in 2021 and is expected to reach a value of USD 50,022.89 million by the end of the forecast period (2022-2030). The global sugar reducing ingredients market has been gaining momentum in recent years, driven by various factors such as the rising prevalence of diabetes and cardiovascular diseases, favorable government policies, and increasing consumer awareness about the health risks of consuming excessive sugar. This market is expected to grow at a steady pace in the coming years, providing opportunities for businesses that produce sugar-reducing ingredients and products. One of the primary drivers of the market is the large pool of people suffering from diabetes and cardiovascular diseases. These conditions are often associated with high sugar intake and can be managed by reducing sugar consumption. Sugar-reducing ingredients, such as artificial sweeteners, natural sweeteners, and sugar substitutes, are increasingly being used in a variety of products to cater to this growing demand. Low-calorie drinks, baked goods, and confectionery products are some of the most popular applications of these ingredients. Moreover, favorable government policies have been instrumental in driving the growth of the market. Governments around the world are introducing regulations aimed at reducing sugar consumption and promoting healthy eating habits. However, one of the main restraints to the growth of the market is the contradictory results of clinical trials on sugar-reducing ingredients. Some studies have shown that these ingredients can be effective in reducing sugar intake and managing diabetes and cardiovascular diseases. However, other studies have found no significant benefit in reducing sugar intake. This has led to uncertainty among consumers and manufacturers about the effectiveness of sugar-reducing ingredients. As a result, companies are investing in research and development to create new and innovative ingredients that offer better results and can be used in a wider range of products. The market presents numerous opportunities for growth, particularly through the growing expansion policies adopted by key players. Many companies are investing in research and development to create new and innovative sugar-reducing ingredients that offer better results and can be used in a wider range of products. For example, some companies are developing sweeteners that mimic the taste of sugar but with fewer calories. Others are using natural sweeteners, such as stevia, to create low-calorie products that appeal to health-conscious consumers. However, the industry faces challenges such as stringent government regulations that govern the use of sugar-reducing ingredients. Manufacturers must comply with complex regulations and guidelines, which can be costly and time-consuming. Moreover, the approval process for new ingredients can be lengthy and uncertain, which can limit the entry of new players in the market and affect the overall growth of the industry.  
      145. FIGURE 1 MARKET SYNOPSIS Source: MRFR Analysis   1.1 GLOBAL SUGAR REDUCING INGREDIENTS MARKET, BY FUNCTION
      146. FIGURE 2 GLOBAL SUGAR REDUCING INGREDIENTS MARKET ANALYSIS BY FUNCTION Source: MRFR Analysis   1.2 GLOBAL SUGAR REDUCING INGREDIENTS MARKET, BY APPLICATION
      147. FIGURE 3 GLOBAL SUGAR REDUCING INGREDIENTS MARKET ANALYSIS BY APPLICATION Source: MRFR Analysis   1.3 GLOBAL SUGAR REDUCING INGREDIENTS MARKET, BY DISTRIBUTION CHANNEL
      148. FIGURE 4 GLOBAL SUGAR REDUCING INGREDIENTS MARKET ANALYSIS BY DISTRIBUTION CHANNEL Source: MRFR Analysis   1.4 GLOBAL SUGAR REDUCING INGREDIENTS MARKET, BY REGION
      149. FIGURE 5 GLOBAL SUGAR REDUCING INGREDIENTS MARKET ANALYSIS BY REGION Source: MRFR Analysis   2 Market Introduction 2.1 DEFINITION The sugar reducing ingredients market refers to the food ingredients that are used as substitutes for traditional sugar in various food and beverage products. These ingredients are intended to provide sweetness to foods and beverages without adding the same amount of calories or raising blood sugar levels as traditional sugar. Sugar reducing ingredients also helps in maintaining the texture of the products without adding sugar. Some of the most commonly used sugar reducing ingredients in the market include natural sweeteners such as stevia, monk fruit, and erythritol, as well as artificial sweeteners like aspartame, sucralose, and saccharin. Other ingredients, such as honey, inulin, polydextrose, and maltodextrin, are used to add bulk and texture to products while reducing the overall sugar content. The market for sugar reducing ingredients has grown significantly in recent years, driven by increasing consumer demand for healthier food and beverage options. Consumers are becoming more aware of the negative health effects of consuming high levels of sugar, including obesity, diabetes, and heart disease, and are seeking out products that are lower in sugar. 2.2 Scope of the Study The scope of the global sugar reducing ingredients market study includes the market size analysis and a detailed analysis of the manufacturers’ products and strategies. The market has been segmented based on the function, application, distribution channel, and region. 2.3 RESEARCH OBJECTIVE  To provide a comprehensive analysis of the sugar reducing ingredients industry and its sub-segments in the global market, thereby providing a detailed structure of the industry  To provide detailed insights into factors driving and restraining the growth of the global sugar reducing ingredients market  To estimate the market size of the global sugar reducing ingredients market where 2020 would be the historical year, 2021 shall be the base year, and 2022 to 2030 will be the forecast period for the study  To analyze the global sugar reducing ingredients market in four main geographies, namely, North America, Europe, Asia-Pacific, and the Rest of the World.  To provide country-wise market value analysis for various segments of the sugar reducing ingredients market  To provide strategic profiling of key companies (manufacturers and distributors) present across the globe and comprehensively analyze their competitiveness/Competitive Landscape in this market  To provide a distribution chain analysis/value chain for the global sugar reducing ingredients market   2.4 MARKET STRUCTURE
      150. FIGURE 6 GLOBAL SUGAR REDUCING INGREDIENTS MARKET: STRUCTURE Source: MRFR Analysis   3 Research Methodology 3.1 RESEARCH PROCESS Market Research Future analysis is based on interviews with industry experts who offer insight into the market structure, Market Segmentation, technology assessment, Competitive Landscape (CL), market penetration, and emerging trends. Besides primary interviews (~80%) and secondary research (~20%), their analysis is based on years of professional expertise in their respective industries. Our analysts also predict where the market will be headed in the next five to 10 years by analyzing historical trends and the current market position. Furthermore, the varying trends in segments and categories in each region are studied and estimated based on primary and secondary research.
      151. FIGURE 7 RESEARCH PROCESS Source: MRFR Analysis
      152. TABLE 1 PRIMARY INTERVIEWS Region Manufacturers Retailers Consumers Total Number of Primary Interviews North America 45% 25% 50% 100 Europe 35% 25% 40% 100 Asia-Pacific 35% 25% 30% 60 Rest of the World 20% 20% 25% 50 3.2 PRIMARY RESEARCH Extensive primary research was conducted to gain a deeper insight into the market and the industry performance. For this particular report, we have conducted primary surveys (interviews) with the key level executives (VPs, CEOs, marketing directors, and business development managers, among others) of the major players active in the market. In addition to analyzing the current and historical trends, our analysts predict where the market is headed in the next five years.   3.3 SECONDARY RESEARCH Secondary research was mainly used to collect and identify information useful for an extensive, technical, market-oriented, and commercial study of the global zipper market. It was also used to obtain key information about major players, market classification, and segmentation according to industry trends, geographical markets, and developments related to the market and technology. For this study, analysts have gathered information from various credible sources such as annual reports, SEC filings, journals, white papers, corporate presentations, company websites, international organizations of sugar reducing ingredients, manufacturers, and paid databases.   3.4 MARKET SIZE ESTIMATION Both the top-down and Bottom-up Approaches were used to estimate and validate the size of the market and to estimate the size of various other dependent sub-markets of the overall zipper market. The key players in the market were identified through secondary research, and their market contributions in the respective regions were determined through primary and secondary research. This entire procedure included the study of the annual and financial reports of top market players and extensive interviews for key insights with industry leaders such as CEOs, VPs, directors, and marketing executives. All percentage shares, splits, and breakdowns were determined using secondary sources and verified through primary sources. All the possible parameters that affect the market have been covered in this research study have been accounted for, viewed in extensive detail, verified through primary research, and analyzed to arrive at the final quantitative and qualitative data. This data has been consolidated and detailed inputs and analysis added by Market Research Future before being presented in this report. The following
      153. figure is an illustrative representation of the overall market size estimation process employed for the purpose of this study.
      154. FIGURE 8 TOP-DOWN & Bottom-up ApproachES Source: MRFR Analysis   3.5 FORECAST MODEL Source: MRFR Analysis   3.6 LIST OF ASSUMPTIONS & LIMITATIONS
      155. TABLE 2 LIST OF ASSUMPTIONS & LIMITATIONS Parameter Assumptions & Limitations Currency Value All forecasts have been made with the revenue and value calculated under the standard assumption that the value of the globally accepted currency, the US dollar, remains constant over the next five years. Exchange Rates and Currency For the conversion of various currencies to USD, the average historical exchange rates have been used according to the year specified. For all historical and current exchange rates required for calculations and currency conversions, the OANDA website has been used in this research study. Conversion Niche Market S

    Sugar Reducing Ingredients Market Segmentation

    Sugar Reducing Ingredients Function Outlook (USD Million, 2018-2032)

    • Sweeteners
    • Bulking Agents
    • Texturants

    Sugar Reducing Ingredients Application Outlook (USD Million, 2018-2032)

    • Food & Beverage
      • Bakery & Confectionery
      • Beverages
      • Dairy & Desserts
      • Snacks & Savory
    • Pharmaceuticals & Nutraceuticals

    Sugar Reducing Ingredients Distribution Channel Outlook (USD Million, 2018-2032)

    • B2B
    • B2C

    Sugar Reducing Ingredients Regional Outlook (USD Million, 2018-2032)

    • North America Outlook (USD Million, 2018-2032)
      • North America Sugar Reducing Ingredients by Function
        • Sweeteners
        • Bulking Agents
        • Texturants


    • North America Sugar Reducing Ingredients by Application
      • Food & Beverage
        • Bakery & Confectionery
        • Beverages
        • Dairy & Desserts
        • Snacks & Savory
      • Pharmaceuticals & Nutraceuticals
    • North America Sugar Reducing Ingredients by Distribution Channel
      • B2B
      • B2C
    • US Outlook (USD Million, 2018-2032)
    • US Sugar Reducing Ingredients by Function
      • Sweeteners
      • Bulking Agents
      • Texturants


    • US Sugar Reducing Ingredients by Application
      • Food & Beverage
        • Bakery & Confectionery
        • Beverages
        • Dairy & Desserts
        • Snacks & Savory
      • Pharmaceuticals & Nutraceuticals
    • US Sugar Reducing Ingredients by Distribution Channel
      • B2B
      • B2C


    • Canada Outlook (USD Million, 2018-2032)
    • Canada Sugar Reducing Ingredients by Function
      • Sweeteners
      • Bulking Agents
      • Texturants


    • Canada Sugar Reducing Ingredients by Application
      • Food & Beverage
        • Bakery & Confectionery
        • Beverages
        • Dairy & Desserts
        • Snacks & Savory
      • Pharmaceuticals & Nutraceuticals
    • Canada Sugar Reducing Ingredients by Distribution Channel
      • B2B
      • B2C
    • Mexico Outlook (USD Million, 2018-2032)
    • Mexico Sugar Reducing Ingredients by Function
      • Sweeteners
      • Bulking Agents
      • Texturants


    • Mexico Sugar Reducing Ingredients by Application
      • Food & Beverage
        • Bakery & Confectionery
        • Beverages
        • Dairy & Desserts
        • Snacks & Savory
      • Pharmaceuticals & Nutraceuticals
    • Mexico Sugar Reducing Ingredients by Distribution Channel
      • B2B
      • B2C
    • Europe Outlook (USD Million, 2018-2032)
      • Europe Sugar Reducing Ingredients by Function
        • Sweeteners
        • Bulking Agents
        • Texturants


    • Europe Sugar Reducing Ingredients by Application
      • Food & Beverage
        • Bakery & Confectionery
        • Beverages
        • Dairy & Desserts
        • Snacks & Savory
      • Pharmaceuticals & Nutraceuticals
    • Europe Sugar Reducing Ingredients by Distribution Channel
      • B2B
      • B2C
    • Germany Outlook (USD Million, 2018-2032)
    • Germany Sugar Reducing Ingredients by Function
      • Sweeteners
      • Bulking Agents
      • Texturants


    • Germany Sugar Reducing Ingredients by Application
      • Food & Beverage
        • Bakery & Confectionery
        • Beverages
        • Dairy & Desserts
        • Snacks & Savory
      • Pharmaceuticals & Nutraceuticals
    • Germany Sugar Reducing Ingredients by Distribution Channel
      • B2B
      • B2C


    • France Outlook (USD Million, 2018-2032)
    • France Sugar Reducing Ingredients by Function
      • Sweeteners
      • Bulking Agents
      • Texturants


    • France Sugar Reducing Ingredients by Application
      • Food & Beverage
        • Bakery & Confectionery
        • Beverages
        • Dairy & Desserts
        • Snacks & Savory
      • Pharmaceuticals & Nutraceuticals
    • France Sugar Reducing Ingredients by Distribution Channel
      • B2B
      • B2C
    • UK Outlook (USD Million, 2018-2032)
    • UK Sugar Reducing Ingredients by Function
      • Sweeteners
      • Bulking Agents
      • Texturants


    • UK Sugar Reducing Ingredients by Application
      • Food & Beverage
        • Bakery & Confectionery
        • Beverages
        • Dairy & Desserts
        • Snacks & Savory
      • Pharmaceuticals & Nutraceuticals
    • UK Sugar Reducing Ingredients by Distribution Channel
      • B2B
      • B2C


    • Italy Outlook (USD Million, 2018-2032)
    • Italy Sugar Reducing Ingredients by Function
      • Sweeteners
      • Bulking Agents
      • Texturants


    • Italy Sugar Reducing Ingredients by Application
      • Food & Beverage
        • Bakery & Confectionery
        • Beverages
        • Dairy & Desserts
        • Snacks & Savory
      • Pharmaceuticals & Nutraceuticals
    • Italy Sugar Reducing Ingredients by Distribution Channel
      • B2B
      • B2C


    • Spain Outlook (USD Million, 2018-2032)
    • Spain Sugar Reducing Ingredients by Function
      • Sweeteners
      • Bulking Agents
      • Texturants


    • Spain Sugar Reducing Ingredients by Application
      • Food & Beverage
        • Bakery & Confectionery
        • Beverages
        • Dairy & Desserts
        • Snacks & Savory
      • Pharmaceuticals & Nutraceuticals
    • Spain Sugar Reducing Ingredients by Distribution Channel
      • B2B
      • B2C
    • Rest of Europe Outlook (USD Million, 2018-2032)
    • Rest of Europe Sugar Reducing Ingredients by Function
      • Sweeteners
      • Bulking Agents
      • Texturants


    • Rest of Europe Sugar Reducing Ingredients by Application
      • Food & Beverage
        • Bakery & Confectionery
        • Beverages
        • Dairy & Desserts
        • Snacks & Savory
      • Pharmaceuticals & Nutraceuticals
    • Rest of Europe Sugar Reducing Ingredients by Distribution Channel
      • B2B
      • B2C
    • Asia-Pacific Outlook (USD Million, 2018-2032)
      • Asia-Pacific Sugar Reducing Ingredients by Function
        • Sweeteners
        • Bulking Agents
        • Texturants


    • Asia-Pacific Sugar Reducing Ingredients by Application
      • Food & Beverage
        • Bakery & Confectionery
        • Beverages
        • Dairy & Desserts
        • Snacks & Savory
      • Pharmaceuticals & Nutraceuticals
    • Asia-Pacific Sugar Reducing Ingredients by Distribution Channel
      • B2B
      • B2C
    • China Outlook (USD Million, 2018-2032)
    • China Sugar Reducing Ingredients by Function
      • Sweeteners
      • Bulking Agents
      • Texturants


    • China Sugar Reducing Ingredients by Application
      • Food & Beverage
        • Bakery & Confectionery
        • Beverages
        • Dairy & Desserts
        • Snacks & Savory
      • Pharmaceuticals & Nutraceuticals
    • China Sugar Reducing Ingredients by Distribution Channel
      • B2B
      • B2C


    • India Outlook (USD Million, 2018-2032)
    • India Sugar Reducing Ingredients by Function
      • Sweeteners
      • Bulking Agents
      • Texturants


    • India Sugar Reducing Ingredients by Application
      • Food & Beverage
        • Bakery & Confectionery
        • Beverages
        • Dairy & Desserts
        • Snacks & Savory
      • Pharmaceuticals & Nutraceuticals
    • India Sugar Reducing Ingredients by Distribution Channel
      • B2B
      • B2C
    • Japan Outlook (USD Million, 2018-2032)
    • Japan Sugar Reducing Ingredients by Function
      • Sweeteners
      • Bulking Agents
      • Texturants


    • Japan Sugar Reducing Ingredients by Application
      • Food & Beverage
        • Bakery & Confectionery
        • Beverages
        • Dairy & Desserts
        • Snacks & Savory
      • Pharmaceuticals & Nutraceuticals
    • Japan Sugar Reducing Ingredients by Distribution Channel
      • B2B
      • B2C


    • Australia & Newzealand Outlook (USD Million, 2018-2032)
    • Australia & Newzealand Sugar Reducing Ingredients by Function
      • Sweeteners
      • Bulking Agents
      • Texturants


    • Australia & Newzealand Sugar Reducing Ingredients by Application
      • Food & Beverage
        • Bakery & Confectionery
        • Beverages
        • Dairy & Desserts
        • Snacks & Savory
      • Pharmaceuticals & Nutraceuticals
    • Australia & Newzealand Sugar Reducing Ingredients by Distribution Channel
      • B2B
      • B2C


    • Rest of Asia-Pacific Outlook (USD Million, 2018-2032)
    • Rest of Asia-Pacific Sugar Reducing Ingredients by Function
      • Sweeteners
      • Bulking Agents
      • Texturants


    • Rest of Asia-Pacific Sugar Reducing Ingredients by Application
      • Food & Beverage
        • Bakery & Confectionery
        • Beverages
        • Dairy & Desserts
        • Snacks & Savory
      • Pharmaceuticals & Nutraceuticals
    • Rest of Asia-Pacific Sugar Reducing Ingredients by Distribution Channel
      • B2B
      • B2C


    • Rest of the World Outlook (USD Million, 2018-2032)
      • Rest of the World Sugar Reducing Ingredients by Function
        • Sweeteners
        • Bulking Agents
        • Texurants


    • Rest of the World Sugar Reducing Ingredients by Application
      • Food & Beverage
        • Bakery & Confectionery
        • Beverages
        • Dairy & Desserts
        • Snacks & Savory
      • Pharmaceuticals & Nutraceuticals


    • Rest of the World Sugar Reducing Ingredients by Distribution Channel
      • B2B
      • B2C


    • Middle East Outlook (USD Million, 2018-2032)
    • Middle East Sugar Reducing Ingredients by Function
      • Sweeteners
      • Bulking Agents
      • Texturants


    • Middle East Sugar Reducing Ingredients by Application
      • Food & Beverage
        • Bakery & Confectionery
        • Beverages
        • Dairy & Desserts
        • Snacks & Savory
      • Pharmaceuticals & Nutraceuticals
    • Middle East Sugar Reducing Ingredients by Distribution Channel
      • B2B
      • B2C
    • Africa Outlook (USD Million, 2018-2032)
    • Africa Sugar Reducing Ingredients by Function
      • Sweeteners
      • Bulking Agents
      • Texturants


    • Africa Sugar Reducing Ingredients by Application
      • Food & Beverage
        • Bakery & Confectionery
        • Beverages
        • Dairy & Desserts
        • Snacks & Savory
      • Pharmaceuticals & Nutraceuticals


    • Africa Sugar Reducing Ingredients by Distribution Channel
      • B2B
      • B2C
    • South America Outlook (USD Million, 2018-2032)
    • South America Sugar Reducing Ingredients by Function
      • Sweeteners
      • Bulking Agents
      • Texturants


    • South America Sugar Reducing Ingredients by Application
      • Food & Beverage
        • Bakery & Confectionery
        • Beverages
        • Dairy & Desserts
        • Snacks & Savory
      • Pharmaceuticals & Nutraceuticals
    • South America Sugar Reducing Ingredients by Distribution Channel
      • B2B
      • B2C
    Infographic

    Free Sample Request

    Kindly complete the form below to receive a free sample of this Report

    Get Free Sample

    Customer Strories

    “I am very pleased with how market segments have been defined in a relevant way for my purposes (such as "Portable Freezers & refrigerators" and "last-mile"). In general the report is well structured. Thanks very much for your efforts.”

    Victoria Milne

    Founder
    Case Study
    Chemicals and Materials