• Cat-intel
  • MedIntelliX
  • Resources
  • About Us
  • Hero Background
    English
    Chinese
    French
    Japanese
    Korean
    German
    Spanish

    Smart Home Market Trends

    ID: MRFR/ICT/0468-CR
    200 Pages
    Aarti Dhapte
    July 2025

    Smart Home Market Research Report: By Product Type (Smart Lighting, Smart Security Systems, Smart Thermostats, Smart Home Appliances, Smart Entertainment Systems), By Technology (Wi-Fi, Zigbee, Bluetooth, Thread, Z-Wave), By Application (Home Automation, Energy Management, Security Surveillance, Health Monitoring, Entertainment Control), By End Use (Residential, Commercial, Industrial) and By R...

    Share:
    Download PDF ×

    We do not share your information with anyone. However, we may send you emails based on your report interest from time to time. You may contact us at any time to opt-out.

    Smart Home Market Infographic
    Purchase Options

    Market Trends

    Key Emerging Trends in the Smart Home Market

    The Smart Home market has witnessed an exquisite boom in recent years, reflecting the growing integration of generations into our day-by-day lives. Market developments suggest a shift towards more sophisticated and interconnected home automation solutions, pushed through improvements in Internet of Things (IoT) technology. One outstanding trend is the growing popularity of voice-activated smart assistants like Amazon Alexa and Google Assistant, which serve as critical hubs for controlling various related gadgets. Energy performance is a key attention within the Smart Home market, with a growing emphasis on green and sustainable answers.

    Smart thermostats, lighting fixtures systems, and electricity monitoring devices allow owners to optimize electricity consumption, lessen waste, and lower application costs. The integration of artificial intelligence (AI) algorithms further enhances those devices' capacity to research and adapt to user possibilities, optimizing energy usage based on daily routines and environmental situations. The upward thrust of clever appliances is some other giant market fashion. From refrigerators and washing machines to ovens and espresso makers, manufacturers are incorporating smart functions into conventional family appliances. These clever appliances can be managed remotely through phone apps, presenting customers with greater flexibility and the capability to automate habitual duties.

    For instance, customers can preheat their ovens on their own domestically or get hold of alerts while their laundry is performed, streamlining household chores and enhancing universal efficiency. Interoperability and compatibility have turned out to be vital concerns in the Smart Home marketplace. Consumers are increasingly seeking gadgets that can seamlessly speak with each other, promoting cohesive and interconnected domestic surroundings. The enterprise is transferring closer to standardized communication protocols such as Zigbee and Z-Wave, permitting exceptional devices from numerous manufacturers to paint together easily.

    The emergence of 5G technology is set to have a profound impact on the Smart Home marketplace. With quicker and extra reliable connectivity, 5G will unlock new possibilities for Smart Home programs, allowing real-time record transfer and improving the performance of related gadgets. This expanded space and bandwidth will, in addition, assist the increase of immersive technologies consisting of augmented reality (AR) and virtual reality (VR) inside Smart Home environments, providing users with greater enjoyment, education, and communication reports.

    Author
    Aarti Dhapte
    Team Lead - Research

    She holds an experience of about 6+ years in Market Research and Business Consulting, working under the spectrum of Information Communication Technology, Telecommunications and Semiconductor domains. Aarti conceptualizes and implements a scalable business strategy and provides strategic leadership to the clients. Her expertise lies in market estimation, competitive intelligence, pipeline analysis, customer assessment, etc.

    Leave a Comment

    FAQs

    What is the expected market size of the Smart Home Market in 2024?

    The Smart Home Market is expected to be valued at 115.66 USD Billion in 2024.

    What is the projected market size of the Smart Home Market by 2035?

    By 2035, the Smart Home Market is projected to reach a value of 300.0 USD billion.

    What is the expected CAGR for the Smart Home Market from 2025 to 2035?

    The expected compound annual growth rate (CAGR) for the Smart Home Market from 2025 to 2035 is 9.05%.

    Which region is expected to dominate the Smart Home Market in 2024?

    North America is expected to dominate the Smart Home Market with a valuation of 45.0 USD Billion in 2024.

    What is the market size for Smart Security Systems in 2024?

    The market size for Smart Security Systems is valued at 25.0 USD Billion in 2024.

    Which key players are leading the Smart Home Market?

    Key players in the Smart Home Market include TP-Link, Samsung, Google, Honeywell, and Amazon.

    What will the market size for Smart Home Appliances be in 2035?

    The market size for Smart Home Appliances is projected to be 100.0 USD billion by 2035.

    How much is the market for Smart Lighting expected to grow by 2035?

    The market for Smart Lighting is expected to grow to 40.0 USD billion by 2035.

    What is the market value for Asia Pacific in the Smart Home Market in 2024?

    The market value for Asia Pacific in the Smart Home Market is 20.0 USD billion in 2024.

    What is an emerging trend in the Smart Home Market?

    An emerging trend in the Smart Home Market is the increasing adoption of Smart Thermostats, projected to reach 30.0 USD billion by 2035.

    Market Summary

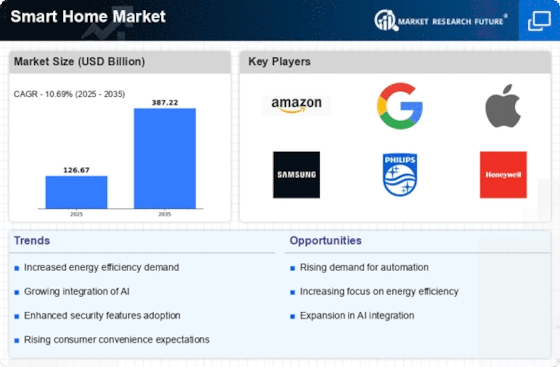
    As per Market Research Future Analysis, the Smart Home Market was valued at 126.67 USD Billion in 2024 and is projected to reach 387.22 USD Billion by 2035, growing at a CAGR of 10.69% from 2025 to 2035. The market is driven by increasing consumer demand for convenience, security, and energy efficiency, with significant adoption of IoT technologies and smart devices.

    Key Market Trends & Highlights

    The Global Smart Home Market is experiencing transformative trends fueled by technological advancements and consumer preferences.

    • Smart Lighting is expected to grow from 28.0 USD Billion in 2024 to 75.0 USD Billion by 2035. Smart Security Systems are projected to increase from 27.0 USD Billion in 2024 to 70.0 USD Billion by 2035. Smart Thermostats are anticipated to rise from 20.0 USD Billion in 2024 to 50.0 USD Billion by 2035. By 2025, 75% of households worldwide are expected to have at least one smart home device.

    Market Size & Forecast

    2024 Market Size USD 126.67 Billion
    2035 Market Size USD 387.22 Billion
    CAGR (2025-2035) 10.69%
    Largest Regional Market Share in 2024 North America.

    Major Players

    <p>Key Companies include Amazon, Nest Labs, Wyze, Ecobee, ADT, Philips, Google, Apple, Samsung, Microsoft, Honeywell, Alibaba, Sony, Xiaomi, LG Electronics.</p>

    Market Trends

    The Smart Home Market is witnessing significant trends fueled by advancements in technology and shifting consumer preferences. A major driver for this market is the increasing demand for energy-efficient solutions, which aligns with global efforts to reduce carbon footprints and enhance sustainability. In many regions, governments are encouraging the adoption of smart technologies through incentives and rebates, which further propels the market. Additionally, the growing focus on home security and automation is shaping consumer choices, as more individuals seek integrated systems that offer convenience and peace of mind.

    Recently, there has been a notable trend towards the interoperability of devices, where consumers are preferring smart home solutions that can seamlessly integrate with existing systems, regardless of the manufacturer.

    This trend not only makes things better for users, but it also pushes the creation of smart devices that can talk to each other. The rise of artificial intelligence and machine learning is also making homes more personalized and efficient, which helps with remote monitoring and automation. The Smart Home Market has a lot of potential, such as adding more healthcare and elderly care services to smart home solutions. As people get older, there is a greater need for technologies that help older people live alone while keeping them safe and healthy.

    Emerging markets are also starting to invest in smart home technologies, which gives manufacturers and service providers new opportunities.

    The trends show that the market is always changing, with new ideas and consumer demand driving the growth of smart home solutions around the world.


    <p>The ongoing integration of advanced technologies into residential environments suggests a transformative shift towards enhanced energy efficiency and user convenience in the global smart home market.</p>

    U.S. Department of Energy

    Smart Home Market Market Drivers

    Market Growth Projections

    The Global Smart Home Market Industry is poised for substantial growth, with projections indicating a market size of 300 USD Billion by 2035. This growth trajectory reflects an increasing consumer inclination towards smart technologies and automation solutions. The anticipated compound annual growth rate of 9.05% from 2025 to 2035 suggests a robust expansion phase, driven by advancements in technology and rising consumer awareness. As smart home devices become more affordable and accessible, the market is likely to witness a surge in adoption across various demographics, indicating a transformative shift in how households operate and interact with technology.

    Increased Security Concerns

    Heightened security concerns among homeowners significantly impact the Global Smart Home Market Industry. As crime rates fluctuate, consumers increasingly turn to smart security systems, including surveillance cameras, smart locks, and alarm systems, to protect their properties. The market's growth trajectory, projected to reach 300 USD Billion by 2035, indicates a robust demand for advanced security solutions. These systems not only provide real-time monitoring but also offer remote access and control, enhancing peace of mind for homeowners. The integration of smart technology into security measures reflects a broader trend towards comprehensive home safety solutions.

    Advancements in IoT Technology

    Technological advancements in the Internet of Things (IoT) significantly influence the Global Smart Home Market Industry. The proliferation of IoT devices facilitates seamless communication between various smart home products, enhancing user experience and functionality. As of 2024, the market is set to expand to 115.7 USD Billion, driven by innovations in connectivity and interoperability. These advancements enable consumers to control multiple devices through a single platform, simplifying home management. Furthermore, the integration of artificial intelligence into smart home systems enhances automation capabilities, suggesting a future where homes are increasingly responsive to user preferences and behaviors.

    Expansion of Smart Home Ecosystems

    The Global Smart Home Market Industry benefits from the expansion of smart home ecosystems, where various devices and platforms work together to create a cohesive user experience. As the market evolves, partnerships between technology companies and service providers facilitate the development of integrated solutions. The anticipated compound annual growth rate of 9.05% from 2025 to 2035 underscores the potential for growth in this sector. Consumers are increasingly drawn to ecosystems that offer compatibility and ease of use, suggesting that the future of smart homes will be characterized by interconnected devices that enhance overall functionality and user satisfaction.

    Growing Focus on Energy Efficiency

    The Global Smart Home Market Industry is propelled by a growing focus on energy efficiency among consumers and policymakers. Smart home technologies, such as energy-efficient appliances and smart meters, contribute to reduced energy consumption and lower utility bills. As the market reaches 115.7 USD Billion in 2024, the emphasis on sustainability becomes more pronounced. Governments worldwide are implementing regulations and incentives to promote energy-efficient solutions, further driving adoption. This trend aligns with global efforts to combat climate change, suggesting that smart home technologies will play a crucial role in achieving energy conservation goals in the coming years.

    Rising Consumer Demand for Automation

    The Global Smart Home Market Industry experiences a notable surge in consumer demand for automation solutions. As households increasingly seek convenience and efficiency, smart home devices such as smart thermostats, lighting systems, and security cameras become more prevalent. In 2024, the market is projected to reach 115.7 USD Billion, reflecting a growing inclination towards integrated home automation. This trend is driven by the desire for enhanced control over home environments, energy savings, and improved security. Consumers are increasingly adopting smart technologies, indicating a shift towards a more connected lifestyle that aligns with the broader digital transformation.

    Market Segment Insights

    Smart Home Market Product Type Insights

    <p>The Smart Home Market, with a projected valuation of 115.66 USD Billion in 2024, showcases significant growth potential across various product types. Amongst these, <a href="https://www.marketresearchfuture.com/reports/smart-lighting-market-991">Smart Lighting</a> is valued at 15.0 USD Billion in 2024, emerging as a vital component given its ability to provide energy efficiency and convenience, projected to grow to 40.0 USD Billion by 2035. Similarly, Smart Security Systems holds a strong position, valued at 25.0 USD Billion in 2024, and is expected to reach 70.0 USD Billion by 2035, reflecting the increasing consumer focus on home safety and surveillance.</p>

    <p>Smart Thermostats, valued at 10.0 USD Billion in 2024, play a crucial role in enhancing energy management and comfort, projected to grow to 30.0 USD Billion by 2035, catering to the rising demand for climate control solutions. Smart Home Appliances dominate the market with a significant valuation of 40.0 USD Billion in 2024, anticipated to reach 100.0 USD Billion by 2035, primarily due to their integration of advanced technology that promotes convenience in daily tasks.</p>

    <p>Lastly, Smart Entertainment Systems, valued at 25.66 USD Billion in 2024 and likely to rise to 60.0 USD Billion by 2035, reflect the growing consumer preference for integrated media solutions that enhance user experience.</p>

    Smart Home Market Technology Insights

    <p>The Smart Home Market revenue is significantly influenced by the Technology segment, which encompasses various communication protocols essential for interoperable smart devices. In 2024, the market is projected to reach a notable value, with expectations to further expand significantly by 2035. This sector is characterized by diverse technologies, including Wi-Fi, Zigbee, Bluetooth, Thread, and Z-Wave, each providing unique features and capabilities that cater to different consumer preferences and usage scenarios. Wi-Fi technology is widely adopted due to its pervasive availability and speed, facilitating seamless connectivity in smart homes.</p>

    <p>Zigbee and Z-Wave are noteworthy for their low-power consumption, making them ideal for battery-operated devices and enhancing <a href="https://www.marketresearchfuture.com/reports/energy-management-system-market-2808">energy</a> efficiency in homes. Bluetooth technology is increasingly used for nearby devices, contributing to the growth of personal smart gadgets. Thread's growing presence highlights a shift towards low-latency communication among devices, emphasizing the demand for reliable connections. As smart home solutions become more integrated into daily life, the market growth reflects the rising consumer preference for connectivity, convenience, and energy efficiency, solidifying the significance of these technologies in the Smart Home Market statistics.</p>

    Smart Home Market Application Insights

    <p>The Smart Home Market is expected to reach a valuation of 115.66 USD Billion in 2024, showcasing significant growth potential across various applications. The market segmentation includes critical areas such as Home Automation, Energy Management, Security Surveillance, Health Monitoring, and Entertainment Control, each playing a pivotal role in enhancing residential living. Home Automation is essential in streamlining daily tasks and providing convenience, while Energy Management systems contribute to sustainability efforts by optimizing energy consumption.</p>

    <p><a href="https://www.marketresearchfuture.com/reports/security-surveillance-storage-market-37690">Security Surveillance technologies</a> have become increasingly vital in ensuring safety and peace of mind for homeowners. Health Monitoring applications are gaining traction as they facilitate remote health assessments, particularly with the rise of telehealth services. Moreover, Entertainment Control significantly enhances user experiences by integrating multiple devices for seamless operation.</p>

    Smart Home Market End Use Insights

    <p>The Smart Home Market is projected to have a value of approximately 115.66 billion USD by 2024 and is expected to reach 300.0 billion USD by 2035. The market has seen a substantial focus on the End Use segment, which categorizes applications into Residential, Commercial, and Industrial domains. Within the residential space, smart home technologies enhance convenience, security, and energy efficiency, making it a significant driver of market growth. The commercial sector adopts smart solutions for operational efficiency and cost reduction, indicating its importance in driving overall market adoption.</p>

    Get more detailed insights about Smart Home Market Research Report - Global Forecast till 2035

    Regional Insights

    The Smart Home Market is poised for substantial growth, with a projected valuation of 115.66 USD Billion in 2024 and escalating towards 300.0 USD Billion by 2035. North America is at the forefront of this market, holding a significant valuation of 45.0 USD billion in 2024, which reflects its majority holding and dominance due to advanced technology adoption and high disposable incomes. Following closely is Europe, valued at 35.0 USD Billion in the same year, showcasing its robust focus on energy-efficient solutions and smart living.

    Asia Pacific is projected to have a valuation of 20.0 USD billion, driven by rising urbanization and increasing smartphone penetration.

    Meanwhile, South America, with a valuation of 10.0 USD billion, displays growth potential fueled by a growing middle class and emerging technologies. Lastly, the Middle East and Africa, valued at 5.66 USD billion, represent an evolving market, where demand is gradually rising due to increasing awareness and infrastructural development. The Smart Home Market segmentation highlights that North America dominates because of its early adoption of smart devices, while Europe follows closely, making these regions significant players in the ongoing transition towards smarter living environments.

    Smart Home Market Regional Insights

    Source: Primary Research, Secondary Research, Market Research Future Database, and Analyst Review

    Key Players and Competitive Insights

    The Smart Home Market has been experiencing rapid growth, driven by advancements in technology and an increasing demand for connected devices that enhance convenience, security, and energy efficiency in households. The competitive landscape is characterized by a diverse range of players, including tech giants, specialized manufacturers, and emerging startups, each vying for market share by offering innovative solutions. As consumers become more aware of the benefits of smart home technologies, companies are intensifying their efforts in product development, marketing strategies, and customer service to differentiate their offerings.

    With a focus on integration and compatibility among devices, the competition is fierce as brands aim to position themselves as leaders in this dynamic sector.

    TPLink has established a significant presence in the Smart Home Market with its extensive range of products, including smart plugs, cameras, and light bulbs, which are known for their reliability and ease of use. The company's strengths lie in its strong brand recognition, competitive pricing, and robust customer support, enabling it to cater to a broad audience. TPLink leverages its existing expertise in network solutions to position its smart home devices as easy to integrate into users' daily lives.

    The company's market presence is further enhanced by its focus on delivering quality products that are both innovative and accessible, appealing to a range of consumers from tech-savvy individuals to those new to smart home technology. This strong foundation has allowed TPLink to compete effectively within the challenging landscape of the smart home sector on a global scale.

    Samsung stands out in the Smart Home Market with its wide array of key products and services, including smart appliances like refrigerators, washing machines, and televisions, as well as its SmartThings platform that connects various smart home devices seamlessly. The company's market presence is bolstered by its reputation for innovation and quality, resulting in a loyal customer base that appreciates high-end technology and integrated solutions. Samsung's strengths include its extensive research and development capabilities, allowing for continuous product improvements and the introduction of cutting-edge features.

    The company has pursued strategic mergers and acquisitions to expand its portfolio and enhance its competitive edge, further solidifying its position in the smart home landscape globally. This commitment to delivering holistic smart home experiences underscores Samsung's ambition and adaptability within the ever-evolving market dynamics.

    Key Companies in the Smart Home Market market include

    Industry Developments

    The Smart Home Market has made a lot of progress in terms of technology and strategy in the last few months. Amazon showed off the Echo Hub and new Alexa AI features in September 2023. These made its smart home control interface better. Philips and Xiaomi have focused on eco-friendly smart appliances, which is in line with current trends toward sustainability. In July 2023, Schneider Electric and SAMRIDHI GROUP signed a memorandum of understanding (MoU) to bring its Wiser Smart Home solutions to energy-efficient homes.

    At the same time, LG Electronics and Honeywell are making progress on home security and automation systems that use AI. These changes show how the market is always changing, thanks to new smart devices, energy efficiency, and home control systems that work together.

    Future Outlook

    Smart Home Market Future Outlook

    <p>The Smart Home Market is projected to grow at a 9.05% CAGR from 2025 to 2035, driven by advancements in IoT, increased consumer demand for automation, and energy efficiency.</p>

    New opportunities lie in:

    • <p>Develop AI-driven home automation systems to enhance user experience and energy management. Expand partnerships with utility companies for smart energy solutions and demand response programs. Invest in cybersecurity measures to address growing concerns over smart home device vulnerabilities.</p>

    <p>By 2035, the Smart Home Market is expected to be a cornerstone of modern living, integrating seamlessly into daily life.</p>

    Market Segmentation

    Smart Home Market End Use Outlook

    • {""=>["North America"
    • "Europe"
    • "South America"
    • "Asia Pacific"
    • "Middle East and Africa"]}

    Smart Home Market Regional Outlook

    • North America
    • Europe
    • South America
    • Asia Pacific
    • Middle East and Africa

    Smart Home Market Technology Outlook

    • {""=>["Home Automation"
    • "Energy Management"
    • "Security Surveillance"
    • "Health Monitoring"
    • "Entertainment Control"]}

    Smart Home Market Application Outlook

    • {""=>["Residential"
    • "Commercial"
    • "Industrial"]}

    Smart Home Market Product Type Outlook

    • {""=>["Wi-Fi"
    • "Zigbee"
    • "Bluetooth"
    • "Thread"
    • "Z-Wave"]}

    Report Scope

    Report Attribute/Metric Details
    Market Size 2024 115.66 (USD Billion)
    Market Size 2035 387.22 (USD Billion)
    Compound Annual Growth Rate (CAGR) 10.69% (2025 - 2035)
    Report Coverage Revenue Forecast, Competitive Landscape, Growth Factors, and Trends
    Base Year 2024
    Market Forecast Period 2025 - 2035
    Historical Data 2019 - 2024
    Market Forecast Units USD Billion
    Key Companies Profiled TPLink, Samsung, Sony, Bosch, Schneider Electric, Google, Honeywell, Philips, Xiaomi, Apple, LG Electronics, Nest Labs, August Home, Amazon
    Segments Covered Product Type, Technology, Application, End Use, Regional
    Key Market Opportunities Home automation integration, Energy management solutions, Enhanced security systems, Health monitoring devices, Voice assistant compatibility
    Key Market Dynamics Technological advancements, increasing consumer demand, energy efficiency awareness, integration with IoT, and security concerns
    Countries Covered North America, Europe, APAC, South America, MEA
    Market Size 2025 140.21 (USD Billion)

    FAQs

    What is the expected market size of the Smart Home Market in 2024?

    The Smart Home Market is expected to be valued at 115.66 USD Billion in 2024.

    What is the projected market size of the Smart Home Market by 2035?

    By 2035, the Smart Home Market is projected to reach a value of 300.0 USD billion.

    What is the expected CAGR for the Smart Home Market from 2025 to 2035?

    The expected compound annual growth rate (CAGR) for the Smart Home Market from 2025 to 2035 is 9.05%.

    Which region is expected to dominate the Smart Home Market in 2024?

    North America is expected to dominate the Smart Home Market with a valuation of 45.0 USD Billion in 2024.

    What is the market size for Smart Security Systems in 2024?

    The market size for Smart Security Systems is valued at 25.0 USD Billion in 2024.

    Which key players are leading the Smart Home Market?

    Key players in the Smart Home Market include TP-Link, Samsung, Google, Honeywell, and Amazon.

    What will the market size for Smart Home Appliances be in 2035?

    The market size for Smart Home Appliances is projected to be 100.0 USD billion by 2035.

    How much is the market for Smart Lighting expected to grow by 2035?

    The market for Smart Lighting is expected to grow to 40.0 USD billion by 2035.

    What is the market value for Asia Pacific in the Smart Home Market in 2024?

    The market value for Asia Pacific in the Smart Home Market is 20.0 USD billion in 2024.

    What is an emerging trend in the Smart Home Market?

    An emerging trend in the Smart Home Market is the increasing adoption of Smart Thermostats, projected to reach 30.0 USD billion by 2035.

    1. RESEARCH METHODOLOGY
      1. \r\n\r\n
      2. Overview
      3. \r\n
      4. \r\n
      5. Data Mining
      6. \r\n
      7. \r\n
      8. Secondary Research
      9. \r\n
      10. \r\n
      11. Primary Research
      12. \r\n\r\n
      13. Primary Interviews and Information Gathering Process
      14. \r\n
      15. \r\n
      16. Breakdown of Primary Respondents
      17. \r\n
      18. \r\n
      19. Forecasting Model
      20. \r\n
      21. \r\n
      22. Market Size Estimation
      23. \r\n\r\n
      24. Bottom-Up Approach
      25. \r\n
      26. \r\n
      27. Top-Down Approach
      28. \r\n
      29. \r\n
      30. Data Triangulation
      31. \r\n
      32. \r\n
      33. Validation
      34. \r\n\r\n
      35. \r\n
      36. \r\n
      37. \r\nMARKET DYNAMICS
      38. \r\n\r\n
      39. Overview
      40. \r\n
      41. \r\n
      42. Drivers
      43. \r\n
      44. \r\n
      45. Restraints
      46. \r\n
      47. \r\n
      48. Opportunities
      49. \r\n
      50. \r\n
    2. MARKET FACTOR ANALYSIS
      1. \r\n\r\n
      2. Value chain Analysis
      3. \r\n
      4. \r\n
      5. Porter's Five Forces Analysis
      6. \r\n\r\n
      7. Bargaining Power of Suppliers
      8. \r\n
      9. \r\n
      10. Bargaining Power of Buyers
      11. \r\n
      12. \r\n
      13. Threat of New Entrants
      14. \r\n
      15. \r\n
      16. Threat of Substitutes
      17. \r\n
      18. \r\n
      19. Intensity of Rivalry
      20. \r\n
      21. \r\n
      22. COVID-19 Impact Analysis
      23. \r\n\r\n
      24. Market Impact Analysis
      25. \r\n
      26. \r\n
      27. Regional Impact
      28. \r\n
      29. \r\n
      30. Opportunity and Threat Analysis
      31. \r\n\r\n
      32. \r\n
      33. \r\n
    3. \r\nSMART HOME MARKET, BY Product Type (USD Billion)
      1. \r\n\r\n
      2. Smart Lighting
      3. \r\n
      4. \r\n
      5. Smart Security Systems
      6. \r\n
      7. \r\n
      8. Smart Thermostats
      9. \r\n
      10. \r\n
      11. Appliances
      12. \r\n
      13. \r\n
      14. Smart Entertainment Systems
      15. \r\n
      16. \r\n
    4. SMART HOME MARKET, BY Technology (USD Billion)
      1. \r\n\r\n
      2. Wi-Fi
      3. \r\n
      4. \r\n
      5. Zigbee
      6. \r\n
      7. \r\n
      8. Bluetooth
      9. \r\n
      10. \r\n
      11. Thread
      12. \r\n
      13. \r\n
      14. Z-Wave
      15. \r\n
      16. \r\n
    5. SMART HOME MARKET, BY Application (USD Billion)
      1. \r\n\r\n
      2. Home Automation
      3. \r\n
      4. \r\n
      5. Energy Management
      6. \r\n
      7. \r\n
      8. Security Surveillance
      9. \r\n
      10. \r\n
      11. Health Monitoring
      12. \r\n
      13. \r\n
      14. Entertainment Control
      15. \r\n
      16. \r\n
    6. SMART HOME MARKET, BY End Use (USD Billion)
      1. \r\n\r\n
      2. Residential
      3. \r\n
      4. \r\n
      5. Commercial
      6. \r\n
      7. \r\n
      8. Industrial
      9. \r\n
      10. \r\n
    7. SMART HOME MARKET, BY Regional (USD Billion)
      1. \r\n\r\n
      2. North America
      3. \r\n\r\n
      4. US
      5. \r\n
      6. \r\n
      7. Canada
      8. \r\n
      9. \r\n
      10. Europe
      11. \r\n\r\n
      12. Germany
      13. \r\n
      14. \r\n
      15. UK
      16. \r\n
      17. \r\n
      18. France
      19. \r\n
      20. \r\n
      21. Russia
      22. \r\n
      23. \r\n
      24. Italy
      25. \r\n
      26. \r\n
      27. Spain
      28. \r\n
      29. \r\n
      30. Rest of Europe
      31. \r\n
      32. \r\n
      33. APAC
      34. \r\n\r\n
      35. China
      36. \r\n
      37. \r\n
      38. India
      39. \r\n
      40. \r\n
      41. Japan
      42. \r\n
      43. \r\n
      44. South Korea
      45. \r\n
      46. \r\n
      47. Malaysia
      48. \r\n
      49. \r\n
      50. Thailand
      51. \r\n
      52. \r\n
      53. Indonesia
      54. \r\n
      55. \r\n
      56. Rest of APAC
      57. \r\n
      58. \r\n
      59. South America
      60. \r\n\r\n
      61. Brazil
      62. \r\n
      63. \r\n
      64. Mexico
      65. \r\n
      66. \r\n
      67. Argentina
      68. \r\n
      69. \r\n
      70. Rest of South America
      71. \r\n
      72. \r\n
      73. MEA
      74. \r\n\r\n
      75. GCC Countries
      76. \r\n
      77. \r\n
      78. South Africa
      79. \r\n
      80. \r\n
      81. Rest of MEA
      82. \r\n\r\n
      83. \r\n
      84. \r\n
      85. \r\nCompetitive Landscape
      86. \r\n\r\n
      87. Overview
      88. \r\n
      89. \r\n
      90. Competitive Analysis
      91. \r\n
      92. \r\n
      93. Market share Analysis
      94. \r\n
      95. \r\n
      96. Major Growth Strategy in the SMART HOME MARKET
      97. \r\n
      98. \r\n
      99. Competitive Benchmarking
      100. \r\n
      101. \r\n
      102. Leading Players in Terms of Number of Developments in the SMART HOME MARKET
      103. \r\n
      104. \r\n
      105. Key developments and growth strategies
      106. \r\n\r\n
      107. New Product Launch/Service Deployment
      108. \r\n
      109. \r\n
      110. Merger Acquisitions
      111. \r\n
      112. \r\n
      113. Joint Ventures
      114. \r\n
      115. \r\n
      116. Major Players Financial Matrix
      117. \r\n\r\n
      118. Sales and Operating Income
      119. \r\n
      120. \r\n
      121. Major Players RD Expenditure. 2023
      122. \r\n
      123. \r\n
      124. Company Profiles
      125. \r\n\r\n
      126. Amazon
      127. \r\n\r\n
      128. Financial Overview
      129. \r\n
      130. \r\n
      131. Products Offered
      132. \r\n
      133. \r\n
      134. Key Developments
      135. \r\n
      136. \r\n
      137. SWOT Analysis
      138. \r\n
      139. \r\n
      140. Key Strategies
      141. \r\n
      142. \r\n
      143. Nest Labs
      144. \r\n\r\n
      145. Financial Overview
      146. \r\n
      147. \r\n
      148. Products Offered
      149. \r\n
      150. \r\n
      151. Key Developments
      152. \r\n
      153. \r\n
      154. SWOT Analysis
      155. \r\n
      156. \r\n
      157. Key Strategies
      158. \r\n
      159. \r\n
      160. Wyze
      161. \r\n\r\n
      162. Financial Overview
      163. \r\n
      164. \r\n
      165. Products Offered
      166. \r\n
      167. \r\n
      168. Key Developments
      169. \r\n
      170. \r\n
      171. SWOT Analysis
      172. \r\n
      173. \r\n
      174. Key Strategies
      175. \r\n
      176. \r\n
      177. Ecobee
      178. \r\n\r\n
      179. Financial Overview
      180. \r\n
      181. \r\n
      182. Products Offered
      183. \r\n
      184. \r\n
      185. Key Developments
      186. \r\n
      187. \r\n
      188. SWOT Analysis
      189. \r\n
      190. \r\n
      191. Key Strategies
      192. \r\n
      193. \r\n
      194. ADT
      195. \r\n\r\n
      196. Financial Overview
      197. \r\n
      198. \r\n
      199. Products Offered
      200. \r\n
      201. \r\n
      202. Key Developments
      203. \r\n
      204. \r\n
      205. SWOT Analysis
      206. \r\n
      207. \r\n
      208. Key Strategies
      209. \r\n
      210. \r\n
      211. Philips
      212. \r\n\r\n
      213. Financial Overview
      214. \r\n
      215. \r\n
      216. Products Offered
      217. \r\n
      218. \r\n
      219. Key Developments
      220. \r\n
      221. \r\n
      222. SWOT Analysis
      223. \r\n
      224. \r\n
      225. Key Strategies
      226. \r\n
      227. \r\n
      228. Google
      229. \r\n\r\n
      230. Financial Overview
      231. \r\n
      232. \r\n
      233. Products Offered
      234. \r\n
      235. \r\n
      236. Key Developments
      237. \r\n
      238. \r\n
      239. SWOT Analysis
      240. \r\n
      241. \r\n
      242. Key Strategies
      243. \r\n
      244. \r\n
      245. Apple
      246. \r\n\r\n
      247. Financial Overview
      248. \r\n
      249. \r\n
      250. Products Offered
      251. \r\n
      252. \r\n
      253. Key Developments
      254. \r\n
      255. \r\n
      256. SWOT Analysis
      257. \r\n
      258. \r\n
      259. Key Strategies
      260. \r\n
      261. \r\n
      262. Samsung
      263. \r\n\r\n
      264. Financial Overview
      265. \r\n
      266. \r\n
      267. Products Offered
      268. \r\n
      269. \r\n
      270. Key Developments
      271. \r\n
      272. \r\n
      273. SWOT Analysis
      274. \r\n
      275. \r\n
      276. Key Strategies
      277. \r\n
      278. \r\n
      279. Microsoft
      280. \r\n\r\n
      281. Financial Overview
      282. \r\n
      283. \r\n
      284. Products Offered
      285. \r\n
      286. \r\n
      287. Key Developments
      288. \r\n
      289. \r\n
      290. SWOT Analysis
      291. \r\n
      292. \r\n
      293. Key Strategies
      294. \r\n
      295. \r\n
      296. Honeywell
      297. \r\n\r\n
      298. Financial Overview
      299. \r\n
      300. \r\n
      301. Products Offered
      302. \r\n
      303. \r\n
      304. Key Developments
      305. \r\n
      306. \r\n
      307. SWOT Analysis
      308. \r\n
      309. \r\n
      310. Key Strategies
      311. \r\n
      312. \r\n
      313. Alibaba
      314. \r\n\r\n
      315. Financial Overview
      316. \r\n
      317. \r\n
      318. Products Offered
      319. \r\n
      320. \r\n
      321. Key Developments
      322. \r\n
      323. \r\n
      324. SWOT Analysis
      325. \r\n
      326. \r\n
      327. Key Strategies
      328. \r\n
      329. \r\n
      330. Sony
      331. \r\n\r\n
      332. Financial Overview
      333. \r\n
      334. \r\n
      335. Products Offered
      336. \r\n
      337. \r\n
      338. Key Developments
      339. \r\n
      340. \r\n
      341. SWOT Analysis
      342. \r\n
      343. \r\n
      344. Key Strategies
      345. \r\n
      346. \r\n
      347. Xiaomi
      348. \r\n\r\n
      349. Financial Overview
      350. \r\n
      351. \r\n
      352. Products Offered
      353. \r\n
      354. \r\n
      355. Key Developments
      356. \r\n
      357. \r\n
      358. SWOT Analysis
      359. \r\n
      360. \r\n
      361. Key Strategies
      362. \r\n
      363. \r\n
      364. LG Electronics
      365. \r\n\r\n
      366. Financial Overview
      367. \r\n
      368. \r\n
      369. Products Offered
      370. \r\n
      371. \r\n
      372. Key Developments
      373. \r\n
      374. \r\n
      375. SWOT Analysis
      376. \r\n
      377. \r\n
      378. Key Strategies
      379. \r\n
      380. \r\n
      381. Appendix
      382. \r\n\r\n
      383. References
      384. \r\n
      385. \r\n
      386. Related Reports
      387. \r\n\r\n
      388. LIST Of tables
      389. \r\n
      390. \r\n
      391. \r\nLIST OF ASSUMPTIONS
      392. \r\n
      393. \r\n
    8. North America Market SIZE ESTIMATES & FORECAST, BY PRODUCT TYPE, 2019-2035 (USD Billions)
      1. \r\n
      2. \r\n
    9. North America Market SIZE ESTIMATES & FORECAST, BY TECHNOLOGY, 2019-2035 (USD Billions)
      1. \r\n
      2. \r\n
    10. North America Market SIZE ESTIMATES & FORECAST, BY APPLICATION, 2019-2035 (USD Billions)
      1. \r\n
      2. \r\n
    11. North America Market SIZE ESTIMATES & FORECAST, BY END USE, 2019-2035 (USD Billions)
      1. \r\n
      2. \r\n
    12. North America Market SIZE ESTIMATES & FORECAST, BY REGIONAL, 2019-2035 (USD Billions)
      1. \r\n
      2. \r\n
    13. US Market SIZE ESTIMATES & FORECAST, BY PRODUCT TYPE, 2019-2035 (USD Billions)
      1. \r\n
      2. \r\n
    14. US Market SIZE ESTIMATES & FORECAST, BY TECHNOLOGY, 2019-2035 (USD Billions)
      1. \r\n
      2. \r\n
    15. US Market SIZE ESTIMATES & FORECAST, BY APPLICATION, 2019-2035 (USD Billions)
      1. \r\n
      2. \r\n
    16. US Market SIZE ESTIMATES & FORECAST, BY END USE, 2019-2035 (USD Billions)
      1. \r\n
      2. \r\n
    17. US Market SIZE ESTIMATES & FORECAST, BY REGIONAL, 2019-2035 (USD Billions)
      1. \r\n
      2. \r\n
    18. Canada Market SIZE ESTIMATES & FORECAST, BY PRODUCT TYPE, 2019-2035 (USD Billions)
      1. \r\n
      2. \r\n
    19. Canada Market SIZE ESTIMATES & FORECAST, BY TECHNOLOGY, 2019-2035 (USD Billions)
      1. \r\n
      2. \r\n
    20. Canada Market SIZE ESTIMATES & FORECAST, BY APPLICATION, 2019-2035 (USD Billions)
      1. \r\n
      2. \r\n
    21. Canada Market SIZE ESTIMATES & FORECAST, BY END USE, 2019-2035 (USD Billions)
      1. \r\n
      2. \r\n
    22. Canada Market SIZE ESTIMATES & FORECAST, BY REGIONAL, 2019-2035 (USD Billions)
      1. \r\n
      2. \r\n
    23. Europe Market SIZE ESTIMATES & FORECAST, BY PRODUCT TYPE, 2019-2035 (USD Billions)
      1. \r\n
      2. \r\n
    24. Europe Market SIZE ESTIMATES & FORECAST, BY TECHNOLOGY, 2019-2035 (USD Billions)
      1. \r\n
      2. \r\n
    25. Europe Market SIZE ESTIMATES & FORECAST, BY APPLICATION, 2019-2035 (USD Billions)
      1. \r\n
      2. \r\n
    26. Europe Market SIZE ESTIMATES & FORECAST, BY END USE, 2019-2035 (USD Billions)
      1. \r\n
      2. \r\n
    27. Europe Market SIZE ESTIMATES & FORECAST, BY REGIONAL, 2019-2035 (USD Billions)
      1. \r\n
      2. \r\n
    28. Germany Market SIZE ESTIMATES & FORECAST, BY PRODUCT TYPE, 2019-2035 (USD Billions)
      1. \r\n
      2. \r\n
    29. Germany Market SIZE ESTIMATES & FORECAST, BY TECHNOLOGY, 2019-2035 (USD Billions)
      1. \r\n
      2. \r\n
    30. Germany Market SIZE ESTIMATES & FORECAST, BY APPLICATION, 2019-2035 (USD Billions)
      1. \r\n
      2. \r\n
    31. Germany Market SIZE ESTIMATES & FORECAST, BY END USE, 2019-2035 (USD Billions)
      1. \r\n
      2. \r\n
    32. Germany Market SIZE ESTIMATES & FORECAST, BY REGIONAL, 2019-2035 (USD Billions)
      1. \r\n
      2. \r\n
    33. UK Market SIZE ESTIMATES & FORECAST, BY PRODUCT TYPE, 2019-2035 (USD Billions)
      1. \r\n
      2. \r\n
    34. UK Market SIZE ESTIMATES & FORECAST, BY TECHNOLOGY, 2019-2035 (USD Billions)
      1. \r\n
      2. \r\n
    35. UK Market SIZE ESTIMATES & FORECAST, BY APPLICATION, 2019-2035 (USD Billions)
      1. \r\n
      2. \r\n
    36. UK Market SIZE ESTIMATES & FORECAST, BY END USE, 2019-2035 (USD Billions)
      1. \r\n
      2. \r\n
    37. UK Market SIZE ESTIMATES & FORECAST, BY REGIONAL, 2019-2035 (USD Billions)
      1. \r\n
      2. \r\n
    38. France Market SIZE ESTIMATES & FORECAST, BY PRODUCT TYPE, 2019-2035 (USD Billions)
      1. \r\n
      2. \r\n
    39. France Market SIZE ESTIMATES & FORECAST, BY TECHNOLOGY, 2019-2035 (USD Billions)
      1. \r\n
      2. \r\n
    40. France Market SIZE ESTIMATES & FORECAST, BY APPLICATION, 2019-2035 (USD Billions)
      1. \r\n
      2. \r\n
    41. France Market SIZE ESTIMATES & FORECAST, BY END USE, 2019-2035 (USD Billions)
      1. \r\n
      2. \r\n
    42. France Market SIZE ESTIMATES & FORECAST, BY REGIONAL, 2019-2035 (USD Billions)
      1. \r\n
      2. \r\n
    43. Russia Market SIZE ESTIMATES & FORECAST, BY PRODUCT TYPE, 2019-2035 (USD Billions)
      1. \r\n
      2. \r\n
    44. Russia Market SIZE ESTIMATES & FORECAST, BY TECHNOLOGY, 2019-2035 (USD Billions)
      1. \r\n
      2. \r\n
    45. Russia Market SIZE ESTIMATES & FORECAST, BY APPLICATION, 2019-2035 (USD Billions)
      1. \r\n
      2. \r\n
    46. Russia Market SIZE ESTIMATES & FORECAST, BY END USE, 2019-2035 (USD Billions)
      1. \r\n
      2. \r\n
    47. Russia Market SIZE ESTIMATES & FORECAST, BY REGIONAL, 2019-2035 (USD Billions)
      1. \r\n
      2. \r\n
    48. Italy Market SIZE ESTIMATES & FORECAST, BY PRODUCT TYPE, 2019-2035 (USD Billions)
      1. \r\n
      2. \r\n
    49. Italy Market SIZE ESTIMATES & FORECAST, BY TECHNOLOGY, 2019-2035 (USD Billions)
      1. \r\n
      2. \r\n
    50. Italy Market SIZE ESTIMATES & FORECAST, BY APPLICATION, 2019-2035 (USD Billions)
      1. \r\n
      2. \r\n
    51. Italy Market SIZE ESTIMATES & FORECAST, BY END USE, 2019-2035 (USD Billions)
      1. \r\n
      2. \r\n
    52. Italy Market SIZE ESTIMATES & FORECAST, BY REGIONAL, 2019-2035 (USD Billions)
      1. \r\n
      2. \r\n
    53. Spain Market SIZE ESTIMATES & FORECAST, BY PRODUCT TYPE, 2019-2035 (USD Billions)
      1. \r\n
      2. \r\n
    54. Spain Market SIZE ESTIMATES & FORECAST, BY TECHNOLOGY, 2019-2035 (USD Billions)
      1. \r\n
      2. \r\n
    55. Spain Market SIZE ESTIMATES & FORECAST, BY APPLICATION, 2019-2035 (USD Billions)
      1. \r\n
      2. \r\n
    56. Spain Market SIZE ESTIMATES & FORECAST, BY END USE, 2019-2035 (USD Billions)
      1. \r\n
      2. \r\n
    57. Spain Market SIZE ESTIMATES & FORECAST, BY REGIONAL, 2019-2035 (USD Billions)
      1. \r\n
      2. \r\n
    58. Rest of Europe Market SIZE ESTIMATES & FORECAST, BY PRODUCT TYPE, 2019-2035 (USD Billions)
      1. \r\n
      2. \r\n
    59. Rest of Europe Market SIZE ESTIMATES & FORECAST, BY TECHNOLOGY, 2019-2035 (USD Billions)
      1. \r\n
      2. \r\n
    60. Rest of Europe Market SIZE ESTIMATES & FORECAST, BY APPLICATION, 2019-2035 (USD Billions)
      1. \r\n
      2. \r\n
    61. Rest of Europe Market SIZE ESTIMATES & FORECAST, BY END USE, 2019-2035 (USD Billions)
      1. \r\n
      2. \r\n
    62. Rest of Europe Market SIZE ESTIMATES & FORECAST, BY REGIONAL, 2019-2035 (USD Billions)
      1. \r\n
      2. \r\n
    63. APAC Market SIZE ESTIMATES & FORECAST, BY PRODUCT TYPE, 2019-2035 (USD Billions)
      1. \r\n
      2. \r\n
    64. APAC Market SIZE ESTIMATES & FORECAST, BY TECHNOLOGY, 2019-2035 (USD Billions)
      1. \r\n
      2. \r\n
    65. APAC Market SIZE ESTIMATES & FORECAST, BY APPLICATION, 2019-2035 (USD Billions)
      1. \r\n
      2. \r\n
    66. APAC Market SIZE ESTIMATES & FORECAST, BY END USE, 2019-2035 (USD Billions)
      1. \r\n
      2. \r\n
    67. APAC Market SIZE ESTIMATES & FORECAST, BY REGIONAL, 2019-2035 (USD Billions)
      1. \r\n
      2. \r\n
    68. China Market SIZE ESTIMATES & FORECAST, BY PRODUCT TYPE, 2019-2035 (USD Billions)
      1. \r\n
      2. \r\n
    69. China Market SIZE ESTIMATES & FORECAST, BY TECHNOLOGY, 2019-2035 (USD Billions)
      1. \r\n
      2. \r\n
    70. China Market SIZE ESTIMATES & FORECAST, BY APPLICATION, 2019-2035 (USD Billions)
      1. \r\n
      2. \r\n
    71. China Market SIZE ESTIMATES & FORECAST, BY END USE, 2019-2035 (USD Billions)
      1. \r\n
      2. \r\n
    72. China Market SIZE ESTIMATES & FORECAST, BY REGIONAL, 2019-2035 (USD Billions)
      1. \r\n
      2. \r\n
    73. India Market SIZE ESTIMATES & FORECAST, BY PRODUCT TYPE, 2019-2035 (USD Billions)
      1. \r\n
      2. \r\n
    74. India Market SIZE ESTIMATES & FORECAST, BY TECHNOLOGY, 2019-2035 (USD Billions)
      1. \r\n
      2. \r\n
    75. India Market SIZE ESTIMATES & FORECAST, BY APPLICATION, 2019-2035 (USD Billions)
      1. \r\n
      2. \r\n
    76. India Market SIZE ESTIMATES & FORECAST, BY END USE, 2019-2035 (USD Billions)
      1. \r\n
      2. \r\n
    77. India Market SIZE ESTIMATES & FORECAST, BY REGIONAL, 2019-2035 (USD Billions)
      1. \r\n
      2. \r\n
    78. Japan Market SIZE ESTIMATES & FORECAST, BY PRODUCT TYPE, 2019-2035 (USD Billions)
      1. \r\n
      2. \r\n
    79. Japan Market SIZE ESTIMATES & FORECAST, BY TECHNOLOGY, 2019-2035 (USD Billions)
      1. \r\n
      2. \r\n
    80. Japan Market SIZE ESTIMATES & FORECAST, BY APPLICATION, 2019-2035 (USD Billions)
      1. \r\n
      2. \r\n
    81. Japan Market SIZE ESTIMATES & FORECAST, BY END USE, 2019-2035 (USD Billions)
      1. \r\n
      2. \r\n
    82. Japan Market SIZE ESTIMATES & FORECAST, BY REGIONAL, 2019-2035 (USD Billions)
      1. \r\n
      2. \r\n
    83. South Korea Market SIZE ESTIMATES & FORECAST, BY PRODUCT TYPE, 2019-2035 (USD Billions)
      1. \r\n
      2. \r\n
    84. South Korea Market SIZE ESTIMATES & FORECAST, BY TECHNOLOGY, 2019-2035 (USD Billions)
      1. \r\n
      2. \r\n
    85. South Korea Market SIZE ESTIMATES & FORECAST, BY APPLICATION, 2019-2035 (USD Billions)
      1. \r\n
      2. \r\n
    86. South Korea Market SIZE ESTIMATES & FORECAST, BY END USE, 2019-2035 (USD Billions)
      1. \r\n
      2. \r\n
    87. South Korea Market SIZE ESTIMATES & FORECAST, BY REGIONAL, 2019-2035 (USD Billions)
      1. \r\n
      2. \r\n
    88. Malaysia Market SIZE ESTIMATES & FORECAST, BY PRODUCT TYPE, 2019-2035 (USD Billions)
      1. \r\n
      2. \r\n
    89. Malaysia Market SIZE ESTIMATES & FORECAST, BY TECHNOLOGY, 2019-2035 (USD Billions)
      1. \r\n
      2. \r\n
    90. Malaysia Market SIZE ESTIMATES & FORECAST, BY APPLICATION, 2019-2035 (USD Billions)
      1. \r\n
      2. \r\n
    91. Malaysia Market SIZE ESTIMATES & FORECAST, BY END USE, 2019-2035 (USD Billions)
      1. \r\n
      2. \r\n
    92. Malaysia Market SIZE ESTIMATES & FORECAST, BY REGIONAL, 2019-2035 (USD Billions)
      1. \r\n
      2. \r\n
    93. Thailand Market SIZE ESTIMATES & FORECAST, BY PRODUCT TYPE, 2019-2035 (USD Billions)
      1. \r\n
      2. \r\n
    94. Thailand Market SIZE ESTIMATES & FORECAST, BY TECHNOLOGY, 2019-2035 (USD Billions)
      1. \r\n
      2. \r\n
    95. Thailand Market SIZE ESTIMATES & FORECAST, BY APPLICATION, 2019-2035 (USD Billions)
      1. \r\n
      2. \r\n
    96. Thailand Market SIZE ESTIMATES & FORECAST, BY END USE, 2019-2035 (USD Billions)
      1. \r\n
      2. \r\n
    97. Thailand Market SIZE ESTIMATES & FORECAST, BY REGIONAL, 2019-2035 (USD Billions)
      1. \r\n
      2. \r\n
    98. Indonesia Market SIZE ESTIMATES & FORECAST, BY PRODUCT TYPE, 2019-2035 (USD Billions)
      1. \r\n
      2. \r\n
    99. Indonesia Market SIZE ESTIMATES & FORECAST, BY TECHNOLOGY, 2019-2035 (USD Billions)
      1. \r\n
      2. \r\n
    100. Indonesia Market SIZE ESTIMATES & FORECAST, BY APPLICATION, 2019-2035 (USD Billions)
      1. \r\n
      2. \r\n
    101. Indonesia Market SIZE ESTIMATES & FORECAST, BY END USE, 2019-2035 (USD Billions)
      1. \r\n
      2. \r\n
    102. Indonesia Market SIZE ESTIMATES & FORECAST, BY REGIONAL, 2019-2035 (USD Billions)
      1. \r\n
      2. \r\n
    103. Rest of APAC Market SIZE ESTIMATES & FORECAST, BY PRODUCT TYPE, 2019-2035 (USD Billions)
      1. \r\n
      2. \r\n
    104. Rest of APAC Market SIZE ESTIMATES & FORECAST, BY TECHNOLOGY, 2019-2035 (USD Billions)
      1. \r\n
      2. \r\n
    105. Rest of APAC Market SIZE ESTIMATES & FORECAST, BY APPLICATION, 2019-2035 (USD Billions)
      1. \r\n
      2. \r\n
    106. Rest of APAC Market SIZE ESTIMATES & FORECAST, BY END USE, 2019-2035 (USD Billions)
      1. \r\n
      2. \r\n
    107. Rest of APAC Market SIZE ESTIMATES & FORECAST, BY REGIONAL, 2019-2035 (USD Billions)
      1. \r\n
      2. \r\n
    108. South America Market SIZE ESTIMATES & FORECAST, BY PRODUCT TYPE, 2019-2035 (USD Billions)
      1. \r\n
      2. \r\n
    109. South America Market SIZE ESTIMATES & FORECAST, BY TECHNOLOGY, 2019-2035 (USD Billions)
      1. \r\n
      2. \r\n
    110. South America Market SIZE ESTIMATES & FORECAST, BY APPLICATION, 2019-2035 (USD Billions)
      1. \r\n
      2. \r\n
    111. South America Market SIZE ESTIMATES & FORECAST, BY END USE, 2019-2035 (USD Billions)
      1. \r\n
      2. \r\n
    112. South America Market SIZE ESTIMATES & FORECAST, BY REGIONAL, 2019-2035 (USD Billions)
      1. \r\n
      2. \r\n
    113. Brazil Market SIZE ESTIMATES & FORECAST, BY PRODUCT TYPE, 2019-2035 (USD Billions)
      1. \r\n
      2. \r\n
    114. Brazil Market SIZE ESTIMATES & FORECAST, BY TECHNOLOGY, 2019-2035 (USD Billions)
      1. \r\n
      2. \r\n
    115. Brazil Market SIZE ESTIMATES & FORECAST, BY APPLICATION, 2019-2035 (USD Billions)
      1. \r\n
      2. \r\n
    116. Brazil Market SIZE ESTIMATES & FORECAST, BY END USE, 2019-2035 (USD Billions)
      1. \r\n
      2. \r\n
    117. Brazil Market SIZE ESTIMATES & FORECAST, BY REGIONAL, 2019-2035 (USD Billions)
      1. \r\n
      2. \r\n
    118. Mexico Market SIZE ESTIMATES & FORECAST, BY PRODUCT TYPE, 2019-2035 (USD Billions)
      1. \r\n
      2. \r\n
    119. Mexico Market SIZE ESTIMATES & FORECAST, BY TECHNOLOGY, 2019-2035 (USD Billions)
      1. \r\n
      2. \r\n
    120. Mexico Market SIZE ESTIMATES & FORECAST, BY APPLICATION, 2019-2035 (USD Billions)
      1. \r\n
      2. \r\n
    121. Mexico Market SIZE ESTIMATES & FORECAST, BY END USE, 2019-2035 (USD Billions)
      1. \r\n
      2. \r\n
    122. Mexico Market SIZE ESTIMATES & FORECAST, BY REGIONAL, 2019-2035 (USD Billions)
      1. \r\n
      2. \r\n
    123. Argentina Market SIZE ESTIMATES & FORECAST, BY PRODUCT TYPE, 2019-2035 (USD Billions)
      1. \r\n
      2. \r\n
    124. Argentina Market SIZE ESTIMATES & FORECAST, BY TECHNOLOGY, 2019-2035 (USD Billions)
      1. \r\n
      2. \r\n
    125. Argentina Market SIZE ESTIMATES & FORECAST, BY APPLICATION, 2019-2035 (USD Billions)
      1. \r\n
      2. \r\n
    126. Argentina Market SIZE ESTIMATES & FORECAST, BY END USE, 2019-2035 (USD Billions)
      1. \r\n
      2. \r\n
    127. Argentina Market SIZE ESTIMATES & FORECAST, BY REGIONAL, 2019-2035 (USD Billions)
      1. \r\n
      2. \r\n
    128. Rest of South America Market SIZE ESTIMATES & FORECAST, BY PRODUCT TYPE, 2019-2035 (USD Billions)
      1. \r\n
      2. \r\n
    129. Rest of South America Market SIZE ESTIMATES & FORECAST, BY TECHNOLOGY, 2019-2035 (USD Billions)
      1. \r\n
      2. \r\n
    130. Rest of South America Market SIZE ESTIMATES & FORECAST, BY APPLICATION, 2019-2035 (USD Billions)
      1. \r\n
      2. \r\n
    131. Rest of South America Market SIZE ESTIMATES & FORECAST, BY END USE, 2019-2035 (USD Billions)
      1. \r\n
      2. \r\n
    132. Rest of South America Market SIZE ESTIMATES & FORECAST, BY REGIONAL, 2019-2035 (USD Billions)
      1. \r\n
      2. \r\n
    133. MEA Market SIZE ESTIMATES & FORECAST, BY PRODUCT TYPE, 2019-2035 (USD Billions)
      1. \r\n
      2. \r\n
    134. MEA Market SIZE ESTIMATES & FORECAST, BY TECHNOLOGY, 2019-2035 (USD Billions)
      1. \r\n
      2. \r\n
    135. MEA Market SIZE ESTIMATES & FORECAST, BY APPLICATION, 2019-2035 (USD Billions)
      1. \r\n
      2. \r\n
    136. MEA Market SIZE ESTIMATES & FORECAST, BY END USE, 2019-2035 (USD Billions)
      1. \r\n
      2. \r\n
    137. MEA Market SIZE ESTIMATES & FORECAST, BY REGIONAL, 2019-2035 (USD Billions)
      1. \r\n
      2. \r\n
    138. GCC Countries Market SIZE ESTIMATES & FORECAST, BY PRODUCT TYPE, 2019-2035 (USD Billions)
      1. \r\n
      2. \r\n
    139. GCC Countries Market SIZE ESTIMATES & FORECAST, BY TECHNOLOGY, 2019-2035 (USD Billions)
      1. \r\n
      2. \r\n
    140. GCC Countries Market SIZE ESTIMATES & FORECAST, BY APPLICATION, 2019-2035 (USD Billions)
      1. \r\n
      2. \r\n
    141. GCC Countries Market SIZE ESTIMATES & FORECAST, BY END USE, 2019-2035 (USD Billions)
      1. \r\n
      2. \r\n
    142. GCC Countries Market SIZE ESTIMATES & FORECAST, BY REGIONAL, 2019-2035 (USD Billions)
      1. \r\n
      2. \r\n
    143. South Africa Market SIZE ESTIMATES & FORECAST, BY PRODUCT TYPE, 2019-2035 (USD Billions)
      1. \r\n
      2. \r\n
    144. South Africa Market SIZE ESTIMATES & FORECAST, BY TECHNOLOGY, 2019-2035 (USD Billions)
      1. \r\n
      2. \r\n
    145. South Africa Market SIZE ESTIMATES & FORECAST, BY APPLICATION, 2019-2035 (USD Billions)
      1. \r\n
      2. \r\n
    146. South Africa Market SIZE ESTIMATES & FORECAST, BY END USE, 2019-2035 (USD Billions)
      1. \r\n
      2. \r\n
    147. South Africa Market SIZE ESTIMATES & FORECAST, BY REGIONAL, 2019-2035 (USD Billions)
      1. \r\n
      2. \r\n
    148. Rest of MEA Market SIZE ESTIMATES & FORECAST, BY PRODUCT TYPE, 2019-2035 (USD Billions)
      1. \r\n
      2. \r\n
    149. Rest of MEA Market SIZE ESTIMATES & FORECAST, BY TECHNOLOGY, 2019-2035 (USD Billions)
      1. \r\n
      2. \r\n
    150. Rest of MEA Market SIZE ESTIMATES & FORECAST, BY APPLICATION, 2019-2035 (USD Billions)
      1. \r\n
      2. \r\n
    151. Rest of MEA Market SIZE ESTIMATES & FORECAST, BY END USE, 2019-2035 (USD Billions)
      1. \r\n
      2. \r\n
    152. Rest of MEA Market SIZE ESTIMATES & FORECAST, BY REGIONAL, 2019-2035 (USD Billions)
      1. \r\n
      2. \r\n
      3. PRODUCT LAUNCH/PRODUCT DEVELOPMENT/APPROVAL
      4. \r\n
      5. \r\n
      6. ACQUISITION/PARTNERSHIP
      7. \r\n\r\n
      8. \r\n
      9. \r\n
      10. \r\n
      11. \r\n
      12. \r\n
      13. \r\n
      14. \r\n
      15. \r\n
      16. \r\n
      17. \r\n
      18. \r\n
      19. \r\n
      20. \r\n
      21. \r\n
      22. \r\n
      23. \r\n
      24. \r\n
      25. \r\n
      26. \r\n
      27. \r\n
      28. \r\n
      29. \r\n
      30. \r\n
      31. \r\n
      32. \r\n
      33. \r\n
      34. \r\n
      35. \r\n
      36. \r\n
      37. LIST Of figures
      38. \r\n
      39. \r\n
      40. \r\nMARKET SYNOPSIS
      41. \r\n
      42. \r\n
    153. NORTH AMERICA MARKET ANALYSIS
      1. \r\n
      2. \r\n
      3. US MARKET ANALYSIS BY PRODUCT TYPE
      4. \r\n
      5. \r\n
      6. US MARKET ANALYSIS BY TECHNOLOGY
      7. \r\n
      8. \r\n
      9. US MARKET ANALYSIS BY APPLICATION
      10. \r\n
      11. \r\n
      12. US MARKET ANALYSIS BY END USE
      13. \r\n
      14. \r\n
      15. US MARKET ANALYSIS BY REGIONAL
      16. \r\n
      17. \r\n
      18. CANADA MARKET ANALYSIS BY PRODUCT TYPE
      19. \r\n
      20. \r\n
      21. CANADA MARKET ANALYSIS BY TECHNOLOGY
      22. \r\n
      23. \r\n
      24. CANADA MARKET ANALYSIS BY APPLICATION
      25. \r\n
      26. \r\n
      27. CANADA MARKET ANALYSIS BY END USE
      28. \r\n
      29. \r\n
      30. CANADA MARKET ANALYSIS BY REGIONAL
      31. \r\n
      32. \r\n
    154. EUROPE MARKET ANALYSIS
      1. \r\n
      2. \r\n
      3. GERMANY MARKET ANALYSIS BY PRODUCT TYPE
      4. \r\n
      5. \r\n
      6. GERMANY MARKET ANALYSIS BY TECHNOLOGY
      7. \r\n
      8. \r\n
      9. GERMANY MARKET ANALYSIS BY APPLICATION
      10. \r\n
      11. \r\n
      12. GERMANY MARKET ANALYSIS BY END USE
      13. \r\n
      14. \r\n
      15. GERMANY MARKET ANALYSIS BY REGIONAL
      16. \r\n
      17. \r\n
      18. UK MARKET ANALYSIS BY PRODUCT TYPE
      19. \r\n
      20. \r\n
      21. UK MARKET ANALYSIS BY TECHNOLOGY
      22. \r\n
      23. \r\n
      24. UK MARKET ANALYSIS BY APPLICATION
      25. \r\n
      26. \r\n
      27. UK MARKET ANALYSIS BY END USE
      28. \r\n
      29. \r\n
      30. UK MARKET ANALYSIS BY REGIONAL
      31. \r\n
      32. \r\n
      33. FRANCE MARKET ANALYSIS BY PRODUCT TYPE
      34. \r\n
      35. \r\n
      36. FRANCE MARKET ANALYSIS BY TECHNOLOGY
      37. \r\n
      38. \r\n
      39. FRANCE MARKET ANALYSIS BY APPLICATION
      40. \r\n
      41. \r\n
      42. FRANCE MARKET ANALYSIS BY END USE
      43. \r\n
      44. \r\n
      45. FRANCE MARKET ANALYSIS BY REGIONAL
      46. \r\n
      47. \r\n
      48. RUSSIA MARKET ANALYSIS BY PRODUCT TYPE
      49. \r\n
      50. \r\n
      51. RUSSIA MARKET ANALYSIS BY TECHNOLOGY
      52. \r\n
      53. \r\n
      54. RUSSIA MARKET ANALYSIS BY APPLICATION
      55. \r\n
      56. \r\n
      57. RUSSIA MARKET ANALYSIS BY END USE
      58. \r\n
      59. \r\n
      60. RUSSIA MARKET ANALYSIS BY REGIONAL
      61. \r\n
      62. \r\n
      63. ITALY MARKET ANALYSIS BY PRODUCT TYPE
      64. \r\n
      65. \r\n
      66. ITALY MARKET ANALYSIS BY TECHNOLOGY
      67. \r\n
      68. \r\n
      69. ITALY MARKET ANALYSIS BY APPLICATION
      70. \r\n
      71. \r\n
      72. ITALY MARKET ANALYSIS BY END USE
      73. \r\n
      74. \r\n
      75. ITALY MARKET ANALYSIS BY REGIONAL
      76. \r\n
      77. \r\n
      78. SPAIN MARKET ANALYSIS BY PRODUCT TYPE
      79. \r\n
      80. \r\n
      81. SPAIN MARKET ANALYSIS BY TECHNOLOGY
      82. \r\n
      83. \r\n
      84. SPAIN MARKET ANALYSIS BY APPLICATION
      85. \r\n
      86. \r\n
      87. SPAIN MARKET ANALYSIS BY END USE
      88. \r\n
      89. \r\n
      90. SPAIN MARKET ANALYSIS BY REGIONAL
      91. \r\n
      92. \r\n
      93. REST OF EUROPE MARKET ANALYSIS BY PRODUCT TYPE
      94. \r\n
      95. \r\n
      96. REST OF EUROPE MARKET ANALYSIS BY TECHNOLOGY
      97. \r\n
      98. \r\n
      99. REST OF EUROPE MARKET ANALYSIS BY APPLICATION
      100. \r\n
      101. \r\n
      102. REST OF EUROPE MARKET ANALYSIS BY END USE
      103. \r\n
      104. \r\n
      105. REST OF EUROPE MARKET ANALYSIS BY REGIONAL
      106. \r\n
      107. \r\n
    155. APAC MARKET ANALYSIS
      1. \r\n
      2. \r\n
      3. CHINA MARKET ANALYSIS BY PRODUCT TYPE
      4. \r\n
      5. \r\n
      6. CHINA MARKET ANALYSIS BY TECHNOLOGY
      7. \r\n
      8. \r\n
      9. CHINA MARKET ANALYSIS BY APPLICATION
      10. \r\n
      11. \r\n
      12. CHINA MARKET ANALYSIS BY END USE
      13. \r\n
      14. \r\n
      15. CHINA MARKET ANALYSIS BY REGIONAL
      16. \r\n
      17. \r\n
      18. INDIA MARKET ANALYSIS BY PRODUCT TYPE
      19. \r\n
      20. \r\n
      21. INDIA MARKET ANALYSIS BY TECHNOLOGY
      22. \r\n
      23. \r\n
      24. INDIA MARKET ANALYSIS BY APPLICATION
      25. \r\n
      26. \r\n
      27. INDIA MARKET ANALYSIS BY END USE
      28. \r\n
      29. \r\n
      30. INDIA MARKET ANALYSIS BY REGIONAL
      31. \r\n
      32. \r\n
      33. JAPAN MARKET ANALYSIS BY PRODUCT TYPE
      34. \r\n
      35. \r\n
      36. JAPAN MARKET ANALYSIS BY TECHNOLOGY
      37. \r\n
      38. \r\n
      39. JAPAN MARKET ANALYSIS BY APPLICATION
      40. \r\n
      41. \r\n
      42. JAPAN MARKET ANALYSIS BY END USE
      43. \r\n
      44. \r\n
      45. JAPAN MARKET ANALYSIS BY REGIONAL
      46. \r\n
      47. \r\n
      48. SOUTH KOREA MARKET ANALYSIS BY PRODUCT TYPE
      49. \r\n
      50. \r\n
      51. SOUTH KOREA MARKET ANALYSIS BY TECHNOLOGY
      52. \r\n
      53. \r\n
      54. SOUTH KOREA MARKET ANALYSIS BY APPLICATION
      55. \r\n
      56. \r\n
      57. SOUTH KOREA MARKET ANALYSIS BY END USE
      58. \r\n
      59. \r\n
      60. SOUTH KOREA MARKET ANALYSIS BY REGIONAL
      61. \r\n
      62. \r\n
      63. MALAYSIA MARKET ANALYSIS BY PRODUCT TYPE
      64. \r\n
      65. \r\n
      66. MALAYSIA MARKET ANALYSIS BY TECHNOLOGY
      67. \r\n
      68. \r\n
      69. MALAYSIA MARKET ANALYSIS BY APPLICATION
      70. \r\n
      71. \r\n
      72. MALAYSIA MARKET ANALYSIS BY END USE
      73. \r\n
      74. \r\n
      75. MALAYSIA MARKET ANALYSIS BY REGIONAL
      76. \r\n
      77. \r\n
      78. THAILAND MARKET ANALYSIS BY PRODUCT TYPE
      79. \r\n
      80. \r\n
      81. THAILAND MARKET ANALYSIS BY TECHNOLOGY
      82. \r\n
      83. \r\n
      84. THAILAND MARKET ANALYSIS BY APPLICATION
      85. \r\n
      86. \r\n
      87. THAILAND MARKET ANALYSIS BY END USE
      88. \r\n
      89. \r\n
      90. THAILAND MARKET ANALYSIS BY REGIONAL
      91. \r\n
      92. \r\n
      93. INDONESIA MARKET ANALYSIS BY PRODUCT TYPE
      94. \r\n
      95. \r\n
      96. INDONESIA MARKET ANALYSIS BY TECHNOLOGY
      97. \r\n
      98. \r\n
      99. INDONESIA MARKET ANALYSIS BY APPLICATION
      100. \r\n
      101. \r\n
      102. INDONESIA MARKET ANALYSIS BY END USE
      103. \r\n
      104. \r\n
      105. INDONESIA MARKET ANALYSIS BY REGIONAL
      106. \r\n
      107. \r\n
      108. REST OF APAC MARKET ANALYSIS BY PRODUCT TYPE
      109. \r\n
      110. \r\n
      111. REST OF APAC MARKET ANALYSIS BY TECHNOLOGY
      112. \r\n
      113. \r\n
      114. REST OF APAC MARKET ANALYSIS BY APPLICATION
      115. \r\n
      116. \r\n
      117. REST OF APAC MARKET ANALYSIS BY END USE
      118. \r\n
      119. \r\n
      120. REST OF APAC MARKET ANALYSIS BY REGIONAL
      121. \r\n
      122. \r\n
    156. SOUTH AMERICA MARKET ANALYSIS
      1. \r\n
      2. \r\n
      3. BRAZIL MARKET ANALYSIS BY PRODUCT TYPE
      4. \r\n
      5. \r\n
      6. BRAZIL MARKET ANALYSIS BY TECHNOLOGY
      7. \r\n
      8. \r\n
      9. BRAZIL MARKET ANALYSIS BY APPLICATION
      10. \r\n
      11. \r\n
      12. BRAZIL MARKET ANALYSIS BY END USE
      13. \r\n
      14. \r\n
      15. BRAZIL MARKET ANALYSIS BY REGIONAL
      16. \r\n
      17. \r\n
      18. MEXICO MARKET ANALYSIS BY PRODUCT TYPE
      19. \r\n
      20. \r\n
      21. MEXICO MARKET ANALYSIS BY TECHNOLOGY
      22. \r\n
      23. \r\n
      24. MEXICO MARKET ANALYSIS BY APPLICATION
      25. \r\n
      26. \r\n
      27. MEXICO MARKET ANALYSIS BY END USE
      28. \r\n
      29. \r\n
      30. MEXICO MARKET ANALYSIS BY REGIONAL
      31. \r\n
      32. \r\n
      33. ARGENTINA MARKET ANALYSIS BY PRODUCT TYPE
      34. \r\n
      35. \r\n
      36. ARGENTINA MARKET ANALYSIS BY TECHNOLOGY
      37. \r\n
      38. \r\n
      39. ARGENTINA MARKET ANALYSIS BY APPLICATION
      40. \r\n
      41. \r\n
      42. ARGENTINA MARKET ANALYSIS BY END USE
      43. \r\n
      44. \r\n
      45. ARGENTINA MARKET ANALYSIS BY REGIONAL
      46. \r\n
      47. \r\n
      48. REST OF SOUTH AMERICA MARKET ANALYSIS BY PRODUCT TYPE
      49. \r\n
      50. \r\n
      51. REST OF SOUTH AMERICA MARKET ANALYSIS BY TECHNOLOGY
      52. \r\n
      53. \r\n
      54. REST OF SOUTH AMERICA MARKET ANALYSIS BY APPLICATION
      55. \r\n
      56. \r\n
      57. REST OF SOUTH AMERICA MARKET ANALYSIS BY END USE
      58. \r\n
      59. \r\n
      60. REST OF SOUTH AMERICA MARKET ANALYSIS BY REGIONAL
      61. \r\n
      62. \r\n
    157. MEA MARKET ANALYSIS
      1. \r\n
      2. \r\n
      3. GCC COUNTRIES MARKET ANALYSIS BY PRODUCT TYPE
      4. \r\n
      5. \r\n
      6. GCC COUNTRIES MARKET ANALYSIS BY TECHNOLOGY
      7. \r\n
      8. \r\n
      9. GCC COUNTRIES MARKET ANALYSIS BY APPLICATION
      10. \r\n
      11. \r\n
      12. GCC COUNTRIES MARKET ANALYSIS BY END USE
      13. \r\n
      14. \r\n
      15. GCC COUNTRIES MARKET ANALYSIS BY REGIONAL
      16. \r\n
      17. \r\n
      18. SOUTH AFRICA MARKET ANALYSIS BY PRODUCT TYPE
      19. \r\n
      20. \r\n
      21. SOUTH AFRICA MARKET ANALYSIS BY TECHNOLOGY
      22. \r\n
      23. \r\n
      24. SOUTH AFRICA MARKET ANALYSIS BY APPLICATION
      25. \r\n
      26. \r\n
      27. SOUTH AFRICA MARKET ANALYSIS BY END USE
      28. \r\n
      29. \r\n
      30. SOUTH AFRICA MARKET ANALYSIS BY REGIONAL
      31. \r\n
      32. \r\n
      33. REST OF MEA MARKET ANALYSIS BY PRODUCT TYPE
      34. \r\n
      35. \r\n
      36. REST OF MEA MARKET ANALYSIS BY TECHNOLOGY
      37. \r\n
      38. \r\n
      39. REST OF MEA MARKET ANALYSIS BY APPLICATION
      40. \r\n
      41. \r\n
      42. REST OF MEA MARKET ANALYSIS BY END USE
      43. \r\n
      44. \r\n
      45. REST OF MEA MARKET ANALYSIS BY REGIONAL
      46. \r\n
      47. \r\n
    158. KEY BUYING CRITERIA OF SMART HOME MARKET
      1. \r\n
      2. \r\n
      3. RESEARCH PROCESS OF MRFR
      4. \r\n
      5. \r\n
    159. DRO ANALYSIS OF SMART HOME MARKET
      1. \r\n
      2. \r\n
      3. DRIVERS IMPACT ANALYSIS: SMART HOME MARKET
      4. \r\n
      5. \r\n
      6. RESTRAINTS IMPACT ANALYSIS: SMART HOME MARKET
      7. \r\n
      8. \r\n
      9. SUPPLY / VALUE CHAIN: SMART HOME MARKET
      10. \r\n
      11. \r\n
    160. SMART HOME MARKET, BY PRODUCT TYPE, 2025 (% SHARE)
      1. \r\n
      2. \r\n
    161. SMART HOME MARKET, BY PRODUCT TYPE, 2019 TO 2035 (USD Billions)
      1. \r\n
      2. \r\n
    162. SMART HOME MARKET, BY TECHNOLOGY, 2025 (% SHARE)
      1. \r\n
      2. \r\n
    163. SMART HOME MARKET, BY TECHNOLOGY, 2019 TO 2035 (USD Billions)
      1. \r\n
      2. \r\n
    164. SMART HOME MARKET, BY APPLICATION, 2025 (% SHARE)
      1. \r\n
      2. \r\n
    165. SMART HOME MARKET, BY APPLICATION, 2019 TO 2035 (USD Billions)
      1. \r\n
      2. \r\n
    166. SMART HOME MARKET, BY END USE, 2025 (% SHARE)
      1. \r\n
      2. \r\n
    167. SMART HOME MARKET, BY END USE, 2019 TO 2035 (USD Billions)
      1. \r\n
      2. \r\n
    168. SMART HOME MARKET, BY REGIONAL, 2025 (% SHARE)
      1. \r\n
      2. \r\n
    169. SMART HOME MARKET, BY REGIONAL, 2019 TO 2035 (USD Billions)
      1. \r\n
      2. \r\n
      3. BENCHMARKING OF MAJOR COMPETITORS
      4. \r\n\r\n
      5. "

    Smart Home Market Segmentation

    Smart Home Market By Product Type (USD Billion, 2019-2035)

    Smart Lighting

    Smart Security Systems

    Smart Thermostats

    Smart Home Appliances

    Smart Entertainment Systems


    Smart Home Market By Technology (USD Billion, 2019-2035)

    Wi-Fi

    Zigbee

    Bluetooth

    Thread

    Z-Wave


    Smart Home Market By Application (USD Billion, 2019-2035)

    Home Automation

    Energy Management

    Security Surveillance

    Health Monitoring

    Entertainment Control


    Smart Home Market By End Use (USD Billion, 2019-2035)

    Residential

    Commercial

    Industrial


    Smart Home Market By Regional (USD Billion, 2019-2035)

    North America

    Europe

    South America

    Asia Pacific

    Middle East and Africa


    Smart Home Market Regional Outlook (USD Billion, 2019-2035)


    North America Outlook (USD Billion, 2019-2035)

    North America Market by Product Type

    Smart Lighting

    Smart Security Systems

    Smart Thermostats

    Appliances

    Smart Entertainment Systems

    North America Market by Technology Type

    Wi-Fi

    Zigbee

    Bluetooth

    Thread

    Z-Wave

    North America Market by Application Type

    Home Automation

    Energy Management

    Security Surveillance

    Health Monitoring

    Entertainment Control

    North America Market by End Use Type

    Residential

    Commercial

    Industrial

    North America Market by Regional Type

    US

    Canada

    US Outlook (USD Billion, 2019-2035)

    US Market by Product Type

    Smart Lighting

    Smart Security Systems

    Smart Thermostats

    Appliances

    Smart Entertainment Systems

    US Market by Technology Type

    Wi-Fi

    Zigbee

    Bluetooth

    Thread

    Z-Wave

    US Market by Application Type

    Home Automation

    Energy Management

    Security Surveillance

    Health Monitoring

    Entertainment Control

    US Market by End Use Type

    Residential

    Commercial

    Industrial

    CANADA Outlook (USD Billion, 2019-2035)

    CANADA Market by Product Type

    Smart Lighting

    Smart Security Systems

    Smart Thermostats

    Appliances

    Smart Entertainment Systems

    CANADA Market by Technology Type

    Wi-Fi

    Zigbee

    Bluetooth

    Thread

    Z-Wave

    CANADA Market by Application Type

    Home Automation

    Energy Management

    Security Surveillance

    Health Monitoring

    Entertainment Control

    CANADA Market by End Use Type

    Residential

    Commercial

    Industrial

    Europe Outlook (USD Billion, 2019-2035)

    Europe Market by Product Type

    Smart Lighting

    Smart Security Systems

    Smart Thermostats

    Appliances

    Smart Entertainment Systems

    Europe Market by Technology Type

    Wi-Fi

    Zigbee

    Bluetooth

    Thread

    Z-Wave

    Europe Market by Application Type

    Home Automation

    Energy Management

    Security Surveillance

    Health Monitoring

    Entertainment Control

    Europe Market by End Use Type

    Residential

    Commercial

    Industrial

    Europe Market by Regional Type

    Germany

    UK

    France

    Russia

    Italy

    Spain

    Rest of Europe

    GERMANY Outlook (USD Billion, 2019-2035)

    GERMANY Market by Product Type

    Smart Lighting

    Smart Security Systems

    Smart Thermostats

    Appliances

    Smart Entertainment Systems

    GERMANY Market by Technology Type

    Wi-Fi

    Zigbee

    Bluetooth

    Thread

    Z-Wave

    GERMANY Market by Application Type

    Home Automation

    Energy Management

    Security Surveillance

    Health Monitoring

    Entertainment Control

    GERMANY Market by End Use Type

    Residential

    Commercial

    Industrial

    UK Outlook (USD Billion, 2019-2035)

    UK Market by Product Type

    Smart Lighting

    Smart Security Systems

    Smart Thermostats

    Appliances

    Smart Entertainment Systems

    UK Market by Technology Type

    Wi-Fi

    Zigbee

    Bluetooth

    Thread

    Z-Wave

    UK Market by Application Type

    Home Automation

    Energy Management

    Security Surveillance

    Health Monitoring

    Entertainment Control

    UK Market by End Use Type

    Residential

    Commercial

    Industrial

    FRANCE Outlook (USD Billion, 2019-2035)

    FRANCE Market by Product Type

    Smart Lighting

    Smart Security Systems

    Smart Thermostats

    Appliances

    Smart Entertainment Systems

    FRANCE Market by Technology Type

    Wi-Fi

    Zigbee

    Bluetooth

    Thread

    Z-Wave

    FRANCE Market by Application Type

    Home Automation

    Energy Management

    Security Surveillance

    Health Monitoring

    Entertainment Control

    FRANCE Market by End Use Type

    Residential

    Commercial

    Industrial

    RUSSIA Outlook (USD Billion, 2019-2035)

    RUSSIA Market by Product Type

    Smart Lighting

    Smart Security Systems

    Smart Thermostats

    Appliances

    Smart Entertainment Systems

    RUSSIA Market by Technology Type

    Wi-Fi

    Zigbee

    Bluetooth

    Thread

    Z-Wave

    RUSSIA Market by Application Type

    Home Automation

    Energy Management

    Security Surveillance

    Health Monitoring

    Entertainment Control

    RUSSIA Market by End Use Type

    Residential

    Commercial

    Industrial

    ITALY Outlook (USD Billion, 2019-2035)

    ITALY Market by Product Type

    Smart Lighting

    Smart Security Systems

    Smart Thermostats

    Appliances

    Smart Entertainment Systems

    ITALY Market by Technology Type

    Wi-Fi

    Zigbee

    Bluetooth

    Thread

    Z-Wave

    ITALY Market by Application Type

    Home Automation

    Energy Management

    Security Surveillance

    Health Monitoring

    Entertainment Control

    ITALY Market by End Use Type

    Residential

    Commercial

    Industrial

    SPAIN Outlook (USD Billion, 2019-2035)

    SPAIN Market by Product Type

    Smart Lighting

    Smart Security Systems

    Smart Thermostats

    Appliances

    Smart Entertainment Systems

    SPAIN Market by Technology Type

    Wi-Fi

    Zigbee

    Bluetooth

    Thread

    Z-Wave

    SPAIN Market by Application Type

    Home Automation

    Energy Management

    Security Surveillance

    Health Monitoring

    Entertainment Control

    SPAIN Market by End Use Type

    Residential

    Commercial

    Industrial

    REST OF EUROPE Outlook (USD Billion, 2019-2035)

    REST OF EUROPE Market by Product Type

    Smart Lighting

    Smart Security Systems

    Smart Thermostats

    Appliances

    Smart Entertainment Systems

    REST OF EUROPE Market by Technology Type

    Wi-Fi

    Zigbee

    Bluetooth

    Thread

    Z-Wave

    REST OF EUROPE Market by Application Type

    Home Automation

    Energy Management

    Security Surveillance

    Health Monitoring

    Entertainment Control

    REST OF EUROPE Market by End Use Type

    Residential

    Commercial

    Industrial

    APAC Outlook (USD Billion, 2019-2035)

    APAC Market by Product Type

    Smart Lighting

    Smart Security Systems

    Smart Thermostats

    Appliances

    Smart Entertainment Systems

    APAC Market by Technology Type

    Wi-Fi

    Zigbee

    Bluetooth

    Thread

    Z-Wave

    APAC Market by Application Type

    Home Automation

    Energy Management

    Security Surveillance

    Health Monitoring

    Entertainment Control

    APAC Market by End Use Type

    Residential

    Commercial

    Industrial

    APAC Market by Regional Type

    China

    India

    Japan

    South Korea

    Malaysia

    Thailand

    Indonesia

    Rest of APAC

    CHINA Outlook (USD Billion, 2019-2035)

    CHINA Market by Product Type

    Smart Lighting

    Smart Security Systems

    Smart Thermostats

    Appliances

    Smart Entertainment Systems

    CHINA Market by Technology Type

    Wi-Fi

    Zigbee

    Bluetooth

    Thread

    Z-Wave

    CHINA Market by Application Type

    Home Automation

    Energy Management

    Security Surveillance

    Health Monitoring

    Entertainment Control

    CHINA Market by End Use Type

    Residential

    Commercial

    Industrial

    INDIA Outlook (USD Billion, 2019-2035)

    INDIA Market by Product Type

    Smart Lighting

    Smart Security Systems

    Smart Thermostats

    Appliances

    Smart Entertainment Systems

    INDIA Market by Technology Type

    Wi-Fi

    Zigbee

    Bluetooth

    Thread

    Z-Wave

    INDIA Market by Application Type

    Home Automation

    Energy Management

    Security Surveillance

    Health Monitoring

    Entertainment Control

    INDIA Market by End Use Type

    Residential

    Commercial

    Industrial

    JAPAN Outlook (USD Billion, 2019-2035)

    JAPAN Market by Product Type

    Smart Lighting

    Smart Security Systems

    Smart Thermostats

    Appliances

    Smart Entertainment Systems

    JAPAN Market by Technology Type

    Wi-Fi

    Zigbee

    Bluetooth

    Thread

    Z-Wave

    JAPAN Market by Application Type

    Home Automation

    Energy Management

    Security Surveillance

    Health Monitoring

    Entertainment Control

    JAPAN Market by End Use Type

    Residential

    Commercial

    Industrial

    SOUTH KOREA Outlook (USD Billion, 2019-2035)

    SOUTH KOREA Market by Product Type

    Smart Lighting

    Smart Security Systems

    Smart Thermostats

    Appliances

    Smart Entertainment Systems

    SOUTH KOREA Market by Technology Type

    Wi-Fi

    Zigbee

    Bluetooth

    Thread

    Z-Wave

    SOUTH KOREA Market by Application Type

    Home Automation

    Energy Management

    Security Surveillance

    Health Monitoring

    Entertainment Control

    SOUTH KOREA Market by End Use Type

    Residential

    Commercial

    Industrial

    MALAYSIA Outlook (USD Billion, 2019-2035)

    MALAYSIA Market by Product Type

    Smart Lighting

    Smart Security Systems

    Smart Thermostats

    Appliances

    Smart Entertainment Systems

    MALAYSIA Market by Technology Type

    Wi-Fi

    Zigbee

    Bluetooth

    Thread

    Z-Wave

    MALAYSIA Market by Application Type

    Home Automation

    Energy Management

    Security Surveillance

    Health Monitoring

    Entertainment Control

    MALAYSIA Market by End Use Type

    Residential

    Commercial

    Industrial

    THAILAND Outlook (USD Billion, 2019-2035)

    THAILAND Market by Product Type

    Smart Lighting

    Smart Security Systems

    Smart Thermostats

    Appliances

    Smart Entertainment Systems

    THAILAND Market by Technology Type

    Wi-Fi

    Zigbee

    Bluetooth

    Thread

    Z-Wave

    THAILAND Market by Application Type

    Home Automation

    Energy Management

    Security Surveillance

    Health Monitoring

    Entertainment Control

    THAILAND Market by End Use Type

    Residential

    Commercial

    Industrial

    INDONESIA Outlook (USD Billion, 2019-2035)

    INDONESIA Market by Product Type

    Smart Lighting

    Smart Security Systems

    Smart Thermostats

    Appliances

    Smart Entertainment Systems

    INDONESIA Market by Technology Type

    Wi-Fi

    Zigbee

    Bluetooth

    Thread

    Z-Wave

    INDONESIA Market by Application Type

    Home Automation

    Energy Management

    Security Surveillance

    Health Monitoring

    Entertainment Control

    INDONESIA Market by End Use Type

    Residential

    Commercial

    Industrial

    REST OF APAC Outlook (USD Billion, 2019-2035)

    REST OF APAC Market by Product Type

    Smart Lighting

    Smart Security Systems

    Smart Thermostats

    Appliances

    Smart Entertainment Systems

    REST OF APAC Market by Technology Type

    Wi-Fi

    Zigbee

    Bluetooth

    Thread

    Z-Wave

    REST OF APAC Market by Application Type

    Home Automation

    Energy Management

    Security Surveillance

    Health Monitoring

    Entertainment Control

    REST OF APAC Market by End Use Type

    Residential

    Commercial

    Industrial

    South America Outlook (USD Billion, 2019-2035)

    South America Market by Product Type

    Smart Lighting

    Smart Security Systems

    Smart Thermostats

    Appliances

    Smart Entertainment Systems

    South America Market by Technology Type

    Wi-Fi

    Zigbee

    Bluetooth

    Thread

    Z-Wave

    South America Market by Application Type

    Home Automation

    Energy Management

    Security Surveillance

    Health Monitoring

    Entertainment Control

    South America Market by End Use Type

    Residential

    Commercial

    Industrial

    South America Market by Regional Type

    Brazil

    Mexico

    Argentina

    Rest of South America

    BRAZIL Outlook (USD Billion, 2019-2035)

    BRAZIL Market by Product Type

    Smart Lighting

    Smart Security Systems

    Smart Thermostats

    Appliances

    Smart Entertainment Systems

    BRAZIL Market by Technology Type

    Wi-Fi

    Zigbee

    Bluetooth

    Thread

    Z-Wave

    BRAZIL Market by Application Type

    Home Automation

    Energy Management

    Security Surveillance

    Health Monitoring

    Entertainment Control

    BRAZIL Market by End Use Type

    Residential

    Commercial

    Industrial

    MEXICO Outlook (USD Billion, 2019-2035)

    MEXICO Market by Product Type

    Smart Lighting

    Smart Security Systems

    Smart Thermostats

    Appliances

    Smart Entertainment Systems

    MEXICO Market by Technology Type

    Wi-Fi

    Zigbee

    Bluetooth

    Thread

    Z-Wave

    MEXICO Market by Application Type

    Home Automation

    Energy Management

    Security Surveillance

    Health Monitoring

    Entertainment Control

    MEXICO Market by End Use Type

    Residential

    Commercial

    Industrial

    ARGENTINA Outlook (USD Billion, 2019-2035)

    ARGENTINA Market by Product Type

    Smart Lighting

    Smart Security Systems

    Smart Thermostats

    Appliances

    Smart Entertainment Systems

    ARGENTINA Market by Technology Type

    Wi-Fi

    Zigbee

    Bluetooth

    Thread

    Z-Wave

    ARGENTINA Market by Application Type

    Home Automation

    Energy Management

    Security Surveillance

    Health Monitoring

    Entertainment Control

    ARGENTINA Market by End Use Type

    Residential

    Commercial

    Industrial

    REST OF SOUTH AMERICA Outlook (USD Billion, 2019-2035)

    REST OF SOUTH AMERICA Market by Product Type

    Smart Lighting

    Smart Security Systems

    Smart Thermostats

    Appliances

    Smart Entertainment Systems

    REST OF SOUTH AMERICA Market by Technology Type

    Wi-Fi

    Zigbee

    Bluetooth

    Thread

    Z-Wave

    REST OF SOUTH AMERICA Market by Application Type

    Home Automation

    Energy Management

    Security Surveillance

    Health Monitoring

    Entertainment Control

    REST OF SOUTH AMERICA Market by End Use Type

    Residential

    Commercial

    Industrial

    MEA Outlook (USD Billion, 2019-2035)

    MEA Market by Product Type

    Smart Lighting

    Smart Security Systems

    Smart Thermostats

    Appliances

    Smart Entertainment Systems

    MEA Market by Technology Type

    Wi-Fi

    Zigbee

    Bluetooth

    Thread

    Z-Wave

    MEA Market by Application Type

    Home Automation

    Energy Management

    Security Surveillance

    Health Monitoring

    Entertainment Control

    MEA Market by End Use Type

    Residential

    Commercial

    Industrial

    MEA Market by Regional Type

    GCC Countries

    South Africa

    Rest of MEA

    GCC COUNTRIES Outlook (USD Billion, 2019-2035)

    GCC COUNTRIES Market by Product Type

    Smart Lighting

    Smart Security Systems

    Smart Thermostats

    Appliances

    Smart Entertainment Systems

    GCC COUNTRIES Market by Technology Type

    Wi-Fi

    Zigbee

    Bluetooth

    Thread

    Z-Wave

    GCC COUNTRIES Market by Application Type

    Home Automation

    Energy Management

    Security Surveillance

    Health Monitoring

    Entertainment Control

    GCC COUNTRIES Market by End Use Type

    Residential

    Commercial

    Industrial

    SOUTH AFRICA Outlook (USD Billion, 2019-2035)

    SOUTH AFRICA Market by Product Type

    Smart Lighting

    Smart Security Systems

    Smart Thermostats

    Appliances

    Smart Entertainment Systems

    SOUTH AFRICA Market by Technology Type

    Wi-Fi

    Zigbee

    Bluetooth

    Thread

    Z-Wave

    SOUTH AFRICA Market by Application Type

    Home Automation

    Energy Management

    Security Surveillance

    Health Monitoring

    Entertainment Control

    SOUTH AFRICA Market by End Use Type

    Residential

    Commercial

    Industrial

    REST OF MEA Outlook (USD Billion, 2019-2035)

    REST OF MEA Market by Product Type

    Smart Lighting

    Smart Security Systems

    Smart Thermostats

    Appliances

    Smart Entertainment Systems

    REST OF MEA Market by Technology Type

    Wi-Fi

    Zigbee

    Bluetooth

    Thread

    Z-Wave

    REST OF MEA Market by Application Type

    Home Automation

    Energy Management

    Security Surveillance

    Health Monitoring

    Entertainment Control

    REST OF MEA Market by End Use Type

    Residential

    Commercial

    Industrial


    Infographic

    Free Sample Request

    Kindly complete the form below to receive a free sample of this Report

    Get Free Sample

    Customer Strories

    “I am very pleased with how market segments have been defined in a relevant way for my purposes (such as "Portable Freezers & refrigerators" and "last-mile"). In general the report is well structured. Thanks very much for your efforts.”

    Victoria Milne

    Founder
    Case Study
    Chemicals and Materials

    Compare Licence

    ×
    Features License Type
    Single User Multiuser License Enterprise User
    Price $4,950 $5,950 $7,250
    Maximum User Access Limit 1 User Upto 10 Users Unrestricted Access Throughout the Organization
    Free Customization
    Direct Access to Analyst
    Deliverable Format
    Platform Access
    Discount on Next Purchase 10% 15% 15%
    Printable Versions